Laboratory investigation of the spatial thermodynamic properties of the bridge approach in the permafrost region
 Qixiang Yin
 Junjie Wu2
 - 1School of Architecture and Construction, Jiangsu Vocational Institute of Architectural Technology, Xuzhou, China
- 2School of Mechanics and Civil Engineering, China University of Mining and Technology, Xuzhou, China
- 3School of Civil Engineering, Henan Polytechnic University, Jiaozuo, China
As the highest altitude and the longest plateau railway line, the Qinghai–Tibet railway passes through a large area of continuous permafrost. As the key position of the combination of roadbed and bridge, the stability and strength of the bridge approach directly affect the smoothness of the whole line. Through an indoor model test, the distribution pattern of space temperature field and the change law of temperature measuring points in the bridge approach of gravel sandwich are studied. With the increase in the depth from the subgrade surface, the influence of the temperature change in the upper atmosphere decreases gradually at the 2.5-m platform back of the subgrade center section, resulting in an obvious lag in the subgrade. By comparing the temperature measurement data of different bridge approaches of the gravel interlayer road bridge and the bridge approach of the U-shaped block gravel road bridge, it is shown that the U-shaped structure not only has a better overall cooling effect, but also the cooling effect gradually increases with the increase in the distance from the abutment back. The influence range of the road–bridge transition section on the spatial temperature field is approximately 14 m in the back of the abutment, and the influence range at 7.5 m is the most severe. The research results have important practical significance and engineering application value for the operation and maintenance of the Qinghai–Tibet railway.
1 Introduction
Frozen soil usually refers to a layer that consists of all types of rock and soil bound together by ice and has a temperature at or below 0°C (Xu et al., 2001). Frozen soil can be divided into permafrost, seasonal frozen soil, and perennial frozen soil, according to different freezing duration. Instantaneous frozen soil refers to the frozen soil that lasts only a few hours to several days in winter, and its freezing depth is several centimeters to several millimeters. Seasonal frozen soil usually refers to the frozen soil at a certain depth under the surface affected by seasonal changes and periodic freeze–thaw cycles of soil. Permafrost refers to any ground that is completely frozen for 2 years, and only a certain depth under the surface is affected by seasonal freeze–thaw cycles. China’s permafrost regions are mostly distributed in the Greater Khingan Mountains and the Qinghai–Tibet Plateau, accounting for 22.3% of the land area. The Qinghai–Tibet Plateau is a vast area with low annual average temperature due to the influence of latitude and altitude. It is the highest and largest plateau permafrost region in the world (Zhou and Guo, 2000). As the connecting section of roadbed and bridge, the thermal stability of the bridge approach in the permafrost region affects the safety and stability of the whole line (Jensen and Traeger, 2014; Glenis et al., 2015; Haeberli et al., 2017; Hu et al., 2017; Haasnoot et al., 2018). The temperature field in the frozen soil region is the focus of current research (Mu, 2012; Li et al., 2015; Liu et al., 2017; Liu et al., 2019; Luo et al., 2019; Mao et al., 2019). The direct manifestation of the disease in the bridge approach is the problem of bump at bridgehead. In order to reduce the impact of bridgehead bump on transportation, it is necessary to continuously deal with the subsidence and other problems in the bridgehead bump area in time, which not only costs a lot of manpower, material, and financial resources but also causes other problems at the bridgehead after the repair treatment is completed.
At present, targeted research has been carried out on the subgrade of high-speed railway in cold regions and the subgrade of bridge approach (Shi et al., 2014; Niu et al., 2016; Cao, 2017; Tai et al., 2017; Li et al., 2018; Wu et al., 2022) (Eq. 7). Zhou et al. (2004) studied the pre-cooling subgrade through numerical analysis and concluded that the pre-cooling subgrade can effectively raise the upper limit of natural permafrost and weaken the formation of a melting disk. Wang and Wu (2017) combined the geological characteristics of the frozen soil area to comprehensively analyze the bridge approach. They found that the frozen soil continuously melted due to the hydrothermal erosion of the surface water and the groundwater in the upper thawed layer, and the settlement disease became more serious. Pan (2017) (Eqs 1–6) and Wu and Pan (2018) referred to the treatment method of the bridge approach in the general area, replaced the top of subgrade with a single-particle-size gravel layer, and analyzes the temperature field, water field, and displacement field of the new bridge approach through indoor comparative test and numerical simulation. Niu et al. (2011a) selected the bridge approach of 164 bridges from Xidatan to Chiqu Valley along the Qinghai–Tibet railway as the research sample. The investigation and analysis found that the total average settlement of the bridge approach was 7.0 cm, and the subgrade settlement was related to the bridge direction, subgrade height, frozen soil type and water content, ground temperature, geological conditions, and other factors. Lu (2016) analyzed the influence of groundwater on the differential settlement of the bridge approach and concluded that the ponding at the foot of the slope and the water under the layer have great influence on the settlement. Chen (2018) proposed a new improvement scheme based on the existing treatment measures, such as waterproof and drainage, ballast layer treatment, and other measures, and verified the feasibility and long-term effect of the improvement scheme by numerical simulation. Shen et al. (2018) and Zhang et al. (2016) tested the bridge approach of Ha-Qi and Ha-Da high railway lines and obtained the frost heave and settlement deformation characteristics of the bridge approach. Niu et al. (2011b) analyzed the settlement of the bridge approach of the Qinghai–Tibet railway and its influencing factors. Zhai and True (1999) showed that the longitudinal stiffness of the transition section will significantly affect the running quality of the train. Sun et al. (2013) used the finite element method to analyze the influence of different lengths of the bridge approach on the displacement and stress of the subgrade surface.
However, there are few studies investigating the spatial temperature field of a road–bridge transition section. In this experiment, the spatial temperature field distribution characteristics of different forms of the road–bridge transition section are studied using a model test design, and the spatial temperature field distribution and causes of the road–bridge transition section in the permafrost region are analyzed, which provides reference for the subsequent design and construction of the road–bridge transition section.
2 Model test prototype characteristics and similarity modeling
2.1 Structural characteristics of the test prototype
The site of the model test is located in the Chumar River Plain in China. The annual average temperature is −4°C, which is a permafrost development zone. The thickness of permafrost is approximately 40 m, and the ground temperature is maintained at 0.0°C to −1.0°C all the year round, which is a very unstable section of high-temperature permafrost.
The length of the transition section is 14 m, the inverted trapezoidal slope is 1: 2, the width of the top surface of the roadbed is 8.4 m, and the overall height of the roadbed is 6 m. Because the ground temperature of the natural frozen soil is greatly affected by construction, in order to minimize the influence of ground temperature, only simple treatment is carried out at the natural surface, and then the roadbed and transition section are constructed.
2.2 Analog modeling
Based on the similarity theory, the factors affecting the distribution of the temperature field in the transition section of road and bridge in permafrost regions are first determined, and the parameter modeling design is carried out through the criterion analysis (Jing et al., 2020; Wu et al., 2020). The main factors affecting the temperature field distribution of the bridge approach are geometric size
According to the similarity theory, the relationship between the temperature field of the bridge approach and its main influencing factors is as follows:
According to the dimensional analysis of the similarity theory, the similarity criterion of the temperature field of the road–bridge transition section in the permafrost region is
Therefore, the criterion equation can be expressed as
According to the above equations and criteria, the model test is designed. The proportional relationship and conversion coefficient between the physical quantities of the model test should be determined.
(1) Geometric scaling
According to the test accuracy requirements and test conditions, the test geometry scale is initially selected as
(2) Model test material selection
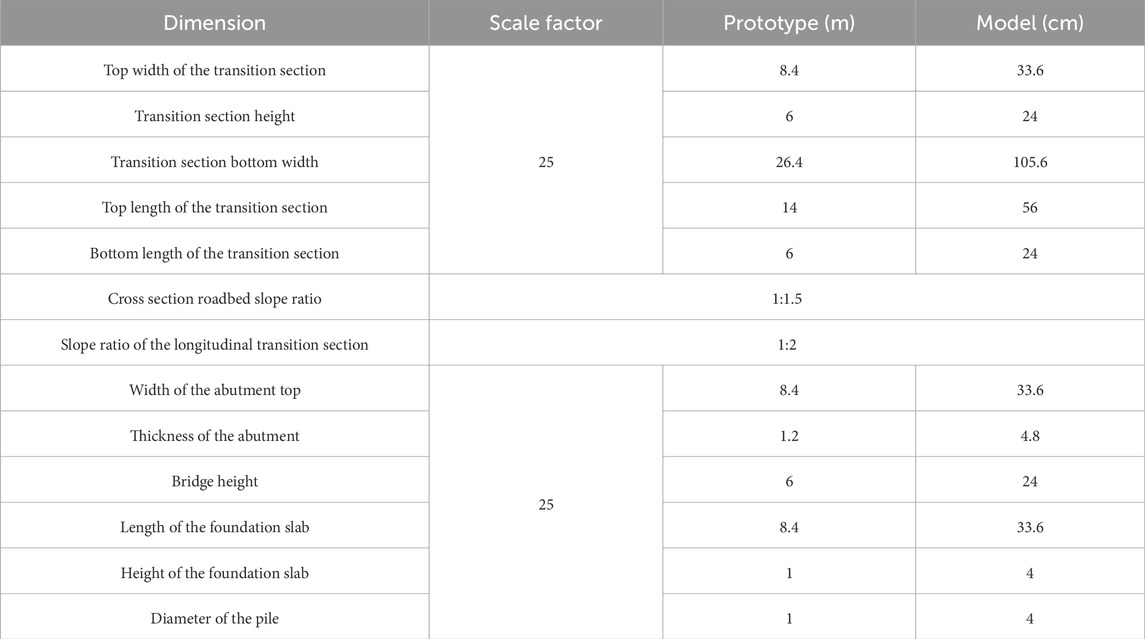
Table 1. Parameter design table of the model test.
The foundation soil and subgrade soil are remolded silty clay in Xuzhou, China. The transition section is filled with coarse-grained soil, and the abutment of the bridge transition section is prefabricated. Therefore, the similarity constant of
(3) Temperature scaling
According to the Kosovitch criterion,
where
Since the test material is soil, that is
(4) Time scaling
Fourier criterion can be expressed as
where
3 Model test design
3.1 Test bench design
The model test chamber is surrounded by the adiabatic boundary, and thermal insulation cotton with 5 cm thickness and special polyethylene adhesive as binder is used for thermal insulation treatment (Ma et al., 2022a; Ma et al., 2022b; Shi et al., 2023a; Shi et al., 2023b; Zheng et al., 2024). In order to alleviate the deformation caused by the lateral earth pressure inside the model test box, the model is processed by three layers of 1-cm-thick wooden template, 1-cm-thick wooden template, and Q235 steel from the inside to the outside. In order to ensure the external stiffness of the model box after filling, four steel sections are welded horizontally with the external wooden template. In order to ensure the external stiffness of the model box after filling, four sections of steel are welded horizontally with the external wood formwork. The internal size of the model box is 2,200 mm × 2000 mm × 600 mm. The model box is shown in Figure 1.
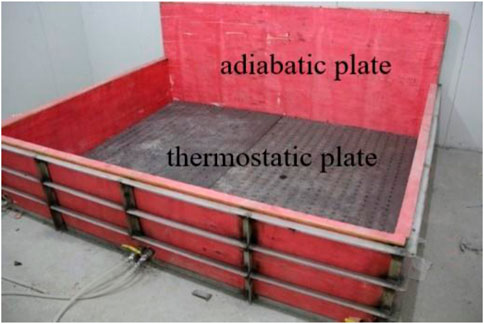
Figure 1. Model box physical diagram.
3.2 Temperature control system and refrigeration system
Refrigeration and temperature control equipment with a precision low-temperature thermostatic circulation tank is shown in Figure 2. This setup permits precise temperature control over the entire measuring range and maintains an optimum constant temperature with fluctuations of ±0.02°C using alcohol as an internal refrigerant. The bottom constant temperature plate adopts iron material, and there are upper and lower parts that consist of two whole plates. The refrigeration and constant temperature effects are achieved by a circulating cold liquid, as shown in Figure 3. The atmospheric temperature of the simulated model test in the walk-in refrigeration laboratory is shown in Figure 4. The internal refrigeration system and temperature control system of the walk-in refrigeration laboratory are integrated, and the system automatically controls the temperature. The low-temperature range is −20°C to 10°C, the temperature control deviation is ±0.5°C, and the temperature accuracy is 0.1°C.

Figure 2. Precision low-temperature thermostatic circulation tank.

Figure 3. Thermostatic plate.

Figure 4. Temperature control and refrigeration system.
3.3 Measurement system design
The spatial temperature field distribution of the bridge approach in the permafrost region is the focus of the current research. The temperature probe adopts the temperature sensor, and the data acquisition instrument adopts the multi-channel temperature data acquisition instrument developed by the State Key Laboratory of Deep Geotechnical Mechanics and Underground Engineering of China University of Mining and Technology, as shown in Figure 5. The diagram of the final test system is shown in Figure 6.
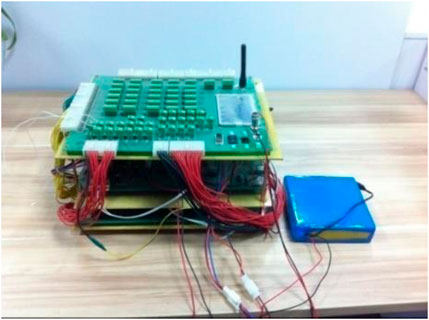
Figure 5. Data acquisition instrument physical map.

Figure 6. Diagram of the test system. (A) Gravel sandwich bridge approach. (B) U-shaped block gravel bridge approach.
4 Test steps and test plan
The physical and mechanical parameters such as soil particle gradation, maximum dry density, and liquid and plastic limits were measured before the model test. The soil used in the test is fine-grained soil, that is, soil particles with a particle size of less than 2 mm. The compaction test adopts the test method to simulate the compaction conditions of the construction site and the hammering method to increase the soil density, improve the strength, and reduce the settlement.
4.1 Procedure of the test
The test process is carried out through the preparation of the test soil, the prefabrication of the test abutment, the installation and test of the bottom constant temperature system, the embedding and positioning of the foundation sensor, the layered filling of the foundation soil and the embedding of the sensor, the positioning and installation of the abutment position, the laying of the gravel cushion of the road foundation, the layered filling of the roadbed soil and the embedding of the sensor, the filling of the roadbed soil, the installation of the bridge deck, the laying of the roadbed ballast and the fan, and the data acquisition, as shown in Figures 7–10.
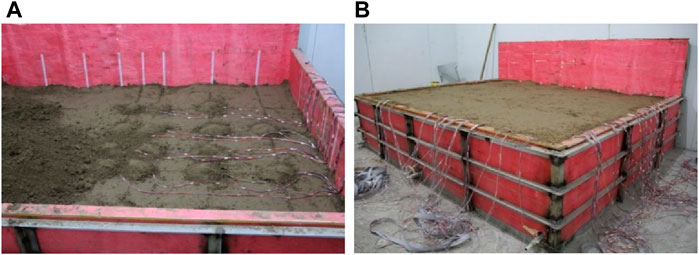
Figure 7. Filling foundation soil. (A) Sensor embedding. (B) Foundation soil filling completed.
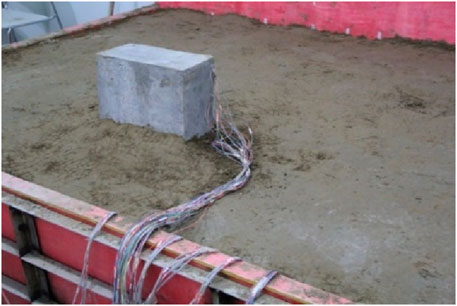
Figure 8. Abutment construction.
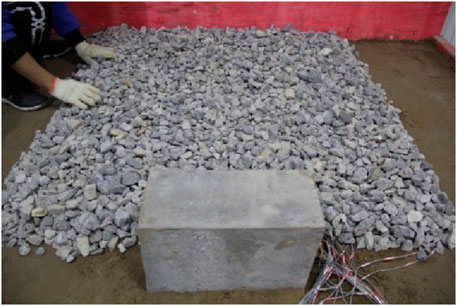
Figure 9. Laying roadbed gravel cushion

Figure 10. Laying roadbed gravel cushion. (A) Gravel sandwich bridge approach. (B) U-shaped block gravel bridge approach.
4.2 Test scheme
Taking into account the ground temperature of lower than 0°C of the permafrost area, the climatic characteristics of the Qingshuihe area along the Qinghai–Tibet railway, and the boundary layer temperature increment, the upper boundary air temperature adopts periodic temperature fluctuation function T:
where −4.0°C represents the average temperature and 841 min represents a cycle. The lower boundary is a constant temperature condition, the simulated permafrost ground temperature is −2.9°C, and the surrounding boundary is an adiabatic boundary.
5 Test result analysis
The gravel interlayer is a type of granular thermal insulation material used in civil engineering structure and has been applied in permafrost road engineering. Under the action of positive and negative temperatures, its thermal physical properties are not the same. Under the condition of positive temperature, its thermal conductivity is very small, and under the action of negative temperature, its thermal conductivity is very large. The test adopts the structural form of the gravel sandwich bridge approach (Figure 11) and U-shaped block gravel bridge approach (Figure 12). This structural form is often used in the foundation engineering of frozen soil foundation to reduce the heat introduced into the foundation in the warm season and increase the amount of cooling effect introduced into the foundation in the cold season. In the warm season, the air temperature on the surface of the gravel layer is higher than that in the pores of the gravel layer. Therefore, the external hot air cannot enter the voids. In the cold season, the air temperature in the pores of the gravel layer is higher than the atmospheric temperature, and the dense external cold air is easy to sink into the pores of the gravel layer and squeezes out the hot air in the pores. The test was carried out in three cycles, and the ground temperature in the three cycles were maintained between −2.9°C and −3°C, basically to meet the requirements of constant temperature foundation.
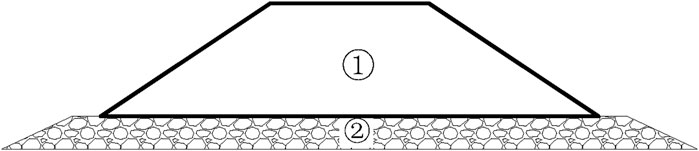
Figure 11. Gravel sandwich bridge approach diagram (① represents the transition section subgrade; ② represents the gravel interlayer).
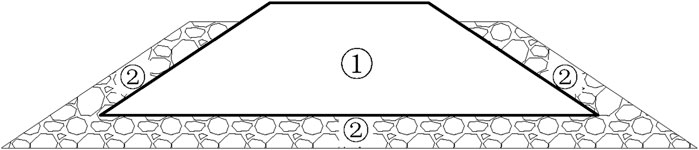
Figure 12. U-shaped block gravel bridge approach diagram (① represents the transition section subgrade; ② represents the U-shaped block gravel).
5.1 Transition section top surface temperature
The temperature change curve of the temperature measuring point on the top surface of the transition section is shown in Figure 13. It can be seen from the figure that the temperature changes in the subgrade center and the slope shoulder at 2.5 m on the top of the transition section are basically the same, indicating that the response of the two to the change in atmospheric temperature is basically the same. The longitudinal temperature curve of the center of the subgrade shows that the changes in the temperature curve of the temperature measurement points greater than 2.5 m are the same, and the peak temperature of the third cycle is −8.8°C and 0.8°C. Comparing with other temperature measurement points, the temperature change in the contact area between the platform back and the subgrade has obvious hysteresis, and the peak points are between other measurement points. The peak temperature of the third cycle is −7.8°C and 0.1°C. At the cooling stage, the temperature at 0 m platform back is higher than that at other measuring points. At the heating stage, the temperature at 0 m platform back is lower than that at other measuring points. The reason may be that the measuring point is located between concrete, soil, and air. The smaller specific heat capacity and larger thermal conductivity of concrete affect the temperature change in the measuring point.
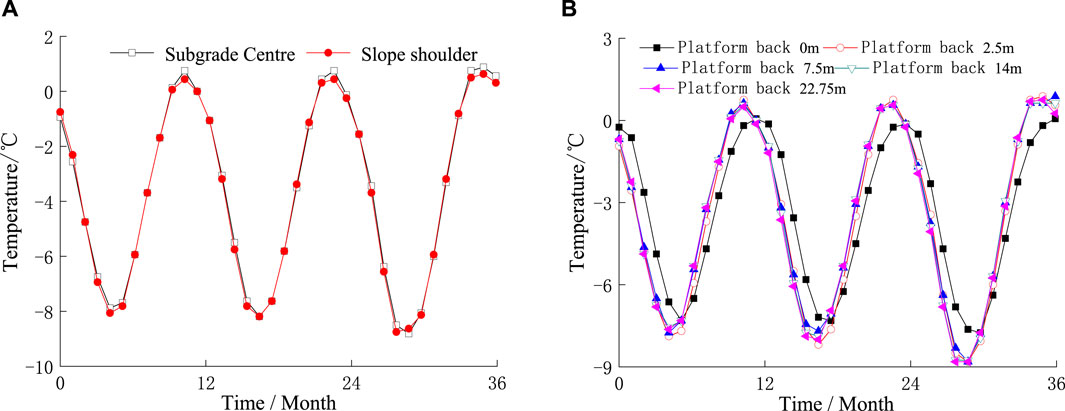
Figure 13. Top surface temperature curve of the transition section. (A) Platform back 2.5 m—cross direction. (B) Roadbed center—long direction.
5.2 The bottom of the gravel sandwich bridge approach temperature curve
The temperature change curve of the longitudinal temperature measurement point at the bottom of the transition section is shown in Figure 14. It can be seen from the diagram that with the increase in the test period, the measuring points at the bottom of the transition section change periodically in a simple harmonic wave form, and the total cooling capacity inside the soil gradually accumulates. Taking the 2.5-m platform back of the subgrade center section as an example, in the three test cycles, the high temperature decreased from −1.06°C to −3.0°C, and the low temperature decreased from −3.94°C to −5.25°C. With the increase in the distance from the platform back, the influence of atmospheric temperature change on the temperature measuring points of the subgrade center is smaller. Taking the temperature measurement point of the third cycle as an example, for the platform back at 0 m, 2.5 m, 7.5 m, 14 m, and 22.75 m, the high temperatures are −1.6°C, −2.4°C, −1.9°C, −1.7°C, and −1.7°C; the low temperatures are −6.1°C, −5.3°C, −4.1°C, −3.4°C, and −3.6°C; the temperatures decrease by 4.5°C, 2.9°C, 2.2°C, 1.7°C, and 1.9°C; and the change rates are 288.5%, 115.2% and 109.3%, 106.2%, 103.6%, and 110.6%, respectively. It can be seen that the change in atmospheric temperature has a great influence on the temperature of the subgrade near the bridgehead.
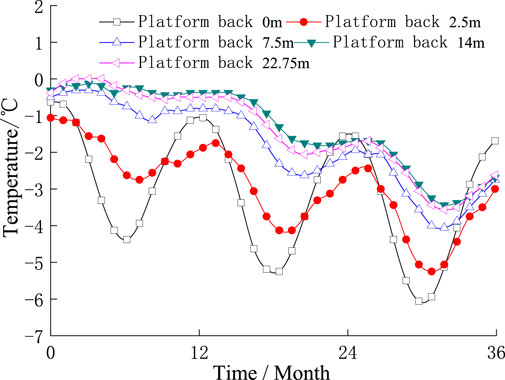
Figure 14. Longitudinal temperature curve of the subgrade center at the bottom of the transition section.
The temperature change curve of the transverse temperature measurement point at the bottom of the transition section is shown in Figure 15. The temperature measurement points at 2.5-m and 22.75-m platform back show similar variation rules. The slope toe is most affected by temperature changes, and the subgrade center and slope shoulder are relatively less affected by temperature changes. The temperature change in the slope shoulder and subgrade center is basically the same at 2.5 m of the abutment back, but there is a certain temperature difference at 22.75 m. It can be seen that the closer to the bridgehead, the less obvious the temperature difference between the subgrade center and slope shoulder, whereas the temperature of the subgrade center and slope shoulder of the subgrade cross section away from the platform back has certain difference. The reason for the analysis may be that with the increase in the distance from the platform back, the influence of the heat transfer in the direction of the bridgehead on the subgrade temperature field gradually weakens. The heat transfer mode gradually changes from three-dimensional heat transfer to two-dimensional heat transfer. The intensity of the influence of the heat transfer in the direction of the bridgehead on the subgrade temperature field near the platform back is much greater than that of the heat transfer in the direction of the top surface of the subgrade and the side surface of the subgrade, resulting in the same temperature change as the 2.5-m section of the platform back at the bottom of the transition section. From the above analysis, it can be concluded that the soil temperature field near the back of the abutment is greatly affected by the heat transfer at the bridgehead. The soil temperature field away from the back of the abutment is mainly affected by the heat transfer on the top and side of the subgrade. Due to the change in atmospheric temperature, there is a certain lag in the temperature of the subgrade center and slope shoulder compared with that of the slope toe.
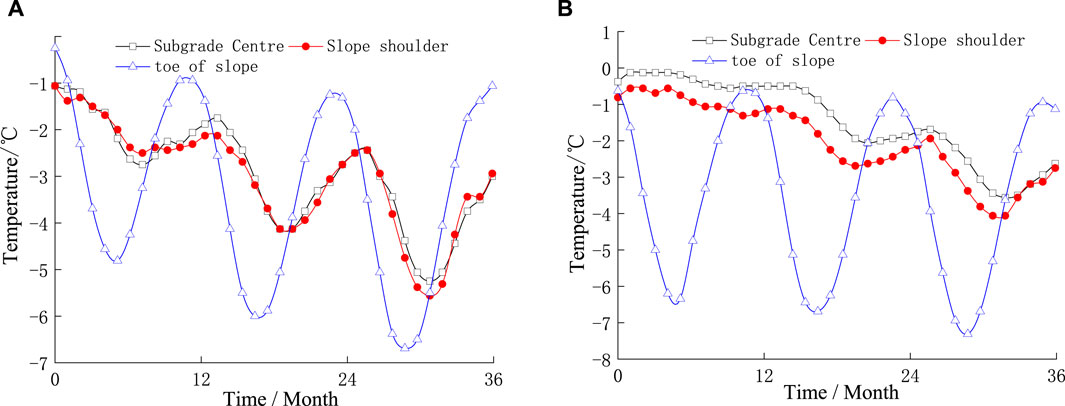
Figure 15. Transverse temperature curve at the bottom of the transition section. (A) Platform back 2.5 m—cross direction. (B) Platform back 22.75 m—cross direction.
5.3 Temperature curve 3 m below the surface of the gravel sandwich bridge approach
The temperature change curve of each measuring point 3 m below the surface is shown in Figure 16. The temperature change in each measuring point on the central longitudinal section of the subgrade at 3 m below the surface shows the same temperature change law as the central longitudinal section of the subgrade at the bottom of the transition section. With the increase in the distance from the platform back, the temperature of the temperature measuring point in the center of the subgrade is less affected by the change in atmospheric temperature. During the first cycle of the test, the temperature is basically approximately 0°C at 7.5 m, 14 m, and 22.5 m on the abutment back of the longitudinal section of the subgrade center, the slope change is very small, and the temperature change is also very slow. However, it is not the same as the change law of the measuring points near the bridgehead. The reason may be that the soil far away from the bridgehead is less affected by the temperature change at the beginning of the test, and the phase change occurs in the soil. It can be seen from Figure 16B that the temperature changes in the subgrade center and the slope shoulder measuring points of the 2.5-m section of the platform back are consistent, indicating that the temperature change in the foundation near the platform back is still controlled by the heat transfer in the direction of the platform back.
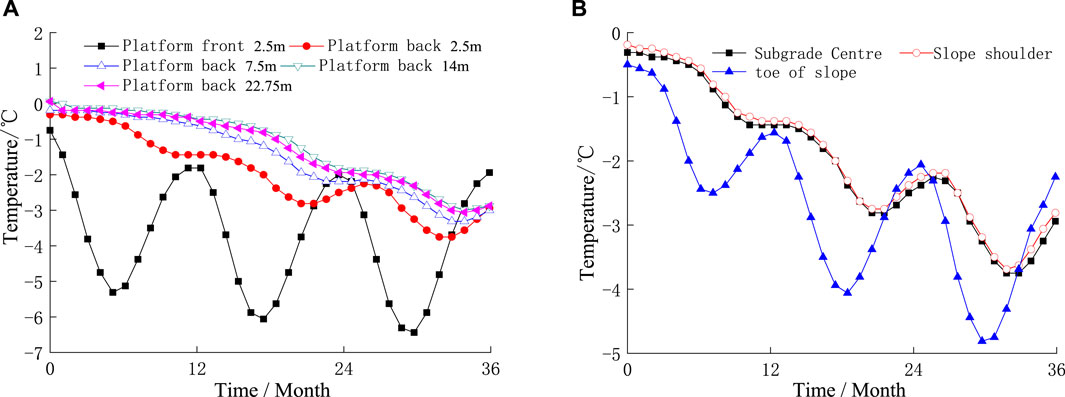
Figure 16. Temperature variation curve of the 3-m stratum underground surface. (A) Roadbed center—long direction. (B) Platform back 2.5 m—cross direction.
5.4 Temperature curves at different depths under the central top of the gravel sandwich bridge approach subgrade
The temperature change curve at different depths in the center of the subgrade 2.5-m platform back is shown in Figure 17. With the increase in the depth, the response of the measuring point to the change in the upper atmospheric temperature decreases gradually. Taking the second cycle of the test as an example, the peak temperatures at 0 m below the top surface of the subgrade are 0.75°C and −8.19°C. At 3 m below the top surface of the subgrade, the peak temperatures are −0.81°C and −5.69°C. At 6 m below the top surface of the subgrade, the peak temperatures are −1.75°C and −4.13°C. At 9 m below the top of the subgrade, the temperature peak is not obvious, indicating that the depth is less affected by atmospheric temperature changes. With the increase in the measuring point depth, the hysteresis of measuring point temperature is more obvious.
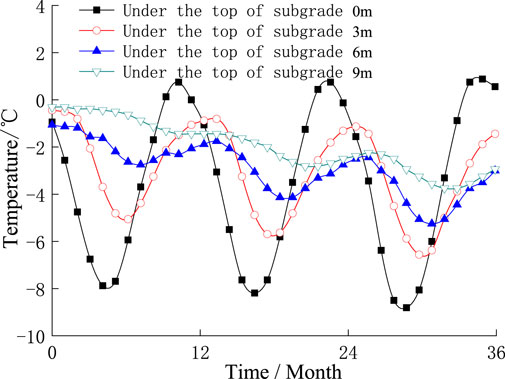
Figure 17. Temperature variation curves at different depths under the subgrade center at 2.5 m from the platform back.
5.5 Comparative analysis of temperature curves at 6 m under the surface of the two-bridge approach
The temperature change time history curves of the second and third cycles of the gravel sandwich bridge approach and the U-shaped block gravel bridge approach and the temperature change comparison curve at 6 m below the center of the transition section are shown in Figure 18, which reflects the influence of periodic temperature on the temperature stability of the subgrade bottom. It can be seen from Figure 18 that compared with the U-shaped block gravel bridge approach, the temperature change curve at 2.5 m back of the platform is not significantly different. With the increase in the distance from the back of the platform, the cooling effect of the gravel sandwich bridge approach is gradually enhanced. The cooling effect of the platform back at 14 m and 22.75 m is basically the same. When the temperature is the highest in the third cycle, for the platform back at 2.5 m, 75 m, 14 m, and 22.75 m, the temperatures of the gravel sandwich bridge approach and the U-shaped block gravel bridge approach are −3.75°C, −3.5°C, −3.19°C, and −3.19°C and −4.44°C, −4.19°C, −3.94°C, and −3.94°C, respectively. The change rates are 18.4%, 19.7%, 23.5%, and 23.5%. The cooling effect is obvious. When the temperature of the third cycle is the lowest, the temperatures of the gravel sandwich bridge approach and the U-shaped block gravel bridge approach are −3.44°C, −2.56°C, −2.06°C, and −2.19°C and −3.45°C, −2.63°C, −2.44°C, and −2.50°C for the platform back at 2.5 m, 75 m, 14 m, and 22.75 m, respectively. The change rates are 0.3%, 2.7%, 18.4%, and 14.1%. This shows that although the cooling effect of the U-shaped block gravel bridge approach is better than that of the gravel sandwich bridge approach, the cooling effect is the best when the temperature is the highest. At the same time, it can also be concluded that the cooling effect increases with the increase in the distance from the platform back.
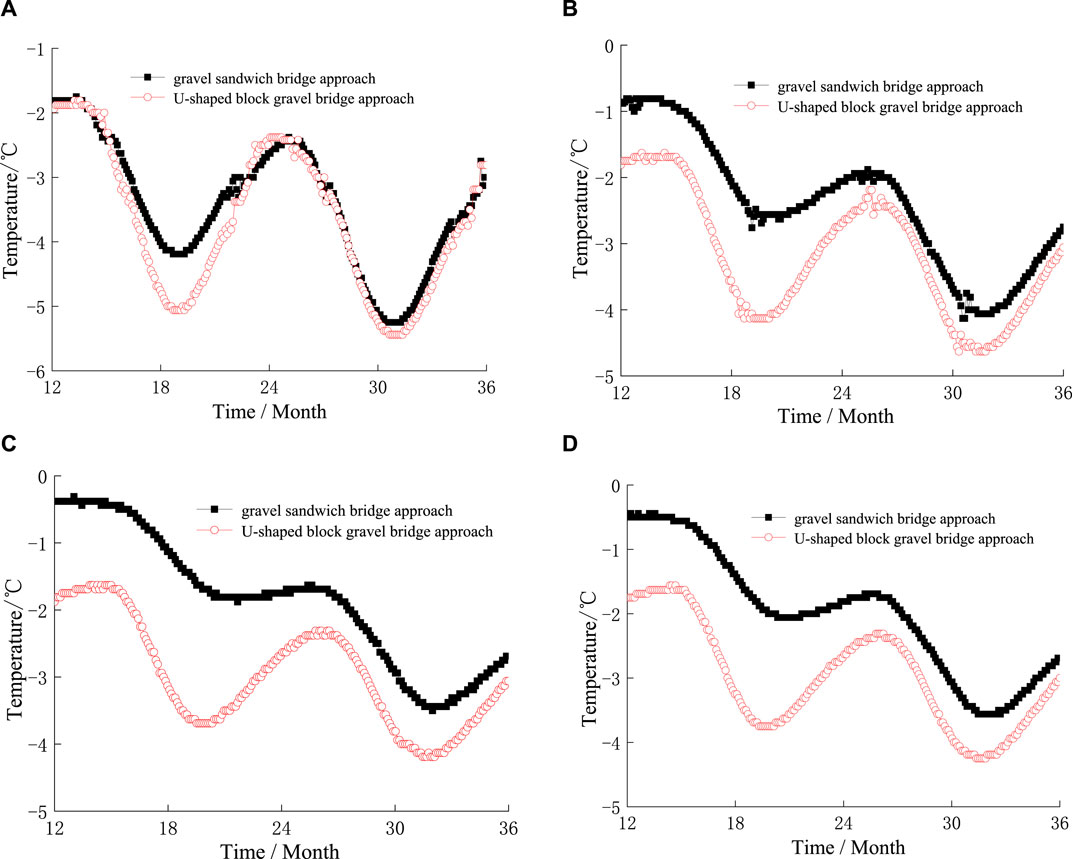
Figure 18. Temperature change curve of 6 m below the center of the top surface of the bridge approach. (A) Platform back 2.5 m. (B) Platform back 7.5 m. (C) Platform back 14 m. (D) Platform back 22.75 m.
6 Conclusion
Through the model test analysis of the indoor road–bridge transition section, a clear and comprehensive understanding of the spatial temperature field distribution law of the gravel interlayer road–bridge transition section can be obtained, and the following conclusions can be drawn:
(1) In the center of the subgrade 2.5-m platform back, with the increase in the depth, the influence of the upper atmospheric temperature change on the measuring point gradually decreases, and there is an obvious hysteresis.
(2) At the lowest temperature in the third cycle and in the end of the negative temperature in the third cycle, the temperature in the middle and upper parts of the transition section is the lowest, and the temperature at the bottom of the subgrade center is the highest. As the distance from the platform back increases, the overall temperature of the transition section gradually increases.
(3) The highest temperature in the third cycle and the change law in the end of the third cycle are basically the same, the temperature at the bottom of the subgrade center is the lowest, and the slope shoulder temperature is the highest. As the distance from the platform back increases, the overall temperature of the transition section gradually decreases.
(4) The longitudinal temperature field of the bridge–subgrade transition section is non-uniform. The influence range of the transition section on the temperature field is approximately 14 m in the back of the platform, and the influence range at 7.5 m is the most severe.
(5) From the test results, it can be concluded that the U-shaped structure not only has a good overall cooling effect, but also the cooling effect gradually increases with the increase in the distance from the platform back.
Data availability statement
The original contributions presented in the study are included in the article/Supplementary Material; further inquiries can be directed to the corresponding authors.
Author contributions
QY: conceptualization, data curation, supervision, validation, writing–original draft, and writing–review and editing. JW: funding acquisition, investigation, methodology, and writing–review and editing. BZ: software, supervision, and writing–review and editing. MH: validation, visualization, and writing–review and editing.
Funding
The author(s) declare that financial support was received for the research, authorship, and/or publication of this article. The research work herein was supported by Basic Science (Natural Science) Research Project Funding of Universities in Jiangsu Province (No. 22KJA560001); Opening Fund of Technology Innovation Center for Mine Geological Environment Restoration in the Alpine and Arid Regions (Grant No. HHGCKK2205); National Natural Science Foundation of China (Project No. 5170818, 51778215, and 52374087); Young Key Teachers of HPU (Project No. 2019XQG-19); Henan Province young backbone teachers (No. 2023GGJS057); Henan Polytechnic University Outstanding Youth Fund (No. J2024-1).
Conflict of interest
The authors declare that the research was conducted in the absence of any commercial or financial relationships that could be construed as a potential conflict of interest.
Publisher’s note
All claims expressed in this article are solely those of the authors and do not necessarily represent those of their affiliated organizations, or those of the publisher, the editors, and the reviewers. Any product that may be evaluated in this article, or claim that may be made by its manufacturer, is not guaranteed or endorsed by the publisher.
References
Cao, L. (2017). Study of water thermal characteristics and frost heaveprocess monitoring in the roadbed of cutting section in seasonal-ly frozen soil regions. J. Glaciol. Geocryol. 39, 1065–1074.
Chen, X. J. (2018). Research on the settlement and control measures of the transition section of road and bridge in permafrost regions. Xi'an: Xi'an University of Science and Technology. Ph D.
Glenis, V., Pinamonti, V., Hall, J. W., and Kilsby, C. G. (2015). A transient stochastic weather generator incorporating climate model uncertainty. Adv. water Resour. 85, 14–26. doi:10.1016/j.advwatres.2015.08.002
Haasnoot, M., van’t Klooster, S., and Van Alphen, J. (2018). Designing a monitoring system to detect signals to adapt to uncertain climate change. Glob. Environ. change 52, 273–285. doi:10.1016/j.gloenvcha.2018.08.003
Haeberli, W., Schaub, Y., and Huggel, C. (2017). Increasing risks related to landslides from degrading permafrost into new lakes in de-glaciating mountain ranges. Geomorphology 293, 405–417. doi:10.1016/j.geomorph.2016.02.009
Hu, G., Zhao, L., Wu, X., Wu, T., Li, R., Xie, C., et al. (2017). A mathematical investigation of the air-ground temperature relationship in permafrost regions on the Tibetan Plateau. Geoderma 306, 244–251. doi:10.1016/j.geoderma.2017.07.017
Jensen, S., and Traeger, C. P. (2014). Optimal climate change mitigation under long-term growth uncertainty: stochastic integrated assessment and analytic findings. Eur. Econ. Rev. 69, 104–125. doi:10.1016/j.euroecorev.2014.01.008
Jing, H. W., Wu, J. Y., Yin, Q., and Wang, K. (2020). Deformation and failure characteristics of anchorage structure of surrounding rock in deep roadway. Int. J. Min. Sci. Technol. 30 (5), 593–604. doi:10.1016/j.ijmst.2020.06.003
Li, D. Q., Jiang, S. H., Cao, Z. J., Zhou, W., Zhou, C. B., and Zhang, L. M. (2015). A multiple response-surface method for slope reliability analysis considering spatial variability of soil properties. Eng. Geol. 187, 60–72. doi:10.1016/j.enggeo.2014.12.003
Li, X. M., Niu, F. J., and Li, H. (2018). Characteristics andengineering significance of frost heaving in subgrade of Harbin-Dalian high-speed railway. J. Glaciol. Geoc-ryology 40, 55–61.
Liu, Y., He, L. Q., Jiang, Y. J., Sun, M. M., Chen, E. J., and Lee, F. H. (2019). Effect of in situ water content variation on the spatial variation of strength of deep cement-mixed clay. Geotechnique 69, 391–405. doi:10.1680/jgeot.17.p.149
Liu, Y., Hu, J., Xiao, H. W., and Chen, E. J. (2017). Effects of material and drilling uncertainties on artificial ground freezing of cement-admixed soils. Can. Geotechnical J. 54, 1659–1671. doi:10.1139/cgj-2016-0707
Lu, X. Q. (2016). Model test research on the influence of groundwater to the differential settlement of embankment-bridge 'transition section, ph D. Lanzhou: Lanzhou Jiaotong university.
Luo, X. X., Yu, Q. H., Ma, Q. G., and Zhang, J. M. (2019). Prediction model on thermal boundary condition of embankment based on boundary layer theory. J. Central South Univ. Sci. Technol. 50 (3), 658–668.
Ma, D., Duan, H., and Zhang, J. (2022a). Solid grain migration on hydraulic properties of fault rocks in underground mining tunnel: Ra-dial seepage experiments and verification of permeability prediction. Tunn. Undergr. Space Technol. 126, 104525. doi:10.1016/j.tust.2022.104525
Ma, D., Duan, H., Zhang, J., and Bai, H. (2022b). A state-of-the-art review on rock seepage mechanism of water inrush disaster in coal mines. Int. J. Coal Sci. Technol. 9, 50. doi:10.1007/s40789-022-00525-w
Mao, Y., Li, G., Ma, W., Mu, Y., Wang, F., Miao, J., et al. (2019). Field observation of permafrost degradation under Mo'he airport, Northeastern China from 2007 to 2016. Cold Regions Sci. Technol. 161, 43–50. doi:10.1016/j.coldregions.2019.03.004
Mu, Y. H. (2012). Analyses on dynamic variations of embankment thermal regime and deformation along the Qinghai Tibet railway in permafrost regions. Beijing: Dissertation for Graduate University of Chinese Academy of Sciences. Ph D.
Niu, F. J., Lin, Z. J., Lu, J. H., and Liu, H. (2011a). Study of the influencing factors of roadbed settlement in embankment-bridge transition section along Qinghai-Tibet Railway. Rock Soil Mech. 32 (S2), 372–377.
Niu, F. J., Lin, Z. J., Lu, J. H., Liu, H., and Xu, Z. y. (2011b). Characteristics of roadbed settlement in embankment-bridge transition section along the qinghai-tibet railway in permafrost regions. Cold Regions Sci. Technol. 65, 437–445. doi:10.1016/j.coldregions.2010.10.014
Niu, F. J., Lin, Z. J., and Wu, X. Y. (2016). Characteristics of subgrade's temperature,moisture and frost heave deformation in Haomen,passenger railway line from Lanzhou to Xinjiang. J. Glaciol. Geocryol. 38, 1074–1082.
Pan, G. F. (2017). Experimental study on new bridge-subgrade transition structure in permafrost regions. Lanzhou: Lanzhou Jiaotong university. Ph D.
Shen, Y. P., Da, Z. H., and Yue, Z. R. (2018). Experimental research on the stability of embankment-bridge transition section of high-speed railway in seasonal frozen regions. J. Railw. Eng. Soc. 35, 17–22.
Shi, G. Q., Zhao, S. Y., and Li, X. M. (2014). The frostheaving deformation of high-speed railway subgrades in cold re-gions: monitoring and analyzing. J. Glaciol. Geocryol. 36, 360–368.
Shi, H., Chen, W. L., Zhang, H. Q., and Song, L. (2023a). A novel obtaining method and mesoscopic mechanism of pseudo-shear strength parameter evolution of sandstone. Environ. Earth Sci. 82, 60. doi:10.1007/s12665-023-10748-y
Shi, H., Chen, W. L., Zhang, H. Q., Song, L., Li, M., and Wang, M. J. (2023b). Dynamic strength characteristics of fractured rock mass. Eng. Fract. Mech. 292, 109678. doi:10.1016/j.engfracmech.2023.109678
Sun, J. G., Duan, S. J., and Cui, C. X. (2013). Dynamic analysis of the track on roadbed-bridge transition section and research on its reasonable length. Procedia—Social Behav. Sci. 96, 2267–2273. doi:10.1016/j.sbspro.2013.08.256
Tai, B. W., Liu, J. K., and Li, X. (2017). Numerical model offrost heaving and anti-frost heave measures of high-speed rail-way subgrade in cold regions. China Railw. Sci. 38, 1–9.
Wang, J. C., and Wu, Q. B. (2017). Settlement analysis of embankment-bridge transition section in the permafrost regions of Qinghai-Tibet Railway. J. Glaciol. Geocryol. 39, 79–85.
Wu, J. Y., Jing, H. W., Gao, Y., Meng, Q. B., Yin, Q., and Du, Y. (2022). Effects of carbon nanotube dosage and aggregate size distribution on mechanical property and microstructure of cemented rockfill. Cem. Concr. Compos. 127, 104408. doi:10.1016/j.cemconcomp.2022.104408
Wu, J. Y., Jing, H. W., Yin, Q., Yu, L. Y., Meng, B., and Li, S. C. (2020). Strength prediction model considering material, ultrasonic and stress of cemented waste rock backfill for recycling gangue. J. Clean. Prod. 276, 123189. doi:10.1016/j.jclepro.2020.123189
Wu, J. Y., Wong, H. S., Zhang, H., Yin, Q., Jing, H. W., and Ma, D. (2024). Improvement of cemented rockfill by premixing low-alkalinity activator and fly ash for recycling gangue and partially replacing cement. Cem. Concr. Compos. 145, 105345. doi:10.1016/j.cemconcomp.2023.105345
Wu, K. L., and Pan, G. F. (2018). Experimental study on the model improvement of road and bridge transition section in permafrost region. Constr. Qual. 36, 41–46.
Xu, X. Z., Wang, J. C., and Zhang, L. X. (2001). Physics of frozen soil. Beijing, China: Science Press, p98–p99.
Zhai, W. M., and True, H. (1999). Vehicle-track dynamics on a ramp and on the bridge:simulation and measurements. Veh. Syst. Dyn. 33, 604–615. doi:10.1080/00423114.1999.12063115
Zhang, Y. Z., Du, Y. L., and Sun, B. C. (2016). Roadbed deformation characteristics of roadbed-bridge transition section for high speed railway in seasonal frozen soil region. China Railw. Sci. 37, 39–45.
Zheng, Q. Q., Qian, J. W., Zhang, H. J., Chen, Y. K., and Zhang, S. H. (2024). Velocity tomography of cross-sectional damage evolution along rock longitudinal direction under uniaxial loading. Tunn. Undergr. Space Technol. 143, 105503. doi:10.1016/j.tust.2023.105503
Zhou, G. Q., Wang, J. Z., Liu, Z. Q., Bie, X. Y., and Zhao, G. S. (2004). Influence of pre-cooling roadbed on variation of temperature field of Qinghai-Tibetan railway embankment. J. China Univ. Min. Technol. 33, 611–615.
Keywords: bridge approach, permafrost region, gravel sandwich, temperature field, subgrade
Citation: Yin Q, Wu J, Zhang B and Hou M (2024) Laboratory investigation of the spatial thermodynamic properties of the bridge approach in the permafrost region. Front. Earth Sci. 12:1394898. doi: 10.3389/feart.2024.1394898
Received: 02 March 2024; Accepted: 09 April 2024;
Published: 22 May 2024.
Edited by:
Hao Shi, Anhui University of Science and Technology, ChinaReviewed by:
Zhen Huang, Jiangxi University of Science and Technology, ChinaGuansheng Han, Shaoxing University, China
Copyright © 2024 Yin, Wu, Zhang and Hou. This is an open-access article distributed under the terms of the Creative Commons Attribution License (CC BY). The use, distribution or reproduction in other forums is permitted, provided the original author(s) and the copyright owner(s) are credited and that the original publication in this journal is cited, in accordance with accepted academic practice. No use, distribution or reproduction is permitted which does not comply with these terms.
*Correspondence: Boyang Zhang, zhangboyangzzdq@126.com