Characterization and fractal characteristics of nano-scale pore structure in shale gas reservoirs: a case study of the deep Longmaxi Formation, Zigong region, Southern Sichuan Basin, China
 Chenxu Zhao1,2
  Feifei Fang
- 1College of Geosciences, China University of Petroleum-Beijng, Beijing, China
- 2Honggang Oil Production Plant, PetroChina Jilin Oilfield Company, Songyuan, China
- 3Research Institute of Exploration and Development, PetroChina Jilin Oilfield Company, Songyuan, China
- 4Research Institute of Petroleum Exploration and Development, PetroChina, Beijing, China
- 5School of Petroleum Engineering, Chongqing University of Science and Technology, Chongqing, China
Taking the Longmaxi deep-marine shale gas reservoir in Zigong region as the research target, this paper aimed to characterize the nano-scale pore structure and investigate the reservoirs’ heterogeneity based on fractal theory. By conducting a series of experimental studies, mainly including TOC, XRD, gas adsorption (N2 and CH4), we were able to clarify the main controlling factors for the heterogeneity of deep shale pore structure. Our results indicated that the deep marine shale possessed a significant amount of organic matter, as the average TOC value is 3.68%. The XRD analysis results show that quartz and clay were the main mineral types, and the total content of these two minerals averaged 77.5%. Positive correlations were observed between TOC and quartz, while TOC decreases as the clay mineral increases, this discovery indicating that quartz is biogenic. Based on FHH (Frenkele-Halseye-Hill) method, by using the LTNA adsorption isotherms, we took relative pressure P/P0=0.5 as the boundary, then two separate fractal dimension were deduced, D1 and D2 represent the fractal characteristics of small and large pores, respectively. Our study revealed that both D1 and D2 demonstrated positive correlations with N2 adsorption pore volume and adsorption specific surface area, while negatively correlated with the adsorption average pore diameter. Moreover, the two fractal dimensions showed positive associations with TOC and quartz and negative associations with clay. Additionally, D1 and D2 also demonstrated a positive correlation with Langmuir volume. The presence of micropores was found to significantly influence the formation of an irregular pore structure in shale. As the pore size decreased, the adsorption specific surface area increased, resulting in a more intricate pore structure, and the fractal dimension of the pores elevated, ultimately. This intricate structure is beneficial for the accumulation of shale gas. These research findings offer valuable insights for the comprehensive assessment of deep shale gas, and enrich our knowledge of enrichment mechanisms in deep shale gas reservoirs.
1 Introduction
Shale gas resources have a wide distribution range and large reserves, making it an extremely important unconventional energy type. In the past two decade, shale gas exploration and development have achieved remarkable success worldwide, especially in North America, attracting widespread attention from the energy industry (Zhang et al., 2020; Cui et al., 2023; Yang et al., 2024; Zheng et al., 2024). In 2020, the United States achieved an impressive production of over 7,000 × 108 m3 of shale gas, highlighting the enormous potential of this energy source (Wang et al., 2022). China, as a large energy consuming country, has made significant breakthroughs in shale gas development through extensive work in recent years, and has established five national shale gas development demonstration zones, namely, Weiyuan-Zigong, Fushun-Yongchuan, Changning-Weiyuan, Jiaoshiba, and North-Zhaotong (Zhu et al., 2018; Zhu et al., 2021; Song et al., 2023; Wang Enze et al., 2024; Zou et al., 2024). According to the research, China’s shale gas production has exceeded 250 × 108 m3 in 2023, more than double the production in 2018, indicating that the industry plays a crucial role in boosting China’s natural gas production.
Shale gas production in China is consistently increasing, with current production mainly originating from shallow layers. Nonetheless, there remains a considerable disparity in comparison to the United States’ shale gas production. Chinese geologists have directed their research efforts towards deep shale gas, which is located at depths surpassing 3,500 m, owing to its vast resource potential l (He et al., 2020; HE Zhiliang and JIANG, 2021; NIE Haikuan and DANG, 2022). The estimated shale gas geological resources in China amount to 123.01 × 10¹²m3, with deep shale gas resources representing 55.45 × 10¹²m3. Within the Sichuan Basin, deep shale gas resources exceeding 3,500 m constitute over 60% of the overall resources (Zou et al., 2017;He et al., 2020).
As the burial depth of deep shale gas reservoirs generally exceeding 3500m, and they have undergone extremely complex structural and diagenetic evolution, this greatly increases the complexity of the pore structure of shale gas reservoirs. Shale gas reservoir possesses unique characteristics such as self-generation and self-storage (Zhang et al., 2019; Zhang et al., 2020). The mineral particles and organic matter in shale reservoirs contain large scale range of pores (nano/micro/millimeter scale) and micro-fractures, providing important storage space for shale gas enrichment, and also offered flow channels for shale gas seepage (Zhang et al., 2019; Zhao et al., 2022). By clarify the reasons for the complexity and heterogeneity of pore systems in shale gas reservoir, we can achieve more efficient development of deep shale gas resources (Yang et al., 2016; Zhang et al., 2020; Qiu et al., 2021; Xie et al., 2022; Cui et al., 2024). The characterization of pore structure in shale gas reservoirs involves many aspects, including pore types, pore shape, pore size, pore volume, pore specific surface area, spatial distribution of pore systems, connectivity between pores. There are two main categories of technical means for characterizing shale reservoir pore structure. On the one hand, the direct observation method includes scanning electron microscopy (SEM) and Computed Tomography (CT) (Loucks et al., 2009; Yang et al., 2016; Zhang et al., 2017; Zhang et al., 2019; Guo et al., 2019). These methods analyze two-dimensional and three-dimensional images to provide information on pore structure parameters. On the other hand, indirect measurement methods like gas adsorption (CO2, N2, He), mercury intrusion capillary (high-pressure and rate-controlled), and small/ultra-small angle neutron scattering enable quantitative analysis of shale pore structure (Clarkson et al., 2012; Clarkson et al., 2013; Schmitt et al., 2013; Yang et al., 2017; Li et al., 2019). By utilizing these techniques, researchers can gain a deeper understanding of the complexity of micro/nano pore structures in shale gas reservoirs, and then ultimately improving the efficiency of shale gas extraction and production.
Prior research has shown the effectiveness of the experimental approach of low-temperature nitrogen adsorption (LTNA) in the characterization of shale reservoir’ pore structure. Scholars from both domestic and international backgrounds have extensively studied shale pore structure using this technique (Chen et al., 2019; Chen et al., 2019; Guo et al., 2019). Recently, fractal theory has been proven to be a highly effective mathematical method for characterizing the complexity of pores in unconventional oil and gas reservoirs, such as tight gas and oil in sandstone, shale gas and oil reservoirs, and coal (Yao et al., 2008; Hu et al., 2016; Zhang et al., 2020; Dou et al., 2021). The FHH fractal model, derived from the adsorption curve of LTNA experiments, is commonly utilized for quantitatively assessing the heterogeneity/complexity of shale pore structure.
This paper aims to accurately characterize the heterogeneity/complexity of the pore systems of deep Longmaxi shale in Zigong region. We conducted a series of systematic experimental studies for this purpose, including TOC, XRD, gas adsorption (N2 and CH4). Through these experiments, the study aimed to explore the factors affecting fractal dimension.
2 Geological setting
Sichuan Basin, located in the southwest China, covering an area of over 18 × 104km2, one of the largest oil and gas bearing basins, is known as the most promising region for shale gas development (Li et al., 2022; Shi et al., 2023). Structurally, it is positioned on the northwest side of the Yangtze platform, functioning as a secondary tectonic unit. It was formed as a basin during the Indosinian era and was subsequently fully tectonically compressed during the Himalayan-Yanshan movement, resulting in its current structural layout (Zhang et al., 2020). The geotectonic sections of the basin comprise of the southeastern depression zone, the central uplift area, and the northwest depression zone. The research site in the Zigong locality is specifically positioned in the Ziliujing Sag within the central Sichuan uplift area (Figure 1). The research concentrates on the Silurian LMXF, recognized for being a shallow marine shelf phase shale with abundant organic matter (TOC>2.5%), substantial thickness (30–150 m), and high gas content (>5 m3/t). These unique geological conditions make the Sichuan Basin the most successful area for shale gas development in China. The thermal maturity of the sedimentary OM in Longmaxi shale has reached the high-over-mature stage. During the mature stage, a large quantity of shale gas is generated along with the maturation of organic matter, while also generating a large number of organic pores (Yu et al., 2018; Teng et al., 2021). These micropores play a mortal role in providing essential storage capacity for shale gas accumulation.
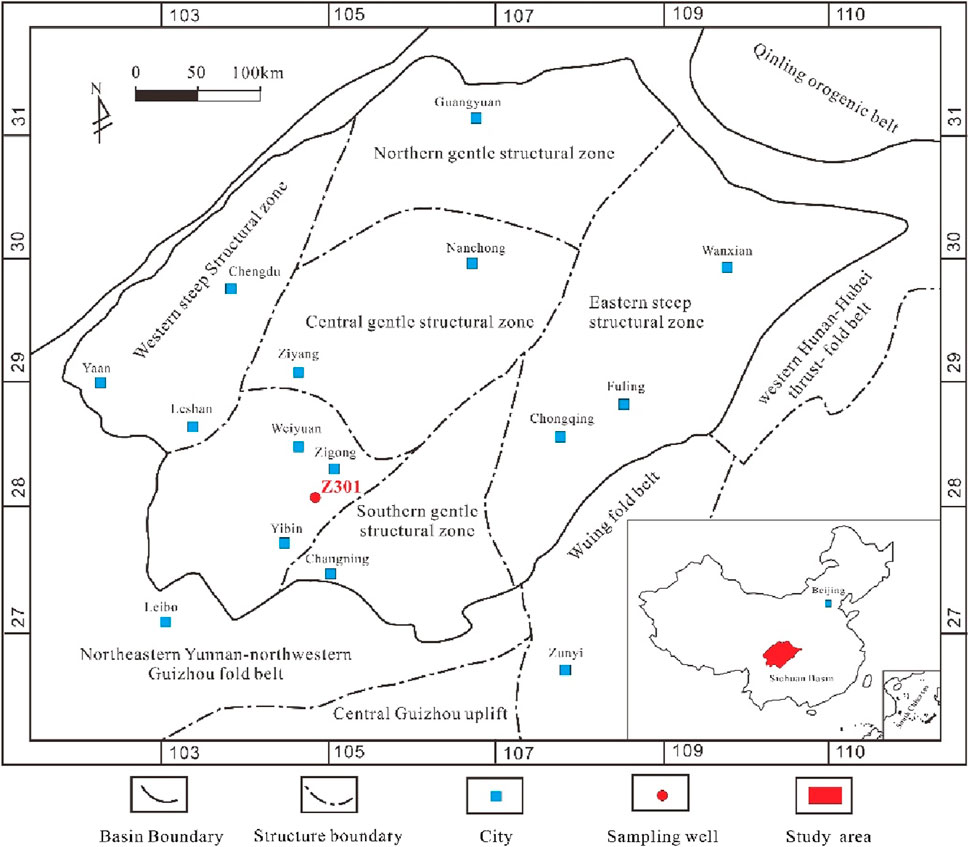
Figure 1. The location of sampling well Z301 in Zigong region.
3 Samples and methods
3.1 Samples
In the Zigong area, Jilin Oilfield Company (PetroChina) positioned a crucial evaluation well called Z301 (Figure 1) in the Xindian syncline structure in 2022. The purpose of deploying Well Z301 was to clarify the shale gas resource potential in this region. Well Z301 exhibits excellent gas measurement display, with an average gas content of 4.0 mL/g. A total of 62.7 m core section of black shale was acquired from depths ranging between 3911.1 and 3973.8 m.
3.2 Experimental methods
All analytical tests involved in this paper were completed in the core laboratory of iRock Tecnologies, Beijing, China.
3.2.1 TOC
The MultiN/C3100 TOC analyzer was used to measure the content of TOC. To prepare for the TOC content test, we use an agate mortar to grind shale samples into powder (60–80 mesh). By adding an appropriate amount of dilute hydrochloric acid to the powdered shale sample, inorganic minerals such as carbonates could be dissolved, then rinse the powdered shale sample with distilled water to achieve a neutral PH. Subsequently, the samples were dried for future use. The experiment was conducted following the procedures specified in the National Standard of China (GB/T19145-2022).
3.2.2 XRD
The XRD experimental instrument used for mineral content determination was the D8 DISCVER X-R diffractometer. The experiment followed the procedures specified in the PetroChina standard (SY/T 5163–2018).
3.2.3 CH4 adsorption
An experiment on isothermal adsorption was carried out with magnetic levitation balance (Ru-Isosorb HP Static-III), under high-pressure gas conditions. The experiment followed the procedures specified in the Energy Industry Standard of China (NB/T 10117–2018). The mass variation measured by the magnetic levitation balance served in the calculation of the quantity of adsorbed methane gas. This data was then used to compute the shale adsorption parameters, based on the Langmuir theoretical model, and a graph illustrating the isothermal adsorption curve was generated.
3.2.4 LTNA
The LTNA experiment utilized the American Mike ASAP2460 multi-station extended specific surface and porosity analyzer to conduct low-temperature nitrogen adsorption measurements. Firstly, the shale samples should be ground into powder (60–80 mesh) in the experimental preparation stage, and then degassed under specific temperature and pressure conditions (Vacuum environment, 110°C, 24 h), in order to eliminate any residual bound and capillary water. The experimental conditions included a temperature of −196.15°C, with the adsorption quantity being recorded at various relative pressure (P/P0) levels. The experimental process adhered to the gas adsorption BET method outlined in the national standard of China (GB/T 19587–2017).
3.3 Fractal theory
Fractal theory originates from mathematical statistical methods. In recent years, it has been widely used by petroleum geologists for characterizing the pore structure features of unconventional reservoirs, such as shale gas and oil, tight sandstone gas and oil and coalbed methane (Mandelbrot, 1975; Li et al., 2016; Zhang et al., 2021; Zhang et al., 2024). Deep shale reservoirs have experienced complex structural and diagenetic changes in extreme temperature and pressure environments, leading to significant variability. Using fractal theory, the irregularity of pore surfaces can be quantitatively obtained. Fractal theory suggests that the fractal dimension usually falling within the range of 2–3. When the fractal dimension approaches 2, suggesting a more uniform pore structure, whereas a value nearing 3 indicates a more uneven pore structure, and increased reservoir heterogeneity.
Based on N2 adsorption data, geologists used various methods to calculate the fractal dimension. Among these models, the FHH model, introduced by the renowned French mathematician Mandelbrot, has been proven to be the most effective (Mandelbrot, 1975). The FHH model can be explained by the following mathematical formula:
In mathematical formula (1), V represents adsorption volume of N2 (cm3/g); P is the equilibrium pressure (Mpa); P0 represents the saturation pressure (Mpa); S represents the slope of the linear formula; C is a constant.
D can be determined by calculating the slope S of the linear equation, D=S+3.
4 Results
4.1 TOC and mineral composition
According to the TOC content provided in Table 1, shale samples in Well Z301 showcased a significant organic matter content. Specifically, the shale samples analyzed demonstrated TOC content ranging from 1.75% to 5.38% (averaged 3.68%). Except for sample Z-70-B (TOC=1.75%), all of the remaining eleven samples had TOC values exceeding 2%. According to the experimental results of XRD, quartz is the most predominant mineral, followed by clay, these two minerals making up 77.5% of the total mineral content according to Table 1 and Figure 2. Specifically, quartz varied from 27.6% to 67.5% (averaged 49.1%), while clay varied from 10.5% to 51.5% (averaged 28.5%). The I/S content of the clays ranged from 53% to 78% (averaged 66%), the Illite content from 12% to 44% (averaged 25%), and the Chlorite content from 0% to 20% (averaged 9%). Furthermore, the shale reservoir minerals included dolomite, feldspar, calcite, pyrite, with average contents of 9.6%, 5.0%, 4.6%, and 3.2%, respectively.
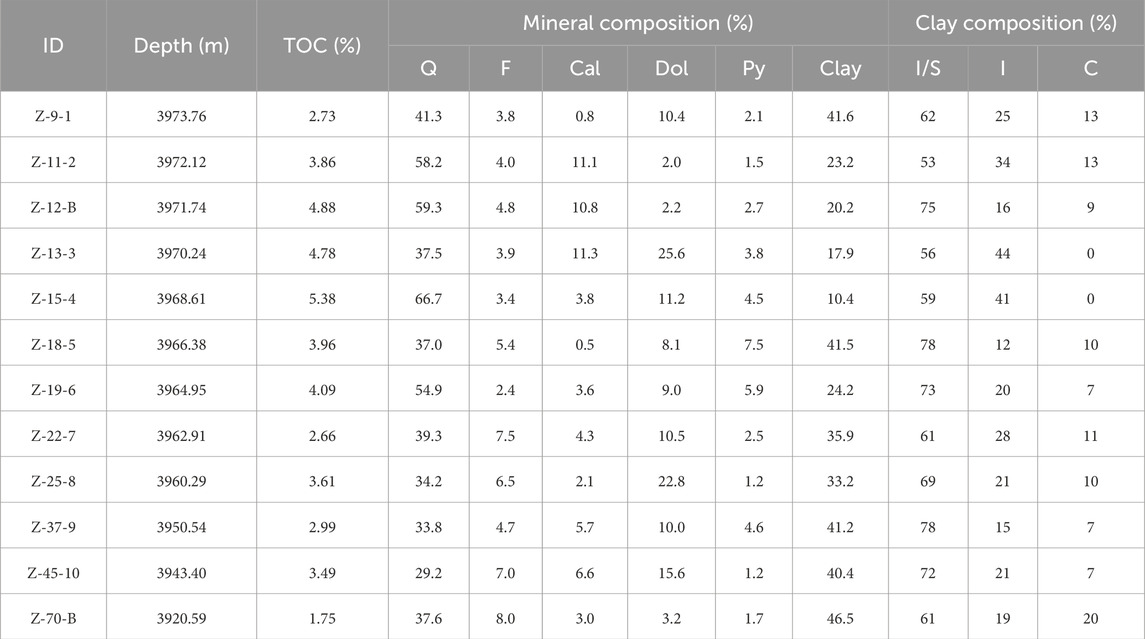
Table 1. TOC and mineral content of the 12 shale samples in Well Z301, Zigong region.
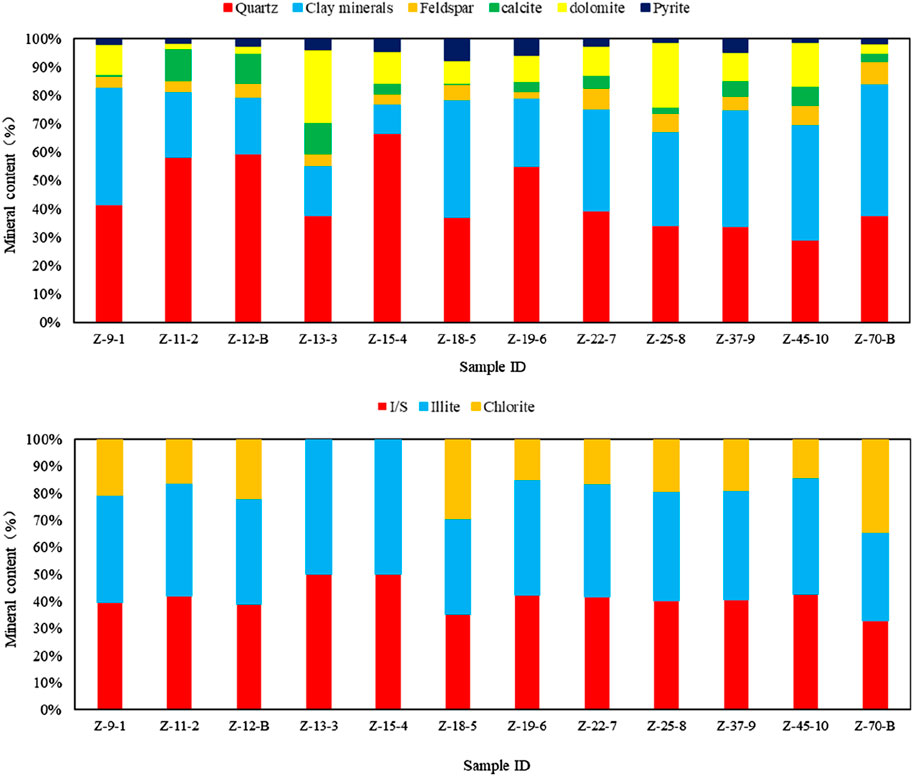
Figure 2. Mineral composition of the shale samples.
4.2 Low-temperature nitrogen adsorption (LTNA) experiment
4.2.1 N2 isotherms
Figure 3 displays the N2 isotherms of the twelve shale samples. In general, the isotherms display a reversed ‘S' shape. Based on the characteristics of the N2 isotherms shape, the International Union of Pure and Applied Chemistry divided it into five categories. According to the IUPAC’s criteria, the N2 isotherms of the twelve shale samples in Well Z301 consistent with a type IV isotherm (Ji et al., 2016; Song et al., 2023).
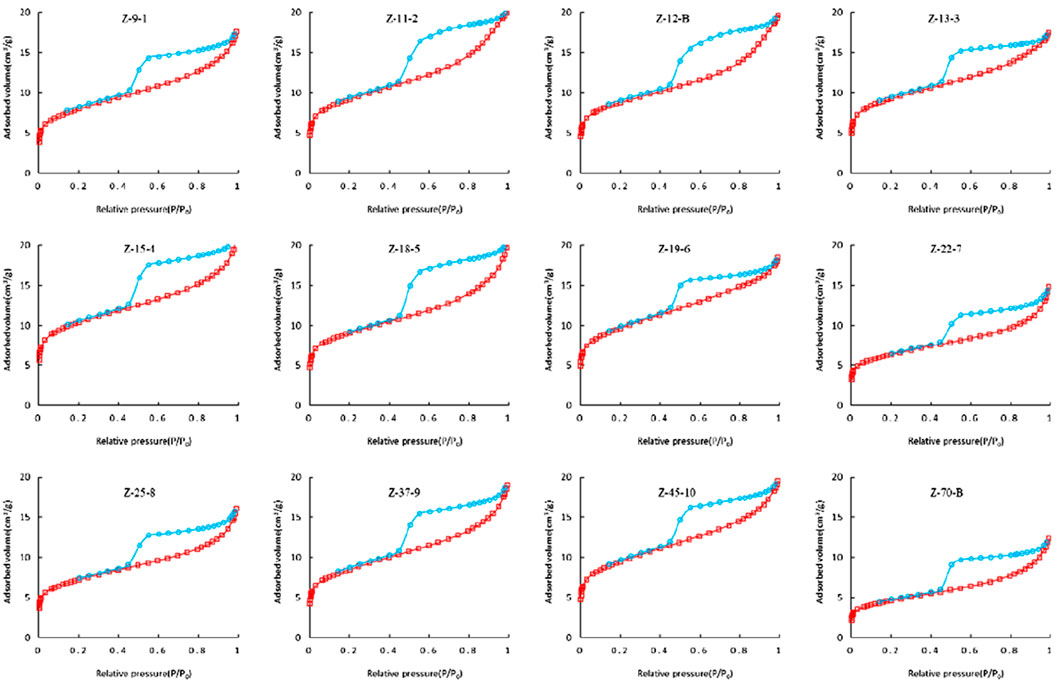
Figure 3. N2 isotherms of the shale samples.
Moreover, the N2 isotherms for adsorption and desorption exhibit a notable overlap at low pressures (P/P0<0.5). However, once the relative pressure surpasses 0.5, there is a clear divergence between the two isotherms, creating a distinct hysteresis loop. This loop offers insights into the pore types (Zhang et al., 2020; Zhang et al., 2021). As per the IUPAC’s criteria, the twelve hysteresis loops mostly display a combination of type H2 and type H3. The former (type H2), generally indicates the presence of ink bottle pores (small pore necks, big pore bodies); Whereas the latter (type H3), usually linked to slit pores (Zhang et al., 2020; Zhang et al., 2024).
4.2.2 Pore structure parameters
As is shown in Table 2, utilizing the adsorption curve data of LTNA, using the BET model, the N2 adsorption specific surface area (SSA) and average pore diameter (APD) were obtained. Additionally, using the BJH model, N2 adsorption pore volume (PV) was obtained. The SSA determined by BET model (BET-SSA) ranges from 19.39 m2/g to 37.40 m2/g (averaged 28.51 m2/g). The PV obtained through BJH model (BJH-PV) ranges from 0.0205 m3/g to 0.0337 m3/g (averaged 0.0295 m3/g). The APD determined by BET model (BET-APD) varies from 3.25 nm to 4.59nm, with an average of 3.77 nm.
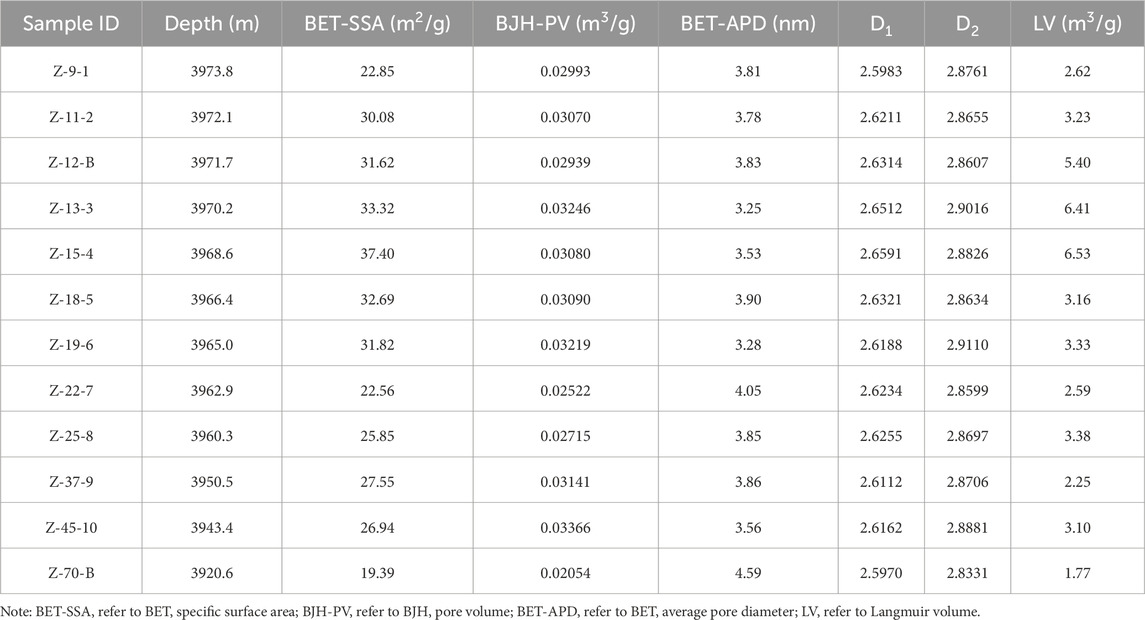
Table 2. Pore structure parameters, fractal dimension and Langmuir volume of the shale samples.
4.2.3 Pore size distribution (PSD)
Figure 4 illustrates the use of the DFT model in analyzing the shale pore size distribution in the research site. Both profiles of PV and SSA exhibit a distinct bimodal pattern. Micropores are evident on the left side of the pore volume curve, peaking at 1.3 nm, while mesopores dominate the range of 3–10 nm. Similarly, micropores peak at 1 nm on the left side of the specific surface area curve, with mesopores ranging between 2–5 nm on the right. Hence, micropores and mesopores with diameters less than 10 nm are the main causes of PV and SSA.
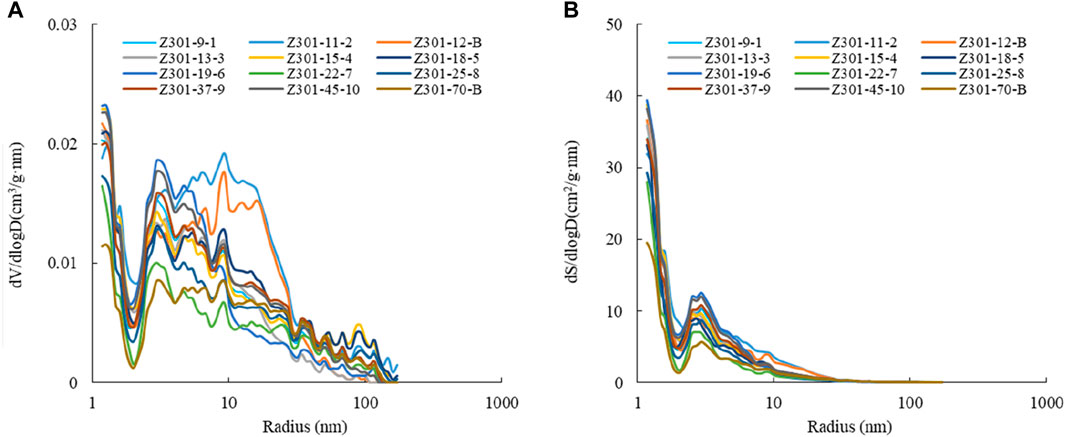
Figure 4. Pore size distribution curves, (A) for pore volume; (B) for specific surface area.
As shown in the quantitative calculation results in Table 3, mesopores account for the majority of the PV, followed by micropores, contribution rates of these two types of pores were 58.87% and 37.22%, and macropores’ contribution can be ignored (Figure 5A); A similar trend is observed for the SSA, where micropores and mesopores contribute 58.30% and 41.49%, respectively, while macropores only contribute 0.21% (Figure 5B).
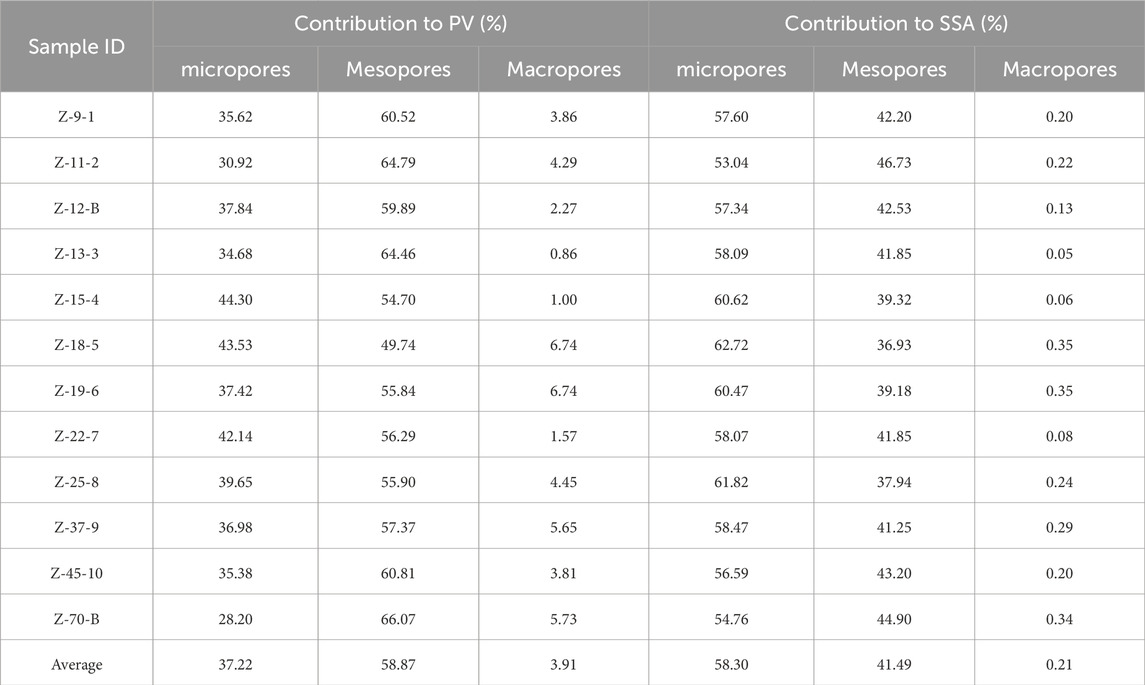
Table 3. Contributions of micro/meso/macro pores to PV and SSA.
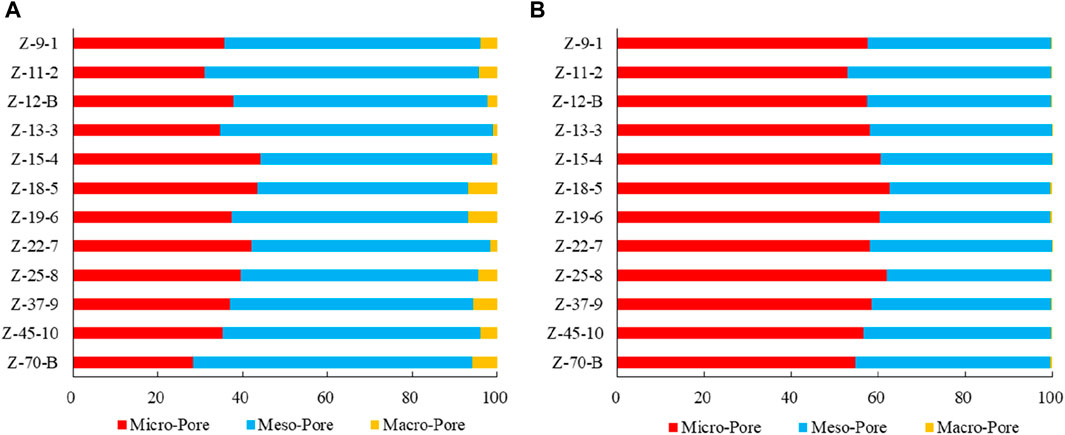
Figure 5. The contribution of micropore, mesopore and macropores (A) for PV; (B) for SSA.
4.3 CH4 adsorption isotherms
The occurrence of shale gas involves a significant aspect of adsorbed CH4, which is the result of physical adsorption between shale and CH4 (Yao et al., 2008; Gasparik et al., 2014; Li et al., 2016). Conducting CH4 adsorption experiments in laboratory settings is a common practice to determine the adsorption capacity of shale. The CH4 adsorption experiment consist of two stages: adsorption and desorption, which collectively define the behavior of CH4 occurrence in the reservoir. The main parameter that reflects this behavior is the quantity of adsorbed shale gas. By applying the Langmuir equation under varying pressure conditions, the volume of adsorbed CH4 can be calculated. The maximum capacity for CH4 adsorption, also known as the Langmuir volume, indicates the relationship between pressure and adsorption capacity.
As illustrated in Figure 6, the adsorption of CH4 increases gradually, with the increasing of pressure. It shows that the CH4 adsorption capacity nearly reaches its maximum as the pressure approaches 30 MPa. The adsorption values of CH4 ranging from 1.77 m3/t to 6.53 m3/t (averaged 3.65 m3/t). In general, shale with high TOC content tends to have a stronger methane adsorption capacity.
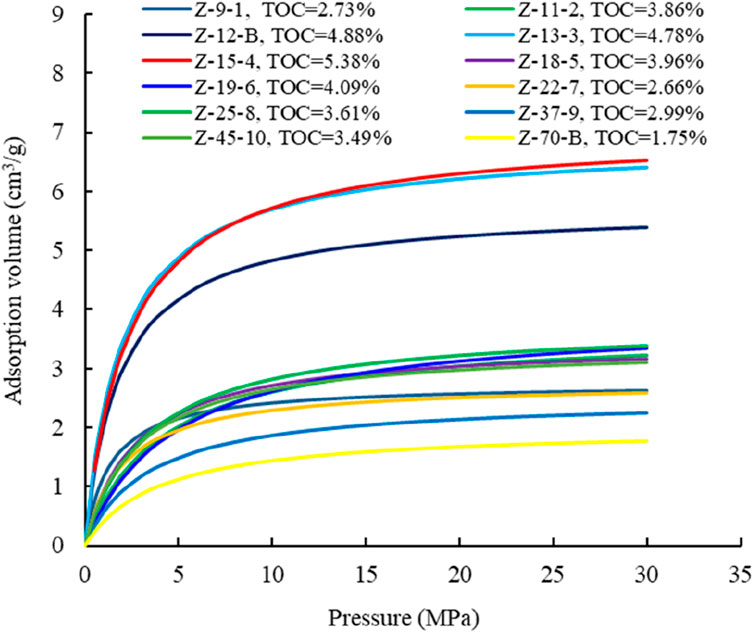
Figure 6. CH4 adsorption isotherms of the shale samples.
4.4 Fractal dimensions
As shown in Figure 7, there is a strong correlation between the double logarithm of the adsorption volume (V) and the relative pressure (P/P0). The double logarithmic curve can be clearly divided into two parts, indicating the existence of two types of fractal dimensions in shale pores (Wang et al., 2015). Therefore, taking relative pressure P/P0=0.5 as the boundary point, two types of fractal dimensions were calculated, namely, D1 and D2.

Figure 7. Results of fractal dimension calculation.
Table 3 displays the calculation results for D1 and D2. The range of D1 is between 2.5970 and 2.6591 (averaged 2.6238). Similarly, the range of D2 is from 2.8331 to 2.9110 (averaged 2.8735). These results show higher values compared to the shallow shale samples from YC area, southeastern edge of Sichuan Basin (Li et al., 2016). In this area, the average depth of the sample is 765.2m, the average D1 is 2.4146, and the average D2 is 2.6459. This implies that with the increasing of the burial depth for the shale sample, there is a development of a more intricate pore structure due to mechanical compaction (Li et al., 2016). Furthermore, the fractal dimension of the deep marine shale in Zigong region surpasses that of the continental shale found in the Dongying Sag (with D1 averaging 2.5245 and D2 averaging 2.6889), the continental shale from the Qingshankou Formation (D1 average of 2.3815, D2 average of 2.6892), the deep continental shale within the Lower Urho Formation in the central Junggar Basin (D1 averaging 2.5409, D2 averaging 2.7056), and the marine-continental transitional shale of the Leping Formation within the Qianjiang Basin (D1 averaging 2.5805, D2 averaging 2.6750) (Wang et al., 2015; Liu et al., 2019; Zhang et al., 2021). The comparison of pore fractal dimensions among various types of shale reveals that deep marine shale reservoirs in Zigong region exhibit the most complex pore structure and the highest level of heterogeneity.
5 Discussion
5.1 Relationships between TOC and mineral content
Insights into the original depositional setting during shale formation can be gleaned from its mineral composition. As quartz and clay are the most abundant minerals in shale gas reservoirs in the Zigong area, we focus on studying the relationship between these two minerals and TOC. A remarkable positive correlation is noticed between TOC and quartz (Figure 8A, R2=0.86), while a notable negative correlation is observed between TOC and clay (Figure 8B, R2=0.91). These results are in agreement with prior research on marine shale from the Niutitang and Longmaxi Formation, but contrast with findings from transitional marine and continental shale from the Shanxi Formation (Hu et al., 2016; Sun et al., 2016; Yang et al., 2017). Differences in depositional environments may account for these discrepancies. Transitional marine and continental shale are produced in shallow water sedimentary settings where organic matter derives primarily from higher plants. The proximity to land encourages the accumulation of organic matter and clay minerals sourced from terrestrial debris. In contrast, marine sedimentary environments have greater water depth and organic matter is predominantly sourced from lower aquatic organisms like algae. Consequently, the inflow of terrestrial debris is minimal. Furthermore, quartz in marine sedimentary settings are largely biogenic in origin and demonstrate a strong affinity with quartz during marine shale organic matter formation. Thus, TOC content in marine shale displays a positive correlation with quartz, while TOC in marine and continental shale is closely associated with terrigenous clast input (Chalmers et al., 2012; Sun et al., 2016; Yang et al., 2017).
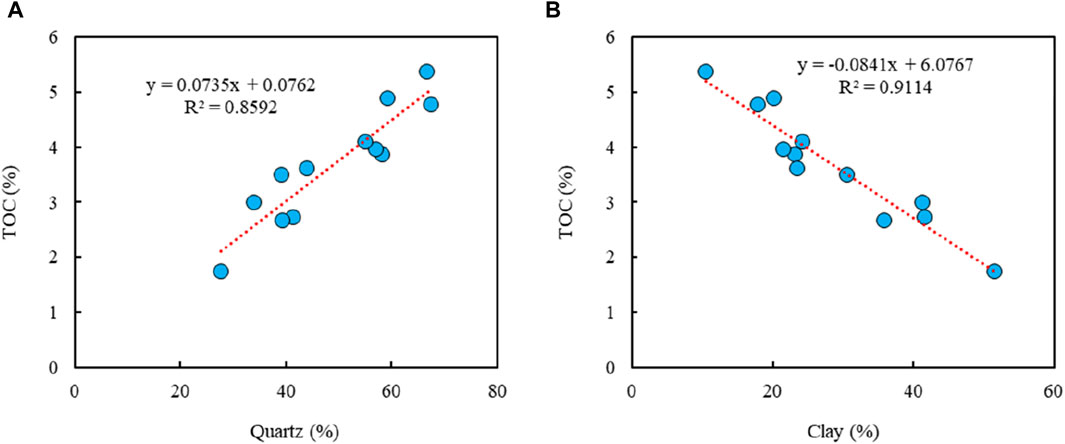
Figure 8. Relationships between TOC and mineral content. (A) For TOC vs. Quartz; (B) for TOC vs. Clay.
5.2 Relationships between TOC, mineral content and D
As illustrated in Figure 9, both D1 and D2 displayed positive correlations with the TOC, with R2 of 0.77 and 0.31, respectively (Figures 9A,B). As the TOC content increases, D gradually rises, as seen in studies on continental coal-measure shale in Nenjiang Formation and marine shale in Niutitang Formation (Yang et al., 2014; Zhang et al., 2024). This phenomenon is attributed to the formation of numerous organic micropores during the thermal evolution of sedimentary organic matter, which results in intricate pore structures (Ross and Bustin, 2009; Hu et al., 2016). Consequently, higher TOC content leads to an increase in shale micropore content, complexity of pore structure, and overall heterogeneity, ultimately resulting in a larger fractal dimension.
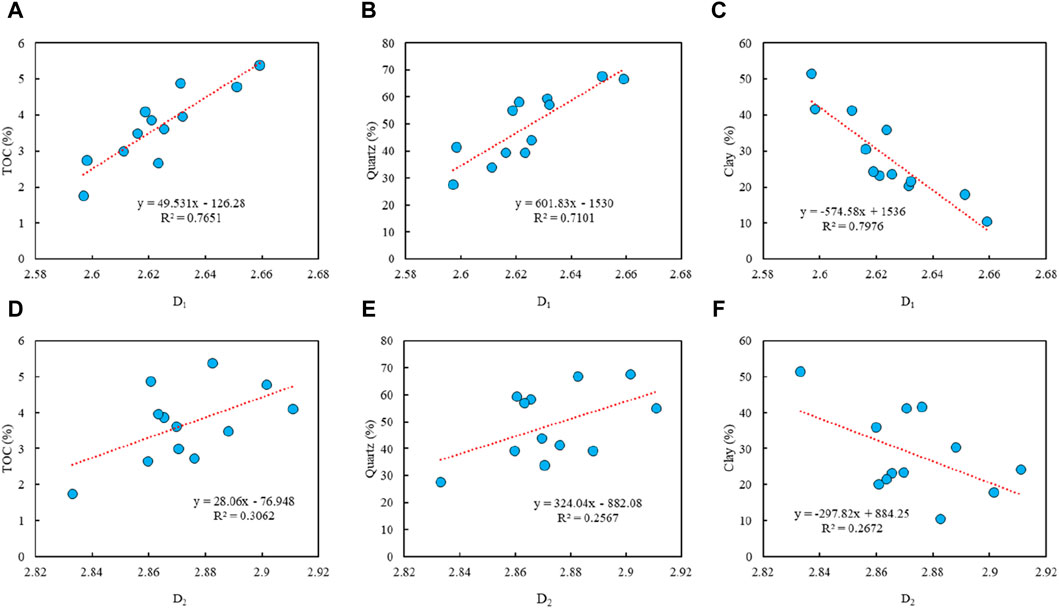
Figure 9. TOC/mineral content vs. D.
As is shown in Figures 9C,D, both of the fractal dimensions demonstrate a positive relationship with quartz content, with R2 of 0.71 and 0.26, respectively. This discovery is consistent with previous studies on Longmaxi Formation shale in Hunan and western Hubei. However, there is a contrasting outcome for Wufeng-Longmaxi shale in Yunnan and northern Guizhou, where an obvious negative correlation exists between shale samples’ D and quartz (Hu et al., 2016; Wang et al., 2022). This variance can be attributed to the prevalence of biogenic quartz the association between fractal dimension and quartz resembles that of fractal dimension and TOC content. Therefore, shale samples with higher quartz content showcase larger fractal dimensions. Conversely, as is represented in Figures 9E,F, both D1 and D2 show an adverse relationship with clay mineral (R2 of 0.80 and 0.27, respectively). This negative correlation may be due to the elevated clay content in shale samples, resulting in a higher presence of adsorbed water. Consequently, the pores become more uniform due to the penetration of water molecules (Yao et al., 2008).
5.3 Relationships between pore structure parameters and D
As shown in Figure 10, both D1 and D2 displayed positive correlations with BET-SSA and BJH-PV, while demonstrating a negative correlation with BET-APD. This discovery is consistent with prior studies, suggesting that shale pore structure heterogeneity is predominantly influenced by micropore content (Li et al., 2016). With an increase in micropore content, the BET-APD of shale samples decreases and the pore structure complexity escalates. Consequently, shale samples with higher micropore content showcase elevated BET-SSA and BJH-PV, leading to increased complexity and heterogeneity in reservoir pore structure, ultimately resulting in elevated D.
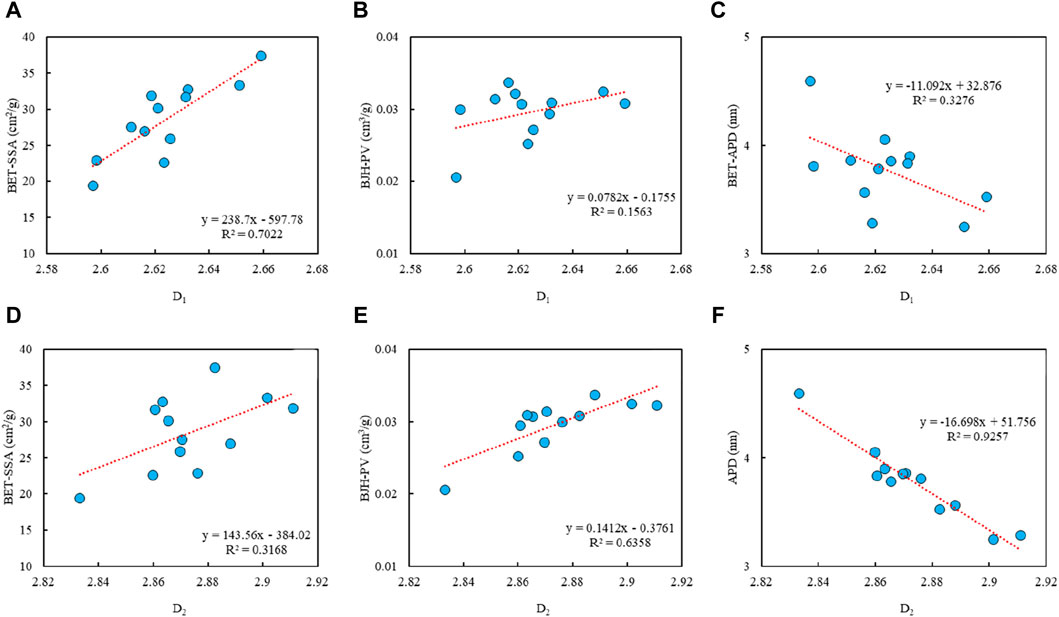
Figure 10. Pore structure parameters vs. D.
5.4 Relationships between LV and D
The Langmuir volume (LV) represents the adsorption capacity of the shale samples. For shale samples in Well Z301, an obvious positive relationship was found in Figure 11, indicating that LV increased when fractal dimension elevated, especially for LV vs. D1, and R2 were 0.73 and 0.24, respectively. This finding was different from the research on the fractal dimension of coal in the Hancheng area (Ordos Basin), but consistent with earlier investigations on shale in Niutitang Formation (Sichuan Basin) (Yang et al., 2014; Zhao et al., 2019). This discrepancy is due to the fact that shale’s CH4 adsorption capacity is predominantly depending on two factors: specific surface area and adsorption potential energy (Zhou et al., 1999; Yang et al., 2014). A larger D indicates a more intricate pore structure, and heightened heterogeneity of the pore surface, creating additional adsorption sites for CH4 molecules. As a result, a larger specific surface area leads to enhanced absorption capability. The adsorption potential energy is closely tied to the distance between CH4 molecules and the shale surface. The smaller the distance, the stronger the interaction force between CH4 molecules and the shale surface, and greater the adsorption potential energy. The distance The distance was correlated with pore diameter (Gregg and Sing, 1982). Therefore, the smaller the pore diameter, the more complex the pore structure, and the larger the fractal dimension.
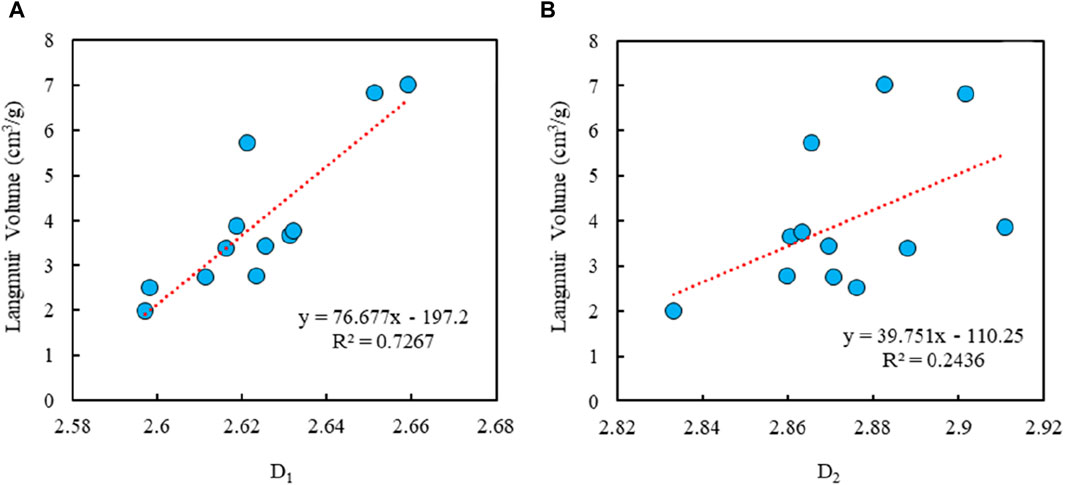
Figure 11. Relationships between LV and D.
6 Conclusion
(1) Shale samples in Z301 exhibited a high abundance of organic matter (TOC averaged 3.68%), and the predominant minerals in the shale samples were quartz and clay, with a combined content exceeding 75%; The quartz were mainly originated from biological sources, as relevant analysis shows that quartz increased with increasing TOC, while decreased with increasing clay.
(2) Shale samples in Well Z301 are predominantly ink-bottle/slit-shaped pores, primarily in the scale of nanometer, with micropores (r<2 nm) and mesopores (2<r<50 nm) playing a significant role in specific surface area and pore volume (the total contribution rates were 96.09% and 99.79%, respectively), while macropores’ contribution was minor.
(3) Organic pores were the predominant type of pores of shale samples in Well Z301, with pore volume and specific surface area both exhibited positive correlations with TOC and quartz, while showing a negative correlation with clay.
(4) Fractal dimension is influenced by multiple parameters Firstly, it showed positive relationships with specific surface area and pore volume, while displayed a negative relationship with average pore diameter. Additionally, it displayed positive relationships with TOC and quartz, while a negative relationship with clay. Moreover, fractal dimension is also positively associated with Langmuir volume. Micropores play a crucial role in creating a complex pore structure in shale. Micropores result in a larger specific surface area, expanded pore volume, and a more complex pore structure, ultimately increasing the fractal dimension of the pores. This enhanced fractal dimension is advantageous for the accumulation of shale gas.
Data availability statement
The original contributions presented in the study are included in the article/supplementary material, further inquiries can be directed to the corresponding author.
Author contributions
CZ: Writing–original draft, Writing–review and editing. ZB: Writing–review and editing. ZL: Writing–review and editing. YQ: Writing–original draft. LC: Writing–original draft. HW: Writing–original draft. YZ: Writing–review and editing. FF: Writing–original draft, Writing–review and editing.
Funding
The author(s) declare that no financial support was received for the research, authorship, and/or publication of this article.
Conflict of interest
Author CZ was employed by PetroChina Jilin Oilfield Company. Authors ZL, LC, HW, and YZ were employed by PetroChina Jilin Oilfield Company. Author YQ was employed by PetroChina.
The remaining authors declare that the research was conducted in the absence of any commercial or financial relationships that could be construed as a potential conflict of interest.
Publisher’s note
All claims expressed in this article are solely those of the authors and do not necessarily represent those of their affiliated organizations, or those of the publisher, the editors and the reviewers. Any product that may be evaluated in this article, or claim that may be made by its manufacturer, is not guaranteed or endorsed by the publisher.
References
Chalmers, G. R. L., Bustin, R. M., and Power, I. M. (2012). Characterization of gas shale pore systems by porosimetry, pycnometry, surface area, and field emission scanning electron microscopy/transmission electron microscopy image analyses: examples from the Barnett, Woodford, Haynesville, Marcellus, and Doig units. AAPG Bull. 96 (6), 1099–1119. doi:10.1306/10171111052
Chen, F., Zhao, H., Wang, S., Lu, S., Wang, M., Ding, X. J. O., et al. (2019a). Evaluation of movable shale oil reserves in the Es∼(1L) of the Raoyang sag. Jizhong Depression.
Chen, L., Jiang, Z., Liu, Q., Jiang, S., Liu, K., Tan, J., et al. (2019b). Mechanism of shale gas occurrence: insights from comparative study on pore structures of marine and lacustrine shales. Mar. Petroleum Geol. 104, 200–216. doi:10.1016/j.marpetgeo.2019.03.027
Clarkson, C., Freeman, M., He, L., Agamalian, M., Melnichenko, Y., Mastalerz, M., et al. (2012). Characterization of tight gas reservoir pore structure using USANS/SANS and gas adsorption analysis. Fuel 95, 371–385. doi:10.1016/j.fuel.2011.12.010
Clarkson, C., Solano, N., Bustin, R., Bustin, A., Chalmers, G., He, L., et al. (2013). Pore structure characterization of North American shale gas reservoirs;using USANS/SANS, gas adsorption, and mercury intrusion. Fuel 103 (1), 606–616. doi:10.1016/j.fuel.2012.06.119
Cui, R., Sun, J., Liu, H., Dong, H., and Yan, W. (2024). Pore structure and gas adsorption characteristics in stress-loaded shale on molecular simulation. Energy 286, 129658. doi:10.1016/j.energy.2023.129658
Cui, Y., Li, X., Guo, W., Lin, W., Hu, Y., Han, L., et al. (2023). Enlightenment of calcite veins in deep Ordovician Wufeng–Silurian Longmaxi shales fractures to migration and enrichment of shale gas in southern Sichuan Basin, SW China. Pet. explor. Dev. 50 (6), 1374–1385. doi:10.1016/s1876-3804(24)60473-8
Dou, W., Liu, L., Jia, L., Xu, Z., Wang, M., and Du, C. (2021). Pore structure, fractal characteristics and permeability prediction of tight sandstones: a case study from Yanchang Formation, Ordos Basin, China. Mar. Petroleum Geol. 123, 104737. doi:10.1016/j.marpetgeo.2020.104737
Gasparik, M., Bertier, P., Gensterblum, Y., Ghanizadeh, A., Krooss, B. M., and Littke, R. (2014). Geological controls on the methane storage capacity in organic-rich shales. Int. J. Coal Geol. 123, 34–51. doi:10.1016/j.coal.2013.06.010
Guo, X., Qin, Z., Yang, R., Dong, T., He, S., Hao, F., et al. (2019). Comparison of pore systems of clay-rich and silica-rich gas shales in the lower Silurian Longmaxi formation from the Jiaoshiba area in the eastern Sichuan Basin, China. Mar. Petroleum Geol. 101, 265–280. doi:10.1016/j.marpetgeo.2018.11.038
He, Z., Nie, H., and Hu, D. (2020). Geological problems in the effective development of deep shale gas: a case study of upper ordovician wufeng-lower silurian longmaxi formations in sichuan basin and its periphery. Acta Pet. Sin. 41 (4), 379–391.
He Zhiliang, L. H., and Jiang, T. (2021). Challenges and countermeasures of effective development with large scale of deep shale gas in Sichuan Basin[J]. Reserv. Eval. Dev. 11, (2), 1–11.
Hu, J., Tang, S., and Zhang, S. (2016). Investigation of pore structure and fractal characteristics of the lower silurian longmaxi shales in western hunan and hubei provinces in China. J. Nat. Gas Sci. Eng. 28, 522–535. doi:10.1016/j.jngse.2015.12.024
Ji, W., Song, Y., Jiang, Z., Meng, M., Liu, Q., Chen, L., et al. (2016). Fractal characteristics of nano-pores in the lower silurian longmaxi shales from the upper yangtze platform, south China. Mar. Petroleum Geol. 78, 88–98. doi:10.1016/j.marpetgeo.2016.08.023
Li, W., Lu, S., and Li, J. (2019). The coupling relationship between material composition and pore microstructure of southern China marine shale. Nat. Gas. Geosci. 30 (1), 27–38.
Li, W., Song, Y., Jiang, Z., Meng, M., Liu, Q., Chen, L., et al. (2016). Fractal characteristics of nano-pores in the lower silurian longmaxi shales from the upper yangtze platform, south China. Mar. Petroleum Geol. 78, 88–98. doi:10.1016/j.marpetgeo.2016.08.023
Li, X., Wang, Y., and Lin, W. (2022). Micro-pore structure and fractal characteristics of deep shale from wufeng formation to Longmaxi Formation in jingmen exploration area, hubei province. Nat. Gas. Geosci. 33 (4), 629–641.
Liu, J., Lu, D., and Li, P. (2019). Nano-scale dual-pore-shape structure and fractal characteristics of transitional facies shale matrix. J. Nat. gas Sci. Eng. 68, 102907. doi:10.1016/j.jngse.2019.102907
Loucks, R., Reed, R., Ruppel, S., and Jarvie, D. M. (2009). Morphology, genesis, and distribution of nanometer-scale pores in siliceous mudstones of the Mississippian Barnett Shale. J. Sediment. Res. 79 (12), 848–861. doi:10.2110/jsr.2009.092
Nie Haikuan, L. P., and Dang, W. (2022). Enrichment characteristics and exploration directions of deep shale gas of Ordovician-Silurian in the Sichuan Basin and its surrounding areas, China. Petroleum Explor. Dev. 49 (4), 648–659.
Qiu, H., Jiang, Z., Liu, Z., Chang, J., Su, Z., Yang, Z., et al. (2021). Difference in pore structure characteristics between condensate and dry shale gas reservoirs: insights from the pore contribution of different matrix components. J. Nat. Gas Sci. Eng. 96, 104283. doi:10.1016/j.jngse.2021.104283
Ross, D. J. K., and Bustin, R. M. (2009). The importance of shale composition and pore structure upon gas storage potential of shale gas reservoirs. Mar. Pet. Geol. 26, 916–927. doi:10.1016/j.marpetgeo.2008.06.004
Schmitt, M., Fernandes, C., Cunha Neto, J., Wolf, F. G., and dos Santos, V. S. (2013). Characterization of pore systems in seal rocks using nitrogen gas adsorption combined with mercury injection capillary pressure techniques. Mar. Pet. Geol. 39 (1), 138–149. doi:10.1016/j.marpetgeo.2012.09.001
Shi, X., Wu, W., and Hu, H. (2023). The whole apertures of deeply buried wufeng-longmaxi Formation shale and their controlling factors in luzhou district, Sichuan Basin. Earth Sci. 48 (1), 158–172.
Song, Y., Li, Z., and Jiang, Z. (2023). Preservation mechanism and model of marine shale gas in southern China. Acta Geol. Sin. 97 (9), 2858–2873.
Sun, M., Yu, B., Hu, Q., Chen, S., Xia, W., and Ye, R. (2016). Nanoscale pore characteristics of the lower cambrian Niutitang formation shale: a case study from well yuke# 1 in the southeast of chongqing, China. Int. J. Coal Geol. 154, 16–29. doi:10.1016/j.coal.2015.11.015
Teng, G., Lu, L., and Yu, L. (2021). Formation, preservation and connectivity control of organic pores in shale. Petroleum Explor. Dev. 48 (4), 687–699.
Wang, E., Guo, T., Liu, B., Li, M., Xiong, L., Dong, X., et al. (2022a). Lithofacies and pore features of marine-continental transitional shale and gas enrichment conditions of favorable lithofacies: a case study of Permian Longtan Formation in the Lintanchang area, southeast of Sichuan Basin, SW China. Petroleum Explor. Dev. 49 (6), 1310–1322. doi:10.1016/s1876-3804(23)60351-9
Wang, M., Xue, H., Tian, S., Wilkins, R. W., and Wang, Z. (2015). Fractal characteristics of upper cretaceous lacustrine shale from the songliao basin, NE China. Mar. Petroleum Geol. 67, 144–153. doi:10.1016/j.marpetgeo.2015.05.011
Wang, T., Tian, F., Deng, Z., and Hu, H. (2022b). Pore structure and fractal characteristics of Wufeng–Longmaxi formation shale in northern Yunnan–Guizhou, China. Front. Earth Sci. 10, 998958. doi:10.3389/feart.2022.998958
Wang Enze, G. T., Liu, Bo, et al. (2024). Geological features and key controlling factors of gas bearing properties of deep; marine shale in the Sichuan Basin. J. Central South Univ. Technol. 53 (9), 3615–3627.
Xie, W., Wang, M., Chen, S., Vandeginste, V., Yu, Z., and Wang, H. (2022). Effects of gas components, reservoir property and pore structure of shale gas reservoir on the competitive adsorption behavior of CO2 and CH4. Energy 254, 124242. doi:10.1016/j.energy.2022.124242
Yang, C., Zhang, J., Wang, X., Tang, X., Chen, Y., Jiang, L., et al. (2017b). Nanoscale pore structure and fractal characteristics of a marine-continental transitional shale: a case study from the lower Permian Shanxi Shale in the southeastern Ordos Basin, China. Mar. Pet. Geol. 88, 54–68. doi:10.1016/j.marpetgeo.2017.07.021
Yang, F., Ning, Z., and Liu, H. (2014). Fractal characteristics of shales from a shale gas reservoir in the Sichuan Basin, China. Fuel 115, 378–384. doi:10.1016/j.fuel.2013.07.040
Yang, F., Ning, Z., Wang, Q., and Liu, H. (2016b). Pore structure of Cambrian shales from the Sichuan Basin in China and implications to gas storage. Mar. Pet. Geol. 70, 14–26. doi:10.1016/j.marpetgeo.2015.11.001
Yang, R., He, S., Hu, Q., Sun, M., Hu, D., and Yi, J. (2017a). Applying SANS technique to characterize nano-scale pore structure of Longmaxi shale, Sichuan Basin (China). Fuel 197, 91–99. doi:10.1016/j.fuel.2017.02.005
Yang, R., He, S., Yi, J., and Hu, Q. (2016a). Nano-scale pore structure and fractal dimension of organic-rich Wufeng-Longmaxi shale from Jiaoshiba area, Sichuan Basin: investigations using FE-SEM, gas adsorption and helium pycnometry. Mar. Petroleum Geol. 70, 27–45. doi:10.1016/j.marpetgeo.2015.11.019
Yang, T., Tang, H., Wang, M., Guo, X., Shi, X., et al. (2024). Prediction of total gas content in low-resistance shale reservoirs via models fusion——taking the Changning shale gas field in the Sichuan Basin as an example. Geoenergy Sci. Eng. 235, 212698. doi:10.1016/j.geoen.2024.212698
Yao, Y., Liu, D., Tang, D., Tang, S., and Huang, W. (2008). Fractal characterization of adsorption-pores of coals from North China: an investigation on CH4 adsorption capacity of coals. Int. J. Coal Geol. 73, 27–42. doi:10.1016/j.coal.2007.07.003
Yu, W., Wang, L., Wang, J., Jiang, Z., and Jin, C. (2018). Characterization of organic matter pores in typical marine and terrestrial shales, China. J. Nat. Gas Sci. Eng. 49, 56–65. doi:10.1016/j.jngse.2017.11.002
Zhang, J., Han, D., Lin, W., Han, D., Wang, C., et al. (2024). Pore structure and fractal characteristics of coal-bearing cretaceous Nenjiang shales from songliao basin, Northeast China. Nat. Gas. Geosci. 35 (1), 119–132. doi:10.1016/j.jnggs.2024.03.005
Zhang, J., Tang, Y., He, D., Sun, P., and Zou, X. (2020b). Full-scale nanopore system and fractal characteristics of clay-rich lacustrine shale combining FE-SEM, nano-CT, gas adsorption and mercury intrusion porosimetry. Appl. Clay Sci. 196, 105758. doi:10.1016/j.clay.2020.105758
Zhang, L., Xiao, D., Lu, S., and Jiang, S. (2019a). Effect of sedimentary environment on the formation of organic-rich marine shale: insights from major/trace elements and shale composition. Int. J. Coal Geol. 204, 34–50. doi:10.1016/j.coal.2019.01.014
Zhang, L., Xiao, D., Lu, S., Jiang, S., Chen, L., Guo, T., et al. (2020a). Pore development of the Lower Longmaxi shale in the southeastern Sichuan Basin and its adjacent areas: insights from lithofacies identification and organic matter. Mar. Petroleum Geol. 122 (2), 104662. doi:10.1016/j.marpetgeo.2020.104662
Zhang, P., Lu, S., Li, J., Zhang, J., Xue, H., and Chen, C. (2017). Comparisons of SEM, low-field nmr, and mercury intrusion capillary pressure in characterization of the pore size distribution of lacustrine shale: a case study on the dongying depression, bohai bay basin, China. Energy and Fuels 31 (9), 9232–9239. doi:10.1021/acs.energyfuels.7b01625
Zhang, P., Lu, S., Zeng, Z., Chang, X., Li, J., Chen, G., et al. (2021). Pore structure and fractal character of lacustrine oil-bearing shale from the dongying Sag, bohai bay basin, China. Geofluids 2021, 1–19. doi:10.1155/2021/9945494
Zhang, S., Yan, J., Hu, Q., Wang, J., Tian, T., Chao, J., et al. (2019b). Integrated NMR and FE-SEM methods for pore structure characterization of shahejie shale from the dongying depression, bohai bay basin. Mar. Petroleum Geol. 100, 85–94. doi:10.1016/j.marpetgeo.2018.11.003
Zhao, J., Tang, D., Qin, Y., and Xu, H. (2019). Fractal characterization of pore structure for coal macrolithotypes in the hancheng area, southeastern ordos basin, China. J. Petroleum Sci. Eng. 178, 666–677. doi:10.1016/j.petrol.2019.02.060
Zhao, R., Xue, H., Lu, S., Li, J., Tian, S., wang, M., et al. (2022). Multi-scale pore structure characterization of lacustrine shale and its coupling relationship with material composition: an integrated study of multiple experiments. Mar. Petroleum Geol. 140, 105648. doi:10.1016/j.marpetgeo.2022.105648
Zheng, Y., Liao, Y., Wang, J., Xiong, Y., and Peng, P. (2024). Factors controlling the heterogeneity of shale pore structure and shale gas production of the Wufeng–Longmaxi shales in the Dingshan plunging anticline of the Sichuan Basin, China. Int. J. Coal Geol. 282, 104434. doi:10.1016/j.coal.2023.104434
Zhou, L., Lv, C., and Wang, Y. (1999). Physisorption of gases on porous solids at above-critical temperatures. Prog. Chem. 11, 221–226.
Zhu, H. J., Huang, C., Ju, Y. W., Bu, H., Li, X., Yang, M., et al. (2021). Multi-scale multi-dimensional characterization of clay-hosted pore networks of shale using FIBSEM, TEM, and X-ray micro-tomography: implications for methane storage and migration. Appl. Clay Sci. 213, 106239. doi:10.1016/j.clay.2021.106239
Zhu, H. J., Ju, Y. W., Qi, Y., Huang, C., and Zhang, L. (2018). Impact of tectonism on pore type and pore structure evolution in organic-rich shale: implications for gas storage and migration pathways in naturally deformed rocks. Fuel 228, 272–289. doi:10.1016/j.fuel.2018.04.137
Zou, C., Lin, M., and Ma, F. (2024). Natural gas industry development, challenges and strategies under carbon neutral target in China. Petroleum Explor. Dev. 51 (2), 1–18.
Keywords: deep marine shale, pore structure, fractal dimension, Longmaxi formation, Zigong region, Sichuan basin
Citation: Zhao C, Bao Z, Li Z, Qi Y, Chen L, Wang H, Zhang Y and Fang F (2024) Characterization and fractal characteristics of nano-scale pore structure in shale gas reservoirs: a case study of the deep Longmaxi Formation, Zigong region, Southern Sichuan Basin, China. Front. Earth Sci. 12:1410437. doi: 10.3389/feart.2024.1410437
Received: 01 April 2024; Accepted: 10 May 2024;
Published: 04 June 2024.
Edited by:
Hongjian Zhu, Yanshan University, ChinaReviewed by:
Kun Xie, Northeast Petroleum University, ChinaZhongwei Wu, Yangtze University, China
Ali Raza, University of Houston, United States
Copyright © 2024 Zhao, Bao, Li, Qi, Chen, Wang, Zhang and Fang. This is an open-access article distributed under the terms of the Creative Commons Attribution License (CC BY). The use, distribution or reproduction in other forums is permitted, provided the original author(s) and the copyright owner(s) are credited and that the original publication in this journal is cited, in accordance with accepted academic practice. No use, distribution or reproduction is permitted which does not comply with these terms.
*Correspondence: Feifei Fang, fangfeifei@cqust.edu.cn