Acoustic emission characteristics and fracture mechanism of sandstone in open-pit mines under different types of cyclic loads
 Qing Zhang1
  Ling Zhang
- 1College of Safety Science and Engineering, Xi’an University of Science and Technology, Xi’an, China
- 2Cathay Safety Technology Co., Ltd., Beijing, China
Rock mass is one of the most important load-bearing media in geotechnical engineering. It has been continually vulnerable to geological tectonic movements, natural calamities, and human excavation activities. Its inherent weak surfaces such as primary pores, joints, and fissures have resulted in varying damage degrees. In mining operations, the damaged rock mass has a variety of negative impacts on the stability of its overlying structures and is frequently disturbed by the load. To study the damage law of rock mass under cyclic loading, in this paper, an acoustic emission (AE) device was employed to monitor the rock under the action of two types of cyclic loads: the variable upper and lower pre-loads, and the fixed upper and lower pre-loads. The damage of the loaded rock was split into three stages in this research, based on the features of the AE signals of the rock under uniaxial load, and the damage evolution of the loaded rock was analyzed in distinct stages. The AE signals of the rock under cyclic loading were mainly emitted in the first loading stage. When the stress did not exceed the maximum stress value in the stress history of the loaded rock, few new AE event was generated in the loaded rock. After the low-frequency cyclic static load, the AE signals varied with the load-bearing stress of the rock during the whole process from initial loading to failure, which was consistent with the characteristics of the AE signals of the loaded rock. The research results can be adapted to rock mass in open-pit mines stability analysis and risk prediction while providing some references for the early warning and danger relief of rock masses in engineering.
1 Introduction
Rock mass in geotechnical engineering is not only affected by original pores (Liu X. S. et al., 2016; Zheng et al., 2024), joints (Shi et al., 2023a; Shi et al., 2023b), and fissures (Si et al., 2024), but also by geological tectonic movement (Qian et al., 2018a), natural disasters (Li N. et al., 2020; Wu et al., 2020), and human mining activities (Zheng et al., 2020). Although the load applied on the rock mass is not necessarily the same each time, usually, the rock mass is affected by the external load more than once (Song et al., 2020; Xin et al., 2021), such as close coal seam mining (Tan et al., 2010; Qian et al., 2022), double-arch tunnel construction (Luo et al., 2020), and so forth (Liu et al., 2020). The cyclic loads applied to the rock cause its interior in distinct degrees of damage state (Liu et al., 2016b), which have a negative effect on the mechanical properties of the rock mass (Ferrero et al., 2010; Zhu et al., 2022). It has the potential to induce the rock mass to lose its bearing capability, posing a significant hidden threat to the national economy and personal safety (Zheng et al., 2021a). Engineers and scientists place a high value on the research of rock damage under cyclic stress, which is critical for geotechnical engineering safety design and stability evaluation (Vaneghi et al., 2018; Chen W. et al., 2020).
Under the application of cyclic loading, the internal structure of the rock deteriorates to varying damage degrees, including the avianize of original flaws and the creation and propagation of cracks (Wu et al., 2020; Liu et al., 2021). These processes are accompanied by the deterioration of the microstructure of the rock (Wang et al., 2018), the reduction of macroscopic strength (Qian et al., 2018b), and energy dissipation (Marinelli et al., 2018). Due to the rock being a continuous opaque bearing medium, the structural state and damage in the rock under the load cannot be directly observed (Waples et al., 2004). Many scholars have extensively studied the strength change, deformation characteristics, and fracture mechanism of rocks under cyclic loading by means of numerical simulation (Borodii et al., 2010; Wei et al., 2020). However, the occurrence conditions and bearing characteristics of the rock mass are being simplified by the numerical simulation, and it is somewhat different between the calculated results and the actual engineering. In addition, some scholars adopt CT scanning to perform CT imaging of the loading process of the bearing rock (Ma et al., 2014; Sun et al., 2016). Nonetheless, the experimental results are limited by the accuracy of the operators, the expensive test, and the poor adaptability of the project site.
As the load on the rock grows, the internal cracks develop, extend, and penetrate, while wave signals that could be detected by sensors and carry a wealth of mechanical features of the rock are emitted (Yang et al., 2011; Zheng et al., 2021b). An in-depth analysis of these wave signals is necessary to study the mechanism of rock damage and fracture. The AE technology works on the basis of detecting the elastic wave released inside the rock during the loading process to monitor the test specimen constantly and in real-time (Liu et al., 2015; Zheng et al., 2019). The damage degree and fracture mechanism of the rock are investigated by studying the waveform signals emitted during the loading process (Li et al., 2016; Li Q. et al., 2020). This method of real-time monitoring of the loaded rock mass is closer to the actual project and has a wide range of applications, which can be applied to outdoor large-scale rock engineering.
The mechanical characteristics of rock mass under cyclic loading are related to the occurrence environment, bearing state, cycle times, and lithology (Kan et al., 2021; Li et al., 2021). Under the application of high-frequency cycle loads, the mechanical characteristics of rocks have been extensively studied, which not only enriches the rock mechanical theory, but also successfully guarantees engineering safety (Liu et al., 2020; Ghasemi et al., 2021). That notwithstanding, most of the maximum stress of the bearing rock mass in engineering is less than 80% of its bearing limit (Khaledi et al., 2016; Song et al., 2019). While the applied load is greater than 80% of its strength limit, the density of cracks in the rock is relatively high and the main crack has already formed an embryonic shape (Yang et al., 2022). At this time, the mechanical characteristics of rock mass change due to the variety of its internal structure (Zheng et al., 2021b). Furthermore, after the stress exceeded 80% of the bearing limit, the mechanical characteristics of the rock mass changed rapidly and could not be correctly characterized numerically. Therefore, the mechanical characteristics and AE response laws of rocks under low-frequency cyclic loading are studied in this article only.
In this paper, the cyclic loading was employed to apply to the rock, and the characteristics of the AE signals about the rock under the cyclic load were studied. Firstly, the characteristics of AE signals and fracture mechanism of rock under uniaxial load were studied. In the meanwhile, the uniaxial compressive strength of the rock was measured. Then, took the uniaxial compressive strength of the rock as a reference, cyclic loads with diverse pre-loads were applied to the rock, and the AE signals characteristics of the rock under the application of different cyclic loads were studied. Finally, the cyclic load with the fixed pre-load was applied to the rock, and the relationship between the characteristics of the AE signals about the rock under the cyclic load was studied more comprehensively. The research results can be used to the stability and risk prediction of rock mass, at the same time, provide some references to the early warning and danger relief of rock mass in engineering.
2 Experiment
In this study, the sandstone selected was cored from an open-pit mine in China adopting in-situ sampling as the research object. In the light of the standards specified by the International Society for Rock Mechanics, a standard cylindrical rock with a size of Φ 50 mm × h 100 mm was prepared. Of paramount importance is the mitigation of stress concentration on the sandstone during the loading procedure to ensure the precision of test outcomes. This was achieved by maintaining a flatness tolerance of both ends at less than 0.02 mm and ensuring a vertical error between the axis and the end faces of less than 0.001 rad. In addition, the sample of cyclic loading and unloading experiment also adopted this size.
The Rock Mechanics Test System (RMT-150B) was employed to test the strength of the sandstone and the cyclic loading as the loading system. The DS-5 AE device made in Ruandao Co. Ltd., which could store the AE parameters, was employed to monitor the loaded rock. In this experiment, eight sensors were employed for each rock to monitor and save AE signal parameters. The test process and device are shown in Figure 1.
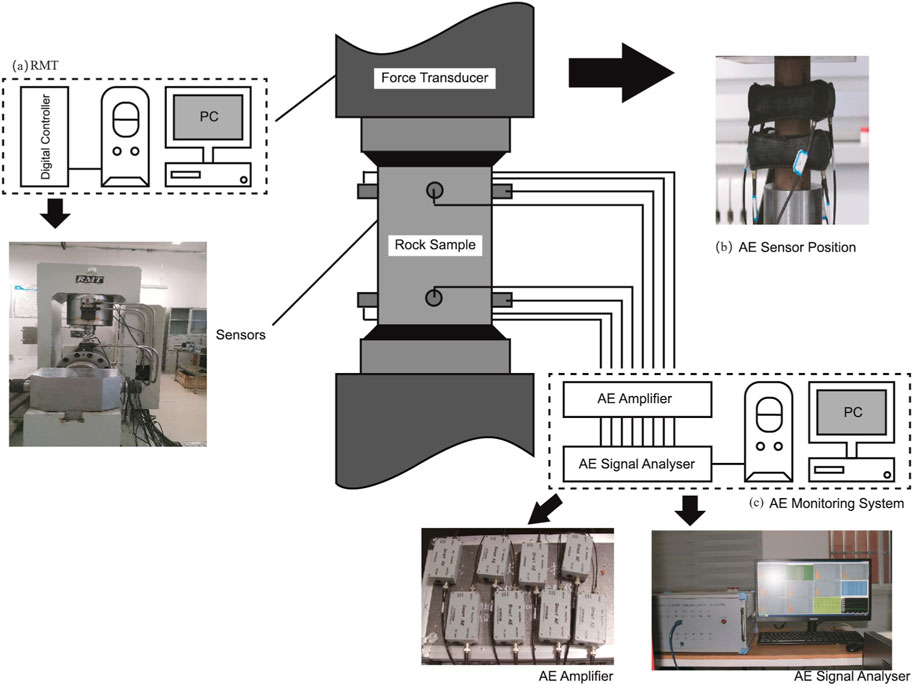
Figure 1. Test process and device. AE monitoring is carried out synchronously with uniaxial loading tests. (A) RMT rock mechanics testing system, (B) AE sensor probe deployment position, (C) AE detection system.
For the sake of enhancing the monitoring effect, Vaseline was uniformly applied to the rock of the pre-designed location to receive signals. To reduce errors caused by AE sensor deviations, the placement of sensors must be the same for different sandstone specimens. Sensors 1-4 are uniformly arranged in a clockwise manner at a distance of 15 mm from the upper-end face of the rock, while sensors 5-8 are also uniformly arranged in a clockwise manner at a distance of 15 mm from the lower-end face of the rock, and sensors one and five are along the same axis. At the start of the experiment, a lead-breaking test was carried out with a pencil lead as a simulated source to calibrate the positioning test of the AE source and the sound velocity measurement test, and at the same time to determine the sensitivity of the ceramic probe to the AE source. Moreover, interference from irrelevant sound sources such as collisions and frictions other than the loaded rock to be measured should be eliminated, and the monitoring should be started after the equipment was measured accurately. The acoustic emission and RMT work synchronously to complete the loading and monitoring test. The RMT applied load to the sandstone at an axial loading rate of 0.5 kN/s, and stored the mechanical test parameters in real-time. The AE monitoring system processed and stored the waveform signals monitored by the eight sensors, and obtained the waveform parameters of the sandstone under uniaxial load and the AE source location.
The cyclic loading experiment was based on the uniaxial compressive strength of the sandstone tested by the static mechanic’s experiment was recorded as
3 Results and discussions
3.1 Uniaxial compressive strength of sandstone
On the basis of the test results, as shown in Table 1, the rocks’ strength is summary. According to the uniaxial compressive test results of sandstone, the average strength
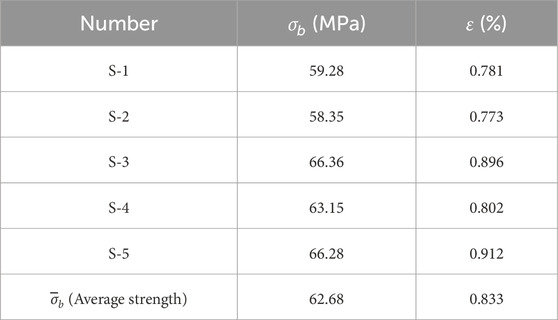
Table 1. Strength table of sandstone.
Combined with the rock mechanics theory, the loading process could be divided into four stages: original micro-pores were compacted and closed, elastic deformation stage, crack propagation stage, and the residual strength stage. The extent of damage at different stages was closely related to its internal structure and fracture mode. Thus, before studying the damage of the sandstone, it was necessary to shed light on the four stages of its mechanical characteristics in conjunction with the changes in the internal structure. The sandstone’s physical characteristics and diagenetic environment determined how the fissures were squeezed and closed in the previous four stages. As a result of the loading, the sandstone’s inherent micropores were gradually squeezed and closed. The solid mineral particles inside the rock performed a crucial role in resisting deformation when the load rose after the original micro-pores were closed. The deformation of the rock could be recovered with the removal of the load from now to the stage before the crack propagation, and the loaded rock was in the elastic deformation stage. Once the elastic period is through, the fractures in the rock begin to expand rapidly. As a result of the crack tip effect, the cracks expanded in size and caused secondary cracks, which in turn induced further cracks on a repeating basis. The number of fissures in the rock multiplied exponentially until the primary crack pierced the rock and lost bearing capacity. The appearance of the macroscopic mechanical features of the sandstone superficies was the result of the qualitative change caused by the quantitative change of the internal micromechanics of the sandstone under the load. As a result, the mechanical properties and failure process could be better understood by studying the changes in the meso-mechanical features of the sandstone under stress. These meso-mechanical features of sandstones under load could be obtained by real-time monitoring by AE in the form of waveform signals. Then, the sandstone AE parameters were studied to characterize the mechanical properties and fracture mechanism.
3.2 AE characteristics of loaded sandstone
The AE signal parameters AE energy, cumulative count, average frequency (AF), and rising angle (RA) provide an abundance of rock mechanics information, including the rock’s deterioration and fracture mechanism. The relationship between the time-stress-AE energy-accumulative count of AE events of the loaded sandstone was obtained by investigating the AE signals monitored during the uniaxial compression test of the sandstone, as shown in Figure 2, and the mechanical properties and fracture mechanism of the sandstone were studied. The AE signal of sandstone under load was classified into three phases based on the features of the AE signal curve: initially-emitting phase, stably-emitting phase, and rapidly-emitting phase.
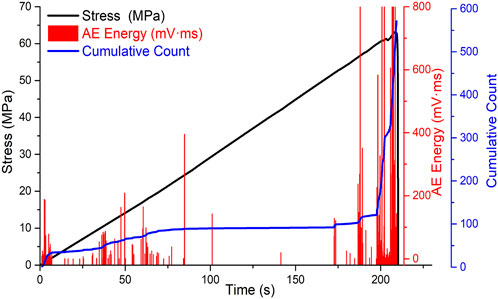
Figure 2. Relationship between the four parameters of the loaded sandstone AE signals. The characteristics of AE signals are divided into three stages: rapid increase in a short period first, then relatively gentle and with few events, and finally, rapid increase in a short period before destruction.
According to the AE signals features of sandstone, in the three phases of the AE signals features of the same loaded sandstone, the cumulative count per second, denoted as
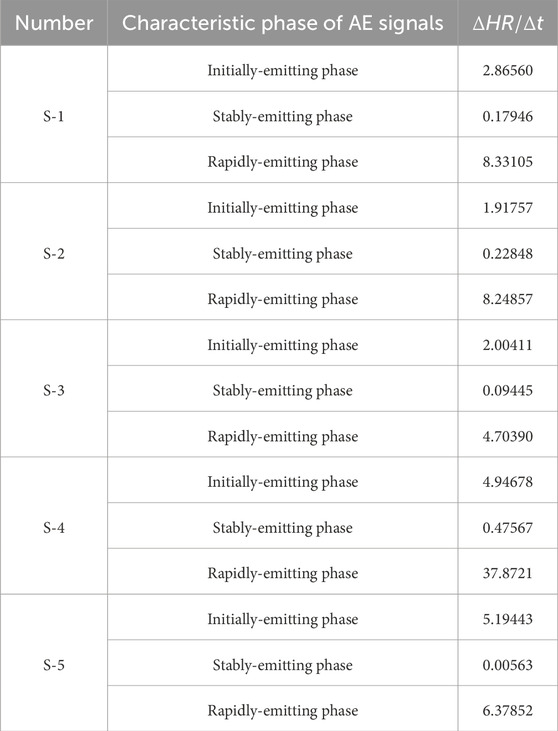
Table 2. Parameter characteristic table of different AE signal phases for different sandstones.
The AE events were predominantly emitted by the compaction and closure of the original micro-pores in the sandstone during the initially-emitting phase, that is, when the original micro-pores of the sandstone were compressed and closed. When the main pores were compressed and closed, the elastic wave energy was low, and the intensity of AE events was low compared to the other stages. As a result, the AE events in the loaded sandstone were intense at this phase, as shown in Figure 2. The
The loading sandstone attained the elastic deformation stage as the load increased. The elastic deformation of gravels dominated the rock’s deformation at this time, which was accompanied by the compacting and sealing of a small number of initial micro-pores, as well as the commencement of cracks in the local area. Meanwhile, as shown in Figure 2; Table 2, the loaded rock’s AE signals had the following features: the AE energy was relatively low but greater than the value in the initially-emitting phase, and the
The loaded sandstone entered the rapidly-emitting phase after cracks in various spaces within the sandstone began to grow rapidly with the application of the load, the cracks propagation induced secondary cracks, which gradually extended under the influence of the crack tip effect, and the cracked sandstone entered the rapidly-emitting phase. As demonstrated in Figure 2; Table 2, the values of AE energy and
The observed AE events were identified, as indicated in Figure 3, to validate the features of AE signals of sandstone under uniaxial force. It was possible to determine that the quantity and intensity of AE events in the loaded sandstone changed as stress increased by identifying AE events in the loaded sandstone. The AE event emitted from the loaded rock at the initially-emitting phase of loading, which was primarily produced by the compaction and closure of the major pores, as evidenced by the AE event location of the loaded rock. The elastic deformation of the gravels against the load produced the deformation of the loaded rock in the elastic deformation stage, and it could be recovered once the external force was withdrawn. As a result, there were fewer AE events during this stage. The interior fissures began to grow and produce secondary fractures while the loaded rock was in the plastic deformation stage, until the rock lost stability. The AE events generated by the loaded sandstone were the most powerful at this moment. This outcome was similarly identical to the one shown in Figure 2.
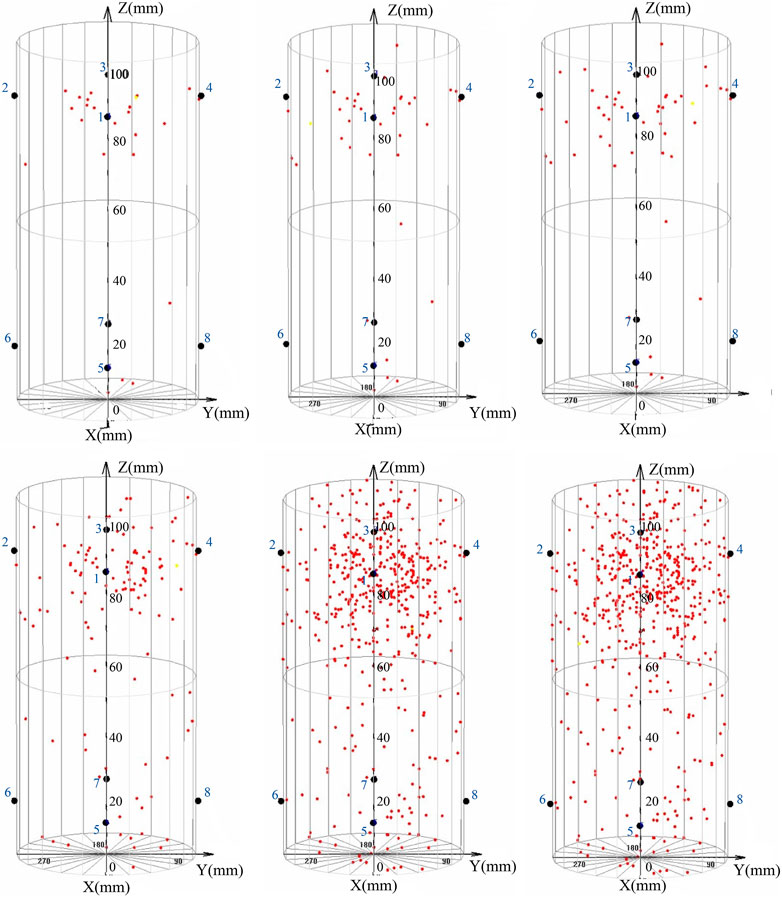
Figure 3. Location of AE events in the loaded rock. The number of AE events increases with the load rising, and the growth pattern also conforms to the AE signal characteristic curve in Figure 2. The blue numbers in the figure represent the position of the sensor probes, and the red dots are the position of the AE events.
The mechanical properties and damage laws of the loaded sandstone were examined by evaluating the AE signal parameters of the loaded sandstone. In reality, in geotechnical engineering, the stress on the rock mass was generally reciprocating. As a result, studying the mechanical features and AE signal features of the sandstone under uniaxial stress was insufficient to completely comprehend the damage characteristics and load-bearing laws of rock masses in geotechnical engineering. On the basis of the sandstone damage law and AE signal characteristics under uniaxial load analyzed above, this paper adopts different cyclic static load stress upper limits to apply to sandstone to study the rock damage and AE signal response law under low-frequency cyclic loading.
3.3 AE signal characteristics of sandstone under cyclic load
For the sake of better comprehensively grasping the AE signal characteristics of rocks under cyclic loading. In this paper, two methods of setting variable upper and lower limits, and the fixed upper and lower limits were used to carry out cyclic loading and unloading tests on rocks to study the mechanical properties and AE signal characteristics of rocks under different cyclic loading and unloading. In addition, the experimental results of the cyclic loading were verified by continuing the loading until the failure and instability after the cyclic loading.
First, analyzed the characteristics of AE signal of rock under the action of cyclic load with fixed upper and lower limits. In the light of the uniaxial compressive strength
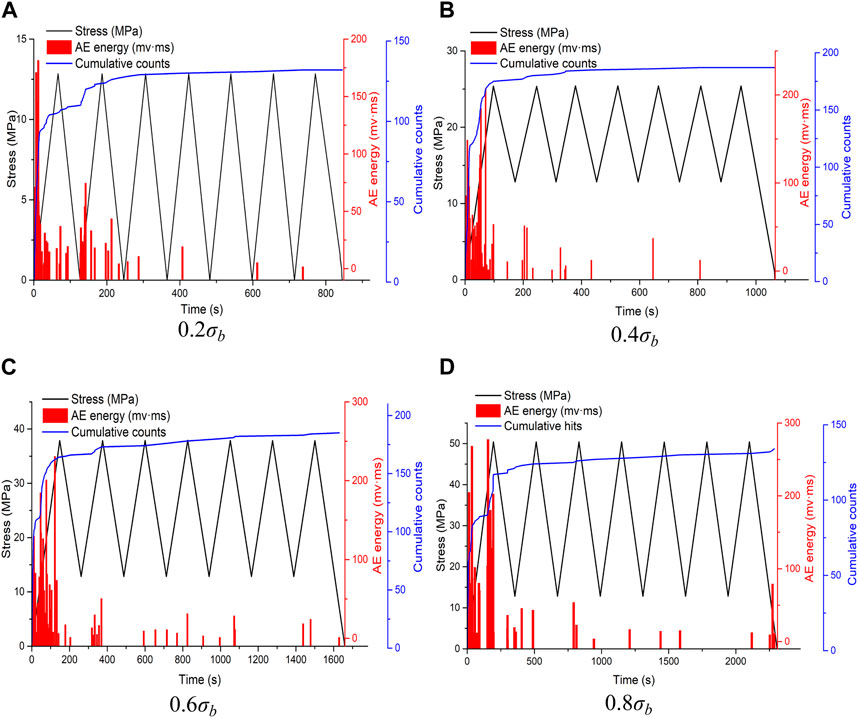
Figure 4. AE signal characteristics of rock under fixed upper and lower limit cyclic loading. AE events are mainly concentrated in the first loading stage and are almost rare after the completion of the first loading stage. (A) 0.2
It can be seen from the experimental results in Figure 4 that the rock is subjected to cyclic loads with different upper-stress limits. Excepted for the obvious AE events in the first loading and unloading stage, the proportion of AE events in the subsequent six stages was very small. In the first loading and unloading stage of sandstone, when the upper-stress limit was 0.2
In order to analyze the AE signal characteristics of the rock under cyclic loading with different upper-stress limits more intuitively, a loading method with a fixed lower limit and a variable upper limit was used to analyze the AE signal characteristics of the rock under the cyclic load. The lower-stress limit was 0, and the upper-stress limit was 0.2
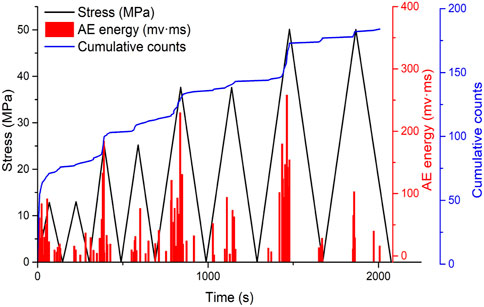
Figure 5. AE signal characteristics of rock under cyclic loading with variable upper limit and fixed lower limit. When the stress carried by the rock was greater than the maximum value in its stress history, new AE events were emitted.
The experimental results in Figure 5 further verified the AE signal characteristics of the rock under the action of cyclic loads with different upper-stress limits in Figure 4. Within the cyclic loading and unloading range of the same magnitude of upper-stress limit, the AE event mainly occurred in the loading phase of the first loading and unloading stage, and there were fewer AE events in the other stages within the range of this stage. When the bearing stress of the loaded rock was not greater than the maximum stress of the previous stage, there were few AE events in the loaded sandstone. As shown in the areas a, b, and c in Figure 5, within the range of the initial loading stage of each upper-stress limit, when the rock was at a stress level not greater than the previous upper-stress limit, there were almost no or very few AE events in the loaded rock. When the stress carried by the rock was greater than the maximum value in its stress history, a new AE event was emitted. This result was consistent with the test result in Figure 4.
By comparing the AE signal characteristics of the rock under different upper-stress limit cyclic loads in Figure 4 with Figure 2, it could be found that under different cyclic static load upper-stress limits, the AE signal characteristics of the rock in the initial loading stage were consistent with the corresponding AE signal characteristics in the range of not greater than the upper-stress limit in Figure 2. In order to compare the characteristic changes of the AE signal during the cyclic loading and unloading process more intuitively, the cyclic loading and unloading were used to continue loading until it was broken, as shown in Figure 6.
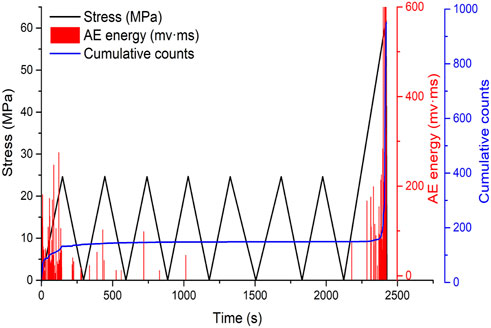
Figure 6. AE signal characteristics of rock failure and instability under fixed upper and lower limit cyclic loading. New AE events will only occur when the final stress exceeds the upper limit of the preceding cyclic load.
It can be seen from the experimental results in Figure 6 that from the end of the first loading and unloading phase to the last loading and before the destruction, AE events accounted for 1.58% of the total number of AE events, which was negligible compared with the total number of AE during the entire experiment. Compared with the experimental results of the AE signal characteristics of the rock under uniaxial load in Figure 2, except for the middle cyclic loading and unloading phase, the characteristics of the AE signals in the two figures are consistent with the increase in stress. In addition, in the cyclic loading and unloading phase, when the stress did not exceed the maximum value in its stress history, there were almost few new AE events in the rock. This result was also consistent with the results of the cyclic loading and unloading test in Figure 4.
By analyzing the experimental results of AE characteristics of rocks under equal upper and lower limit cyclic loads, it could be seen that the AE signal characteristics of rocks under low-frequency cyclic loading and unloading were related to the upper limit of cyclic static load stress. In addition, during the whole process of continuous loading and unloading of the rock after being cyclically loaded and unloaded by the low frequency and other upper and lower limits, the AE signal characteristics of the loaded rock under different stress levels were consistent with the AE signal characteristics of the rock under uniaxial load.
In order to analyze the AE signal characteristics of rock under cyclic loading more comprehensively. In addition to analyzing the AE characteristic test of rock under the action of fixed upper and lower limits cyclic load, the AE signal characteristic of rock under the action of variable upper and lower limit cyclic load should also be analyzed. Therefore, the next method is to change the upper and lower limits to analyze the characteristics of the AE signal of the rock under the cyclic load, as shown in Figure 7.
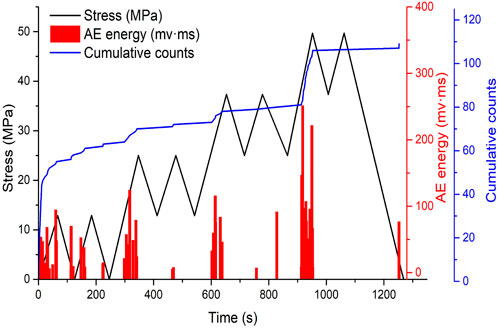
Figure 7. AE signal characteristics of rock under variable upper and lower limit cyclic loading.
From the test results shown in Figure 7, it can be seen that the AE signal characteristics of the loaded rock are similar to those in Figure 5. The difference from the test result in Figure 5 is that the lower stress limit in Figure 7 is not 0 but the upper stress limit in the last cyclic loading stage. Due to the difference in the lower stress limit, in the cyclic loading and unloading process of each stress upper limit in Figure 7, except for the first loading stage, the AE events in the rest are less than those in Figure 5. This is because under the influence of the loading equipment, when the stress is low, the loading device is disturbed by the unstable oil pressure, so the difference between Figures 5, 7 appears. Therefore, in order to reduce the error caused by the unstable oil pressure, a cyclic load with fixed upper and lower limits is used to act on the rock specimen, and the load is continued until the rock is crushed and becomes unstable, as shown in Figure 8.
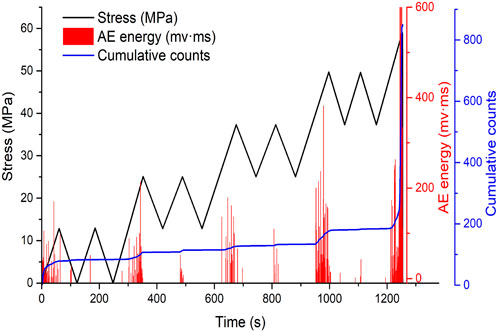
Figure 8. AE signal characteristics of rock failure and instability under variable upper and lower limit cyclic loading.
From the experimental results in Figure 8, the number of AE events emitted by the cyclic loading phase with distinct upper-stress limits could be seen intuitively. When the stress applied to the sandstone was greater than 0.8
The AE signal characteristics of the loaded rock in Figure 8, if it was regarded as the initial loading stage that only considered the cyclic load of each upper-stress limit, and connected them together until the rock was loaded and destroyed, the change rule of the AE signal characteristic during the whole process was consistent with Figure 2 of the loaded rock under uniaxial load. At the same time, the AE signal characteristics of the loaded rock under the action of low-frequency cyclic loading and unloading were also verified.
4 Conclusion
1. The AE accumulative count of rock under uniaxial load gradually increases, and its growth rate increases rapidly in a short period of time, then approaches 0 and remains unchanged, and finally increases sharply. AE energy increases sequentially in these three stages, and the last stage increases sharply.
2. For rocks under low-frequency fixed-upper limit cyclic loading, the AE event mainly occurs in the loading part of the first loading and unloading stage. For rocks under low-frequency fixed upper and lower limits cyclic loading, when the loading stress is not greater than the maximum value in the stress history of the loaded rock, few new AE events are generated in the loaded rock.
3. After the low-frequency cyclic static load, the AE signal changes with the load-bearing stress of the rock during the whole process from continuous loading to failure, which is consistent with the characteristics of the AE signal of the loaded rock under uniaxial load.
Data availability statement
The original contributions presented in the study are included in the article/Supplementary material, further inquiries can be directed to the corresponding author.
Author contributions
QZ: Conceptualization, Data curation, Formal Analysis, Investigation, Methodology, Software, Validation, Writing–original draft. LZ: Conceptualization, Funding acquisition, Investigation, Methodology, Project administration, Resources, Supervision, Writing–review and editing. XJ: Data curation, Formal Analysis, Visualization, Writing–review and editing.
Funding
The author(s) declare that no financial support was received for the research, authorship, and/or publication of this article.
Conflict of interest
Authors LZ and XJ were employed by Cathay Safety Technology Co., Ltd.
The remaining authors declare that the research was conducted in the absence of any commercial or financial relationships that could be construed as a potential conflict of interest.
Publisher’s note
All claims expressed in this article are solely those of the authors and do not necessarily represent those of their affiliated organizations, or those of the publisher, the editors and the reviewers. Any product that may be evaluated in this article, or claim that may be made by its manufacturer, is not guaranteed or endorsed by the publisher.
References
Borodii, M. V., and Adamchuk, M. P. (2010). Numerical simulation cyclic creep effect according to uniaxial loading programs. Strength Mater 42, 711–716. doi:10.1007/s11223-010-9258-5
Chen, W., Li, S., Li, L., and Shao, M. (2020a). Strengthening effects of cyclic load on rock and concrete based on experimental study. Int. J. Rock Mech. Min. Sci. 135, 104479. Article number: 104479. doi:10.1016/j.ijrmms.2020.104479
Chen, Y., Lin, H., Wang, Y., and Zhao, Y. (2020b). Damage statistical empirical model for fractured rock under freezing-thawing cycle and loading. Geofluids 2020, 1–12. Article ID: 8842471. doi:10.1155/2020/8842471
Ferrero, A. M., Migliazza, M., and Tebaldi, G. (2010). Development of a new experimental apparatus for the study of the mechanical behaviour of a rock discontinuity under monotonic and cyclic loads. Rock Mech. Rock Eng. 43, 685–695. doi:10.1007/s00603-010-0111-8
Ghasemi, S., Khamehchiyan, M., Taheri, A., Nikudel, M. R., and Zalooli, A. (2021). Microcracking behavior of gabbro during monotonic and cyclic loading. Rock Mech. Rock Eng. 54, 2441–2463. doi:10.1007/s00603-021-02381-7
Huang, D., Cen, D., Ma, G., and Huang, R. (2015). Step-path failure of rock slopes with intermittent joints. Landslides 12 (5), 911–926. doi:10.1007/s10346-014-0517-6
Kan, Z., Zhang, L., Li, M., Yuan, X., and Huang, M. (2021). Investigation of seepage law in broken coal and rock mass under different loading and unloading cycles. Geofluids 2021, 1–14. Article ID: 8127250. doi:10.1155/2021/8127250
Khaledi, K., Mahmoudi, E., Datcheva, M., and Schanz, T. (2016). Analysis of compressed air storage caverns in rock salt considering thermo-mechanical cyclic loading. Environ. Earth Sci. 75 (15), 1149. Article number: 1149. doi:10.1007/s12665-016-5970-1
Li, N., Li, B., Chen, D., Wang, E., Tan, Y., Qian, J., et al. (2020a). Waveform characteristics of earthquakes induced by hydraulic fracturing and mining activities: comparison with those of natural earthquakes. Nat. Resour. Res. 29, 3653–3674. doi:10.1007/s11053-020-09699-z
Li, Q., Liang, Y., Zou, Q., and Li, Q. (2020b). Acoustic emission and energy dissipation characteristics of gas-bearing coal samples under different cyclic loading paths. Nat. Resour. Res. 29, 1397–1412. doi:10.1007/s11053-019-09508-2
Li, X., Wang, E., Li, Z., Liu, Z., Song, D., and Qiu, L. (2016). Rock burst monitoring by integrated microseismic and electromagnetic radiation methods. Rock Mech. Rock Eng. 49 (11), 4393–4406. doi:10.1007/s00603-016-1037-6
Li, X., Wang, Y., Xu, S., Yang, H., and Li, B. (2021). Research on fracture and energy evolution of rock containing natural fractures under cyclic loading condition. Geofluids 2021, 1–13. Article number: 9980378. doi:10.1155/2021/9980378
Liu, Q., Xu, J., Liu, X., Jiang, J., and Liu, B. (2015). The role of flaws on crack growth in rock-like material assessed by AE technique. Int. J. Fract. 193, 99–115. doi:10.1007/s10704-015-0021-6
Liu, S., Li, X., Wang, D., Wu, M., Yin, G., and Li, M. (2020). Mechanical and acoustic emission characteristics of coal at temperature impact. Nat. Resour. Res. 29, 1755–1772. doi:10.1007/s11053-019-09562-w
Liu, S., Li, X., Wang, D., and Zhang, D. (2021). Experimental study on temperature response of different ranks of coal to liquid nitrogen soaking. Nat. Resour. Res. 30, 1467–1480. doi:10.1007/s11053-020-09768-3
Liu, X., Tan, Y., Ning, J., Tian, C., and Tian, Z. (2016). Energy criterion of abutment pressure induced strain-mode rockburst. Rock Soil Mech. 37 (10), 2929–2936. doi:10.16285/j.rsm.2016.10.026
Liu, X. S., Tan, Y., Ning, J. G., and Gu, Q. H. (2016a). Damage constitutive model based on energy dissipation for intact rock subjected to cyclic loading. Int. J. Rock Mech. Min. Sci. 85, 27–32. doi:10.1016/j.ijrmms.2016.03.003
Luo, Y., Gong, F., Li, X., and Wang, S. (2020). Experimental simulation investigation of influence of depth on spalling characteristics in circular hard rock tunnel. J. Central South Univ. 27 (3), 891–910. doi:10.1007/s11771-020-4339-5
Ma, T., and Chen, P. (2014). Study of meso-damage characteristics of shale hydration based on CT scanning technology. Petroleum Explor. Dev. 41 (2), 249–256. doi:10.1016/S1876-3804(14)60029-X
Marinelli, F., and Buscarnera, G. (2019). Anisotropic breakage mechanics: from stored energy to yielding in transversely isotropic granular rocks. J. Mech. Phys. Solids 129 (8), 1–18. doi:10.1016/j.jmps.2019.04.013
Qian, J., Wang, K., Zhang, H., Tan, Y., Xu, C., Wang, Q., et al. (2022). First observation of paired microseismic signals during solution salt mining. Front. Earth Sci. 10, 952314. Article number. doi:10.3389/feart.2022.952314
Qian, J., Zhang, H., and Westman, E. (2018). New time-lapse seismic tomographic scheme based on double-difference tomography and its application in monitoring temporal velocity variations caused by underground coal mining. Geophys. J. Int. 215, 2093–2104. doi:10.1093/gji/ggy404
Qian, Q., and Zhou, X. (2018b). Failure behaviors and rock deformation during excavation of underground cavern group for jinping I hydropower station. Rock Mech. Rock Eng. 51, 2639–2651. doi:10.1007/s00603-018-1518-x
Shi, H., Chen, W., Zhang, H., and Song, L. (2023a). A novel obtaining method and mesoscopic mechanism of pseudo-shear strength parameter evolution of sandstone. Environ. Earth Sci. 82, 60. Article number: 60. doi:10.1007/s12665-023-10748-y
Shi, H., Chen, W., Zhang, H., Song, L., Li, M., Wang, M., et al. (2023b). Dynamic strength characteristics of fractured rock mass. Eng. Fract. Mech. 292, 109678. doi:10.1016/j.engfracmech.2023.109678
Si, X., Luo, Y., and Luo, S. (2024). Influence of lithology and bedding orientation on failure behavior of “D” shaped tunnel. Theor. Appl. Fract. Mech. 129, 104219. Article number: 104219. doi:10.1016/j.tafmec.2023.104219
Song, S., Liu, X., Tan, Y., Fan, D., Ma, Q., and Wang, H. (2020). Study on failure modes and energy evolution of coal-rock combination under cyclic loading. Shock Vib. 2020, 1–16. Article number: 5731721. doi:10.1155/2020/5731721
Song, Z., Konietzky, H., and Herbst, M. (2019). Bonded-particle model-based simulation of artificial rock subjected to cyclic loading. Acta Geotech. 14 (4), 955–971. doi:10.1007/s11440-018-0723-9
Sun, W., Wu, A., Hou, K., Yang, Y., and Wen, Y. (2016). Real-time observation of meso-fracture process in backfill body during mine subsidence using X-ray CT under uniaxial compressive conditions. Constr. Build. Mater. 113, 153–162. doi:10.1016/j.conbuildmat.2016.03.050
Tan, Y. L., Zhao, T. B., and Xiao, Y. X. (2010). In situ investigations of failure zone of floor strata in mining close distance coal seams. Int. J. Rock Mech. Min. Sci. 47 (5), 865–870. doi:10.1016/j.ijrmms.2009.12.016
Vaneghi, R. G., Ferdosi, B., Okoth, A. D., and Barnabas, K. (2018). Strength degradation of sandstone and granodiorite under uniaxial cyclic loading. J. Rock Mech. Geotechnical Eng. 10 (1), 117–126. doi:10.1016/j.jrmge.2017.09.005
Wang, Y., Tang, J., Dai, Z., and Yi, T. (2018). Experimental study on mechanical properties and failure modes of low-strength rock samples containing different fissures under uniaxial compression. Eng. Fract. Mech. 197 (11), 1–20. doi:10.1016/j.engfracmech.2018.04.044
Waples, D. W., and Waples, J. S. (2004). A review and evaluation of specific heat capacities of rocks, minerals, and subsurface fluids. Part 1: minerals and nonporous rocks. Nat. Resour. Res. 13, 97–122. doi:10.1023/B:NARR.0000032647.41046.e7
Wei, P., Li, X., Hu, Q., Peng, S., and Liu, S. (2020). A trapezoidal three-dimensional model for gas extraction based on shapes of caved overlying strata and numerical calculation. Nat. Resour. Res. 29, 4031–4051. doi:10.1007/s11053-020-09677-5
Wu, J., Wong, H., Zhang, H., Yin, Q., Jing, H., and Ma, D. (2024). Improvement of cemented rockfill by premixing low-alkalinity activator and fly ash for recycling gangue and partially replacing cement. Cem. Concr. Compos. 145, 105345. doi:10.1016/j.cemconcomp.2023.105345
Wu, Y., Song, X., Ventura, C., and Lamd, F. (2020). Rocking effect on seismic response of a multi-story traditional timber pagoda model. Eng. Struct. 209, 110009. Article number: 110009. doi:10.1016/j.engstruct.2019.110009
Xin, X., Lei, F., ZhiyuZhang, S. G., Zhang, S., Zhang, Y., and Yihu, Z. (2021). Blasting relaxation characteristics of columnar jointed rock mass with AE technology. Arabian J. Geoscience 14, 2827. Article number: 2827. doi:10.1007/s12517-021-08975-3
Yang, S. Q., and Jing, H. W. (2011). Strength failure and crack coalescence behavior of brittle sandstone samples containing a single fissure under uniaxial compression. Int. J. Fract. 168, 227–250. doi:10.1007/s10704-010-9576-4
Zheng, Q., Hu, H., Yuan, A., Li, M., Wang, H., Wang, M., et al. (2020). Impact dynamic properties and energy evolution of damaged sandstone based on cyclic loading threshold. Shock Vib. 2020, 1–12. Article number: 6615602. doi:10.1155/2020/6615602
Zheng, Q., Qian, J., Zhang, H., Chen, Y., and Zhang, S. (2024). Velocity tomography of cross-sectional damage evolution along rock longitudinal direction under uniaxial loading. Tunn. Undergr. Space Technol. 143, 105503. Article number: 105503. doi:10.1016/j.tust.2023.105503
Zheng, Q., Xu, Y., Hu, H., Qian, J., Ma, Y., and Gao, X. (2021). Quantitative damage, fracture mechanism and velocity structure tomography of sandstone under uniaxial load based on acoustic emission monitoring technology. Constr. Build. Mater. 272, 121911. Article number: 121911. doi:10.1016/j.conbuildmat.2020.121911
Zheng, Q., Xu, Y., Hu, H., Qian, J., Zong, Q., and Xie, P. (2021). Fracture and tomography of velocity structures of sandstone under uniaxial loads. Chin. J. Geotechnical Eng. 43 (6), 1173–1182. doi:10.11779/CJGE202106010
Zheng, Q. Q., Cheng, Y. H., Zong, Q., Xu, Y., Li, F. H., and Chen, P. Y. (2019). Failure mechanism of different types of shotcrete based on modified Weibull distribution model. Constr. Build. Mater. 224, 306–316. doi:10.1016/j.conbuildmat.2019.07.071
Keywords: acoustic emission, cyclic loading, damage rock, rock mechanics, fracture mode
Citation: Zhang Q, Zhang L and Jiang X (2024) Acoustic emission characteristics and fracture mechanism of sandstone in open-pit mines under different types of cyclic loads. Front. Earth Sci. 12:1419604. doi: 10.3389/feart.2024.1419604
Received: 18 April 2024; Accepted: 14 May 2024;
Published: 05 June 2024.
Edited by:
Hao Shi, Anhui University of Science and Technology, ChinaReviewed by:
Pei Guo, National Institute of Clean and Low-Carbon Energy, ChinaNao Lv, Anhui University of Science and Technology, China
Copyright © 2024 Zhang, Zhang and Jiang. This is an open-access article distributed under the terms of the Creative Commons Attribution License (CC BY). The use, distribution or reproduction in other forums is permitted, provided the original author(s) and the copyright owner(s) are credited and that the original publication in this journal is cited, in accordance with accepted academic practice. No use, distribution or reproduction is permitted which does not comply with these terms.
*Correspondence: Ling Zhang, cstzhangling@163.com