The Interplay Between the Natural Number Bias and Fraction Magnitude Processing in Low-Achieving Students
 Frank Reinhold
 Andreas Obersteiner
 Stefan Hoch
 Sarah Isabelle Hofer
 Kristina Reiss1,3
- 1Heinz Nixdorf-Chair of Mathematics Education, TUM School of Education, Technical University of Munich, Munich, Germany
- 2Institute for Mathematics Education, University of Education, Freiburg, Germany
- 3Centre for International Student Assessment, Technical University of Munich, Munich, Germany
Research has identified two core difficulties many students have with fractions: first, they often struggle with processing fraction magnitudes, and second, they rely on natural number concepts in fraction problems [“Natural Number Bias” (NNB)]. Yet, the relation between these two difficulties is not well-understood. Moreover, while most studies of the NNB relied on analyses of whole samples, there is empirical evidence that the occurrence of the NNB differs between student subgroups. In the present study, we investigate individual students’ profiles of the occurrence of the NNB and their ability to process fraction magnitude, using a dynamic assessment that utilizes continuous diagrams on touchscreen devices. We analyze data of 234 low-achieving 6th-grade students from Germany who completed a symbolic fraction comparison task, and a fraction magnitude estimation task with continuous circle and tape diagrams. A cluster analysis on the comparison task revealed three distinct clusters: a Typical Bias cluster (better performance on symbolic fraction comparison items congruent to natural number-based reasoning), a Reverse Bias cluster (better performance on items incongruent to natural number-based reasoning), and a No Bias cluster (similar performance on congruent and incongruent items). Only students in the No Bias cluster but not students in the other clusters demonstrated a distance effect in symbolic fraction comparison, suggesting fraction magnitude processing. Linear mixed models on the percent absolute error in the magnitude estimation task revealed significantly lower percent absolute error for students in the No Bias cluster compared to students in the other two clusters. Students in the No Bias cluster were significantly slower to solve both fraction comparison and fraction magnitude estimation tasks than students in the other clusters. The results of this study suggest that the occurrence of the natural number bias and the ability to process fraction magnitude are closely related. The continuous representations used in our digital assessment tools appeared to be suitable for assessing both the natural number bias and fraction magnitude processing.
Introduction
Plenty of research has shown that many students struggle with learning of rational numbers, particularly of fractions (e.g., Behr et al., 1983; Siegler et al., 2011; Lortie-Forgues et al., 2015). Two major difficulties seem to be that students (1) are not sufficiently able to understand and process fraction magnitudes, and (2) rely on natural number principles when reasoning about rational numbers, causing Natural Number Bias (see Ni and Zhou, 2005 and see section “The Natural Number Bias as a Source of Individual Errors in Solving Fraction Problems”). While both difficulties have been discussed in the literature, there is still little evidence about the relation between the two. Moreover, most previous studies have used whole-sample analyses to study students’ difficulties, while research about individual students’ profiles is scarce (but see Rinne et al., 2017; Gómez and Dartnell, 2019; González-Forte et al., 2019). Another issue is that the tasks that have been used to assess fraction magnitude often allow the use of alternative strategies (e.g., number line estimation task) that may not solely require processing of fraction magnitude, or they actually require processing the magnitudes of two fractions instead of one fraction (e.g., fraction comparison task). Finally, performance on the fraction magnitude task may be affected by the presence of a natural number bias. The present study assesses individual students’ profiles (i.e., student subgroups) of natural number bias and investigates how these profiles are related to students’ ability of processing fraction magnitude.
The Natural Number Bias as a Source of Individual Errors in Solving Fraction Problems
Before students begin learning about rational numbers and fractions, they have acquired intense knowledge about natural numbers, both in informal contexts and in school contexts. Although natural numbers are—from a formal mathematical perspective—a subset of rational numbers, there are several properties that apply within the domain of natural numbers but not within the more general domain of rational numbers. Accordingly, relying on properties that apply within the natural numbers but not rational numbers in solving fraction problems can lead to systematic errors, a phenomenon that has been called Natural Number Bias (NNB, also referred to as Whole Number Bias; see Ni and Zhou, 2005). Researchers have studied the NNB in various dimensions, including the dimensions of representation, operation, density, and size (for an overview, see, for instance, Prediger, 2008; Van Hoof et al., 2015, 2018; Obersteiner et al., 2019a, c): for example, each natural number has a unique symbolic representation, while each rational number has infinitely many symbolic representations (e.g., 1/2 = 2/4 = 3/6 = 0.5, etc.). An example regarding operation is that while multiplying natural numbers always makes numbers bigger, this is not generally true for rational numbers. Regarding density, although there are only infinitely many numbers between any two natural numbers, and every natural number has a unique predecessors and successors, there are infinitely many numbers between any two rational numbers, and rational numbers do not have predecessors or successors.
In this study, we focus on the dimension of size or magnitude. Processing the numerical magnitude of a natural number is fairly straightforward considering the base-ten system, and comparison tasks can be solved with digit-by-digit comparison strategies. For example, 36 is larger than 28 because 3 (tens) is larger than 2 (tens). In contrast, processing the numerical magnitude of a fraction requires reasoning about the numerical relation between two natural numbers, and considering this relationship as another (rational) number. Comparing two fractions requires comparison of two such relationships and considering each fraction as one (holistic) number rather than considering the numerator and denominator as two distinct numbers. Moreover, these comparisons can be counterintuitive, because the fraction with the larger natural numbers is not necessarily the larger fraction (e.g., 7/8 > 2/3) but can also be the smaller fraction (e.g., 3/5 < 2/3). When comparing two fractions, students often rely on simple comparisons of natural number components—the numerators and the denominators—and do not consider the actual fraction magnitudes. Such natural number-based reasoning would lead to correct responses in problems that are “congruent” (i.e., in which the larger fraction is composed of the larger natural numbers), and to incorrect responses in problems that are “incongruent” (i.e., in which the larger fraction is composed of the smaller natural numbers). Many studies found that people are indeed more accurate (e.g., Vamvakoussi and Vosniadou, 2004) and/or faster (e.g., Van Hoof et al., 2013) to solve fraction problems that are congruent than problems that are incongruent. This NNB in fraction comparison seems to be very persistent. It has been documented in younger and older students (e.g., Van Hoof et al., 2018) as well as in college students (e.g., DeWolf and Vosniadou, 2011), university students (Gómez et al., 2017) and—in some types of problems—even in academic mathematicians (Obersteiner et al., 2013).
In most earlier studies, the NNB was assessed as the average performance difference between congruent and incongruent problems across the whole sample. Such an analysis may mask individual profiles that may deviate from the pattern of performance found on the group level. In fact, studies that did use a person-centered approach identified individual differences in bias patterns (Rinne et al., 2017; Gómez and Dartnell, 2019; González-Forte et al., 2019): while a fairly large number of students showed a strong typical NNB, i.e., better performance on congruent than incongruent items (Gómez and Dartnell, 2019), other students showed no NNB or even a reverse NNB, i.e., better performance in incongruent than congruent comparison items. Students showing a reverse NNB seem to consider the fractions with smaller components to be the larger fraction. An interpretation for that pattern is that these students have a partial—yet still incomplete—understanding of fraction magnitude. As Rinne et al. (2017, p. 14) argue, these students may “recognize that larger numbers can somehow lead to smaller fraction magnitudes, but they do not fully understand the relationship between numerator and denominator.”
González-Forte et al. (2019) showed that profiles derived from accuracy and response time measures (as reported in the studies above) were highly consistent with students’ verbal explanations they gave in interviews when asked to compare fractions. This suggests that quantitative person-oriented statistical approaches may also be apt for characterizing individual students’ reasoning.
While the studies mentioned above have identified individual differences in NNB profiles, Rinne et al. (2017) studied how these profiles develop within individuals over time. In their longitudinal study, they found that some students changed their bias patterns between grade four and grade six. Most students shifted from a typical NNB to either a reverse NNB or normative, correct reasoning. The authors suggest that NNB patterns—the typical and the reverse—might be usual steps within a learning trajectory from natural numbers to fraction concepts.
In sum, person-centered approaches are necessary to identify meaningful individual differences in NNB patterns. A related—and still open—question is to what extent students with different bias patterns also differ in terms of magnitude processing.
Assessing Fraction Magnitude Processing
There are multiple ways to interpret the meaning of a fraction, for instance, as a ratio, part of a whole, division, or measurement (e.g., Behr et al., 1983). Fraction magnitude refers to the aspect that a fraction represents one numerical value. To assess whether people are able to activate fraction magnitude, researchers have sought to use tasks that actually require fraction magnitude processing. Two frequently used tasks are symbolic fraction magnitude comparison and number line estimation (e.g., Schneider and Siegler, 2010; Schneider et al., 2018a). Performance on both of these tasks was found to correlate with mathematical competence (Schneider et al., 2018b, see also Schneider et al., 2018a for a detailed review of number line estimation regarding fractions, and Schneider et al., 2017 for a detailed review of numerical magnitude processing). Yet, to our knowledge, research comparing the performance between symbolic magnitude comparison and number line estimation regarding fractions is sparse (Schneider et al., 2018b; but see Hamdan and Gunderson, 2017, for evidence of a transfer between number line training and fraction comparison task, suggesting that there is a relation between both tasks at a whole population level).
In the first frequently-used task to assess fraction magnitude processing—symbolic fraction comparison—people are asked to decide which of two fractions represents the larger number. The distance effect is the effect that the smaller the numerical distance between the two to-be-compared fractions, the more difficult the item. The size of this effect is often used as an index of magnitude processing (see Schneider et al., 2017). There is empirical evidence that such a distance effect may be present both regarding accuracy (e.g., Sprute and Temple, 2011) and response times (e.g., Meert et al., 2010). However, empirical evidence is still missing whether a distance effect is present in students showing an NNB. When utilizing symbolic fraction comparison to assess fraction magnitude processing, the following issues should be considered.
As the comparison task involves two fractions by design, the use of certain comparison strategies such as benchmarking may make a distance effect less likely to occur. Benchmarking refers to the use of transitive thinking to compare the two fractions of interest to a third number (Post et al., 1986; Clarke and Roche, 2009). When comparing the size of one proper fraction (those smaller than 1, e.g., 8/9) and one improper fraction (those larger than one, e.g., 7/6), one may easily compare both fractions to 1 (i.e., use a transitive benchmarking to 1 strategy) by simply noticing whether the numerator or the denominator of the respective fraction is bigger, instead of directly comparing the two fraction magnitudes. Although such a strategy relies on fraction magnitude processing to some extent (i.e., noticing that fractions are smaller or larger than 1) comparison items that afford benchmarking to 1 are probably easier to solve regardless of the distance between the two fractions. Thus, participants applying such a benchmarking to 1 strategy may rely on fraction magnitude processing and yet not show a distance effect.
Furthermore, the assumption that students activate fraction magnitudes in fraction comparison tasks may not hold for comparison tasks with common components (e.g., 5/8 vs. 3/8, or 4/9 vs. 4/7). In these tasks, students may rather rely on processing the natural number magnitudes of the non-common components (Obersteiner and Tumpek, 2016). This possible absence of fraction magnitude processing in items with common components may play an important role in distinguishing between students’ response patterns in comparing fractions with and without common components: for instance, Gómez and Dartnell (2019) found that there are students who show a persistent typical NNB when comparing fractions with common components (e.g., 4/15 vs. 4/6) but no NNB when comparing fractions without common components (e.g., 5/6 vs. 8/19). Thus, it may be argued that those students process fraction magnitude only when the fractions do not have common components. This suggests that fraction magnitude processing in symbolic fraction comparison might be dependent on specific problem features (see Obersteiner et al., 2020).
Most important for the present study, it seems possible that students showing a persistent NNB might not use fraction magnitude processing when comparing two fractions, since they do not view fractions as holistic symbols but as distinct numbers in the specific task of symbolic magnitude comparison. This makes the assessment of fraction magnitude processing in students who show a persistent (typical or reverse) NNB a particular challenge: in these students, the absence of a distance effect in the fraction comparison task may suggest that they do not process fraction magnitude when comparing two fractions, but it does not answer the question to what extent they are at all able to process magnitudes of individual fractions. Assessing the extent of fraction magnitude processing in students with diverse NNB patterns (i.e., typical or reverse) is relevant because the study by Rinne et al. (2017) suggests that NNB patterns may go hand in hand with qualitatively different levels of understanding of fraction magnitudes. Therefore, different approaches seem necessary to assess the potentially gradual differences in fraction magnitude processing in low-achieving students that exhibit an NNB (whether typical or reverse). This motivates the use of tasks aiming at processing the magnitudes of single fractions.
The second frequently-used task to assess fraction magnitude processing is number line estimation. In this task, participants are asked to place fractions on an empty number line where only the start and end points but no other numbers are marked. Accordingly, number line estimation requires assessing the magnitude processing of one single fraction at a time. The relevant measure is the percent absolute error, which is the deviation between the student’s estimated position and the correct position of the given fraction divided by the length of the number line (see Schneider et al., 2018a).
Although number line estimation tasks have often been used in research, some researchers have argued that this task may also not be a pure measure of fraction magnitude. One reason is that number line estimation tasks can be solved by dividing the number line and counting the resulting pieces, a strategy that is not directly based on fraction magnitude (i.e., “fractions as measures,” see Kieren, 1976; Novillis-Larson, 1980; Bright et al., 1988; also referred to as “line segmentation,” see Schneider et al., 2018b). Another reason is that one can use strategies such as rounding, counting or proportional reasoning (Jeong et al., 2007; Boyer et al., 2008; Boyer and Levine, 2015). On the other hand, one could argue that these latter strategies also require the processing of fraction magnitude to some extent (Schneider et al., 2018a).
Some of these issues may be overcome by using various visual representations that are more intuitive and less formal than number lines, such as circle and tape diagrams (e.g., Carraher, 1993). Such visual representations can be used in continuous or discretized forms. Continuous representations are diagrams with no given partition (e.g., continuous circle or tape diagram, Hoch et al., 2018b; see also Jeong et al., 2007; Boyer et al., 2008; Boyer and Levine, 2015; DeWolf et al., 2015). Discretized representations are “subdivided into equal-sized units … to render them measurable by counting” (DeWolf et al., 2015, p. 128). Discretized representations do not seem to be appropriate to assess fraction magnitude processing because they are more likely to activate counting schemes and encourage people to “ignore the perceptual relation of the relevant quantities” (Jeong et al., 2007, p. 238). They may thus distract individuals from processing fraction magnitude (DeWolf et al., 2015). Continuous diagrams, on the other hand, do not allow for counting (Jeong et al., 2007; Boyer et al., 2008; Boyer and Levine, 2015)—because there are no countable pieces—and may force students to rely more strongly on fraction magnitude. Visual representations may be presented in dynamic formats, for example, on touchscreen devices (Reinhold et al., 2020; see also Boyer et al., 2008), which allows students to respond with gestures (i.e., drag and drop, see section Magnitude Estimation Task). Compared to paper–pencil assessment, touchscreen devices may prevent students from using procedural part-whole strategies (e.g., calculating the angle of the segment in a circle diagram, or adding auxiliary lines to the representation) that do not rely on fraction magnitude processing (Reinhold, 2019).
The Present Study
In this study, we use a person-oriented approach to compare performance between (1) a symbolic fraction comparison task and (2) estimations of single fraction magnitudes.
We investigate individual profiles of NNB, and the interplay between an NNB and fraction magnitude processing. As assessing gradually different fraction magnitude processing in students showing a persistent NNB may be a particular challenge (see section “Assessing Fraction Magnitude Processing”), and neither one of those frequently-used tasks should be considered a pure measure of magnitude processing (Schneider et al., 2018b), we chose a research approach that involves two different types of assessment.
The study has two specific aims. The first aim is to replicate individual profiles of NNB in symbolic fraction comparison (typical bias, reverse bias, no bias; Rinne et al., 2017; see also Gómez and Dartnell, 2019; González-Forte et al., 2019) in low-achieving students shortly after they have been introduced to fractions in school. We expect to find clusters with typical NNB, with reverse NNB, and without an NNB. We also investigate the relationship between individual students’ NNB profiles and fraction magnitude processing assessed by the distance effect. We expect students without NNB to elicit a distance effect and students with NNB patterns not to elicit a distance effect, because the former students would be better able to process fractions magnitudes than the latter. The second aim is to explore the relationship between individual students’ NNB profiles and their fraction magnitude processing abilities utilizing continuous diagrams in a dynamic assessment on touchscreen devices. We expected to find differences in the percent absolute error between different NNB profiles with students showing no NNB demonstrating lower percent absolute error.
Materials and Methods
Sample
The sample consisted of N = 234 6th-grade students (42% female) from 16 classrooms in eight German secondary schools. The schools were of type Hauptschule, which is the lowest school track of secondary school in the German school system. Students in this school track demonstrate below average performance at the end of primary school (i.e., grade 4) in mathematics, language, and science, and show typically low performance in secondary school mathematics (Götz et al., 2013; Sälzer et al., 2013; Reinhold et al., 2020). Thus, we expected to find patterns of NNB in the present sample of low-achieving students. The data was collected within the research project ALICE:fractions (Hoch et al., 2018a; Reinhold et al., 2020), 8 weeks after students received the first introduction to fraction magnitudes in school. Note that according to their curriculum, students had been formally introduced to fractions at the beginning of grade six only.
Material
We used two different scales, the fraction comparison task including both congruent and incongruent fraction pairs, and the magnitude estimation task featuring continuous diagrams.
Fraction Comparison Task
To solve the fraction comparison tasks students had to pick the larger of two fractions that were presented in symbolic representation (Figure 1). Since we expected students to have fairly low competencies with fractions, all fractions had one-digit numerators and one-digit denominators. There were nine items with congruent fraction pairs and 11 items with incongruent fraction pairs (see section “The Natural Number Bias as a Source of Individual Errors in Solving Fraction Problems”). Reliabilities for accuracy on both the congruent and the incongruent comparison scales were high (Cronbach’s αcon = 0.87, 95% CI [0.85,0.90], αinc = 0.94, 95% CI [0.92,0.95]). Items varied in the distance between the two fractions (Table 1), but there was no significant difference in mean distance between congruent (M = 0.31, SD = 0.32) and incongruent (M = 0.27, SD = 0.22) items, t(13.88) = –0.30, p = 0.77. Both the congruent and the incongruent scale contained items where either both fractions were proper (e.g., 2/5 vs. 5/7) or where one fraction was proper and the other fraction was improper (e.g., 2/3 vs. 5/4). Response Time (RT) was measured as the time between the item was displayed on the screen of a touchscreen device and the participant chose the fraction by tapping on the screen. Reliabilities for RTs were sufficiently high as well (αcon = 0.82, 95% CI [0.79,0.86] and αinc = 0.84, 95% CI [0.81,0.87]). All items are displayed in Table 1.
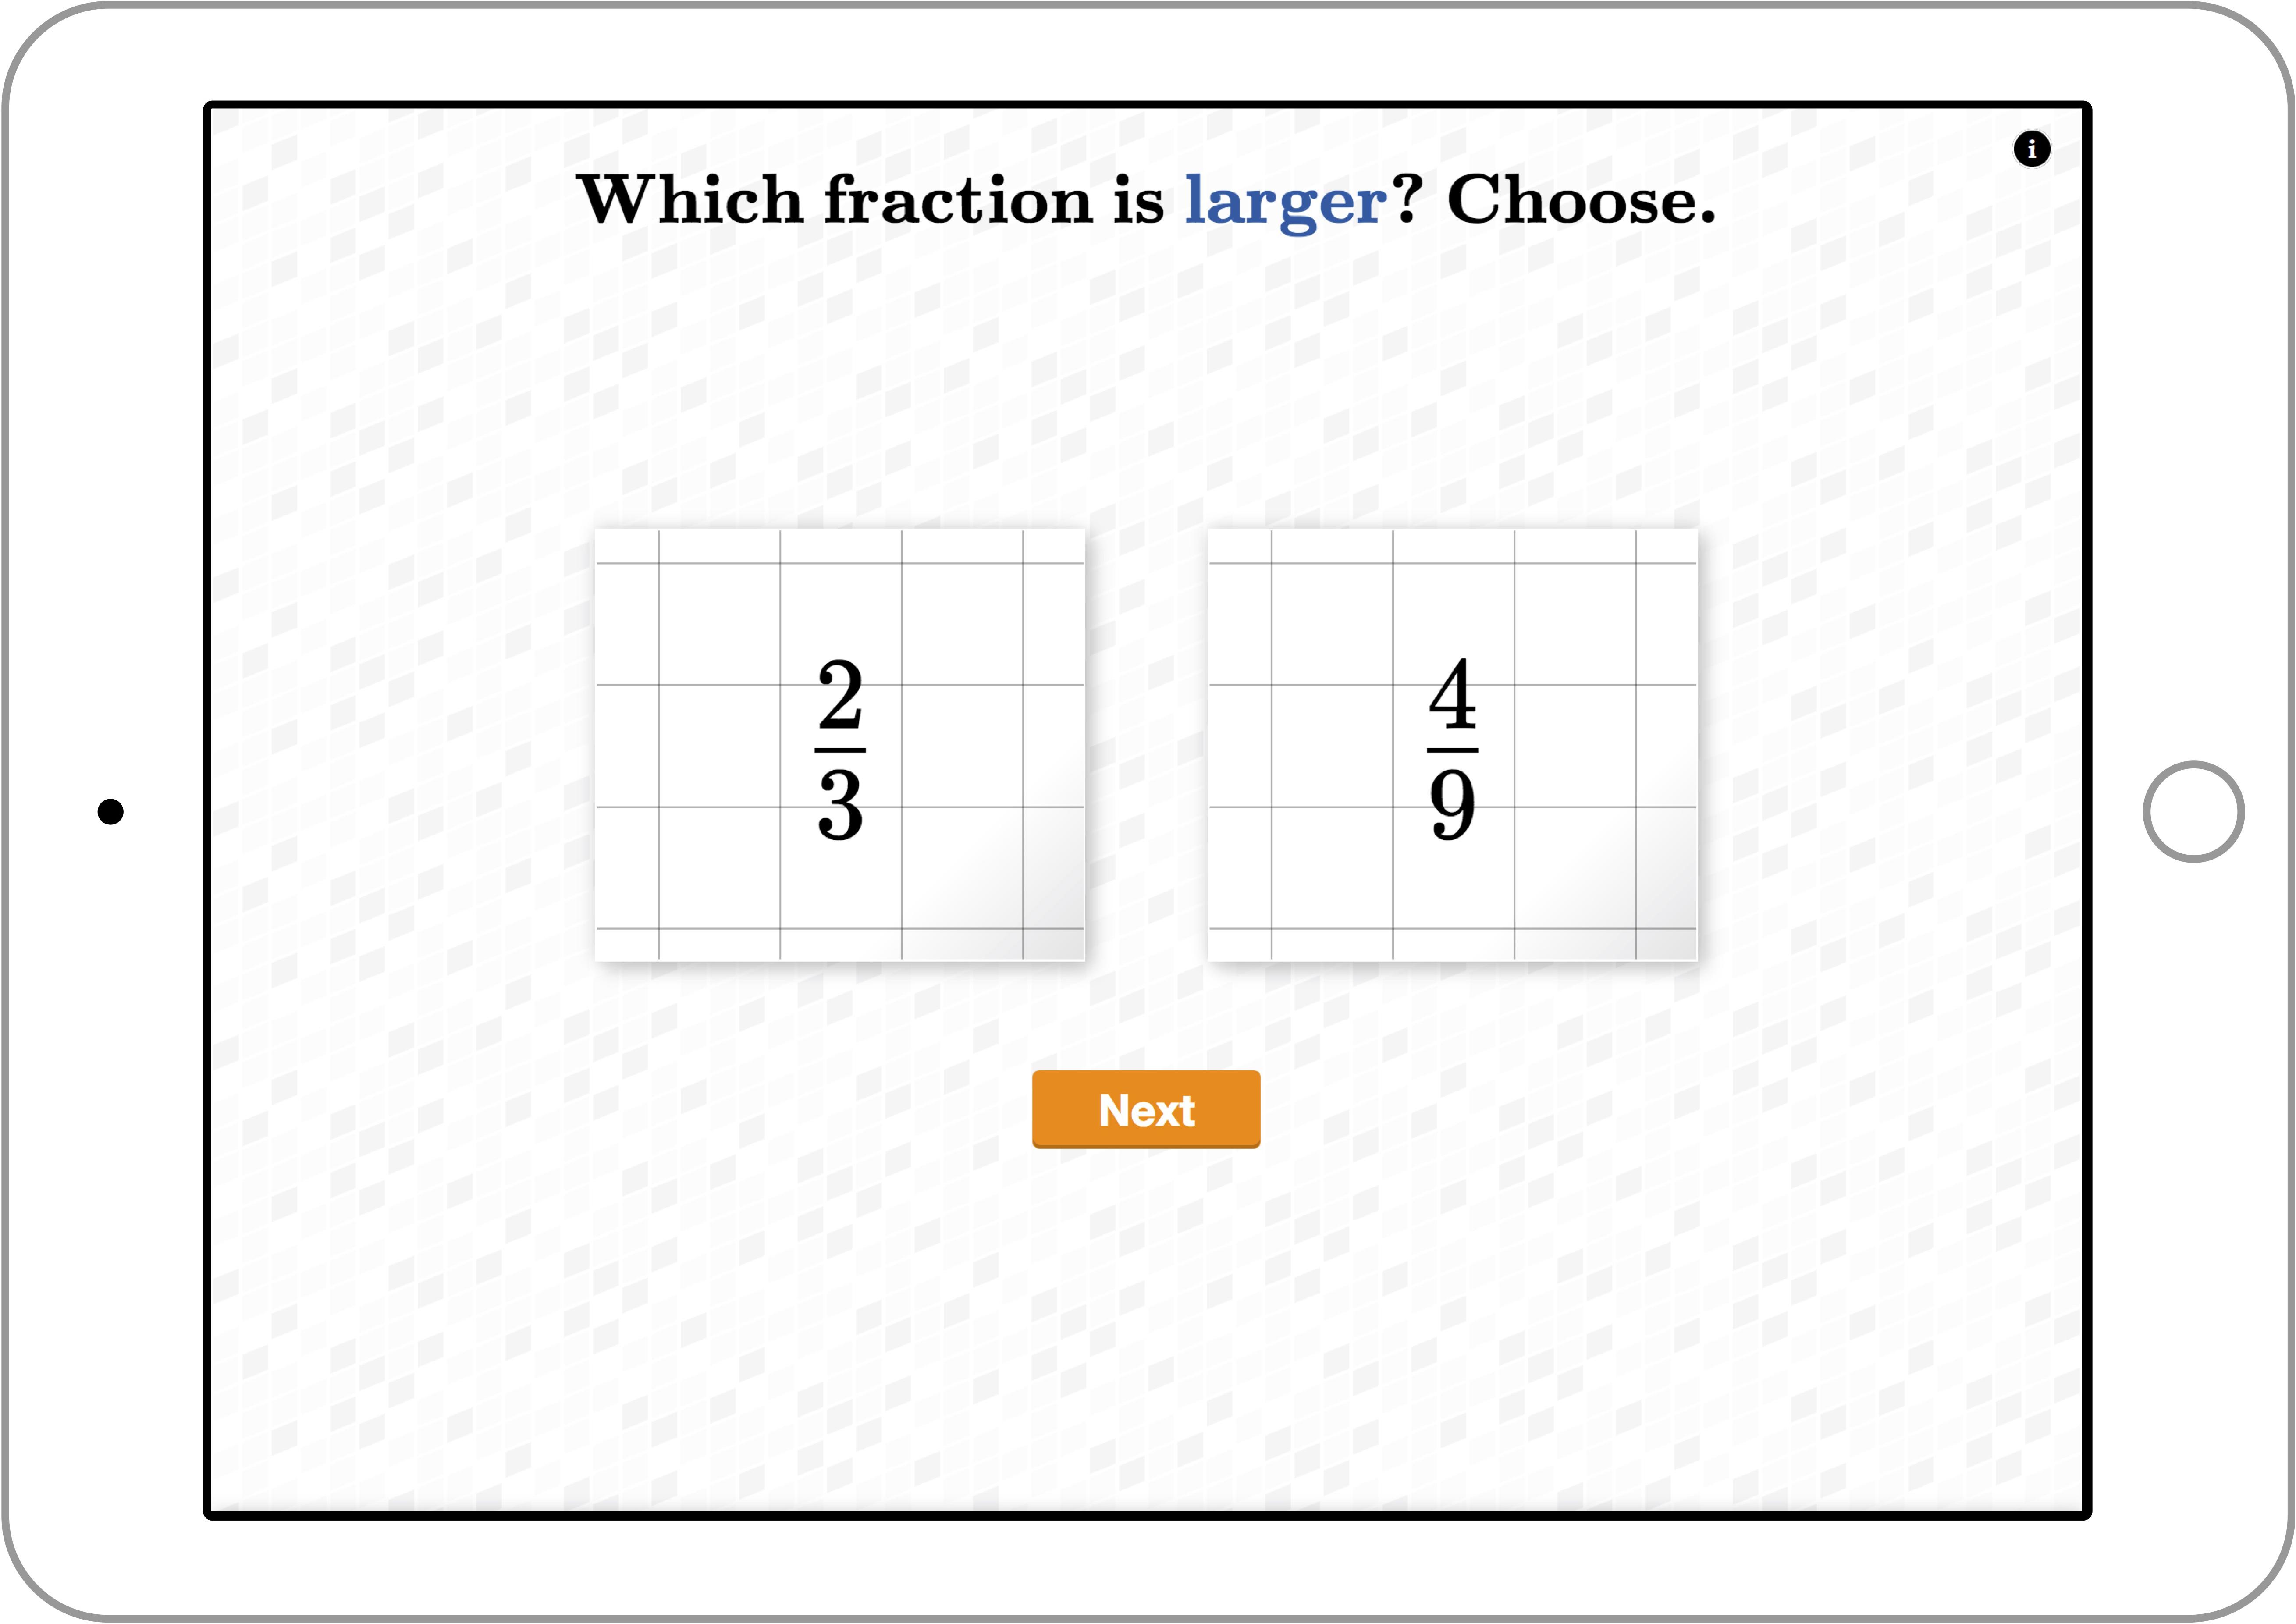
Figure 1. Example fraction comparison task as displayed in the digital assessment environment. Original item in German, translated into English for the purpose of this article.
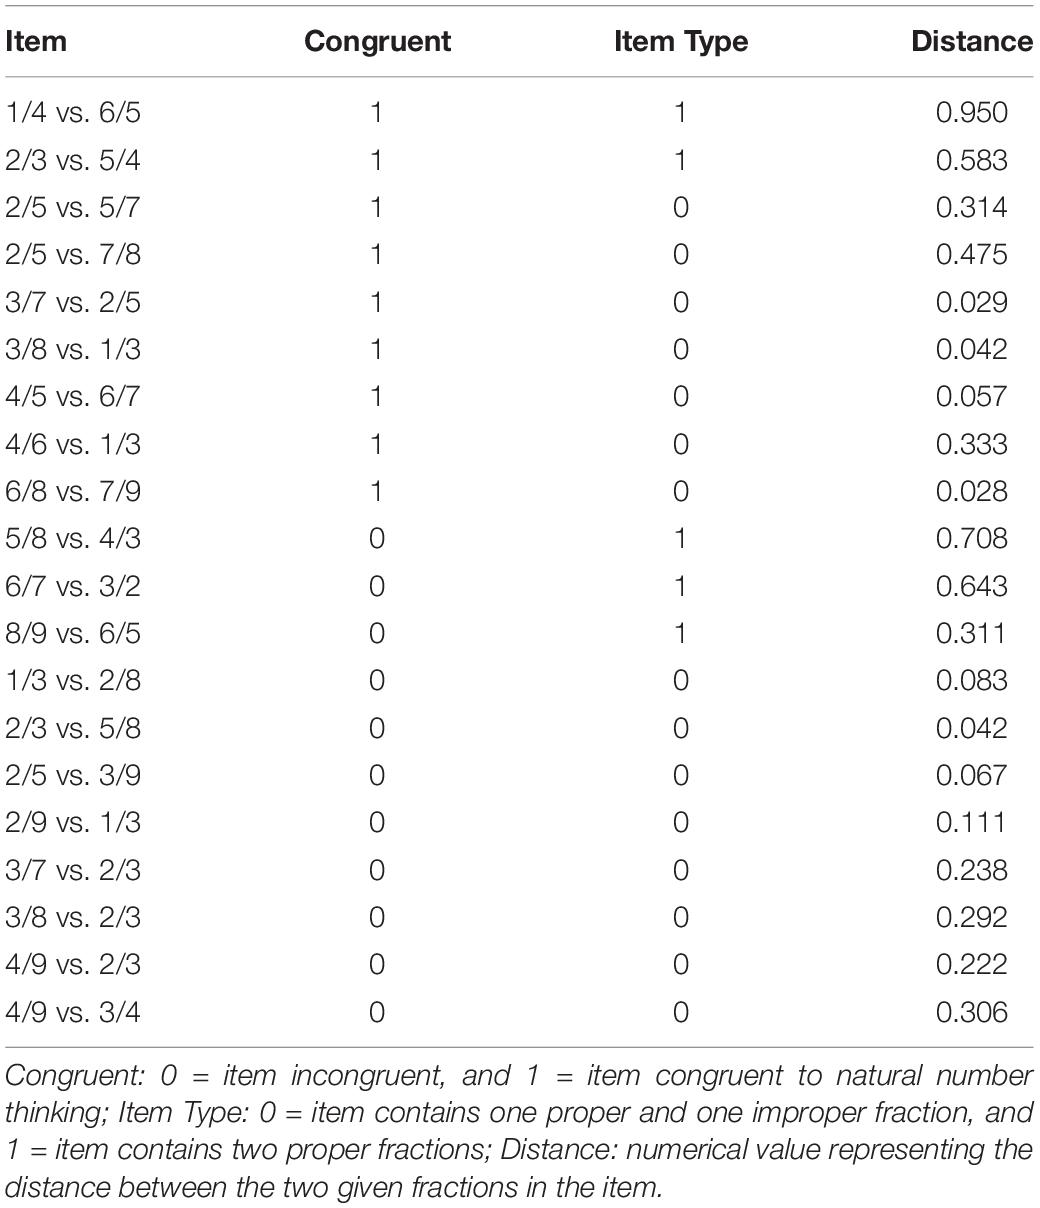
Table 1. Items used in the fraction comparison task.
Magnitude Estimation Task
In the magnitude estimation task, students had to mark a fraction on a continuous visual representation, which was either a circle or a tape diagram (varying across the task, see Figure 2). Students hat to drag a colored segment from 0 to the desired value within the given representation using finger movement. There were 16 fractions, and each fraction was presented in both representation formats, resulting in a total of 32 items (Table 2). Both the order of the given diagram and the order of the 16 fractions, was randomized for each student. We measured the Percent Absolute Error (PAE) as the absolute deviation from the given value, and Response Time (RT) as the time between the item was displayed and the student pressed the “ok” button after marking the fraction.
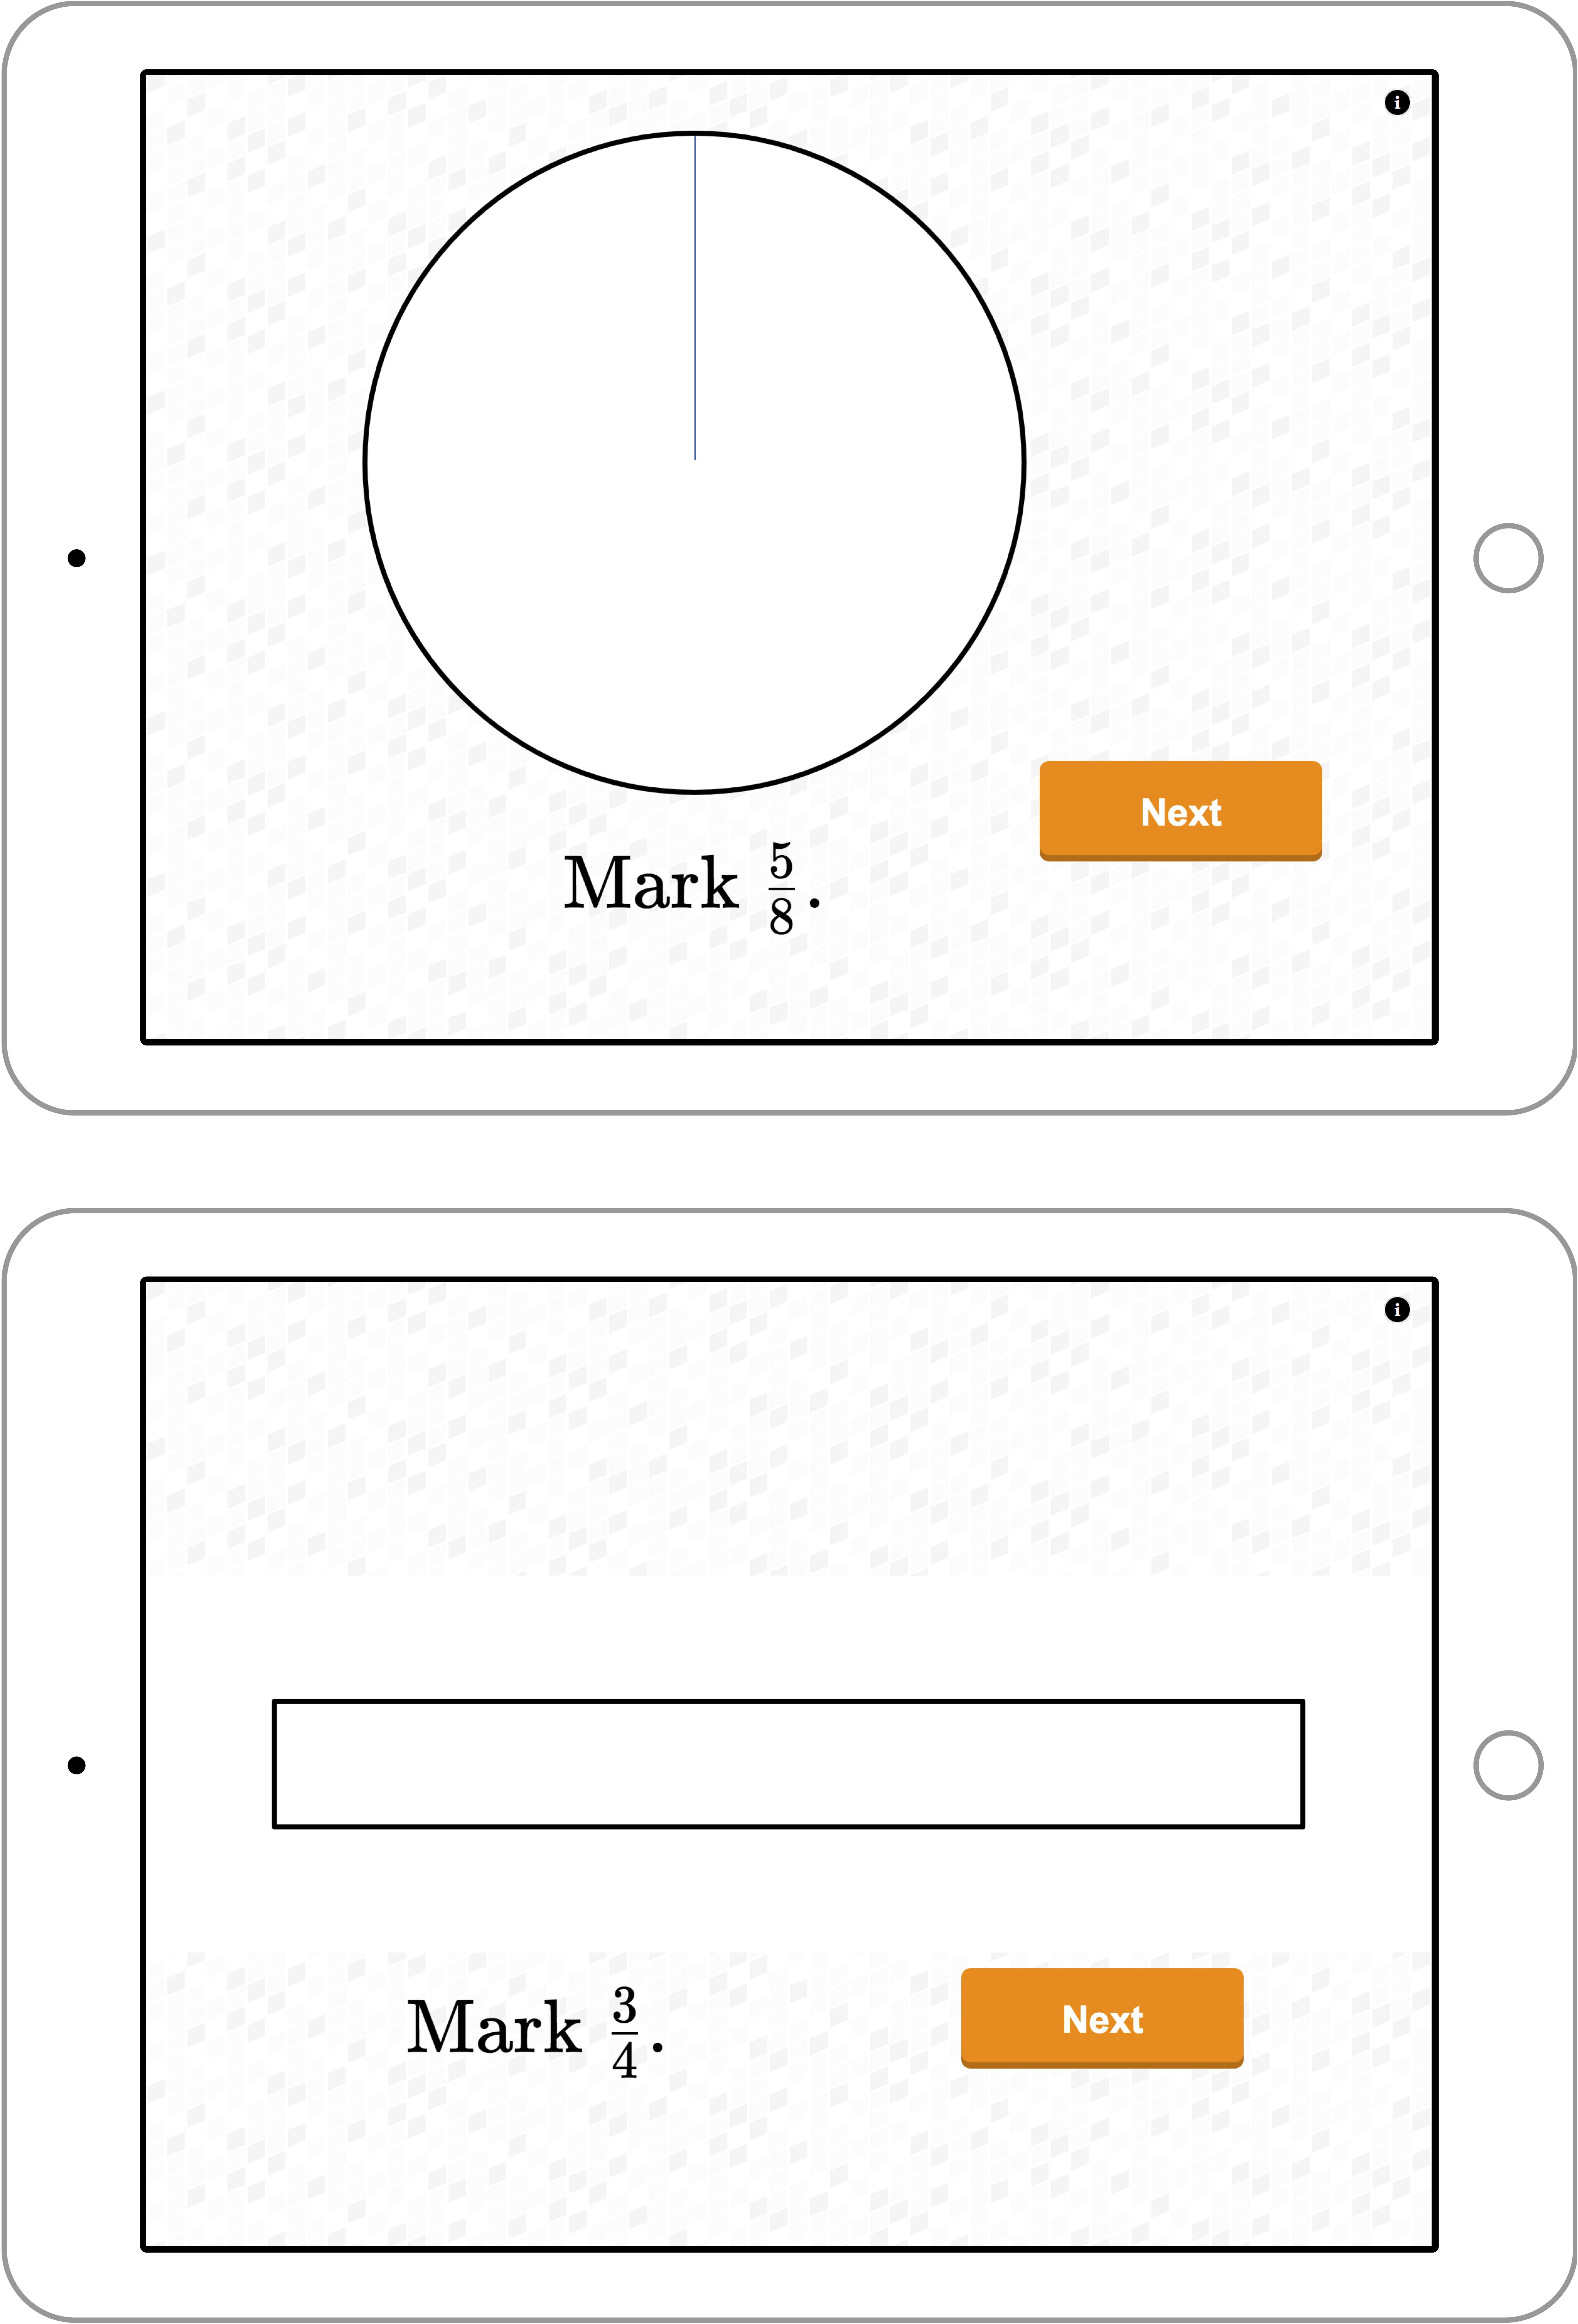
Figure 2. Example magnitude estimation tasks as displayed in the digital assessment environment (top) circle diagram; (bottom) tape diagram. Original item in German, translated into English for the purpose of this article.

Table 2. Items used in the magnitude estimation task.
Procedure
The responsible local education authority approved the study. School principals, classroom teachers, students and their parents were informed about the goal of the study and the procedure. They all gave informed consent. Participation for students was voluntary and without reimbursement.
Students were presented all tasks on a 10.5-inch iPad. All items had to be solved using the touchscreen with finger input. They were first presented the fraction comparison task, where they had to mark the larger fraction by touching it (Figure 1). After that, the students were presented the magnitude estimation tasks (Figure 2), first with circle diagrams and then with tape diagram, or in the reverse order (randomly assigned). Item order in all three assessments was randomized.
For each task, process data (i.e., task characteristics, student input, and response time) were recorded and saved on the iPad using WebStorage.
Data and Statistical Analyses
Because students’ off-task behavior generated outliers that may affect the results (Kovanoviæ et al., 2015), we preprocessed response time data (Goldhammer et al., 2014; Hoch et al., 2018a): response times that deviated more than two standard deviations from the mean of the corresponding task type (i.e., fraction comparison task and magnitude estimation task) were considered as outliers and were replaced by that bound (i.e., two standard deviations above or below the mean).
To achieve the first aim of this study, we applied a cluster analysis on the fraction comparison tasks based on three dimensions: the accuracy in incongruent tasks (ACCinc), the accuracy in congruent tasks (ACCcon), and the average response time (RT). As response time did not differ significantly between incongruent and congruent tasks on the student level, we used the combined average measure to reduce collinearity in the cluster analysis. Since cluster analysis is sensitive for outliers we used the logarithm of RT and standardized all three measures before clustering. We used a two-step clustering approach, utilizing hierarchical clustering with Ward’s method to identify the appropriate number of clusters according to the majority rule (Charrad et al., 2014). Clusters were then defined with the k-means algorithm (Sharma, 1996; Backhaus et al., 2018). We then used generalized linear mixed models (GLMMs) to estimate effects of congruency, distance, and item type (i.e., one fraction being improper vs. both fractions proper) on students’ probability to give correct responses in the fraction comparison task, for each cluster separately. In this specific case, GLMMs have several advantages over other statistical methods (e.g., handling of unbalanced designs, see Brauer and Curtin, 2018, and handling dichotomous data, see Anderson et al., 2010). The models contained fixed effects for the predictor variables Congruent (0 = incongruent, and 1 = congruent), Distance (numerical value representing the distance between the two given fractions in the item, centered at grand mean), and Type (0 = item contains two proper fractions, 1 = item contains one proper and one improper fraction). The models allowed for random intercepts for Students, Classrooms (to account for the nested data structure), and Items. We give estimates as log-odds which can be transformed to estimated probabilities for giving a correct response. As a consequence of the coding and centering, the Intercepts describe the estimated probability of getting a correct response from an average student within the cluster on an incongruent item of average difficulty that consists of two proper fractions with an average distance.
To achieve the second aim of this study, we firstly validated the circle and tape diagram scales as a single magnitude estimation scale by conducting a confirmatory factor analysis. Secondly, we compared the results from the magnitude estimation task between students belonging to different clusters—using both, percent absolute error and reaction time, as units of analyses. To that end, we used linear mixed models (LMMs) with the resulting Clusters as fixed effect and random intercepts for Students, Fractions, Task type (0 = circle diagram; 1 = tape diagram; to account for different representations), and Classrooms (to account for the nested data structure).
All data preprocessing and analyses were conducted in R (R Core Team, 2008). For cluster analysis, we used the NbClust package (Charrad et al., 2014) and the stats package (R Core Team, 2008). For confirmatory factor analysis, we used the lavaan package (Rosseel, 2012). For GLMMs and LMMs, we used the lme4 package (Bates et al., 2015), and for calculating post hoc Tuckey contrasts between the clusters, we used the multcomp package (Hothorn et al., 2008).
Results
Identifying and Validating Different Student Profiles in Fraction Comparison
We were interested in individual profiles of NNB. The cluster analysis revealed three different profiles. A total of 12 out of 23 stopping rules (among them the Calinski-Harabasz stopping rule and the Silhouette plot) suggested a three-cluster structure, with other cluster structures suggested by only one to three stopping rules. As students are nested within classrooms, the relation between clusters and classrooms is of interest for interpreting the results. A chi-square test showed a significant relation between clusters and classrooms, X2(30, N = 254) = 57.79, p < 0.01. For that reason, we allowed for a Classroom random intercept in all GLMMs and LMMs to account for the nested data structure.
We describe those different clusters of students with regard to their absolute values on ACCinc, ACCcon, and RT. To illustrate the description, cluster centers for the three types of students are displayed in Table 3 and depicted in Figure 3.
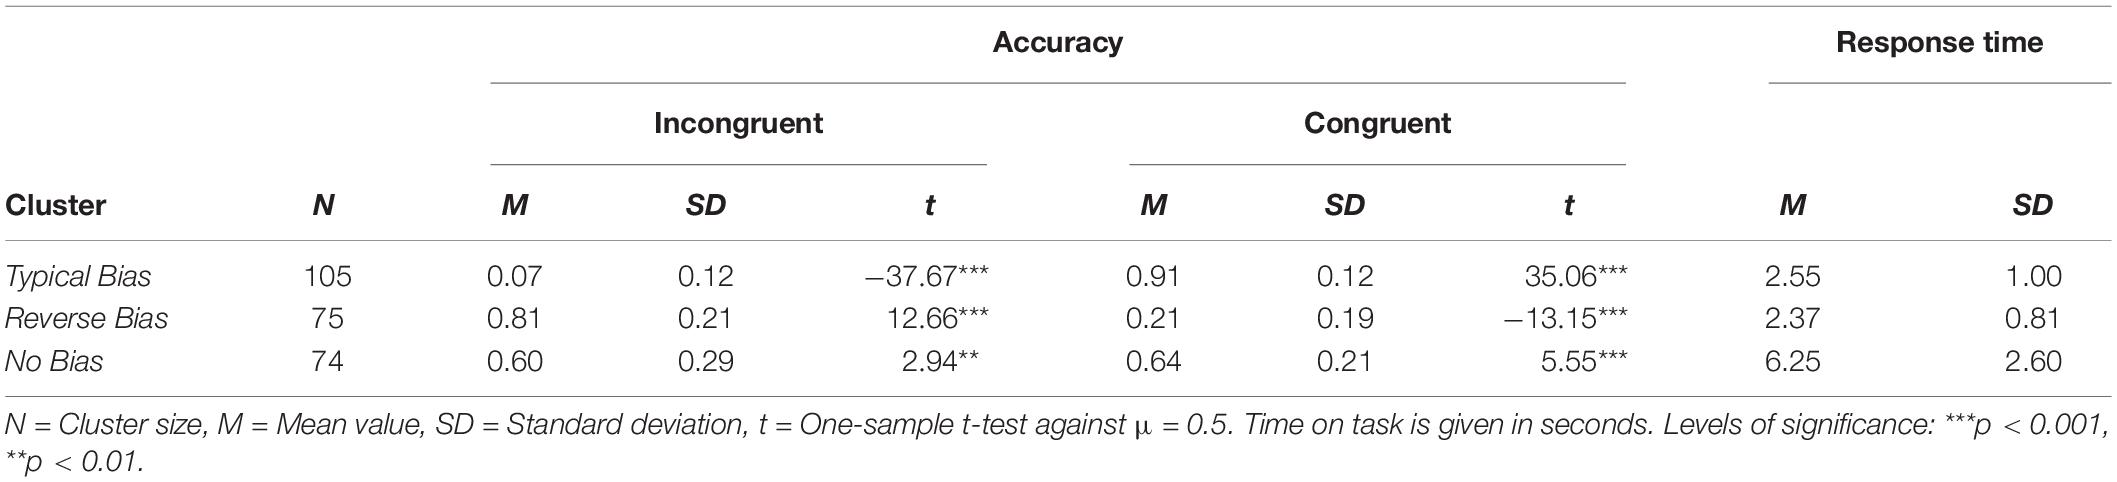
Table 3. Cluster centers for the three clusters regarding fraction comparison.
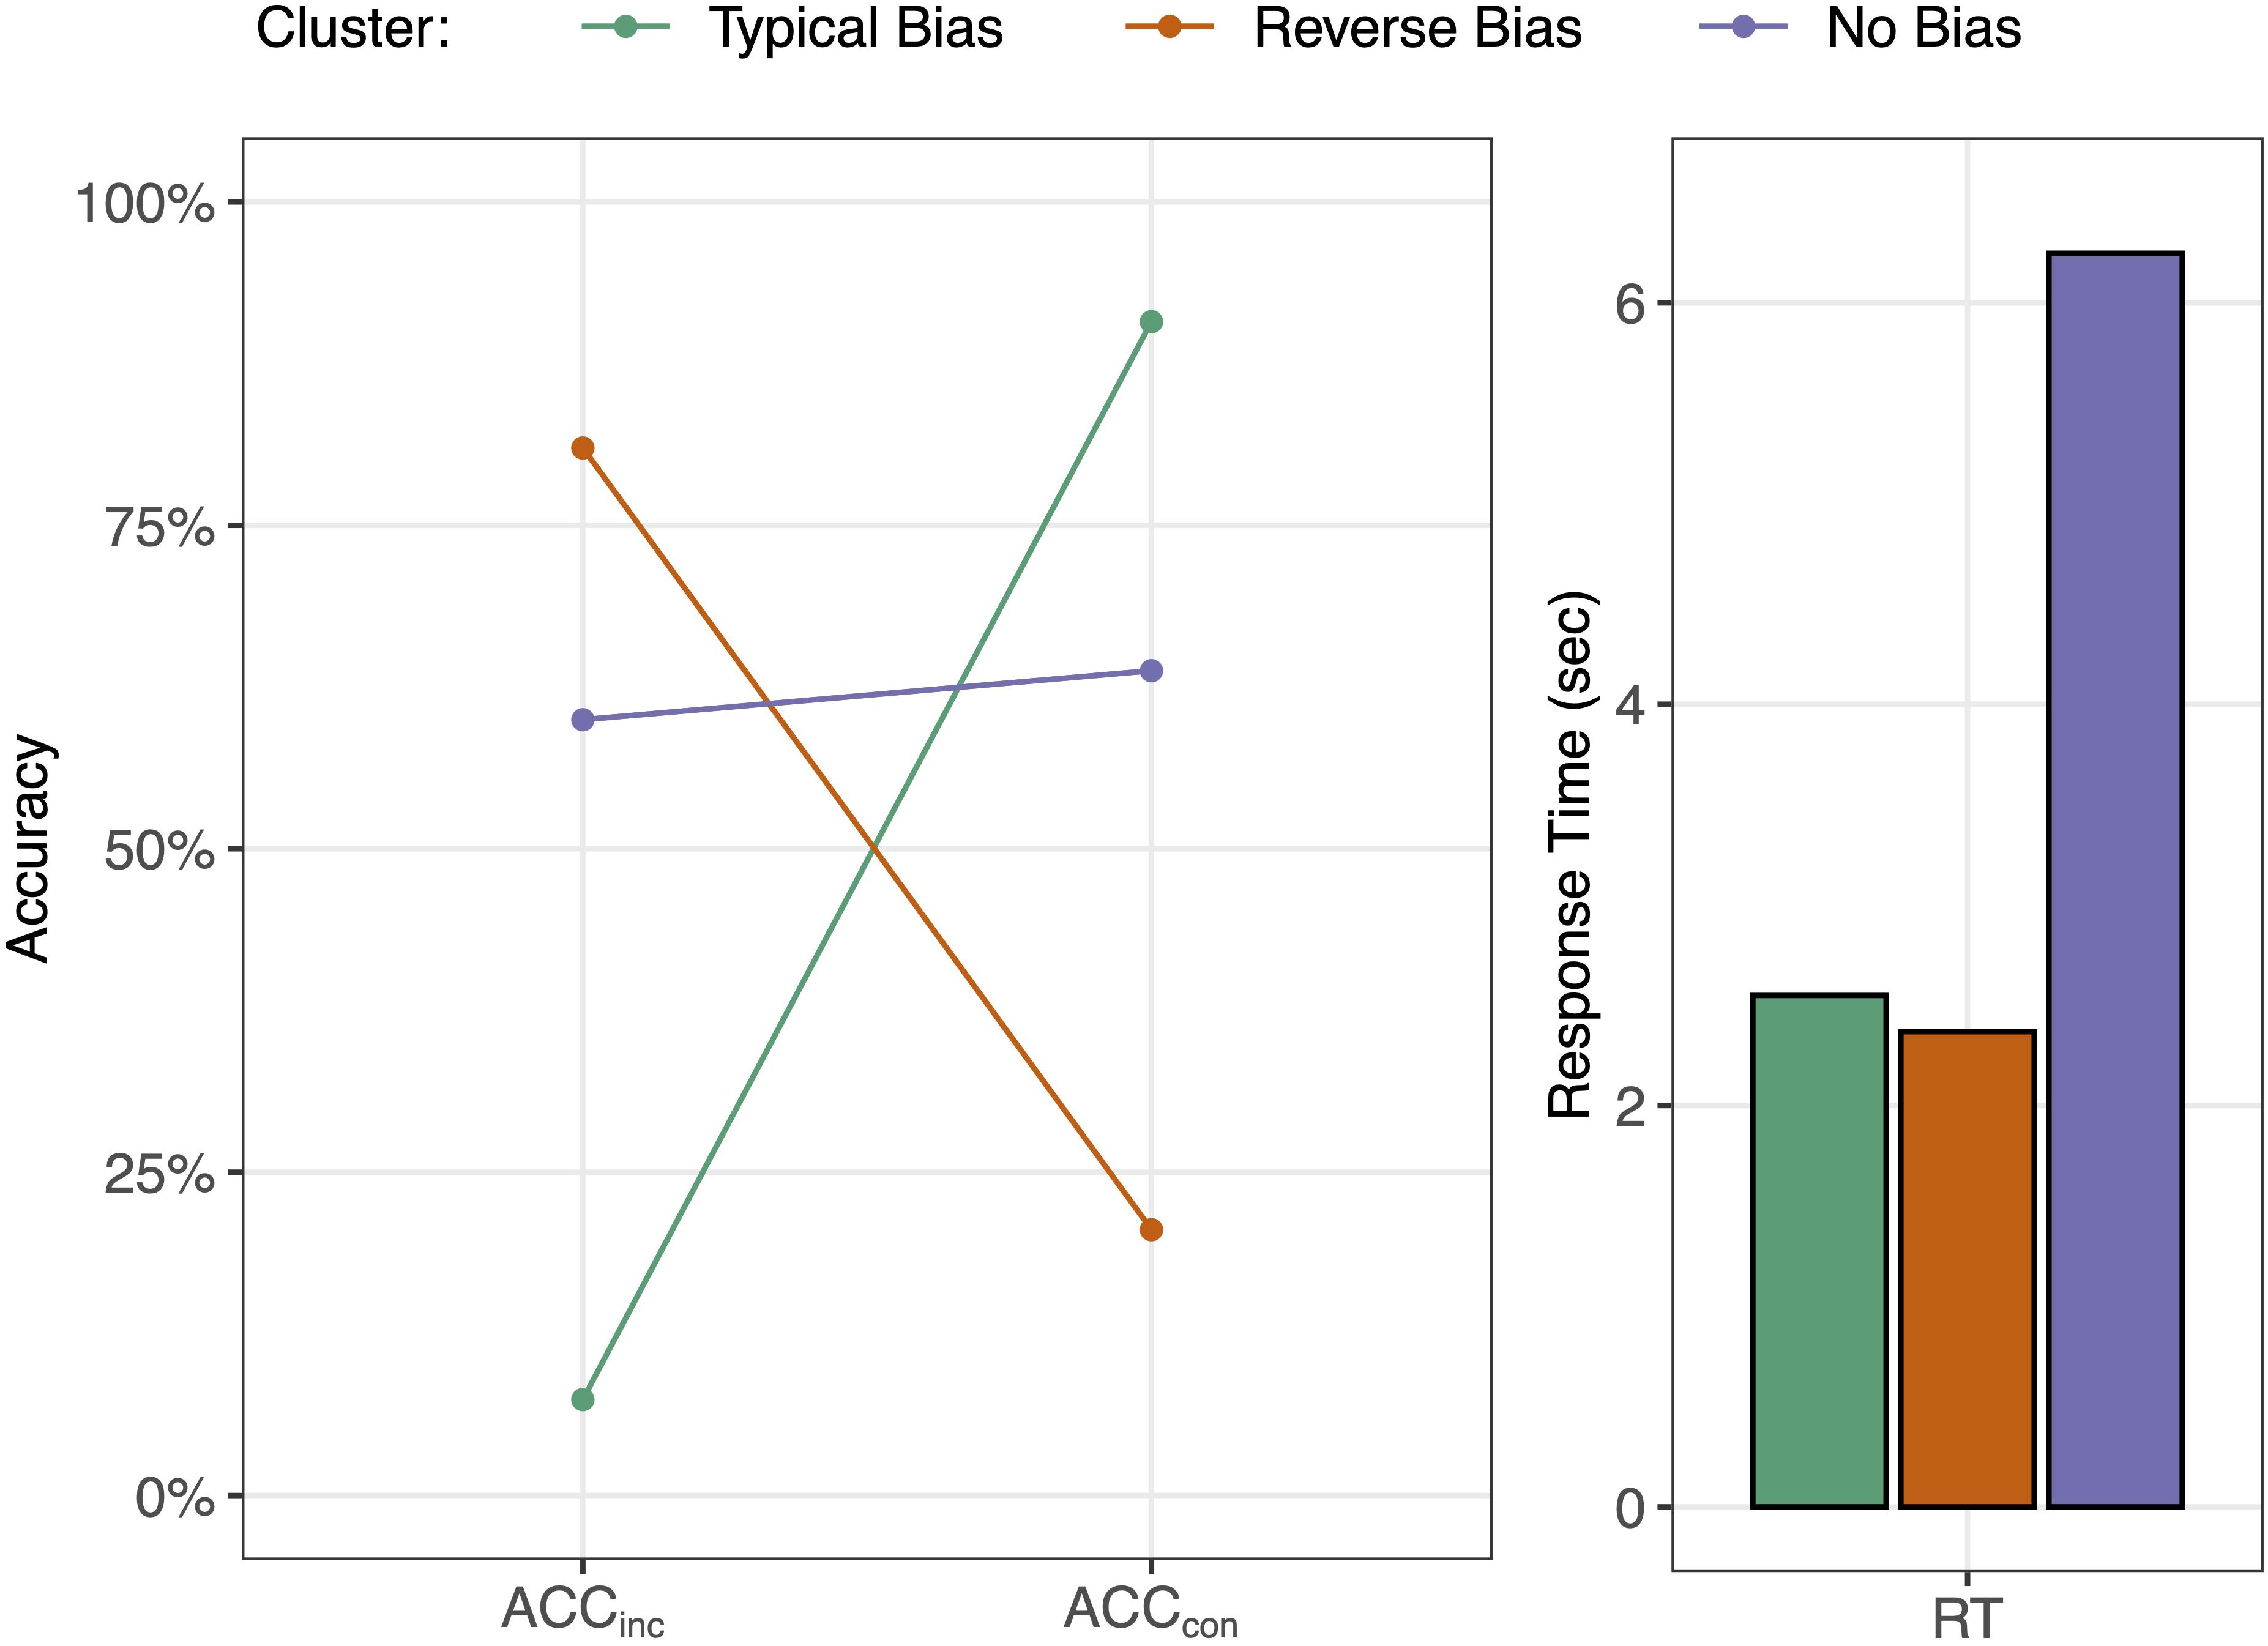
Figure 3. Cluster centers of the three Student Types, resulting from the cluster analysis of 254 students based on two solution rates and the logarithmized combined average time on task for students’ responses in items on the fraction comparison task.
Students in the Typical Bias cluster showed high accuracy in congruent items (M = 0.91) and low accuracy in incongruent items (M = 0.07) (Figure 3). One-sample t-tests against μ = 0.5 showed that both accuracy rates differed significantly from chance level (Table 3). In the GLMM model, the effect of congruency was significant, while distance and type were not significant (Table 4), suggesting that students in this cluster relied on natural number thinking and did not process fraction magnitudes. Relative to the total sample, students in this cluster were relatively fast in responding to the tasks (Figure 3), presumably because they did not even try to solve symbolic fraction comparison tasks by processing fraction magnitude but relied solely on simple comparisons of natural number components.
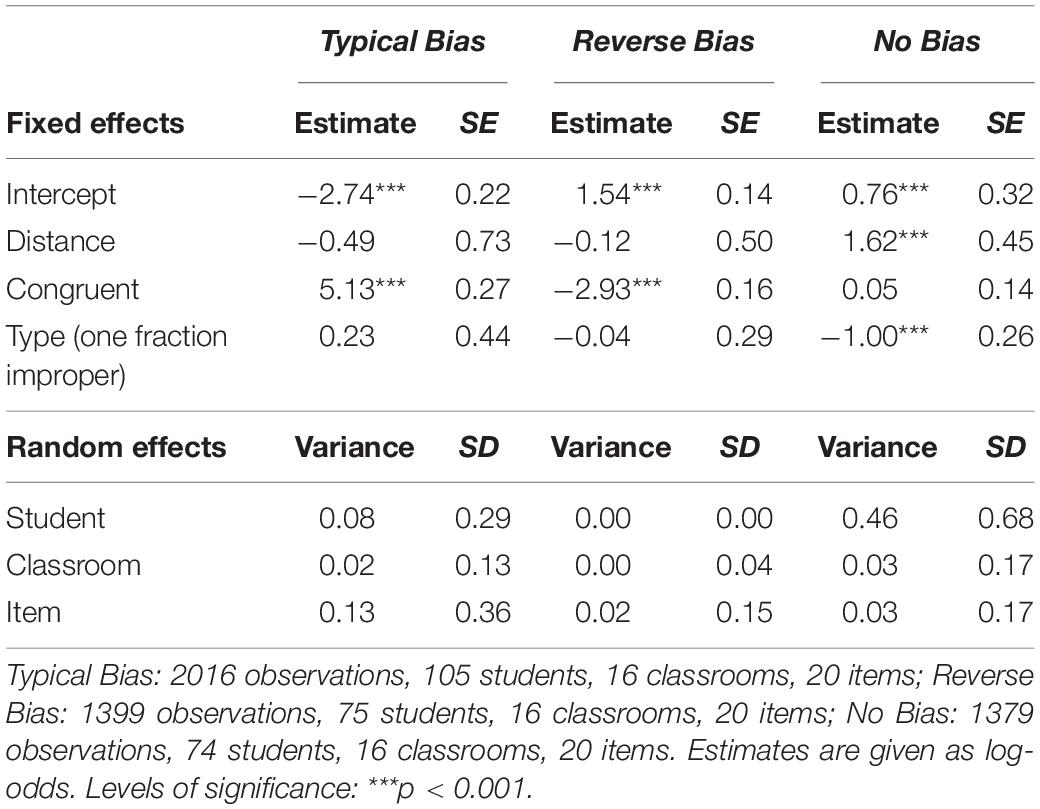
Table 4. Parameter estimates for the generalized linear mixed models for getting a correct response in items in the fraction comparison task, reported for each cluster separately.
Students in the Reverse Bias cluster showed a response pattern opposite to those in the Typical Bias cluster (Figure 3). These students demonstrated high and significantly above-chance solution rates in incongruent items, M = 0.81, and fairly low and significantly below-chance solution rates in congruent items, M = 0.21 (Table 3). Again, the effect of congruency was significant and the effects of distance or type were not (Table 4). Overall, students in this cluster were also fairly fast in their responses (Figure 3). The results suggest that these students may already have developed a partial—yet still incomplete—understanding of fractions and have overgeneralized their knowledge that larger numbers can lead to smaller fraction.
Students in the No Bias cluster showed a response pattern that was not affected by an NNB (Figure 3). These students demonstrated medium but significantly above-chance solution rates in both incongruent items, M = 0.60, and congruent items, M = 0.64 (Table 3). The GLMM shows that there was no significant effect of item congruency (Table 4). In contrast to students in the two biased clusters, students in this cluster showed a significant effect of distance, with the estimated probabilities of being correct increasing with the distance between the two fractions (Table 4). In addition, there was a significant effect of type, with higher accuracy for items containing two proper fractions than for items containing one proper and one improper fraction (Table 4). On average, students in this cluster took three times as long as both other clusters to solve comparison items (Figure 3), which could be an indicator that these students were aware of the cognitive demand of fraction comparison. The results suggest that these students have started to develop an understanding of fraction magnitudes.
Error and Response Time in Magnitude Estimation
For the following analyses, we had to exclude 20 students (i.e., 7.9% of the sample) because their data on the magnitude estimation task were not saved due to a software problem. We do not believe that this reduction affected the results because the distribution of the remaining 234 students over the three NNB clusters (n = 101 Typical Bias, n = 67 Reverse Bias, and n = 66 No Bias) did not differ significantly from the whole sample, X2(2,234) = 0.32, p = 0.85.
Validating the Scales
Our hypothesis was that the magnitude estimation items assessed the same construct regardless of the specific representation format (circle or tape). Yet, a confirmatory factor analysis showed that a model with two different latent factors for each representation (circle or tape) fit the data significantly better than a model with one latent factor (regardless of the specific representation), X2(1) = 104.8, p < 0.001. However, Cronbach’s Alpha for the unidimensional magnitude estimation scale was high for both the Percent Absolute Error (PAE, α = 0.92, 95% CI [0.91,0.94]) and Response Time (RT, α = 0.86, 95% CI [0.84,0.89]). As for our analysis differences between both representations are not of particular interest, we chose the unidimensional magnitude estimation scale for further analyses, but we allowed for a Task Type random intercept in the following LMMs to account for variance due to the specific representations.
Differences Between Student Profiles
On average, PAE was 14.4% (SE = 1.1). The estimated marginal mean of RT was 8.06 s (SE = 1.35). We were interested in how students in the different NNB clusters differed in these values. Parameter estimates from the LMMs are given in Table 5.
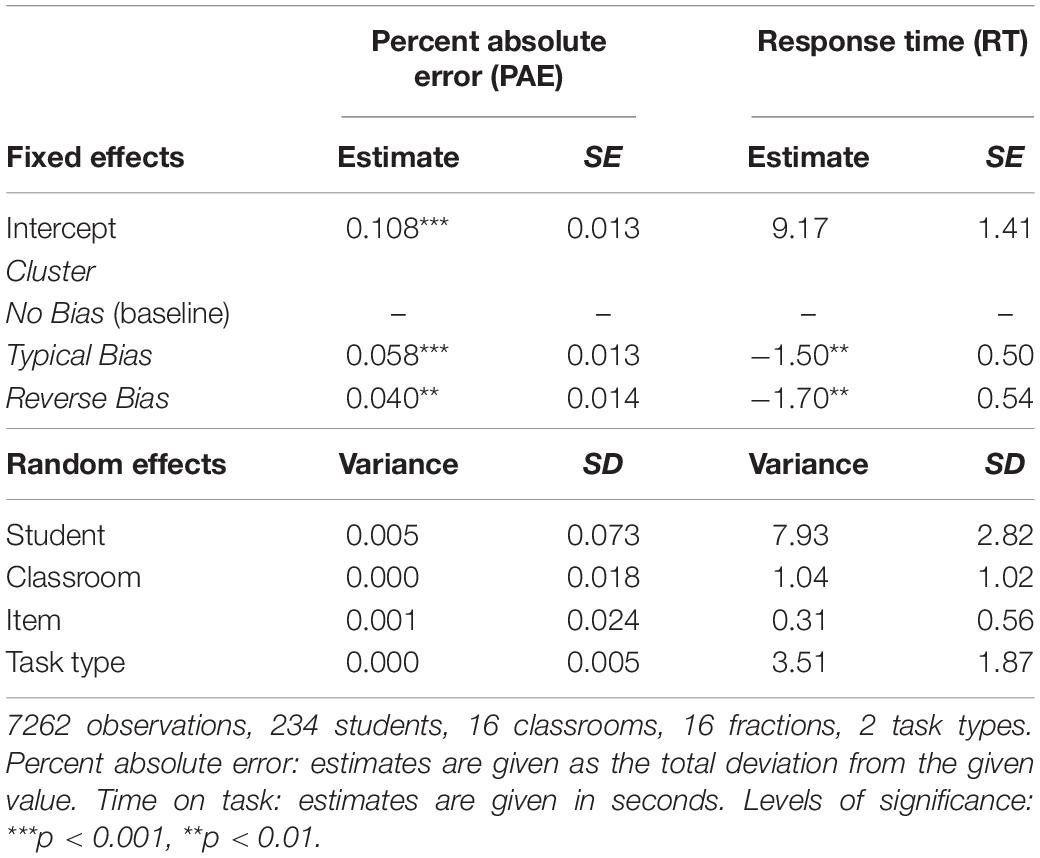
Table 5. Parameter estimates for the linear mixed models for percent absolute error and response time in items on the in the magnitude estimation task.
Regarding PAE, the random effects in the full model seemed neglectable. Students in the No Bias cluster showed a PAE of 10.8%, 95% CI [8.2, 13.4], which was significantly lower than the PAE of students in the Typical Bias cluster (PAE = 16.6%, 95% CI [14.3, 18.9]), p < 0.001, and significantly lower than the PAE of students in the Reverse Bias cluster (PAE = 14.8%, 95% CI [12.3, 17.3]), p < 0.05 (Table 5). No significant difference between students in the Typical Bias cluster and the Reverse Bias cluster was found, p = 0.32. Thus, students in the No Bias cluster yielded the most accurate estimations of fraction magnitude in the magnitude estimation task.
Regarding RT, the students in the No Bias cluster (RT = 9.17, 95% CI [6.40, 11.94]) took significantly longer to estimate the magnitude of the given fractions than students in the Typical Bias cluster (RT = 7.68, 95% CI [4.94, 10.41]), p < 0.01, or the Reverse Bias cluster (RT = 7.48, 95% CI [4.72, 10.24]), p < 0.01 (Table 5). Again, no significant difference between students in the Typical Bias cluster and the Reverse Bias cluster was found, p = 0.93. Thus, in line with the results from the fraction comparison tasks, students in the No Bias cluster invested more time in solving the items than students in both biased clusters.
Discussion
We were interested in individual profiles of NNB, and in the interplay between an NNB and fraction magnitude processing. In the following, we discuss the results regarding these two aspects. We then discuss the assessment of fraction magnitude processing with continuous diagrams on touchscreen devices, as well as limitations of our study.
Individual Profiles With and Without a Natural Number Bias
We found three distinct profiles of natural number bias in fraction comparison, which is in line with results from recent studies (Rinne et al., 2017; Gómez and Dartnell, 2019; González-Forte et al., 2019). Students in the Typical Bias cluster demonstrated a typical NNB (better performance on congruent than incongruent comparison items), while students in the Reverse Bias cluster showed an NNB in the opposite direction (better performance on incongruent than congruent comparison items). Relative to students in the Typical Bias cluster, students in the Reverse Bias cluster seem to have changed their number concepts regarding fractions: they seem to consider a fraction larger when its components are smaller. These two profiles were reported in several studies utilizing person-oriented approaches: Rinne et al. (2017) found them in their longitudinal study with students from grade 4 to grade 6 before and after systematic fractions instruction in school; González-Forte et al. (2019) with seventh graders; and Gómez and Dartnell (2019) with students from grade 5 to grade 7.
In contrast, students in the No Bias cluster did not show NNB patterns. They showed above-chance solution rates in both congruent and incongruent fraction comparison tasks, although solution rates were not very high overall. Again, this cluster was found in other studies as well. For example, Gómez and Dartnell (2019) reported a cluster of non-biased students performing relatively low—yet above chance—in symbolic fraction comparison with non-common components. For students in our No Bias cluster, tasks were more difficult when one improper fraction had to be compared to one proper fraction than when both fractions were improper—a result that Rinne et al. (2017) report for students in the best performing cluster before initial instruction of fractions in school. This suggests that students in our No Bias cluster were not yet able to use benchmarking to 1 as an effective strategy (Clarke and Roche, 2009; Reinhold et al., 2018). In sum, students in the No Bias cluster seemed to show a beginning development of a deeper understanding of fractions.
It is noteworthy that students in the Typical Bias cluster and the Reverse Bias cluster responded considerably faster than students in the No Bias cluster. We interpret this as an indicator that students in both biased clusters were not aware of the difficulty in fraction comparison tasks—and as another empirical evidence for the presence of the (reverse) NNB in specific student profiles: it seems reasonable that responding based on (reverse) NNB thinking—i.e., magnitude processing of natural numbers—is faster than responding based on fraction magnitude processing (Obersteiner et al., 2013; Van Hoof et al., 2013), especially at this early level of fraction magnitude development.
Overall, the strong individual differences in NNB patterns suggest that research on the NNB in particular and research on the development of fraction knowledge in general should utilize person-oriented approaches to account for individual differences (see Rinne et al., 2017; Van Hoof et al., 2018; Gómez and Dartnell, 2019; González-Forte et al., 2019).
Natural Number Bias and Fraction Magnitude
We found empirical evidence for a relation between the presence of an NNB and fraction magnitude processing. This relation was found in both the symbolic fraction comparison task (distance effects) and the magnitude estimation task with continuous diagrams. Regarding the first relation (NNB and symbolic fraction magnitude comparison) students in both clusters that exhibited NNB (typical or reverse) did not show a numerical distance effect in fraction comparison tasks, while students in the No Bias cluster did. This result is in line with the hypothesis that students who are affected by an NNB process fraction components separately and struggle with processing fractions as holistic magnitudes. Secondly, the results from the magnitude estimation task with continuous diagrams showed that the presence of NNB (both typical and reverse) was related to a larger percent absolute error. Like in the symbolic fraction comparison task, students in the No Bias cluster demonstrated significantly longer response times in magnitude estimations than students from both biased clusters. This seems counterintuitive at first sight, but we suggest that students in the No Bias cluster were at an advanced stage of fraction magnitude understanding, but did not yet automatize fraction magnitude processing. In future studies, one could include students at a higher level of fraction understanding and test whether these students show faster responses without biases.
Based on current literature and these findings, we suggest a tentative model of competence in fraction magnitude processing that could be empirically evaluated in further research: (1) On the lowest level, students show a persistent NNB with no fraction magnitude processing (e.g., clusters reported in our study, as well as Rinne et al., 2017; Gómez and Dartnell, 2019; González-Forte et al., 2019). (2) On the second level, students show a reverse bias due to misinterpretation of fraction concepts, yet still no fraction magnitude processing (e.g., clusters reported in our study, as well as Rinne et al., 2017; Gómez and Dartnell, 2019; González-Forte et al., 2019). (3) On a third level, students do not show an NNB but demonstrate fraction magnitude processing—yet slow and with low accuracy (e.g., clusters reported in our study, as well as Gómez and Dartnell, 2019). (4) On the highest level, students do not show an NNB (regarding accuracy) and are able to process fraction magnitude accurately (e.g., clusters reported in Rinne et al., 2017; Gómez and Dartnell, 2019; González-Forte et al., 2019)—and quickly (e.g., academic mathematicians reported in Obersteiner et al., 2013).
While our study does not yield evidence for a developmental progression (as it is a cross-sectional study from a single population), the results of the longitudinal study of Rinne et al. (2017) may suggest a learning trajectory from level 1 to level 4. This study showed that students do make gradually transitions between those phases during formal fractions instruction in school. Further research is needed regarding students’ development. It seems of particular interest how learning trajectories regarding fraction magnitude processing, suggested for instance by Resnick et al. (2016), and learning trajectories regarding an NNB, suggested for instance by Rinne et al. (2017), fit together.
Regarding developmental progression, the role of the reverse bias is not yet completely clear, as current research gives two different explanations for that pattern. While Rinne et al. (2017) argue that it might be due to overgeneralization of the fact that larger numbers may represent smaller fractions, an alternative explanation for the reverse bias pattern is that students use a specific strategy to compare fractions, which is gap thinking. In this strategy one would argue that the larger the difference between the numerator and the denominator, the smaller the fraction (González-Forte et al., 2019). Consistent application of gap thinking in items with non-common components and proper fractions would result in the reverse bias pattern because it always leads to correct solutions in incongruent items (e.g., 2/3 > 4/9, because 3 – 2 = 1 and 9 – 4 = 5), but it may lead to incorrect solutions in congruent items (e.g., 1/3 > 5/9, because 3 – 1 = 2 and 9 – 5 = 4) (Gómez et al., 2017; see Obersteiner et al., 2020). Considering the short response times of students in the Reverse Bias cluster in our study, it seems unlikely that these students’ reasoning was based on gap thinking, which would require two subtractions. However, further research seems necessary to explore how use of specific strategies is related the occurrence of bias patterns in fraction comparison (Obersteiner et al., 2019b).
It is also not very clear how instruction can best support students in reaching higher levels in fraction magnitude processing, although multiple recommendations on enhancing students’ understanding of fractions exist (e.g., Behr et al., 1983; Butler et al., 2003; Prediger, 2008; Obersteiner et al., 2019a; Reinhold et al., 2020). Further research with longitudinal and/or experimental designs is necessary to identify potential causal effects of instruction on transitions between the suggested levels of fraction magnitude processing. A particularly interesting question is whether a reverse bias is a necessary step, or whether it can be prevented by certain forms of instruction.
Moreover, the role of strategy-use and fraction magnitude processing in the symbolic comparison task is still not completely clear. A study of Fazio et al. (2016) showed that young adults apply a variety of different strategies when comparing the magnitude of two fractions. It is, however, less clear whether this is also the case for students learning the concept of fractions (but see Clarke and Roche, 2009). The study of González-Forte et al. (2019) yields first evidence that students showing a typical NNB do rely on component-based comparison strategies.
Assessing Fraction Magnitude With Continuous Diagrams on Touchscreen Devices
We argued that continuous diagrams presented on touchscreen devices are a suitable way to assess fraction magnitude processing. The results of our study support this argument. The continuous magnitude estimation task yielded similar results regarding fraction magnitude processing as the symbolic fraction comparison task. However, the magnitude estimation task had the advantage that it allowed for a continuous measure of processing a single fraction’s magnitude (the percent absolute error) even in students of the two bias clusters that did not show a distance effect when comparing two fractions.
Further analysis of the data collected with our touchscreen tool could give additional insights into the strategies that students used to determine fraction magnitudes. In particular, finger tracking data may provide detailed information about students’ reasoning. Finger tracking—as used in previous studies (Dotan and Dehaene, 2013; Faulkenberry et al., 2015)—is a fairly natural way of input and may provide a more direct link between hand motions and cognitive processes than mouse tracking.
While our study aimed at assessing fraction magnitude processing, we suggest that our digital assessment tool can be utilized as an effective tool for supporting students’ development of fraction magnitude, when adequate feedback is implemented (Reinhold et al., 2020).
Limitations
Our study included a sample of low-achieving students because we wanted to study a sample with clear NNB patterns. Accordingly, the NNB clusters that we identified may not generalize to other samples. In students with higher mathematical abilities, one would expect to find an additional cluster of students who have higher solution rates and stronger distance effects (comparable to the academic mathematicians in Obersteiner et al., 2013; or the All Correct profile in González-Forte et al., 2019). Future research could investigate whether the same clusters can be found in another sample, and how students make the transition from one cluster to another during development. It would also be interesting to study how other factors (e.g., intelligence, prior informal learning experiences, the quality of instruction) are related to memberships in the different clusters.
We argued that continuous representations may be better apt to assess fraction magnitude processing than discretized representations—especially in studies with students with NNB response patterns. As noted, we cannot rule out that continuous measures also encourage proportional reasoning (e.g., Jeong et al., 2007; Boyer et al., 2008; Boyer and Levine, 2015). However, we would argue that “these accounts [magnitude processing and proportional reasoning] do not exclude each other” (Schneider et al., 2018a, p. 1468) and that, on the contrary, proportional reasoning could be foundational for fraction magnitude processing. Future research could investigate in more detail the relationship between fraction magnitude processing and proportional reasoning. Likewise, studies could investigate potential differences in the cognitive processes involved in magnitude estimation on either circle or tape diagrams. In our study, items in both representations proved to form a reliable scale, although a factor analysis did suggest differences between both representations.
In addition, further studies could systematically investigate the differences in abilities required in estimation tasks with number lines on the one hand and with continuous diagrams on the other. It would also be of interest whether the used continuous diagram stimuli show a mode effect between touch screen assessment and a more traditional paper-based assessment. First evidence by Piatt et al. (2016) suggest that there is no mode effect in number line estimation tasks.
Conclusion
We found that a natural number bias (whether typical or reverse) was associated with low fraction magnitude processing, while the absence of bias was associated with moderate magnitude processing in a sample of lower-achieving students. We suggested a way of assessing magnitude processing of individual fractions using continuous visual representations on touchscreen devices that have particular advantages in assessments with low-achieving students. Future research with longitudinal designs and interventions is necessary to better understand students’ fraction magnitude processing and bias patterns, and the factors that influence the relationship between the two.
Data Availability Statement
The datasets generated for this study are available on request to the corresponding author.
Ethics Statement
The studies involving human participants were reviewed and approved by the Staatliches Schulamt München für Mittelschulen, reference SchRIII/Erh106/1. Written informed consent to participate in this study was provided by the participants’ legal guardian/next of kin.
Author Contributions
FR conceived and designed the analysis, collected the data, contributed data or analysis tools, performed the analysis, and wrote the manuscript. AO contributed data or analysis tools, and contributed to writing the manuscript. SH conceived and designed the analysis, conceived and implemented the data collection, collected the data, contributed data or analysis tools, and contributed to the writing of the manuscript. SIH contributed to the writing of the manuscript. KR conceived and designed the analysis, contributed to the writing of the manuscript, and acquired the funding.
Conflict of Interest
The authors declare that the research was conducted in the absence of any commercial or financial relationships that could be construed as a potential conflict of interest.
Funding
This work was part of the ALICE:fractions project, which was supported by the Heinz Nixdorf Foundation, Germany, under the German name “Lernen mit dem Tablet-PC: Eine Einführung in das Bruchrechnen für Klasse 6” (reference: 12502). The Heinz Nixdorf Foundation did not provide support for the preparation of the article, in study design, in the collection, analysis and interpretation of data, in the writing of the report, and in the decision to submit the article for publication. This work was supported by the German Research Foundation (DFG) and the Technical University of Munich within the funding programme Open Access Publishing.
Acknowledgments
We want to thank Bernhard Werner and Jürgen Richter-Gebert for their contribution to the ALICE:fractions project. This study was approved by the responsible local education authority, Munich, Germany (reference: SchR III/Erh106/1). We want to thank all students and teachers for taking part in the study.
References
Anderson, C. J., Verkuilen, J., and Johnson, T. R. (2010). Applied Generalized Linear Mixed Models: Continuous and Discrete Data For the Social and Behavioral Sciences. New York, NY: Springer.
Backhaus, K., Erichson, B., Plinke, W., and Weiber, R. (2018). Multivariate Analysemethoden, [Multivariate analysis methods]. 15th Edn. Berlin: Springer.
Bates, D., Mächler, M., Bolker, B., and Walker, S. (2015). Fitting linear mixed-effects models using lme4. J. Stat. Softw 67, 1–48. doi: 10.18637/jss.v067.i01
Behr, M., Lesh, R. A., Post, T. R., and Silver, E. (1983). “Rational Number Concepts,” in Acquisition of Mathematics Concepts and Processes, eds R. Lesh and M. Landau (New York: Academic Press), 91–125.
Boyer, T. W., and Levine, S. C. (2015). Prompting children to reason proportionally: Processing discrete units as continuous amounts. Dev. Psychol. 51, 615–620. doi: 10.1037/a0039010
Boyer, T. W., Levine, S. C., and Huttenlocher, J. (2008). Development of proportional reasoning: where young children go wrong. Dev. Psychol. 44, 1478–1490. doi: 10.1037/a0013110
Brauer, M., and Curtin, J. J. (2018). Linear mixed-effects models and the analysis of nonindependent data: a unified framework to analyze categorical and continuous independent variables that vary within-subjects and/or within-items. Psychol. Methods 23, 389–411. doi: 10.1037/met0000159
Bright, G., Behr, M., Post, T. R., and Wachsmuth, I. (1988). Identifying fractions on number lines. J. Res. Math. Educ. 19, 215–232.
Butler, F. M., Miller, S. P., Crehan, K., Babbitt, B., and Pierce, T. (2003). Fraction instruction for students with mathematics disabilities: comparing two teaching sequences. Learn. Disabil. Res. Pract. 18, 99–111. doi: 10.1111/1540-5826.00066
Carraher, D. W. (1993). Lines of thought: a ratio and operator model of rational number. Educ. Stud. Math. 25, 281–305. doi: 10.1007/bf01273903
Charrad, M., Ghazzali, N., Boiteau, V., and Niknafs, A. (2014). NbClust: an R Package for determining the relevant number of clusters in a data set. J. Stat. Softw 61, 1–36. doi: 10.18637/jss.v061.i06
Clarke, D. M., and Roche, A. (2009). Students’ fraction comparison strategies as a window into robust understanding and possible pointers for instruction. Educ. Stud. Math. 72, 127–138. doi: 10.1007/s10649-009-9198-9
DeWolf, M., Bassok, M., and Holyoak, K. J. (2015). Conceptual structure and the procedural affordances of rational numbers: relational reasoning with fractions and decimals. J. Exp. Psychol. Gen. 144, 127–150. doi: 10.1037/xge0000034
DeWolf, M., and Vosniadou, S. (2011). “The whole number bias in fraction magnitude comparisons with adults,” in Proceedings of the 33rd annual Conference of the Cognitive Science Society, eds L. Carlson, C. Hoelscher, and T. F. Shipley (Boston: Cognitive Science Society), 1751–1756.
Dotan, D., and Dehaene, S. (2013). How do we convert a number into a finger trajectory? Cognition 129, 512–529. doi: 10.1016/j.cognition.2013.07.007
Faulkenberry, T. J., Montgomery, S. A., and Tennes, S.-A. N. (2015). Response trajectories reveal the temporal dynamics of fraction representations. Acta Psychol. 159, 100–107. doi: 10.1016/j.actpsy.2015.05.013
Fazio, L. K., DeWolf, M., and Siegler, R. S. (2016). Strategy use and strategy choice in fraction magnitude comparison. J. Exp. Psychol. Learn. Mem. Cogn. 42, 1–16. doi: 10.1037/xlm0000153
Goldhammer, F., Naumann, J., Stelter, A., Tóth, K., Rölke, H., and Klieme, E. (2014). The time on task effect in reading and problem solving is moderated by task difficulty and skill: insights from a computer-based large-scale assessment. J. Educ. Psychol. 106, 608–626. doi: 10.1037/a0034716
Gómez, D., and Dartnell, P. (2019). Middle Schoolers’. Int. J. Sci. Math. Educ. 17, 1233–1250. doi: 10.1007/s10763-018-9913-z
Gómez, D., Silva, E., and Dartnell, P. (2017). “Mind the gap: congruency and gap effects on engineering students’ fraction comparison,” in Proceedings of the 41st Conference of the International Group for the Psychology of Mathematics Education, eds B. Kaur, W. K. Ho, T. L. Toh, and B. H. Choy (Singapore: PME), 353–360.
González-Forte, J. M., Fernández, C., Van Hoof, J., and Van Dooren, W. (2019). “Exploring students’ reasoning about fraction magnitude,” in Proceedings of the 43rd Conference of the International Group for the Psychology of Mathematics Education, eds M. Graven, H. Venkat, A. Essien, and P. Vale (Pretoria: PME), 272–279.
Götz, L., Lingel, K., and Schneider, W. (2013). DEMAT 6+. Deutscher Mathematiktest für sechste Klassen, [German mathematics test for grade 6]. Göttingen: Hogrefe.
Hamdan, N., and Gunderson, E. A. (2017). The number line is a critical spatial-numerical representation: evidence from a fraction intervention. Dev. Psychol. 53, 587–596. doi: 10.1037/dev0000252
Hoch, S., Reinhold, F., Werner, B., Richter-Gebert, J., and Reiss, K. (2018a). Design and research potential of interactive textbooks: the case of fractions. ZDM Math. Educ. 50, 839–848. doi: 10.1007/s11858-018-0971-z
Hoch, S., Reinhold, F., Werner, B., Richter-Gebert, J., and Reiss, K. (2018b). “How do students visualize fractions? A finger tracking study,” in Proceedings of the 42nd Conference of the International Group for the Psychology of Mathematics Education, eds E. Bergqvist, M. Österholm, C. Granberg, and L. Sumpter (Umeå: PME), 64.
Hothorn, T., Bretz, F., and Westfall, P. (2008). multcomp: Simultaneous Inference in General Parametric Models. Available at: http://CRAN.R-project.org/package=multcomp (accessed January 10, 2020).
Jeong, Y., Levine, S. C., and Huttenlocher, J. (2007). The development of proportional reasoning: effect of continuous versus discrete quantities. J. Cogn. Dev. 8, 237–256. doi: 10.1080/15248370701202471
Kieren, T. E. (1976). “On the mathematical, cognitive, and instructional foundations of rational numbers,” in Number and Measurement: Papers from a Research Workshop, ed. R. A. Lesh (Washington, DC: ERIC), 101–144.
Kovanoviæ, V., Gaševiæ, D., Dawson, S., Joksimoviæ, S., Baker, R. S., and Hatala, M. (2015). Does time-on-task estimation matter? Implications for the validity of learning analytics findings. J. Learn. Anal. 2, 81–110. doi: 10.18608/jla.2015.23.6
Lortie-Forgues, H., Tian, J., and Siegler, R. S. (2015). Why is learning fraction and decimal arithmetic so difficult? Dev. Rev. 38, 201–221. doi: 10.1016/j.dr.2015.07.008
Meert, G., Grégoire, J., and Noël, M.-P. (2010). Comparing the magnitude of two fractions with common components: which representations are used by 10- and 12-year-olds? J. Exp. Child Psychol. 107, 244–259. doi: 10.1016/j.jecp.2010.04.008
Ni, Y., and Zhou, Y.-D. (2005). Teaching and learning fraction and rational numbers: the origins and implications of whole number bias. Educ. Psychol. 40, 27–52. doi: 10.1207/s15326985ep4001_3
Novillis-Larson, C. (1980). Locating proper fractions on number lines: effect of length and equivalence. Sch. Sci. Math. 80, 423–428. doi: 10.1111/j.1949-8594.1980.tb09687.x
Obersteiner, A., Alibali, M. W., and Marupudi, V. (2020). Complex fraction comparisons and the natural number bias: the role of benchmarks. Learn. Instr. 67:101307. doi: 10.1016/j.learninstruc.2020.101307
Obersteiner, A., Dresler, T., Bieck, S. M., and Moeller, K. (2019a). “Understanding fractions: integrating results from mathematics education, cognitive psychology, and neuroscience,” in Constructing Number, eds A. Norton and M. W. Alibali (Cham: Springer International Publishing), 135–162. doi: 10.1007/978-3-030-00491-0_7
Obersteiner, A., Marupudi, V., and Alibali, M. W. (2019b). “Adults’ strategy use in fraction comparison,” in Proceedings of the 43rd Conference of the International Group for the Psychology of Mathematics Education, eds M. Graven, H. Venkat, A. Essien, and P. Vale, Pretoria: PME, 153–160.
Obersteiner, A., Reiss, K., Van Dooren, W., and Van Hoof, J. (2019c). “Understanding rational numbers – obstacles for learners with and without mathematical learning difficulties,” in International Handbook of Mathematical Learning Difficulties, eds A. Fritz, V. G. Haase, and P. Räsänen (Cham: : Springer International Publishing), 581–594. doi: 10.1007/978-3-319-97148-3_34
Obersteiner, A., and Tumpek, C. (2016). Measuring fraction comparison strategies with eye-tracking. ZDM 48, 255–266. doi: 10.1007/s11858-015-0742-z
Obersteiner, A., Van Hoof, J., and Verschaffel, L. (2013). ““Expert mathematicians’ natural number bias in fraction comparison,” in Proceedings of the 37th Conference of the International Group for the Psychology of Mathematics Education, eds A. M. Lindmeier and A. Heinze, Kiel: PME, 393–400.
Piatt, C., Coret, M., Choi, M., Volden, J., and Bisanz, J. (2016). Comparing children’s performance on and preference for a number-line estimation task: tablet versus paper and pencil. J. Psychoeduc. Assess. 34, 244–255. doi: 10.1177/0734282915594746
Post, T., Behr, M., and Lesh, R. (1986). Research-Based observations about children’s learning of rational number concepts. Focus Learn. Probl. Math. 8, 39–48.
Prediger, S. (2008). The relevance of didactic categories for analysing obstacles in conceptual change: revisiting the case of multiplication of fractions. Learn. Instr. 18, 3–17. doi: 10.1016/j.learninstruc.2006.08.001
R Core Team, (2008). R: A Language and Environment for Statistical Computing. Vienna: R Foundation for Statistical Computing.
Reinhold, F. (2019). Wirksamkeit von Tablet-PCs bei der Entwicklung des Bruchzahlbegriffs aus mathematikdidaktischer und psychologischer Perspektive: Eine empirische Studie in Jahrgangsstufe 6. [Effectiveness of Tablet PCs in Developing Initial Fraction Concepts from a Mathematics Education and Psychology Perspective], Wiesbaden. Berlin: Springer.
Reinhold, F., Hoch, S., Werner, B., Richter-Gebert, J., and Reiss, K. (2020). Learning fractions with and without educational technology: what matters for high-achieving and low-achieving students? Learn. Instr. 65:101264. doi: 10.1016/j.learninstruc.2019.101264
Reinhold, F., Reiss, K., Hoch, S., Werner, B., and Richter-Gebert, J. (2018). “Comparing fractions: the enactive way,” in Supporting Students’ Choice of Appropriate Strategies with iPad-Assisted Instruction. in 2018 annual meeting of the American Educational Research Association (AERA), New York, NY.
Resnick, I., Jordan, N. C., Hansen, N., Rajan, V., Rodrigues, J., Siegler, R. S., et al. (2016). Developmental growth trajectories in understanding of fraction magnitude from fourth through sixth grade. Dev. Psychol. 52, 746–757. doi: 10.1037/dev0000102
Rinne, L. F., Ye, A., and Jordan, N. C. (2017). Development of fraction comparison strategies: a latent transition analysis. Dev. Psychol. 53, 713–730. doi: 10.1037/dev0000275
Rosseel, Y. (2012). lavaan: an R Package for Structural Equation Modeling. J. Stat. Softw. 48, 1–36. doi: 10.18637/jss.v048.i02
Sälzer, C., Reiss, K., Schiepe-Tiska, A., Prenzel, M., and Heinze, A. (2013). “Zwischen Grundlagenwissen und Anwendungsbezug: Mathematische Kompetenz im internationalen Vergleich [Between basic knowledge and application: mathematical competency compared to international standards],” in PISA 2012: Fortschritte und Herausforderungen in Deutschland, eds M. Prenzel, C. Sälzer, E. Klieme, and O. Köller (Münster: Waxmann), 47–98.
Schneider, M., Beeres, K., Coban, L., Merz, S., Susan Schmidt, S., Stricker, J., et al. (2017). Associations of non-symbolic and symbolic numerical magnitude processing with mathematical competence: a meta-analysis. Dev. Sci. 20:e12372. doi: 10.1111/desc.12372
Schneider, M., Merz, S., Stricker, J., De Smedt, B., Torbeyns, J., Verschaffel, L., et al. (2018a). Associations of number line estimation with mathematical competence: a meta-analysis. Child Dev. 89, 1467–1484. doi: 10.1111/cdev.13068
Schneider, M., Thompson, C. A., and Rittle-Johnson, B. (2018b). “Associations of magnitude comparison and number line estimation with mathematical competence: A comparative review,” in Cognitive development from a strategy perspective: A festschrift for Robert S. Siegler, ed. P. Lemaire (New York, NY: Routledge), 100–119. doi: 10.4324/9781315200446-7
Schneider, M., and Siegler, R. S. (2010). Representations of the magnitudes of fractions. J. Exp. Psychol. Hum. Percept. Perform. 36, 1227–1238. doi: 10.1037/a0018170
Siegler, R. S., Thompson, C. A., and Schneider, M. (2011). An integrated theory of whole number and fractions development. Cognit. Psychol. 62, 273–296. doi: 10.1016/j.cogpsych.2011.03.001
Sprute, L., and Temple, E. (2011). Representations of fractions: evidence for accessing the whole magnitude in adults. Mind Brain Educ. 5, 42–47. doi: 10.1111/j.1751-228X.2011.01109.x
Vamvakoussi, X., and Vosniadou, S. (2004). Understanding the structure of the set of rational numbers: a conceptual change approach. Learn. Instr. 14, 453–467. doi: 10.1016/j.learninstruc.2004.06.013
Van Hoof, J., Degrande, T., Ceulemans, E., Verschaffel, L., and Van Dooren, W. (2018). Towards a mathematically more correct understanding of rational numbers: a longitudinal study with upper elementary school learners. Learn. Individ. Differ. 61, 99–108. doi: 10.1016/j.lindif.2017.11.010
Van Hoof, J., Lijnen, T., Verschaffel, L., and Van Dooren, W. (2013). Are secondary school students still hampered by the natural number bias? A reaction time study on fraction comparison tasks. Res. Math. Educ. 15, 154–164. doi: 10.1080/14794802.2013.797747
Keywords: natural number bias, comparing fractions, fraction magnitude, cluster analysis, individual profiles, computer-based assessment
Citation: Reinhold F, Obersteiner A, Hoch S, Hofer SI and Reiss K (2020) The Interplay Between the Natural Number Bias and Fraction Magnitude Processing in Low-Achieving Students. Front. Educ. 5:29. doi: 10.3389/feduc.2020.00029
Received: 30 October 2019; Accepted: 11 March 2020;
Published: 21 April 2020.
Edited by:
Karin Binder, University of Regensburg, GermanyReviewed by:
Ilyse Resnick, University of Canberra, AustraliaErno Lehtinen, University of Turku, Finland
Copyright © 2020 Reinhold, Obersteiner, Hoch, Hofer and Reiss. This is an open-access article distributed under the terms of the Creative Commons Attribution License (CC BY). The use, distribution or reproduction in other forums is permitted, provided the original author(s) and the copyright owner(s) are credited and that the original publication in this journal is cited, in accordance with accepted academic practice. No use, distribution or reproduction is permitted which does not comply with these terms.
*Correspondence: Frank Reinhold, frank.reinhold@tum.de