General Intelligence and Socioeconomic Status as Strong Predictors of Student Performance in Latin American Schools: Evidence From PISA Items
- 1Laboratory of Individual Differences Assessment, Post-Graduation Program in Neuroscience, Federal University of Minas Gerais, Belo Horizonte, Brazil
- 2Department of Psychology, National University of Colombia, Bogota, Colombia
- 3Universidad Católica del Maule, Maule, Chile
- 4Consejo Nacional de investigaciones Científicas y Técnicas, Buenos Aires, Argentina
- 5Facultad de Humanidades, Universidad San Ignacio de Loyola, Lima, Peru
Numerous technical—scientific reports have demonstrated that student performance variability is linked to several factors, especially socioeconomic factors. For a century, differential psychology has shown that students’ socioeconomic level has little or no relevance in the explanation of student performance variation when the intellectual factor is considered. Here we present a study on a student samples (N = 1264) aged 13 to 16 yrs, enrolled in 32 schools from five Latin American countries (Argentina, Brazil, Chile, Colombia, and Peru). A short version of the PISA test (composed by 16 items) and five cognitive measures were administered, in addition to a socioeconomic questionnaire. Multilevel analysis (marginal models) indicated that general intelligence (g-factor) and socioeconomic school status were robust predictors, and the students’ socioeconomic status very little accounted for the variation in the PISA test. This study concludes that education policy must incorporate individual differences in intelligence, beyond socioeconomic variables, as an important predictor variable in student performance studies.
Introduction
At the end of the 1990s, the Organization for Economic Co-operation and Development (OECD) envisaged the increasing importance of education in the development of skills that would allow citizens to adapt and absorb rapid changes in technology. From this, the OECD developed and promoted in 2000 a large-scale assessment of 15-year-old students through a test termed PISA (The Programme for International Student Assessment). The PISA test is an assessment tool, conducting three-yearly surveys, that scores reading, mathematic and scientific literacies. The focus of this assessment is not surveying memorization or simple knowledge. The PISA test items focus on how well students apply knowledge to solve real-world problems (OECD, 2001). In the first survey (2000–2001) 43 countries participated in the PISA assessment, which increased to 79 countries in the last survey, conducted in 2018. After seven PISA surveys, the result has been consistent, where students from developed countries present better performance than students from developing countries. Presented in this way, this result over time suggest the hypothesis that education drive national economies forward. In this regards, studies estimated that an increase of 0.5 standard deviations in PISA scores, would lead to an increase in national Gross Domestic Product per capita of up to 5% (Hanushek and Woessmann, 2007; Hanushek and Woessmann, 2015). Thus, it is not surprising that most nations are focused on these findings regarding the basic or fundamental skills for the development of their citizens and socioeconomic impact.
Latin American Region
Education foster national economic growth, and this evidence has been accepted by some Latin American governments. Despite an expected unsatisfactory result, five Latin American countries participated in the first PISA survey (2000–2001), and nine countries (Argentina, Brazil, Chile, Costa Rica, Colombia, México, Peru, Panama, and Uruguay) participated in the most recent PISA survey (2018). Only two countries (Brazil and Mexico) participated in all surveys. Considering the average of all assessments, Chile and Uruguay have had the highest mean score in the PISA test, while the Dominican Republic, Panama, Peru, and Brazil have had the lowest. In general, all participating Latin American countries performed below the OECD average, which formed a relative cluster within the general picture of the PISA assessment (Figure 1).
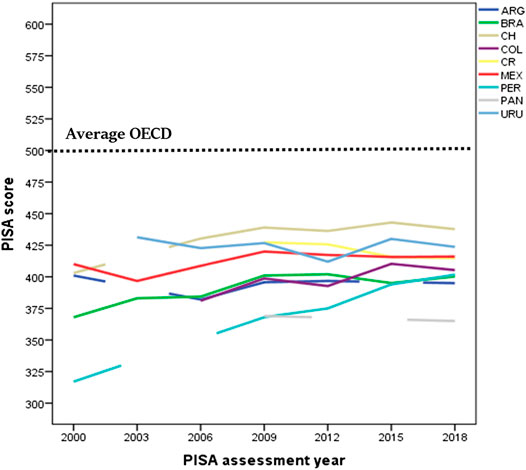
FIGURE 1. Average PISA score of each Latin American country over time (except the Dominic Republic which only participated in the 2015 PISA assessment).
The most worrying result was that a large share of Latin American students underperformed in level 2 (out of six levels). For instance, in the first 2000 PISA survey, which emphasized reading skills, the percentage of students that performed at level 1 (students that show basic skills) plus below level 1 (students that are not able to show most basic skills), varied between 44 and 80%. This considerable percentage did not change in the next assessments (48–75% in 2003- mathematic emphasized; 40 to 60% in 2006- sciences emphasized; 40 to 64% in 2009- reading emphasized; 51.5 to 74.6% in 2012-mathematic emphasized; 23.3 to 46.7% in 2015-science emphasized, and 35 to 79% in 2018-reading emphasized). Translated to years of schooling, these results are equivalent to a gap of 1.7 years of schooling for the Latin American country with the best performance (Chile), and a gap of 3.1 years of schooling for the Latin American countries with the lowest performance (Peru and Colombia), compared to the OECD countries (OECD, 2016). Note that the estimation of the schooling gap is independent of the subject assessed (Math, Reading or Science), given the high correlation (above 0.80) among them. In 2018, the proportion of Latin American human capital capable of understanding complex situations and provide innovative solutions (top performers) varied between 0.1% (Dominican) to 3.5% (Chile) compared to 15.7% from the OECD average (OECD, 2019a). The Latin American results dramatically contrasted those observed in some Asian countries (e.g. China, Singapore, Korea) and some European countries (e.g. Ireland, Finland, Poland, Estonia), where the majority of students (60%) perform at level 3 above, and there is a proportion of top performers, ranging from around 20% (Finland, Ireland) to 45% (ex. China, Singapore).
Factors Pointed Out as Predictors of the Performance in the PISA Test
Since the first PISA assessment, a significant number of publications have been produced. For instance, between 1999–2015, a thousand documents (Hopfenbeck et al., 2018) analyzed several factors that could explain the variation in student performance. Among these factors were educational features (e.g. repetition rates, enrollment rates in tertiary education, attending pre-primary school, financial capacity to provide quality education services, spending per students, number of teachers per student, teachers’ salaries, percentage of teachers with at least a master’s degree), gender differences, family background (parental occupational status, parental education, family wealth, parents’ expectations for their child’s future), school’s socio-economic composition, characteristics of high learners (motivation, attitudes, self-related beliefs, anxiety, learning habits, life satisfaction), exposure to bullying, learning engagement, student truancy, immigrant status, access to internet, spending time online outside of school, spending time playing videogame, or school and classroom climate (OECD, 2001; OECD, 2004; OECD, 2005; OECD, 2007; OECD, 2010; OECD, 2013; OECD, 2016; OECD, 2018; OECD, 2019a).
From all factors analyzed, those related to socioeconomic background variation have received considerable attention of education policy makers and researchers (Coleman et al., 1966; Avvisati, 2020). In the 2018 PISA survey, the 10% most socioeconomically advantaged students outscored their 10% most disadvantaged counterparts in reading by 1.5 standard deviation (150 points or three years of schooling). This gap in school performance has persisted over the last decade, despite a 15% increase in education spending (Schleicher, 2019). Regarding Latin American countries, the OECD (2016) has identified that students from some countries (e.g. Brazil and Argentina) underperformed students from countries with the same level of economic development (e.g. Thailand and Bulgaria). Additionally, simulations showed that even if Latin American students had the OECD average socio-economic status, there would be an increase of 28 points on PISA average scores, but there would not be changes in the general ranking. On the other hand, between 6% to 20% of the PISA variation was explained by the socio-economic status of Latin-American students, proportions that are not so different to the OECD average (15%), however, when the inter-school socioeconomic status (between-school) is taken into account instead inter-student socio-economic status (within-school), a strong association with student performance is revealed. For instance, in México, a one-unit increase in the socio-economic status of students is associated with an increase of five points in mathematics, but a one-unit increase in the school socio-economic status is associated with 30 points in mathematics. This kind of results was observed in all PISA surveys.
Despite the gathering of information and analysis of a wide range of psychosocial variables, no PISA survey considered the administration of intelligence measures. Historical and cultural reasons may underlie why education policies take no notice of the concept of intelligence (Maranto and Wai, 2020). As this study will demonstrate, intelligence exerts a strong influence on student performance beyond socioeconomic factors, a critical point that has been ignored in the educational field.
Intelligence and Student Performance
It is not our intention to elaborate on the history of differential psychology, but it is worth remembering that the Stanford-Binet scale was the first intelligence test created in the beginning of 20th century for educational purpose (Terman, 1916). A century has passed since the creation and massive use of intelligence tests, and countless studies have indicated that, independent of the applied cognitive measure, it correlates significantly with student performance and, consequently, explains a significant part of the student performance variation (between 20 and 40%) (Roth et al., 2015). For example, Strenze (2007) conducted a meta-analysis of 85 longitudinal datasets, where predictors (intelligence, parental SES, and student performance) were surveyed at an earlier time and the dependent variable career success (composed by education, occupation, and income) at a later time, minimum three years between the surveys. Regarding education, intelligence was the stronger predictor than the other two predictors. Although other psychological factors (e.g. motivation, self-control, personality) also correlate with any aspect of education, intelligence is the best single predictor (Kuncel et al., 2004; Leeson et al., 2008) which has been recognized by the world's most influential intelligence researchers (Neisser, Boodoo, Bouchard Jr., Neisser et al., 1996; Gottfredson, 1997; Hunt, 2010).
However, there is a particular issue in the literature about the relationship between intelligence and its correlates, especially those of education. The correlation between education and intelligence is stronger when intelligence is represented at general level instead measured by a score on a specific ability test (Coyle, 2015; Cucina et al., 2016; Costa et al., 2018). General intelligence is represented by a g-factor, which refers to the broader mental ability extracted from a correlation matrix of a battery of diverse and reliable cognitive tests. According to Jensen (1998), independently of the specificity of the information content, skill, or strategy of the mental tests, the g-factor is the source of variation associated with the efficiency of neural processes that affect cognitive behavior. If the g-factor is the best estimate of intelligence, stronger correlations are expected between this level of cognitive generality and student performance, than with specific abilities.
On the other hand, the significant relationship between student performance and intelligence has been verified through studies that use individual–level data designs. From the present millennium, the same relationship was identified in studies working at national-level data (Lynn and Vanhanen, 2002; Lynn and Becker, 2019). According to these studies, the intelligence of the nation relates to several educational outcomes such as technological achievement over a millennium (from 0.42 for 1000BC to 0.75 for 2000 AD; Lynn and Becker, 2019), adult literacy (r = 0.64; Lynn and Becker, 2019), patents indexes (r = 0.51; Gelade, 2008); Nobel prize in science (r = 0.34; Rindermann et al., 2009); technology exports (r = 0.38; Rindermann et al., 2009). Moreover, the correlation between intelligence of nations and international student assessment such as TIMMS (Third International Math and Science Study), PISA, PIRLS (Progress in International Reading), IEA-Reading (International Association for the Evaluation of Educational Achievement), IAEP-II (International Assessment of Educational Progress) was not less than 0.80 (also see in Rindermann, 2007; Rindermann, 2018; Lynn and Becker, 2019), a value that is much higher than what is obtained in studies that use data at the individual level. Not surprisingly, the strong correlation between intelligence and education assessment at national level led some differential psychologists to asserts that, empirically and theoretically, there is no significant differences between them (Rindermann, 2007). However, cross-nation estimates rely on aggregated data., i.e., multiple sources of school and intelligence assessments compiled into data summaries. Data of international school assessment usually are reliable and use representative sample, while cognitive data of nations usually come from small studies that use unrepresentative samples, present insufficient information regarding the quality of the tests, and were administered at different years of the XX century. Thus, the conclusion that intelligence and student performance is the same phenomenon has been built on fragile data sources. Furthermore, if the relationship between these two variables is almost perfect, it would be expected that the factors influencing intelligence must influence student performance in the same intensity. However, there is reasonable evidence that it does not happen. For instance, there is a certain consensus that student performance is sensitive to socioeconomic factors (e.g., high SES students outperform low SES students) (Daniele, 2021), while intelligence seems to be less affected by socioeconomic differences (O’Connell and Marks, 2021). Strong evidence that genetic components of intelligence are not moderated by socioeconomic factors (SES) is the study conducted by Hanscombe et al. (2012), where 8,716 twin pairs clustered in eight ages (from infancy through adolescence) were analyzed. The genetic effect on intelligence did not differ for low and high SES groups; however, a shared environment (e.g., parental education, family income, occupation) influenced a little more the low SES families than high SES families. This influence decreased with age, meaning that intelligence is influenced differently by the shared environment and genetic factors throughout the life cycle. On the other hand, age affects intelligence sooner than it affects education (Lenehan et al., 2015). In the case of fluid intelligence, which matches the g-factor, it reaches a plateau between the end of adolescence and early adulthood (Hartshorne and Germine, 2015), i.e., there is no significant increase in performance on non-verbal cognitive measures after 18–20 years of age. That is one reason why intelligence (or g-factor) is considered a biological phenomenon with ontogenetic characteristics (Jensen, 1998). Regarding education performance, age can act negatively through the distortion age-grade, which can be related to individual cognitive differences (promotion-delay) or the delay that students enter the school system (a phenomenon named RAE-relative age effect; Juan-Jose et al., 2015). Sex is another variable that may affect intelligence and student performance differently. For instance, there is controversy about whether sex affects specific cognitive abilities or affects the g-factor (Halpern et al., 2020). The sex effect on education is only on specific domains such as math, favoring males, and reading, favoring females (see Trucco, 2014 for data from Latin American countries). Hence, intelligence and student performance are not twin constructs, but it is recognized that they may exhibit a strong dependence on each other.
Moreover, the dependence degree between student performance and intelligence seems to vary according to the development degree of nations. Since the famous Coleman report (Coleman et al., 1966), countless studies have confirmed the main result of that report that 80 to 90% of the total variance in student performance was due to students’ characteristics, and between 10 to 20% was due to characteristics of schools. However, these results fit well in developed countries, not in developing countries. The review of the Coleman report (as it was known) after 40 years conducted by Gamoran and Long (2006) with data of developed and developing countries indicated that schools might account for 57% of the student performance variance in the Latin American region.
In this sense, to verify whether intelligence and student performance reveal a strong dependency regardless of cultural settings, it requires overcoming the use of compiled data. To our knowledge, no cross—national empirical study has been conducted using simultaneously an international school test such as PISA test and cognitive measures. Moreover, no cross-national study used individual-level data and analyzed the influence of intelligence at the latent level (g-factor). From this, the SLATINT project (Study of Latin American Intelligence) came to be developed. We considered that the obtained results are pertinent to the proposal of the present edition.
The SLATINT Project
In 2007, a group of Latin American researchers from six Latin American countries (Argentina, Brazil, Chile, Colombia, Mexico, and Peru) designed a large-scale assessment using the PISA test and several cognitive measures in each Latin American country. The project was termed “Study of Latin-American Intelligence” (SLATINT). To that end, measures, questionnaires, general and specific instructions for data collection, logistics for sending the material to the participating countries, receipt, examination, and codification of the protocols were planned by researchers in face-to-face and virtual meetings (video call). The project was conducted between 2007 and 2010, which included a total sample of 4,074 students. The SLATINT results can be summarized in three points: 1) positive relationship between the PISA test and cognitive measures, although a stronger correlation was observed as aggregated, rather than when individual scores were used; 2) after controlling social variables, the PISA scores could present stronger variability due to the variations in cognitive scores; 3) the socioeconomic status of schools had a greater influence on PISA scores than the socioeconomic status of students, and 4) Sex and age differences did not affect cognitive measures, but slightly affected the PISA test (Flores-Mendoza, et al., 2015; Flores-Mendoza et al., 2017). However, the obtained results were based on the administration of just one cognitive measure. Recently (Flores-Mendoza et al., 2018), it was analyzed the relationship between the PISA test score and intelligence differences at the latent level using a generalized linear mixed model, where the individual is the target (subject-specific model) of inference. The obtained results were similar to previous studies.
Propose of this Study
This paper aims to present the results based on a population-averaged model, also named marginal model, regarding the influence of a set of predictors (sex, age, kind of school, SES of schools, SES of students, g-factor) on the PISA test using the SLATINT data. Marginal models are robust and less susceptible to biases from misspecification of random effects (Heagerty and Kurland, 2001). Unfortunately, the Mexican sample was small (N = 66), and recruited only in a private and high SES school. Thus, without variation in SES school, data from Mexico was not included in the analysis.
Methods
Participants
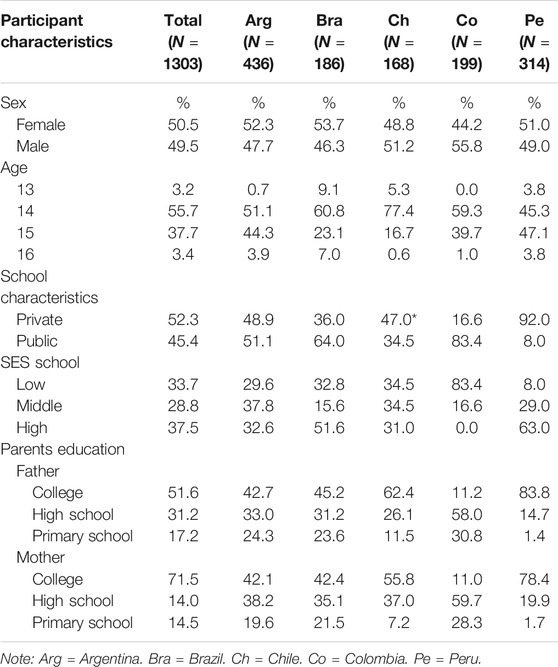
1303 students enrolled between grade 8 and 10 (73% ninth-grade) from 32 schools and five Latin American cities (Rosario-Argentina, Belo Horizonte-Brazil, Santiago-Chile, Bogota-Colombia and Lima-Peru) participated in this study, which it was conducted between 2007 and 2011 (80% in 2008–2009). Table 1 shows the average number of students per school (mean = 40.72; min = 15 and max = 111). The average number of students per country was 260.6 (min = 168 and max = 436).
The sociodemographic characteristics of the sample by country are shown in the Table 2. As it can be seen, the samples are not representative of their countries. For instance, according to the statistics of the Economic Commission for Latin America and The Caribbean (https://www.cepal.org/en), the percentage of population aged 25 and 59 years with schooling above high school does not exceed 30%. However, in our samples, except for Colombia, there was a high percentage of parents (especially Peruvian mothers) with tertiary education. Additionally, there was a percentage of private schools that participated which was not expected for some countries. For example, 20% of all Brazilian students are enrolled in private schools, however in our sample, 46% of the Brazilian students in this study were enrolled in private schools. This occurrence was even more pronounced when considering Peru, where almost all schools were private (92%). In Colombia, 60% of students are enrolled in public schools, however, in our study 83.4% of students were studying in public schools. In Argentina, 70% of students are enrolled in public schools (Vior and Rodríguez, 2012), however, in our study 51% of students were enrolled in public schools. The Chilean sample was more representative of Chile, where 45% of students are enrolled in private schools (Bellei, 2008), almost the same proportion found in our study. In general, with the exception of the Colombian sample, students came from families and educational backgrounds with better resources than the average of the Latin American population.
Measures
PISA 2003–short version. The PISA 2003, complete version, contained 85 items distributed in four clusters of mathematical areas (Space and shape, Change and relationships, Quantity, and Uncertainly), which required to activate three cognitive skills groups (Reproduction–simple mathematical operation; Connection–bringing together ideas to solve straightforward problems, and Reflection–wider mathematical thinking) (OECD, 2004; page 24). A short version was available on the website of the Brazilian Ministry of Education. This version contained 29 items, which were in a mixture of multiple-choice and constructed-response formats. Despite their format, all the items requested only one right answer. A pilot study with 181 Brazilian students indicated an alpha coefficient of 0.906, and it took, on average, 2 h. A reduction version was necessary due to the limited time offered by the schools for administering all the instruments proposed by the project. However, the shorter version had to preserve the accuracy and validity of the previous version. To accomplish such requirements, the item response theory (IRT) was used. IRT is a model that assumes that each item within a scale is a measure of some underlying construct, and the latent variable causes the observed item responses. This model detects the error variance (measurement errors) and provides a test of overall model fit and model fit indices. We conducted a Rasch analysis (a special case of IRT) for dichotomous items using the software WINSTEPS 3.63.2 (Linacre, 2007). It was detected that by deleting a maximum of 13 questions, the person separation reliability (used to classify people) of the new version of the PISA test (16 items) was 0.875, a value considered acceptable. All 16 items showed fit indices between 0.50 and 1.50, meaning good fit indices. Rasch factor analysis indicated a 62.1% of the variance explained, which supported the hypothesis of unidimensionality and an eigenvalue of 2.4 (or 3.2% of the variance) explained by the first contrast. This last result indicated a minimal deviation from de unidimensionality, but it was not considered a threat to the short PISA test version’s validity. The set of 16 items were representative of Space and Shape (n = 3), Change and Relationship (n = 5), Quantity (n = 4), and Uncertainly (n = 4), and they demanded Reproduction (n = 8), Connection (n = 6), and Reflection (n = 2) skills. Example of item of each area, kind of skills demanded by each item (according to OECD, 2013), and results from Rasch model are in Supplemental Material. In order to extend the validity of this version, a second pilot study with PISA-16 items was conducted in a sample of 167 Brazilian students. The new version took, on average, 1 h and 15 min. The reliability of the 16-item version (Cronbach’s alpha) was 0.844, and it was associated to the Raven test at 0.650. The correlation between the 19-item and 16-item version was 0.970. Thus, the shorter version of the PISA test preserved its reliability and validity. Native Portuguese and Spanish speakers conducted double-check translation of the PISA test (Portuguese to Spanish language). In the present study, the Cronbach Alpha (reliability) for the total sample was 0.807, varying from a minimum of 0.706 (Colombian sample) to a maximum 0.835 (Brazilian sample).
Standard Matrices Progressives of Raven (SPM). The SPM was the cognitive measure used in this study. This non-verbal exam is the most frequently used test to study cognitive differences at the individual, as well as at the national level (Lynn and Vanhanen, 2012). Additionally, the SPM is considered a good measure of basic cognitive functioning (Raven et al., 2000; Jensen. 1998). In the present study, the Cronbach Alpha (coefficient of reliability) of SPM was 0.885, varying from a minimum 0.859 (Colombian sample) to a maximum of 0.916 (Argentina sample). Test takers were allowed 45 min to complete the SPM test.
Berlin Intelligence Structure Model (BIS tasks). Four subtests of the BIS battery (Rosas, 1996), which took between 1 to 2 min to complete, were administered to the samples. These were: BIS_MF (a figural short term memory test), BIS_PN3 (a numerical reasoning test), BIS_RN3 (a numerical reasoning test), and BIS_RN1 (a numerical simple mental speed test). The Cronbach Alphas were 0.870 (BIS_MF), 0.647 (BIS_PN3), 0.905 (BIS_RN3), and 0.812 (BIS_RN1).
Socio-economic questionnaire for students. There was no standardized Latin American approach to measure socioeconomic status. For this reason, the Latin American researcher team defined that the estimation of the SES student would be based on available resources found at their home (e.g. cable TV, MP3Player, Phone, Computer, Internet, Videogames, and Weekend Magazine), and parents level of education (mother and father). Each item of available resources in home represented one point. Regarding education of parents, the lowest level of schooling was equivalent to primary school and the higher level was college.
Socio-economic classification and questionnaire for schools. Schools were classified as low, middle, and high SES in each country. At least two representative schools from each socioeconomic stratum were required. Samples of schools from Peru and Brazil were randomly selected, however the collection data for all cognitive measures in Peru was not attained in low SES schools. School samples from Chile, Argentina and Colombia were non-probability samples. In these cases, researchers selected schools based on their available knowledge about school infrastructure and socioeconomic characteristics of the community where the schools were located. In order to validate their subjective appreciation, researchers responded to a questionnaire regarding sanitary and urban conditions (e.g. waste collection system, drainage system, public street lighting, etc.), and items regarding school environment (e.g. school instruction time, class size, mathematic instruction time, presence of computers). The points accumulated in this questionnaire were correlated to the SES school classification performed by the researchers. The result was a r of 0.72 (p = 0.05) for Chile and 0.63 (p = 0.03) for Colombia. The Argentinean researcher could not collect information related to this questionnaire. So in this case, we correlated the Argentina classification of SES school with SES of students (r = 0.610), education level of father (r = 0.641) and mother (r = 0.671). We considered all these results as evidence of validity of the SES classification of schools.
Analysis
The dataset was composed by 32 schools and samples from five countries. There were 39 missing values for PISA score, thus all variables related to these cases were eliminated of the dataset.
Absolute and relative frequencies were used for qualitative variables, and measures of central tendency and dispersion were used for quantitative variables, and Eta correlation in cases of nonlinear relationship.
Intelligence was represented at the latent level, using the five cognitive measures (described in Instruments). These cognitive measures were subjected to principal axis factoring (PAF), which analyzes only the common factor variance of the tests. Inspection of the correlation matrix (Table 3) revealed the presence of coefficients of 0.3 and above. The Kaiser-Meyer-Olkin value was 0.802, and the Barlett’s Test of Sphericity reached statistical significance, supporting the factorability of the correlation matrix. PAF analysis revealed the presence of only one factor explaining 40% of the variance. We used the factor score as a representative of intelligence at the latent level (g-factor).
Our dataset can be considered a clustered data with hierarchic structure: students within schools, and school within country. The statistical approaches that address the description of systematic variation in the mean response as well as associations among observations within clusters include marginal models fit with generalized estimating equations (GEE). Our interest was the estimation of overall population average relationships between independent variables (e.g. g factor, sex, age, SES) and dependent variables (e.g. PISA score) across all of the different clusters. The term ‘marginal mean’ refers to the averaging over both measurement errors and random interindividual heterogeneity. This model does offer advantages over other approaches for dependent data. First, GEE has been popularly applied because it is the easiest to understand and it is more relaxed when considering distribution suppositions or when there are variables that are not continuous. Second, marginal models allow inferences about overall marginal relationships and permit calculate robust standard errors that reflect the sampling variance in the estimated parameters that arises from the clustered study design. Marginal model is considered a population-level approach and it provides the population-averaged estimates of the parameters. Thus, the target inference is the population (Liang and Zeger, 1986).
A symmetric working correlation structure was inserted in the population-averaged model to account for the correlation among students from the same school. To estimate the parameters of the population-average model, estimation equations proposed by Prentice, 1998) with the ‘geese.fit’ function of the ‘geepack’ package of R software (version 3.3.1) were used.
The model was initially adjusted with all the explanatory variables of interest and, later, the Backward method (Efroymson, 1960) was applied for the final selection of the variables. The Backward method is the procedure of removing the variable with the highest p-value, and the analysis is repeated until only significant variables remain in the model. In the Backward method, a level of significance of 5% was adopted.
Specification of the Marginal Model
Considering
The correlation among students from the same school was computed by symmetric working correlation structure:
Considering discrete data and the possibility of over or under dispersion of the data, the variance was computed by:
Where
Results
Descriptive Statistic
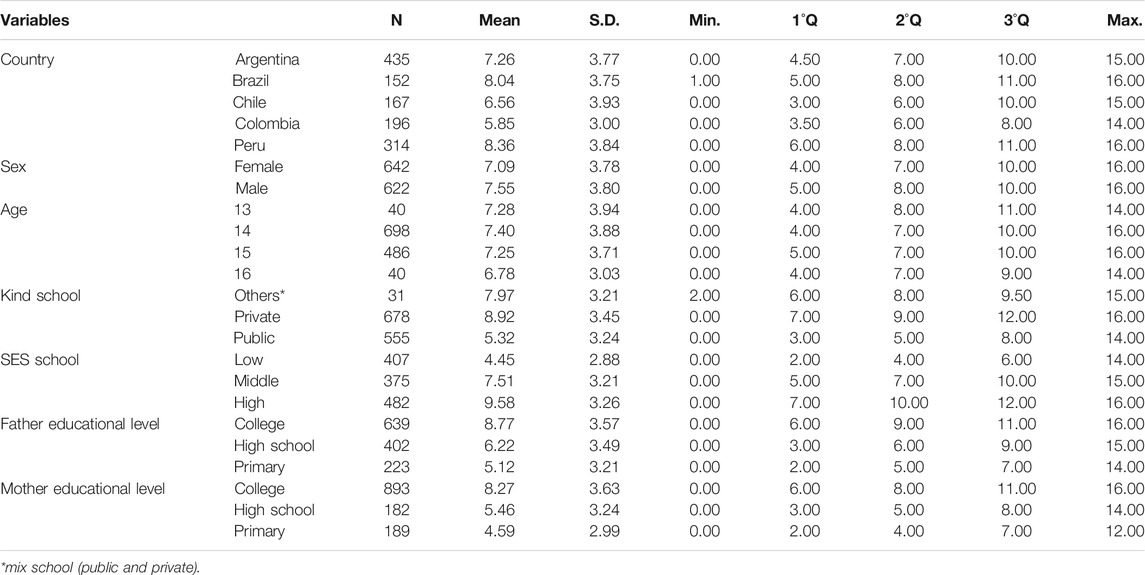
Table 4 indicates that the Peru and Brazil samples had highest PISA test mean scores, while the Colombian sample had the lowest mean score. The highest PISA test score was presented by the Chilean sample. Males had higher score than females, and 16-yrs old students had a lower score than 14-yrs old students. Students whose parents had a high level of education outscored students whose parents had a low level of education.
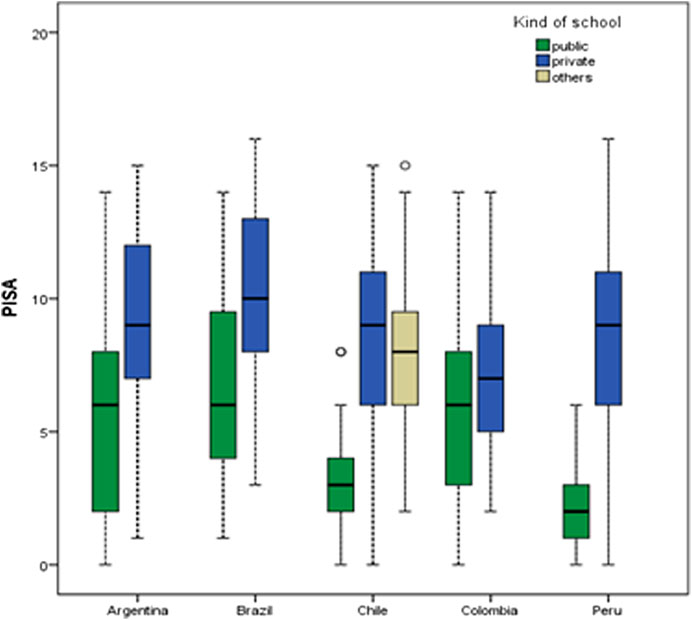
Figure 2 shows differences between kind of schools. For all samples, private schools outscored public schools. The between-schools gap was more pronounced in the Chilean and Peruvian samples and less pronounced in the Colombian sample.
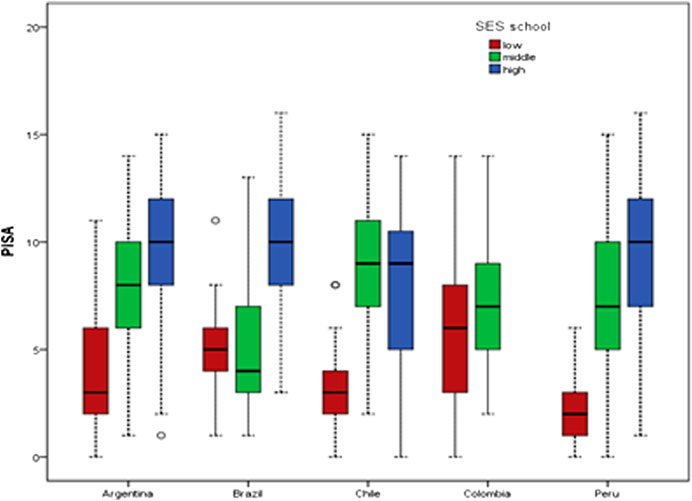
Figure 3 shows that high SES schools had higher PISA test mean score than middle SES schools, and middle SES schools had higher PISA test mean score than low SES school. Note that there was no high SES school in the Colombian sample.
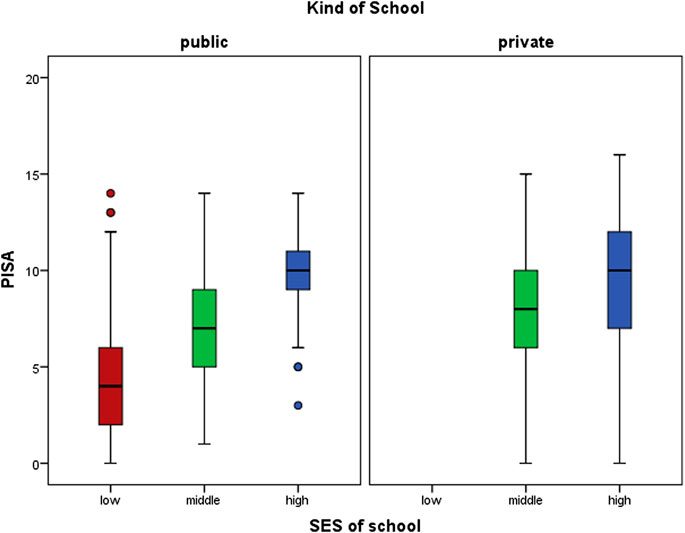
Figure 4 shows that high SES schools presented higher PISA test score than middle SES schools, independent of being private or public. Middle SES school (public and private schools) showed higher PISA test score than public SES school.
SES student scores were converted to percentiles (p < 25, P50, and p > 75). Figure 5 shows that independent of individual SES and kind of school, students who were enrolled in high SES schools outperformed students who were enrolled in low SES schools.
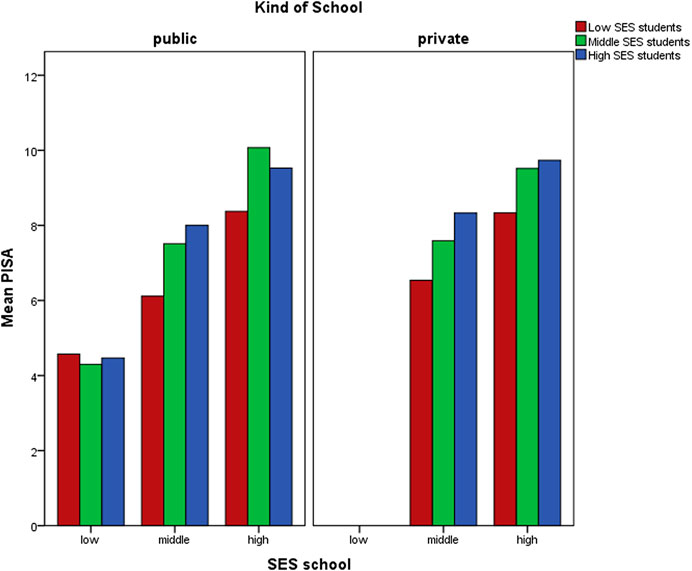
FIGURE 5. Distribution of mean PISA score in each SES school, according to SES student classification, and kind of school.
The correlation matrix with ordinal variables is presented in Table 3. The PISA test and g-factor correlated at 0.643 (Pearson coefficient)/0.649 (Spearman coefficient). This values corroborate the values obtained in traditional studies regarding school performance and intelligence. The correlation between the PISA test and SES students was also significant, but lower than g-factor.
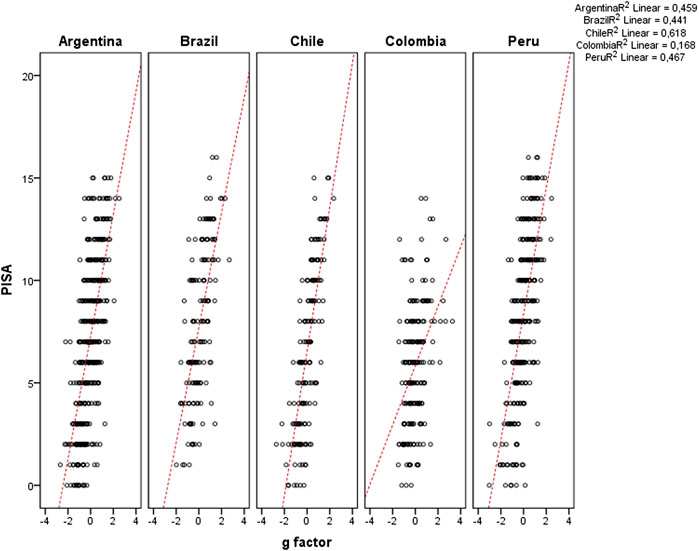
Considering sample from each country, Figure 5 shows the scatter plot of PISA test results and g-factor score. The correlation was from a minimum 0.409 (p = 0.000) from the Colombian sample, to a maximum 0.786 (p = 0.000) from the Chilean sample.
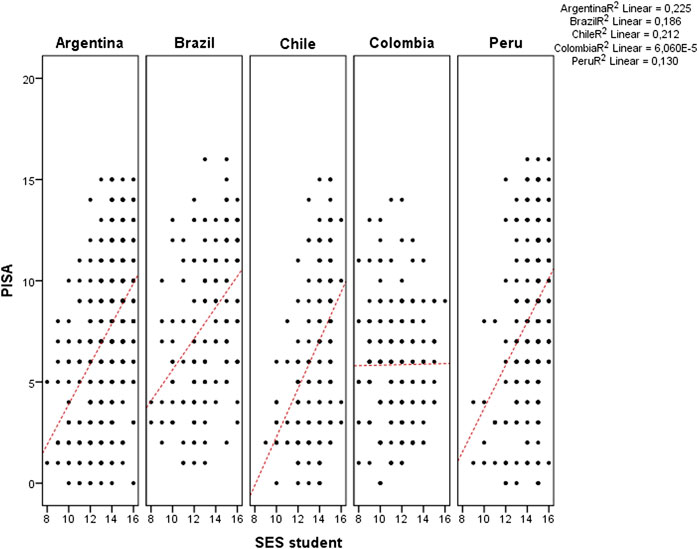
Figure 7 shows the scatter plot of PISA test results and SES of students. The correlation was from a minimum 0.008 (r non-significant) from the Colombian sample to 0.470 (p = 0.000) from the Argentina sample.
Eta, the coefficient of nonlinear association, indicated a value of 0.100 (weak association), 0.101 (weak association), 0.444 (medium association), and 0.571 (medium association) between PISA test score and age, sex, kind of school, and SES school respectively.
Population-Averaged Model
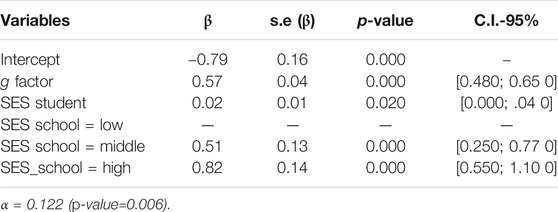
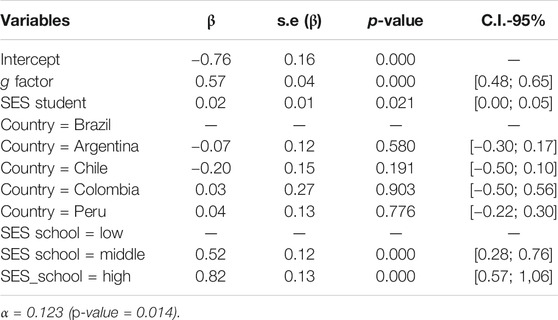
The complete population-averaged model with all variables of reference (g-factor, SES of student, country, kind of school, SES of school, sex, and age) indicated that only g-factor, SES of student and SES of the school were important contributor to explain the PISA test score. After the application of the backward algorithm to select significant variables, we arrived at this model presented in Table 5.
The final model (Table 5) indicated that the g-factor influenced the PISA test score (p-value = 0.000). For each additional standard deviation to the mean g score, an average increase of 0.57 units [0.48; 0.65] in the mean PISA test score could be expected. In the same direction, SES of students influenced the PISA test score (p-value = 0.020). For each additional unit in SES of students, an average increase of 0.02 units [0.00;.04] in the mean PISA test score could be expected. On the other hand, students enrolled in middle SES outscored students from low SES schools (p-value = 0.000). They had an average value of 0.51 units [0.25; 0.77] higher than students enrolled in low SES schools. Differences were more accentuated with students enrolled in high SES schools. They had an average value of 0.82 units [0.55; 0.1.10] higher than students enrolled in low SES schools (p-value = 0.000). Note that α parameter quantifies the correlation of the PISA test score among students from the same school. In our study the α was 0.122 and significant (p-value = 0.006), i.e., there was homogeneity among students from the same school.
To allow for comparison between countries, the PISA's final model was adjusted with the country variable, with Brazil as a reference, as shown in Table 6. No significant difference (p-value > 0.05) between Brazil and the other countries concerning PISA test results were observed.
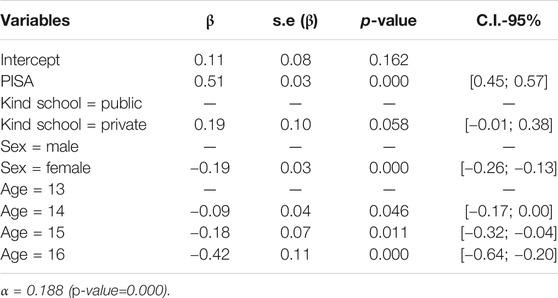
The same procedure was conducted with g-factor, as a dependent variable. The complete population-averaged model with all reference variables (PISA test score, SES of student, country, kind of school, SES of school, sex, and age) indicated that only the PISA test score, sex (female), and age were important contributors to explain the g-factor variability. After applying the backward algorithm to select significant variables, we arrived at the model presented in Table 7.
The final model (Table 7) indicated that the PISA test performance influenced g (p-value = 0.000). For each additional standard deviation to the mean of the PISA test, an average increase of 0.51 units [0.45; 0.57] in the mean g value could be expected. There was influence of sex on g (p-value = 0.000). Females had a lower mean value of g [-0.19 units; C.I. 95% = -0.26 to -0.13] than males. Similarly, age influenced g. Students at 14, 15, and 16 years old underperformed significantly 13-years-old students.
Discussion
Here we presented results from the SLATINT project based on simultaneous administration of a short version of 2003 PISA and cognitive measures, to students from five Latin American countries. To the best of our knowledge, there are no other studies that have presented date of this kind. The project was designed to answer the extent to which cognitive ability and social variables influence Latin American students’ academic performance. Three important results are discussed:
g-factor and School Performance
The influence of intelligence at the latent-level (or g-factor) on student performance was higher (57%; Table 3) than the influence of intelligence measured by a single test (35%) (see this last result in Flores-Mendoza et al., 2015). This result was expected as student performance shares a strong common factor, which is indistinguishable from g, if compared to the influence of a cognitive ability measured by just one test (Jensen, 1998). In others words, if the PISA test requires several domains (e.g. reading, mathematics, science) it is assumed that the activation of general intelligence is greater than the activation of specific cognitive skills. For instance, one item of the PISA test was related to the internet chat between Mark (from Sydney, Australia) and Hans (from Berlin, Germany). The world time table indicates that Mark and Hans were not allowed to chat from 9:00 am to 4:30 pm due to their respective time zones (school time hours) or between 11:00 pm and 7:00 am (bedtime/late hours). Thus, what time would be a good time for Mark and Hans to have a chat? According to the PISA test developers, this item is representative of Changes and Relationship (math area) and it demands a cognitive skill named as Reflection (see classification of all items in supplemental material A). However, our interpretation is that this item does not require just a cognitive skill, it requires a good understanding of reading, mathematics, and science (time zones between countries), and concomitantly, it requires the joint work of various mental skills (for example, verbal, mathematical, spatial reasoning). Thus and considering the high internal consistency of the PISA test-short version test used in the present study (α = 0.807) we inferred that the PISA test required more g than a specific cognitive ability, which explain the higher correlation obtained in the present study compared to the previous studies.
The Relationship Between School Performance and G-Factor is Strong, but, as Expected, it is Not Perfect as Aggregate Data Analyses Would Suggest
General (using total sample) and the within-countries correlations indicated values between a minimum of 0.409 and a maximum of 0.786. None correlation in the present study reached the values of aggregated data analysis (above 0.80) presented in studies as those of Rindermann (2018) or Lynn and Becker (2019). Generally, aggregate analyses present a bias leading to inflated estimates above the corresponding values from micro-level data. The origin of this bias is in the error variance and measurement error (Ostroff, 1993). Additionally, aggregate data are assigned equal weight to different sample sizes, which affect the resulting mean effect (Volken, 2007). Therefore, we maintain our assertion made in 2015 (Flores-Mendoza et al., 2015) that school performance is strongly associated to general intelligence (or g-factor), but both are not perfectly associated, thus both are not the same construct. Moreover, factors that affected the PISA test score (Table 6) were not the same that affected g variation (Table 7). For instance, SES-school affected the PISA test score, but not g; sex (female) did not affect the PISA test, but affected g; age did not affect the PISA test, but negatively affected g; SES-student slightly affected the PISA test, but not g. Therefore, both constructs, despite their strong association, were influenced differently by the variables proposed by the study design. The results seem to indicate that student performance is more sensitive than g to the socioeconomic influence, and g is sensitive to biological factors, such as sex (see specialized discussion about it in Halpern et al., 2020) and age (distortion age-grade due to individual differences in intelligence, i.e., students at a lower age were more intelligent than older students in the same grade).
g-Factor was Not the Only Source of PISA Variation
The another strong predictor was related to socioeconomic differences between schools, and less to socioeconomic status of students or kind of school. Note in Figure 3 that even in the public educational system, schools with better socioeconomic status scored better on the PISA test. Thus, low SES-students could benefit from studying in high SES schools. However, what is considered to classify a SES of schools in the present study? In general, several indices can be part of the school composition. For instance, the PISA assessment uses the index termed as ESCS (economic, social, and cultural status), a composition of dimensions which includes: level of education of parents, family wealth, home educational resources, and holding possessions. Psychometric studies have identified limitations of this index for some countries (Rutkowski and Rutkowski, 2013). For instance, while the dimension family wealth fit well in Chile, Argentina, Brazil, Panamá, and Uruguay, it did not fit in Mexico, Colombia, Peru. Home educational resources dimension did not fit well in any Latin American participant country, and the cultural possessions dimension showed reliabilities below of 0.70 (the cutoff criterion for internal reliability). Perhaps, this the reason why the index ESCS has changed somewhat over PISA assessment’s cycle. For our study two environmental indices, one related to household possessions and parents’ education, and the other related to resources available at the school (inside and outside) were considered. The SES of students implied resources within home (e.g. TV, computer, internet, etc.), and parents’ educational. SES school implied conditions out of home. SES school covered school conditions (e.g. class size, presence of computers, etc.), and community resources where the school was located (e.g. waste collection system, drainage system, etc.). The correlation between SES of students and SES school was 0.641 (p-value = 0.000), indicating some independence between both socioeconomic components. The reader can see this certain independence in Figures 4, 5. Students of any socioeconomic status, any kind of school, but enrolled in high SES schools outperformed students enrolled in low SES schools. Moreover, our multilevel modeling indicated that students enrolled in high SES schools had an average value of 0.51 units higher than students enrolled in low SES schools. In contrast, for each additional unit in students' SES, the increase in mean of the PISA test score was only 0.02 units. Therefore, SES school was a stronger predictor of the PISA test score than SES of students. This result was observed in several independent studies or reported by the PISA assessments (Sirin, 2005; Liu et al.,2014; Perry and McConney, 2010; OECD, 2004; OECD, 2005), some of them including Latin American samples (Duarte et al., 2010). Hence, school and community environments may exert more significant influence than the home environment. The effect of inequalities in the neighborhood or community on school performance has been investigated. Children in poor SES-school, located in a vulnerable neighborhood, tend to experience less social support, fewer school activities, more noise, dangerous and greater physical deterioration environments, which affect educational outcomes (Catsambis and Beveridge, 2001; Evans, 2004; Otero et al., 2017). A meta-analysis based on 88 studies conducted by Nieuwenhuis and Hooimeijer (2016) indicated that among environmental variables the neighborhood poverty, the neighborhood’s educational climate, the proportion of ethnic/migrant groups, and social disorganization in the neighborhood affect educational outcomes. We did not include a refined assessment of the community environment; instead, we used a global criterion related to infrastructure and sanitary conditions. Thus, better community assessment is required in future studies.
On the other hand, there is still an open question: why the SES of students and kind of school, traditional predictors, had a weak contribution to student performance? Particular characteristics of some Latino American countries may have contributed to such results. For instance, in Lima city, the capital of Peru, since 2014, private schools' performance decreases to the point that they had the same reading performance and lower performance in mathematics than free public schools in 2016. The reason is that most of the private schools in Lima are low cost (62.5%) and located in poor neighborhoods Ministerio (de Educación, 2018). It is an example that the school type may contribute less than other social variables to the PISA test’s performance variation.
We are aware that our results are not new, and they corroborate previous findings in psychology, economy, and sociology (Colom and Flores-Mendoza, 2007). However, as far as we know, our study is one of the first to present the contribution of schools’ socioeconomic level to student performance in samples from different cultural contexts. In other words, our study indicated that students benefited from environments/neighborhoods that offered more educational stimuli, good community services, and facilities, despite their cognitive ability, type of school, or socioeconomic level of their families.
Other environmental factors can contribute to student performance, such as educational practices and kind of curricula, as well pointed out by reviewers of the present paper. There is a generalized recognition that high-order thinking skills must be developed in students in the current global knowledge society, however practices school varies widely within and across school systems. Additionally, educational practices vary in uses of time, space, and roles in the interest of more engaging and successful learning. Its effect on the PISA test performance is not clear. For instance, regarding teacher support, the PISA 2018 report (OECD, 2019b) informed that above 80% of students from low perform PISA countries (including Latin American countries) reported that their teachers help with their learning until they understand, while less of 70% of students from high perform PISA countries stated their teacher help them in their learning. Moreover, the OECD reported that, on average across OECD countries, students enrolled in socio-economically disadvantaged schools were more likely than students in advantaged schools to report that they had supportive teachers. Teacher support had positive and moderate relationship with other educational practices (e.g. r = 0.060 with Teacher-directed instruction), meaning that any other kind of educational practice could show the same diversity of results showed by teacher support. Additionally, educational practices have to adapt to the levels of cognitive ability and prior knowledge that students bring with them, which would render high complexity to the statistical model proposed by the design of the present study. Also, there were practical reasons (related to the time limit allowed by school principals) that did not allow survey information regarding school teaching characteristics; thus, educational practices’ predictive power on the student performance beyond individual differences in intelligence is unknown, and it deserves a special research design.
In general, the implications of our results directly address educational public policies, demonstrating the need to raise the cognitive ability and socioeconomic condition of schools. While it is certain that significantly increasing intelligence within a generation is still an open discussion (Haier, 2014), improving the SES of schools depends exclusively on government decisions. To this regards, our study strongly emphasizes that (high SES) schools can offer resources to low SES-students, in order to achieve improved learning opportunities, and this support is independent of the individual students’ abilities.
Note the reader that despite the effort that our samples parallel key variables and characteristics of the Latin American cities under examination (e.g., age, sex, socioeconomic status, kind of schools), our samples were not random samples. Our samples were composed of schools that allowed the study. In other words, our samples were not chosen in a random manner that allows for each variable/member of their original population to have an equal chance of being chosen. Thus, caution is required.
Conclusion
This paper presents results of the SLATINT project, a Latin America initiative that verified the human capital present in the region through assessment of student and intelligence performance. This paper was written in a context of coronavirus pandemic. We do not know the impact of the long term absence of schools in 2020 due to pandemic, particularly when considering the psychological development of our children. To this regard, the next PISA survey, scheduled to be conducted in 2022, may very well bring valuable results.
Our results refer to the pre-pandemic social context, and it revealed that general intelligence (or g-factor), and SES of schools, predicted the variation of the PISA test score. SES of students had very small contribution to this prediction. However, the present study faced several limitations regarding the use of non-representative samples from the different countries. Our intention was not to rank countries. We intended to verify the impact of social factors and intelligence on school performance using samples from diverse cultural settings, specifically samples from the Latin American region. Nevertheless, extreme position that favor intelligence and SES school as the only predictors of student performance is not possible due to non-random sampling used in the present study, and the absence of other potential predictors such as quality of school education. On the other hand, we recognize that the cognitive measures used in the present study tended to emphasize spatial reasoning and numerical domains. Thus, a greater variation in the cognitive domains measured would be essential to verify the reliability of our main results. Additionally, the reader may have noticed that our dataset showed some low SES students enrolled in high SES schools, and some high SES students enrolled in low SES schools. The reasons for this SES school-SES student distortion has not been explored. This should be taken into consideration in future studies. Considering all these limitations, our study can be seen as a preliminary investigation about the influence of the schools’ resources and the students ability on student performance, and it deserves attention from Latin American educational public policies.
Data Availability Statement
The original contributions presented in the study are included in the article/Supplementary Material, further inquiries can be directed to the corresponding author.
Ethics Statement
The studies involving human participants were reviewed and approved by Research Ethical Committee of the Federal University of Minas Ferais [N. ETIC 263/07].
Author Contributions
All authors listed have made a substantial, direct, and intellectual contribution to the work and approved it for publication.
Funding
This study was funded by the National Council for Scientific and Technological Development (CNPq/N. 472181/2013-0), and Fundação de Amparo à Pesquisa do Estado e Minas Gerias (FAPEMIG-PPM 03/2014).
Conflict of Interest
The authors declare that the research was conducted in the absence of any commercial or financial relationships that could be construed as a potential conflict of interest.
Acknowledgments
The research behind this paper would not have been possible without the Brazilian support from Editora VETOR.
Supplementary Material
The Supplementary Material for this article can be found online at: https://www.frontiersin.org/articles/10.3389/feduc.2021.632289/full#supplementary-material.
Reference
Avvisati, F. (2020). The measure of socio-economic status in PISA: a review and some suggested improvements. Large-scale Assess. Edu. 8, 8. doi:10.1186/s40536-020-00086-x
Bellei, C. (2008). “The public-private school controversy in Chile,” in School choice international: exploring public-private partnerships. Editors R. Chakrabarti, and P. E. Peterson (chile: MIT Press Scholarship Online).
Catsambis, S., and Beveridge, A. A. (2001). Does neighborhood matter? Family, neighborhood, and school influences on eighth-grade mathematics achievement. Sociological Focus. 34 (4), 435–457. doi:10.1080/00380237.2001.10571212
Coleman, J. S., Campbell, E. Q., Hobson, C. J., McPartland, F., Mood, A. M., Weinfeld, G. D., et al. (1966). Equality of educational opportunity. Washington, DC: U.S. Government Printing Office.
Colom, R., and Flores-Mendoza, C. (2007). Intelligence predicts scholastic achievement irrespective of SES factors: evidence from Brazil. Intelligence. 35, 243–251. doi:10.1016/j.intell.2006.07.008
Costa, H. M., Nicholson, B., Donlan, C., and Van Herwegen, J. (2018). Low performance on mathematical tasks in preschoolers: the importance of domain-general and domain-specific abilities. J. Intellect. Disabil. Res. 62, 292–302. doi:10.1111/jir.12465
Coyle, T. R. (2015). Relations among general intelligence (g), aptitude tests, and GPA: linear effects dominate. Intelligence. 53, 16–22. doi:10.1016/j.intell.2015.08.005
Cucina, J. M., Peyton, S. T., Su, C., and Byle, K. A. (2016). Role of mental abilities and mental tests in explaining high-school grades. Intelligence. 54, 90–104. doi:10.1016/j.intell.2015.11.007
Daniele, V. (2021). Socioeconomic inequality and regional disparities in educational achievement: the role of relative poverty. Intelligence 84, 101515. doi:10.1016/j.intell.2020.101515
de Educación, M. (2018). Tipología y caracterización de las escuelas privadas en el Perú (Estudios Breves N° 3). Lima: Oficina de Medición de la Calidad de los Aprendizajes.
Duarte, J., Bos, M. S., and Moreno, M. (2010). Inequity in School Achievement in Latin America: multilevel Analysis of SERCE results according to the socioeconomic status of students. Available at https://publications.iadb.org/es/publicacion/inequity-school-achievement-latin-america-multilevel-analysis-serce-results-according.
Efroymson, M. A. (1960). Multiple regression analysis. Math. Methods digital Comput. 1, 191–203. 10.1145/363567.363580.
Evans, G. W. (2004). The environment of childhood poverty. Am. Psychol. 59, 77–92. doi:10.1037/0003-066X.59.2.77
Flores-Mendoza, C., Mansur-Alves, M., Ardila, R., Rosas, R., Guerrero-Leiva, K., Maqueo, M. E. G., et al. (2015). Fluid intelligence and school performance and its relationship with social variables in Latin American samples. Intelligence 49, 66–83. doi:10.1016/j.intell.2014.12.005
Flores-Mendoza, C., Saraiva, R. B., Câmara, G. C. V., Lopes, W. M. G., Passos, A. P. C. P., Gama, A. M. V. P., et al. (2017). Socioeconomic environment effect on inferential reasoning of Latin American students. Salud Ment. 40 (5), 183–189. doi:10.17711/SM.0185-3325.2017.024
Flores-Mendoza, C., Ardila, R., Rosas, R., Lucio, M. E., Gallegos, M., and Reategui-Colareta, N. (2018). Intelligence measurement and school performance in Latin America. A report of the study of Latin American intelligence project. Springer International Publishing.
Gamoran, A., and Long, D. A. (2006). Equality of educational opportunity: a 40-year retrospectiveWCER Working Paper No. 2006–9. Madison, WI: University of Wisconsin–Madison, Wisconsin Center for Education Research.
Gelade, G. A. (2008). IQ, cultural values, and the technological achievement of nations. Intelligence 36, 711–718.
Haier, R. J. (2014). Increased intelligence is a myth (so far). Front. Syst. Neurosci. 8, 34. doi:10.3389/fnsys.2014.00034
Halpern, D., Flores-Mendoza, C., and Rindermann, H. (2020). Sex, gender, and intelligence: does XX = XY for intelligence? in The cambridge Handbook of the international Psychology of women. Editors F. Cheung, and D. Halpern (Cambridge: Cambridge University Press), 139–152.
Hanscombe, K. B., Trzaskowski, M., Haworth, C. M., Davis, O. S., Dale, P. S., and Plomin, R. (2012). Socioeconomic status (SES) and children's intelligence (IQ): in a UK-representative sample SES moderates the environmental, not genetic, effect on IQ. PLoS ONE 7, e30320. doi:10.1371/journal.pone.0030320
Hanushek, E. A., and Woessmann, L. (2007). Education quality and economic growth. Washington, DC: The World Bank.
Hanushek, E. A., and Woessmann, L. (2015). The knowledge capital of nations: education and the economics of growth. Cambridge, MA: MIT Press.
Hartshorne, J. K., and Germine, L. T. (2015). When does cognitive functioning peak? The asynchronous rise and fall of different cognitive abilities across the life span. Psychol. Sci. 26, 433–443. doi:10.1177/0956797614567339
Heagerty, P. J., and Kurland, B. F. (2001). Misspecified maximum likelihood estimates and generalized linear mixed models. Biometrika. 88, 973–985. doi:10.1093/biomet/88.4.973
Hopfenbeck, T. N., Lenkeit, J., El Masri, Y., Cantrell, K., Ryan, J., and Baird, J.-A. (2018). Lessons learned from PISA: a systematic review of peer-reviewed articles on the Programme for International Student Assessment. Scand. J. Educ. Res. 62, 333–353. doi:10.1080/00313831.2016.1258726
Juan-Jose, N., Garcia-Rubio, J., and Olivares, P. R. (2015). The relative age effect and its influence on academic performance. PlosOne. 10 (10), e0141895. doi:10.1371/journal.pone.0141895
Kuncel, N. R., Hezlett, S. A., and Ones, D. S. (2004). Academic performance, career potential, creativity, and job performance: can one construct predict them all? J. Pers Soc. Psychol. 86 (1), 148–161. doi:10.1037/0022-3514.86.1.148
Leeson, P., Ciarrochi, J., and Heaven, P. C. L. (2008). Cognitive ability, personality, and academic performance in adolescence. Personal. Individual Differences. 45 (7), 630–635. doi:10.1016/j.paid.2008.07.006
Lenehan, M. E., Summers, M. J., Saunders, N. L., Summers, J. J., and Vickers, J. C. (2015). Relationship between education and age-related cognitive decline: a review of recent research. Psychogeriatrics. 15, 154–162. doi:10.1111/psyg.12083
Liang, K., and Zeger, S. (1986). Longitudinal data analysis using generalized linear models. Biometrika. 73 (1), 13–22. doi:10.2307/233626
Liu, H., Damme, J. V., Gielen, S., and Noortgate, W. V. D. (2014). School processes mediate school compositional effects: model specification and estimation. Br. Educ. Res. J. 41, 423–447. doi:10.1002/berj.3147
Lynn, R., and Becker, D. (2019). The intelligence of nations. London: Ulster Institute for Social Research.
Lynn, R., and Vanhanen, T. (2012). Intelligence: a unifying construct for the social sciences. London: Ulster Institute for Social Research.
Maranto, R., and Wai, J. (2020). Why intelligence is missing from American education policy and practice, and what can Be done about it. J. Intelligence. 8 (1), 2. doi:10.3390/jintelligence8010002
Neisser, U., Boodoo, G., Bouchard, T., Boykin, A., Brody, N., Ceci, S., et al. (1996). Intelligence: knowns and unknowns. Am. Psychol. 51 (2), 77–101.
Nieuwenhuis, J., and Hooimeijer, P. (2016). The association between neighbourhoods and educational achievement, a systematic review and meta-analysis. J. Hous Built Environ. 31, 321–347. doi:10.1007/s10901-015-9460-7
O’Connell, M., and Marks, G. N. (2021). Are the effects of intelligence on student achievement and well-being largely functions of family income and social class? Evidence from a longitudinal study of Irish adolescents. Intelligence 84, 101511. doi:10.1016/j.intell.2020.101511
OECD (2001). Knowledge and skills for life. First results from the OECD Programme for international student assessment (PISA) 2000. Paris: OECD.
OECD (2010). PISA 2009 results: learning trends: changes in student performance since 2000. Paris: OECD. doi:10.1787/19963777
OECD (2013). PISA 2012 Results in Focus. What 15-years-olds know and what they can do with they know? Paris: OECD.
OECD (2019a). PISA 2018 results (volume I): what students Know and can do. Paris: OECD. doi:10.1787/35665b60-en
OECD (2019b). PISA 2018 results (Volume III): What School Life Means for Students’ Lives. Paris: OECD. doi:10.1787/acd78851-en
Ostroff, C. (1993). Comparing correlations based on individual-level and aggregated data. J. Appl. Psychol. 78 (4), 569–582. doi:10.1037/0021-9010.78.4.569
Otero, G., Carranza, R., and Contreras, D. (2017). ‘Neighbourhood effects’ on children’s educational achievement in Chile: the effects of inequality and polarization. Environ. Plann. A: Economy Space 49 (11), 2595–2618. doi:10.1177/0308518X17731780
Perry, L., and McConney, A. (2010). School socio-economic composition and student outcomes in Australia: implications for educational policy. Aust. J. Edu. 54 (1), 72–85. doi:10.1177/000494411005400106
Prentice, R. L. (1988). Correlated binary regression with covariates specific to each binary observation. Biometrics 44 (4), 1033–1048.
Raven, J., Raven, J. C., and Court, J. H. (2000). The standard progressive Matrices, 3. Oxford, EnglandSan Antonio, TX: Oxford Psychologists PressThe Psychological Corporation.
Rindermann, H., Sailer, M., and Thompson, J. (2009). The impact of smart fractions, cognitive ability of politicians and average competence of peoples on social development. Talent Develop. Excell. 1, 3–25. doi:10.1177/0956797611407207
Rindermann, H. (2007). The g-factor of international cognitive ability comparisons: the homogeneity of results in PISA, TIMSS, PIRLS and IQ-tests across nations. Eur. J. Personal. 21, 667–706. 10.1002/per.634.
Rindermann, H. (2018). Cognitive capitalism: human capital and the wellbeing of nations. Cambridge: Cambridge University Press.
Rosas, R. (1996). Replicación del Modelo de Estructura de Inteligencia de Berlín en una Muestra de Estudiantes Chilenos. PSYKHE 5 (1), 39–56.
Roth, B., Becker, N., Romeyke, S., Schäfer, S., Domnick, F., and Spinath, F. M. (2015). Intelligence and school grades: a meta-analysis. Intelligence 53, 118–137. doi:10.1016/j.intell.2015.09.002
Rutkowski, D., and Rutkowski, L. (2013). Measuring Socioeconomic Background in PISA:one size might not fit all. Res. Comp. Int. Edu., 8, 259–278. doi:10.2304/rcie.2013.8.3.259
Sirin, S. R. (2005). Socioeconomic status and academic achievement: a meta-analytic review of research. Rev. Educ. Res. 75, 417–453. 10.3102/003465430.
Strenze, T. (2007). Intelligence and socioeconomic success: a meta-analytic review of longitudinal research. Intelligence 35, 401–426. doi:10.1016/j.intell.2006.09.004
Trucco, D. (2014). Educación y desigualdad en América Latina. Santiago, Chile: Naciones Unidas, CEPAL .
Vior, S. E., and Rodríguez, L. R. (2012). La privatización de la educación Argentina: un largo proceso de expansión y naturalización. Pro-Posições. 23 (2), 91–104.
Keywords: intelligence, g factor, PISA, latin america, school performance
Citation: Flores-Mendoza C, Ardila R, Gallegos M and Reategui-Colareta N (2021) General Intelligence and Socioeconomic Status as Strong Predictors of Student Performance in Latin American Schools: Evidence From PISA Items. Front. Educ. 6:632289. doi: 10.3389/feduc.2021.632289
Received: 22 November 2020; Accepted: 03 February 2021;
Published: 25 March 2021.
Edited by:
Jose Juan Gongora, Tecnológico de Monterrey, MexicoReviewed by:
Giray Berberoglu, Başkent University, TurkeyH. Cigdem Yavuz, Çukurova University, Turkey
Copyright © 2021 Flores-Mendoza, Ardila, Gallegos and Reategui-Colareta This is an open-access article distributed under the terms of the Creative Commons Attribution License (CC BY). The use, distribution or reproduction in other forums is permitted, provided the original author(s) and the copyright owner(s) are credited and that the original publication in this journal is cited, in accordance with accepted academic practice. No use, distribution or reproduction is permitted which does not comply with these terms.
*Correspondence: Carmen Flores-Mendoza, carmencita@fafich.ufmg.br
 Carmen Flores-Mendoza
 Ruben Ardila
 Miguel Gallegos3,4
