Screening for Reading Difficulties: Comparing Eye Tracking Outcomes to Neuropsychological Assessments
 Anna Carin Gran Ekstrand
 Mattias Nilsson Benfatto
 Gustaf Öqvist Seimyr
- Department of Clinical Neuroscience, Division of Eye and Vision, Marianne Bernadotte Centre, Karolinska Institutet, Stockholm, Sweden
The use of eye tracking to assess reading fluency has been proposed as a novel and efficient screening method for identifying school children with atypical reading development or risk of dyslexia. Currently, however, little is known about the relationship between the predictive outcomes produced by eye tracking screening systems and specialist cognitive assessments. Here we investigate this relationship in the context of a neuropsychological case study involving eight subjects (9–10 years) who were identified as being at risk of dyslexia by an eye tracking screening system. We analyze to what extent these subjects displayed cognitive limitations when assessed with a neuropsychological test battery, and to what extent cognitive difficulties were limited to reading and decoding, or whether they extended to other domains as well. As a group, the subjects performed on average significantly worse in reading and decoding than in other cognitive domains. Five subjects performed more than 1.25 standard deviations below the mean for age. In line with empirical evidence, co-occurring difficulties in the attention domain were also observed in a few struggling readers. Overall, the results support the view that eye tracking can be a useful tool to assess and monitor children’s reading development during the early school years.
Introduction
Learning to read is one of the most important skills that children develop in school, essential for a child’s education, intellectual growth, and sense of inclusion in society. It is well known that children who do not learn to read often develop psychological and emotional distress, manifested by low self-esteem, lack of motivation, and depression (Alexander-Passe, 2006; Long et al., 2007; Riddick, 2009; Gustafsson et al., 2010). Not surprisingly, these problems tend to multiply over time and children who struggle with reading through their adolescence often face poor educational outcomes and limited career prospects (Snowling, 2014). Children who fail to develop reading skills at a normal rate need careful monitoring and appropriate reading support. Signs of dyslexia, or specific reading difficulties, are often overlooked as all beginning readers struggle with reading to some extent. However, research shows that it may be detrimental to wait for a diagnosis of dyslexia before attending to the difficulties (Shaywitz et al., 2004; Vaughn et al., 2010; Peterson and Pennington, 2012). Thus, screening children for reading difficulties during the early school years can play an important role in calling attention to children who struggle more than their peers and who need additional support in their reading development.
In recent years, eye tracking technology has become increasingly more affordable, accessible, and easy to use in different environments. Moreover, using eye tracking to measure children’s reading patterns has been proposed as an efficient screening method to obtain a first basic assessment of reading skill and potential risk of dyslexia (Nilsson, 2013; Rello and Ballesteros, 2015; Benfatto et al., 2016; Zhan et al., 2016; Florea, 2018; Ceravolo et al., 2019; Jothi Prabha and Bhargavi, 2019; Rizwana, 2019). By using eye tracking it is possible to follow the movements of the eyes across words and sentences without necessarily requiring the child to produce any overt verbal or motor response during the task (see Figure 1 for a visualization of eye movements in reading). Thus, a potential advantage of using eye tracking is that it enables objective measurements of reading fluency, whether the child is reading aloud or silently. The argument for using eye tracking in this context is not that children with dyslexia have poor sight, vision, or other inherent oculomotor problems that cause difficulties in reading. Although suggestions have been made in the past that dyslexia is caused by such problems (e.g., Pavlidis, 1981, 1985), most researchers today agree that dyslexia is a language-based disorder primarily involving cognitive difficulties in processing the phonological structure of written words. This does not preclude, however, that eye movements can be useful secondary indicators of dyslexia, as it has long been known that eye movements during reading are multifaceted and reflect ongoing cognitive processes in various ways (Rayner, 1998, 2009; Clifton et al., 2007).
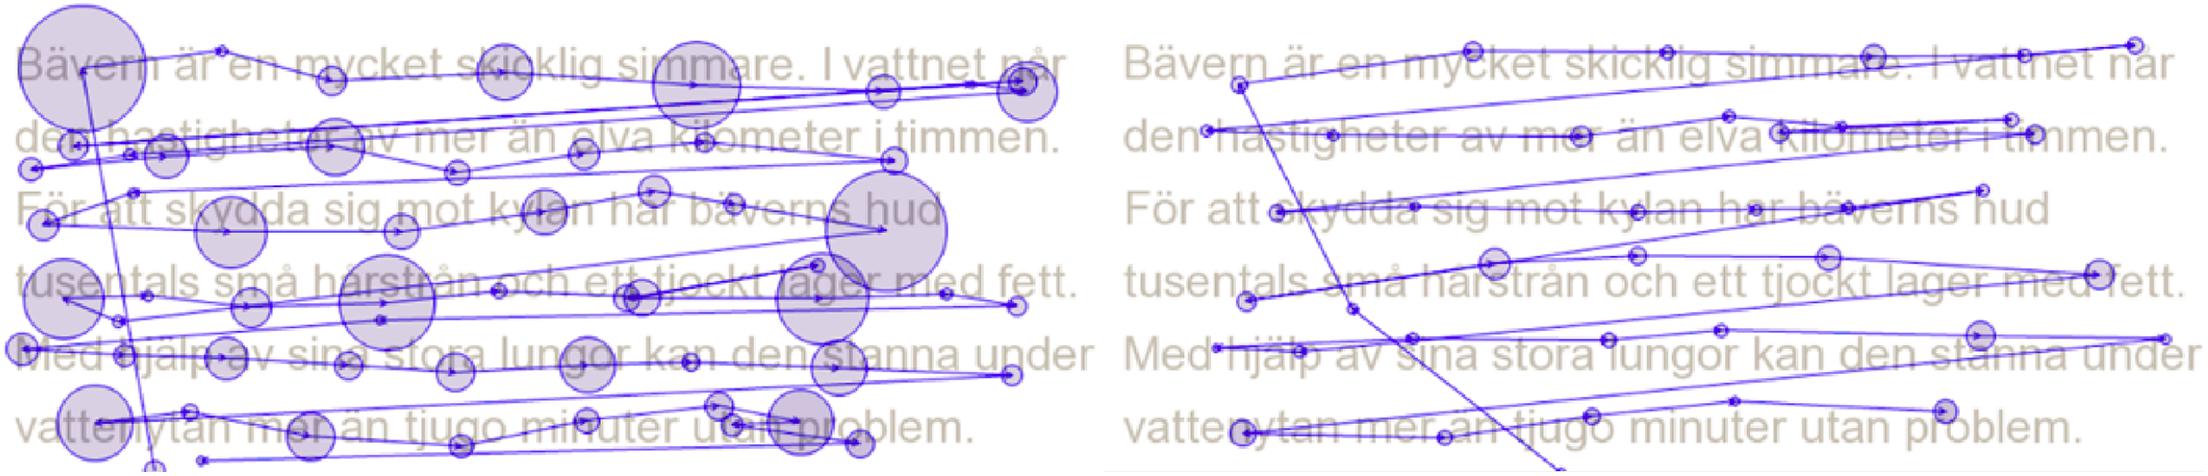
Figure 1. Eye movements during reading for two persons reading the same text passage. The circles represent fixations, instances where the eyes pause to process information (the greater the circle, the longer the duration of the fixation). The lines between fixations represent saccades, instances where the eyes rapidly move to another point of fixation (the longer the line between two fixations, the longer the saccadic movement). The reader to the left makes longer fixations (temporally) and shorter saccades (spatially) than the reader to the right.
In addition to displaying and summarizing reading patterns, screening methods based on eye tracking typically produce a binary prediction indicating whether the reader is at risk of dyslexia or not. To assess the validity of these predictions it is important to understand how they relate to the results of more comprehensive cognitive assessments, which are too time-consuming to be suitable for large-scale screening of school children in a large community, city, or country. Here, such a comparison between eye tracking outcomes and cognitive assessments is presented in the context of a small neuropsychological investigation including eight participants, 9–10 years old, who were identified as being at risk of dyslexia using an eye tracking based screening system. The question we address is to what extent these children displayed cognitive limitations or deficits when assessed using an extensive neuropsychological test battery, and further, to what extent the problems were limited to reading and decoding, or whether they extended to other cognitive domains as well. Thus, the overall purpose of the study is to compare eye tracking predictions to neuropsychological assessments in order to better understand the validity of eye tracking based screening methods. To our knowledge, this is the first study that examines this relationship.
Eye Movements During Reading
When we read, our eyes do not move along a line of text in a single smooth and sweeping movement, but with small, rapid, and jerk-like movements called saccades. These movements are only 7–9 letter spaces long on average for readers of alphabetic writing systems and serve to move new text into the fovea, the central part of the visual field. Between saccades, our eyes momentarily pause to process visual input in our perceptual span, which extends 3–4 letter spaces to the left, and 14–15 letter spaces to the right (for left-to-right orthographies) of the point of fixation (McConkie and Rayner, 1975, 1976; Rayner and Bertera, 1979). These brief pauses, called fixations, last on average 200–250 ms, which means that a normal skilled adult reader makes about 4–5 fixations per second. However, there is considerable variability in both the length of saccades and duration of fixations, both between and within readers. Fixation durations often range between 50 and 500 ms, and saccade lengths between 1–20 letter spaces, for one and the same reader reading a few pages of text. This variability is related to the ease or difficulty with which words and sentences are being processed. For example, it is well known that the time spent fixating a word is related not only to its visual properties, such as the length of the word in number of letters, but also depends on how common the word is in the language, as well as on how expected or predictable the word is in the context that it occurs. Words, phrases, or sentences which are more difficult to process take longer time to read and this is immediately registered in the eye movement record by prolonged fixation durations or repeated fixations on a particular word or region of text. Furthermore, when we experience difficulties in understanding some region of text, we tend to make more eye movements backwards to previous words in the text, so-called regressions, as well as shorter saccades when moving forward through the text. Eye movements have long been a valuable source to investigate different aspects of the reading process. By experimentally varying different linguistic properties of words and sentences being read and measuring the corresponding eye movement response, research has shown that eye movement measurements provide useful information about how the brain processes language during reading (Rayner, 1998, 2009; Clifton et al., 2007).
Eye Tracking and Machine Learning
With the rising popularity in recent years of computational methods that are able to learn patterns and relationships from data and make predictions for new input based on that knowledge, a growing number of researchers have started to investigate how such methods, often called machine learning methods, can be applied to eye tracking data for practical purposes. It is in this context one should understand the recent interest in using eye tracking as a screening method for reading difficulties and dyslexia. Machine learning is the methodology that enables computers to learn how dyslexic eye movements are different from normal or typical readers’ eye movements. An early contribution to this line of research is Rello and Ballesteros (2015). This study involved 97 subjects between 11 and 54 years old, 48 of which were diagnosed with dyslexia. By training machine learning algorithms on eye tracking data recorded while the subjects were reading short text passages, Rello and Ballesteros showed that it was possible to predict readers with and without dyslexia with an accuracy of 80%. Another study in a similar vein is Benfatto et al. (2016), which focuses exclusively on school children’s reading. This study included 185 subjects between 9 and 10 years old. Among these subjects, 97 were high-risk subjects and 88 low-risk subjects, as determined by their level of word decoding skill in a sample of 2165 school children (children who performed in the lower 5th percentile were defined as high-risk subjects). Eye movements were recorded while the subjects silently read a short passage of text adapted to their age level. Classification models were trained on these recordings and the best model achieved an accuracy of about 95% in predicting low versus high risk of dyslexia. These results indicate that eye movement measurements can be useful in identifying children at risk during the early school years. Other researchers have used eye tracking for the same purpose and reported similar results (Zhan et al., 2016; Ceravolo et al., 2019; Rizwana, 2019; Prabha and Bhargavi, 2020).
Materials and Methods
Participant Selection
Participants were selected from a large sample of school children who were enrolled in a research project on children’s reading ability and eye movement development in primary school, including 35 schools and 3444 screenings among school children in grade 1–3 (age: M = 8.8 years, SD = 0.9). The overall goal of this project was to develop a screening instrument for reading difficulties based on eye tracking data from a large number of school children. An ethical approval for the project was applied for and granted by the Central Ethical Review Board of Sweden. The same application also explicitly expressed that a smaller subset of the study participants would be assessed by a professional neuropsychologist as part of the project.
Importantly, the aim of the larger research project was to develop a screening tool that could be easily applied in the children’s natural daily environment, that is, directly in schools rather than in research labs or specialized clinics. The number of children who participated were approximately evenly distributed across grade levels with about 1000 children per grade (51% were male and 49% were female). The children performed a set of reading-related tasks, including (1) rapid automatized naming of letters (RAN), (2) multiple-words segmentation (also called word-chains), and (3) single word reading (non-words and real words). Figure 2 shows box plot summaries of the distribution of results for these tests across grade levels. Based on the test results, a composite standardized measure of average word reading and decoding ability, i.e., a z-score, was calculated for each participant, and a cut-off score was set at the 10th percentile, such that children who fell below the 10th percentile of his or her grade level were operationally defined as being at risk of dyslexia. The same children also performed a whole-passage reading task (with words read in context) while their eye movements were being recorded using a Tobii screen-based eye tracker with 120 Hz sampling frequency. All tests and recordings took place in school, typically in a smaller room adjacent to or nearby the children’s classroom. The session lasted about 5–10 min per child. Classroom teaching continued more or less as normal while the children took turn in performing the tests. Using the eye tracking data from the whole-passage reading task, a number of eye movement parameters, or features, were computed, such as the duration of fixations, the length of saccades, and proportion of regressions, to name a few. These data were then given as input to a supervised learning algorithm to learn an optimal mapping between the input eye movement features and the output variable to predict (i.e., at risk/not at risk). All data analysis was performed in R (R Core Team, 2020) using the Caret (Kuhn, 2008) package for model training and evaluation. The best result was obtained using support vector machines (SVM) with a polynomial kernel function. The predictive performance was evaluated using cross-validation techniques which means that data for parameter estimation and model evaluation were kept strictly apart and the predictive performance was based only on out-of-sample subjects. The results showed that the best models were able to predict the risk of dyslexia with an average accuracy of 86.2% in grade 1–3 (n = 2726). The average sensitivity (i.e., the percentage of children operationally defined as at risk who were correctly identified as such) across grade levels was 84.5%, and the average specificity (i.e., the percentage of children operationally defined as not at risk who were correctly identified as such) was 87.9%. The average positive predicted value (i.e., the probability of being at risk given a positive screening result) across grade levels was 43.4% and the negative predicted value (i.e., the probability of not being at risk given a negative screening result) was 98.1%. The difference between positive and negative predictive value, despite similar sensitivity and specificity, is due to the negative outcome being one order of magnitude larger than the positive as a result of prevalence. Although performance metrics such as sensitivity, specificity, and positive and negative predicted value give a general idea of the overall quality of the eye tracking based screening, it is important to be aware of the limitations of these metrics when being applied in the context of disorders like dyslexia which is not an all-or-nothing phenomenon but occurs in varying degrees of severity (Siegel, 2006). The performance metrics are calculated from binary outcomes which means that when using them in this context we make the simplifying assumption that either a child is dyslexic or it is not. In reality, however, reading ability is a skill that falls along a continuum and dyslexia is best considered a difficulty at the low end of the continuum with no clear-cut or absolute limit between dyslexia and non-dyslexia (Shaywitz et al., 1992).
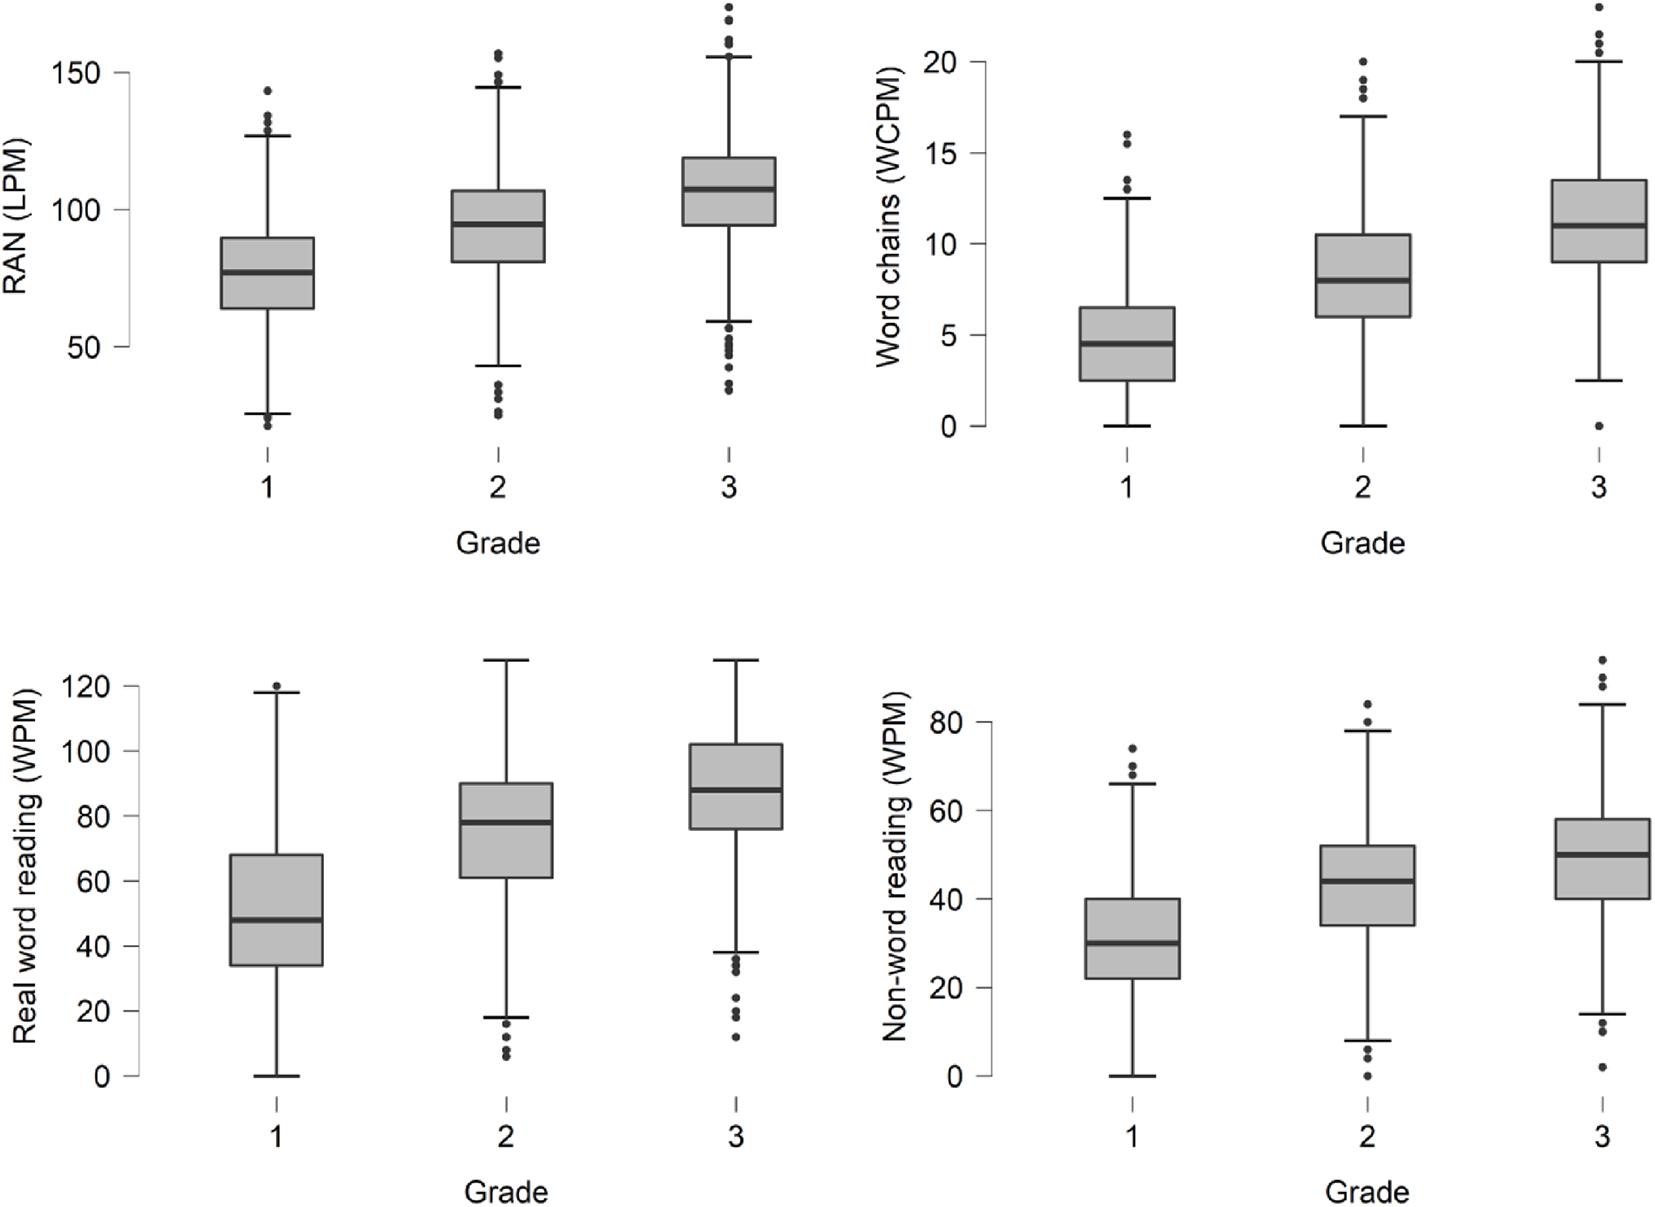
Figure 2. Box plots of results on tests of reading and decoding for approximately 3000 children in grade 1–3 who participated in the larger screening project. Tests: RAN (letters per minute), Word chains (word chains per minute), Real word reading (words per minute), and Non-word-reading (words per minute).
The children to be further assessed with a full neuropsychological assessment were selected among participating children in second grade. Out of a total of 910 children in second grade, 92 (10.1%) were predicted to be at risk of dyslexia by the eye tracking screener. From this sample, 10 children (10.9%) were randomly selected, their families contacted and asked for willingness to participate in the study.
Participant Description
One of the children who were contacted chose not to participate in the study via his or her guardians. Another child, interestingly, had been diagnosed with both dyslexia and attention deficit hyperactivity disorder (ADHD) less than 6 months before, and had thus already been exposed to extensive neuropsychological testing. For ethical reasons, as well as for concerns about potential retest effects during the neuropsychological testing, this child was not included in the study. Thus, eight subjects in total participated in the neuropsychological assessment. The age of these participants ranged from 9:1–10:2 years with a mean age of 9:7 years. Five participants were female and three were male. Six participants had Swedish as their native language and two were bilingual (Swedish/Moroccan Arabic and Swedish/Syriac-Aramaic, respectively). While in contact with the participating children’s parents or guardians, information was received that three of the participants had previously been assessed for different neurodevelopmental disorders by health care professionals. One of them had been referred for an autism assessment 4 years prior to this investigation and received a diagnosis of autism spectrum disorder. Another had been referred to a speech and language therapist 3 years prior to this investigation and received a diagnosis of speech and language disorder. The third had been assessed for dyslexia by a speech and language therapist 1 year prior to this investigation but did not meet the diagnostic criteria. Since none of these three participants had been referred for a full neuropsychological assessment, at least not during their school years, and because the testing that they had been exposed to had taken place more than a year earlier, the decision was made to include all three participants in the study.
Neuropsychological Assessment
The neuropsychological assessments were carried out by one and the same professional neuropsychologist who had more than 10 years of training and experience in conducting neuropsychological assessments of school children and providing counsel on cognitive remediation. A neuropsychological test battery was designed to provide a comprehensive understanding of each participant’s cognitive profile. Nine cognitive domains were assessed: (1) Reading and Decoding, (2) General Intelligence, (3) Verbal Working Memory, (4) Visual Working Memory, (5) Verbal Executive Functions, (6) Non-verbal Executive Functions, (7) Attention, (8) RAN, and (9) Psychomotor speed. For each domain, participants completed a set of tests varying in length and complexity. The tests that were included in the battery are presented in Table 1 (for a more thorough description of the various tests, see Supplementary Appendix A). To make it possible to compare results across different neuropsychological tests and cognitive domains, the raw scores were first converted into scaled scores in accordance with the guidelines in the respective test manuals. These results were then transformed into a common standard scale or Z-scale, having zero mean and unit variance. The average Z-score over the subtests in each cognitive domain were then taken to represent the subject’s overall cognitive ability in that domain. With respect to reading and decoding, the subtest results also included those results that were used as reference data in building the machine learning model as described in section “Participant selection.” Importantly, however, the predictions made were based only on out-of-sample subjects whom the model had not seen during the training phase.
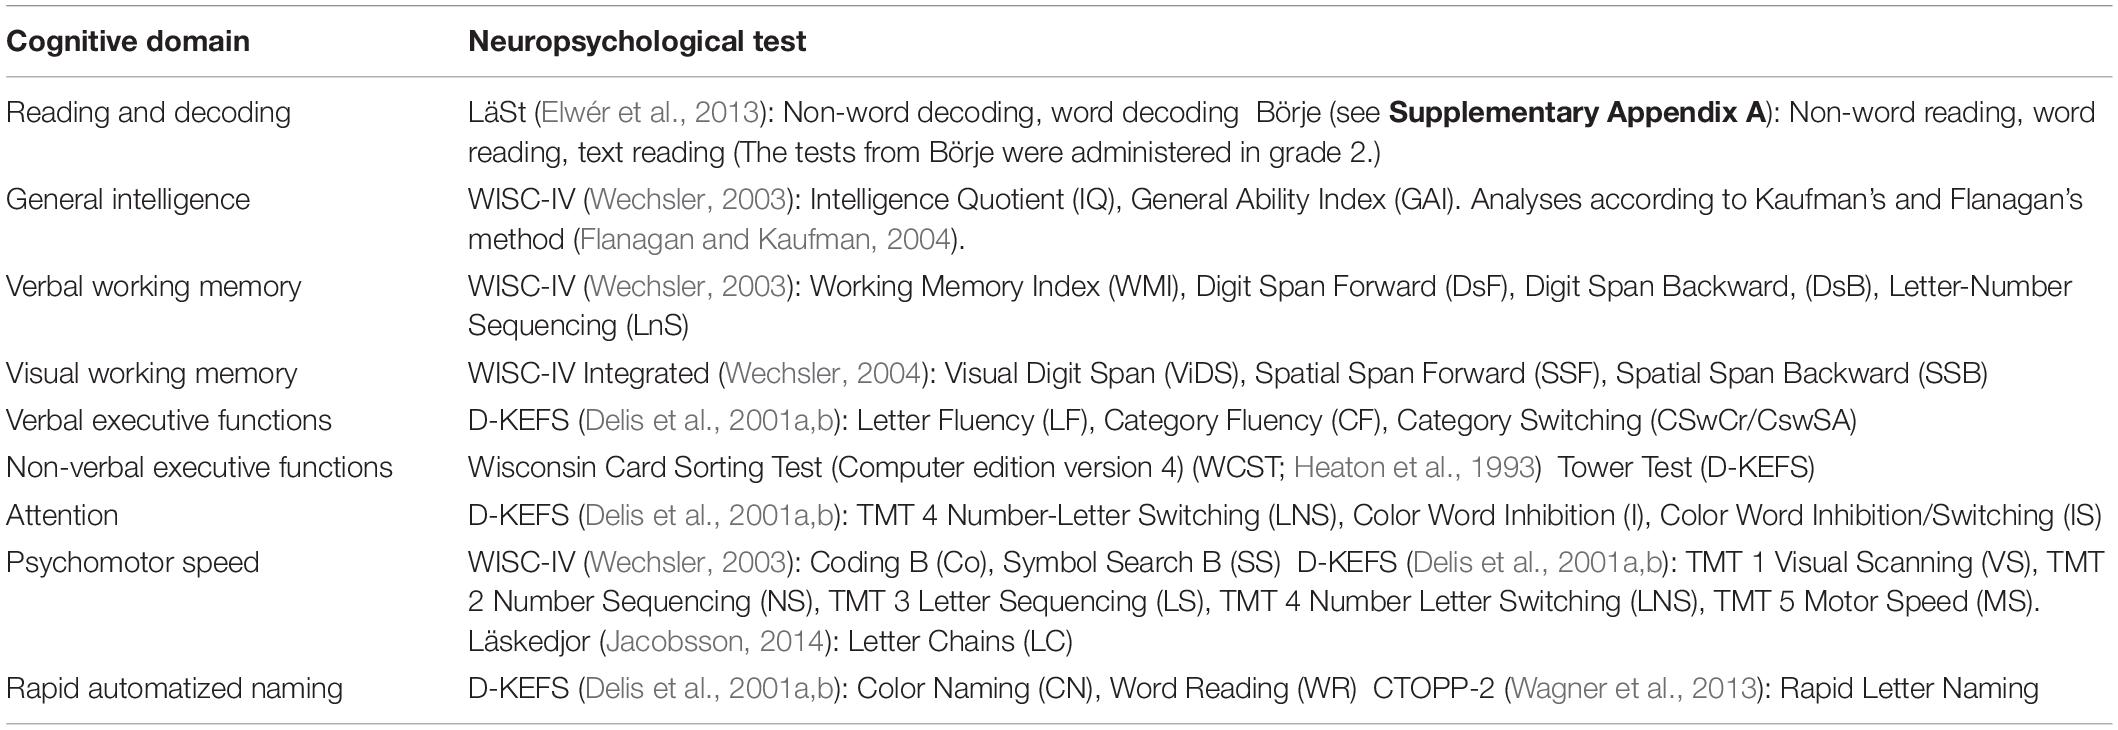
Table 1. Neuropsychological test battery.
At the time of the neuropsychological assessment, all subjects attended third grade. A pilot participant was first assessed on a single occasion during the autumn term. The remaining participants were assessed on two occasions during an interval of 12 weeks in the spring term, approximately 1 year after the eye tracking testing. The time between the two test occasions varied somewhat due to practical circumstances. Six of the participants were tested within an interval of 8 days, one participant within 14 days, and one participant within 30 days. Each test occasion lasted 1.5 h on average.
With respect to reading ability, two different sets of tests were analyzed in the neuropsychological assessment. The first set included results from the original reading ability tests performed in conjunction with the larger research project in grade 2 (non-word, real word, and text reading). The second set included results from LäSt, a standard Swedish reading ability test, administered in conjunction with the neuropsychological assessment in grade 3. All results were normalized and scaled for age at time of testing. Thus, the overall assessment gave an indication of the subjects’ reading ability both at the time of the eye tracking testing, as well as at the time of the neuropsychological assessment.
Results
First, we present group level results to show the common characteristics and overall cognitive profile of the children predicted to be at risk by the eye tracking screener. Next, we summarize the results of the neuropsychological assessment on an individual basis to reveal differences and similarities within the group. Finally, we look at the strength of association in performance between different cognitive domains.
Group Level
Given the small sample size of eight subjects, one must be very careful in drawing general conclusions about the overall cognitive profile of the participant group. Nevertheless, some common tendencies can be identified and supported by statistical analysis. The average performance across all cognitive domains was 0.47 standard deviations below the mean for the age group, indicating lower-than-average overall performance in the group. Table 2 shows the mean standard score and standard deviation for each individual cognitive domain, along with p-values for the Shapiro–Wilk normality test, as well as minimum and maximum standard scores among the participants. These results are further summarized in Figure 3 showing mean performance per domain with errors bars indicating 95% confidence intervals. In order, from the most to the least adversely affected cognitive domain we find (1) reading and decoding (−1.5 Z, 0.41 SD); (2) verbal working memory (−0.83 Z, 0.91 SD); (3) RAN (−0.53 Z, 0.24 SD); (4) attention (−0.47 Z, 0.72 SD); (5) psychomotor speed (−0.45 Z, 0.5 SD); (6) verbal executive functions (−0.39 Z, 0.43 SD); (7) general intelligence (GI; −0.36 Z, 0.48 SD); (8) visual working memory (−0.08 Z, 0.88 SD); and (9) non−verbal executive functions (0.31 Z, 0.47 SD). Notably, the average performance is below the mean for the age group in all assessed cognitive domains, with exception only for non-verbal executive functions. The three domains for which performance was the weakest (RAN, VEWM, and RD) are related to reading skill. Previous studies have shown, for example, that children who struggle with RAN also often have significant problems in learning to read and that poor performance on RAN may be an early predictor of dyslexia (Denckla and Rudel 1976a,b; Wolf et al., 1986; Vellutino et al., 1996). The average performance on reading and decoding across the group was 1.5 standard deviations below the mean. This is in line with what would be expected from a screening method whose aim is to identify children at risk of dyslexia. The most common operational definitions of dyslexia set the cutoff for reading deficiency either at 1.25 or 1.5 standard deviations below the mean for age or grade level, thus identifying 10 or 7% of the population as dyslexic, respectively (Peterson and Pennington, 2012; Landerl et al., 2013).
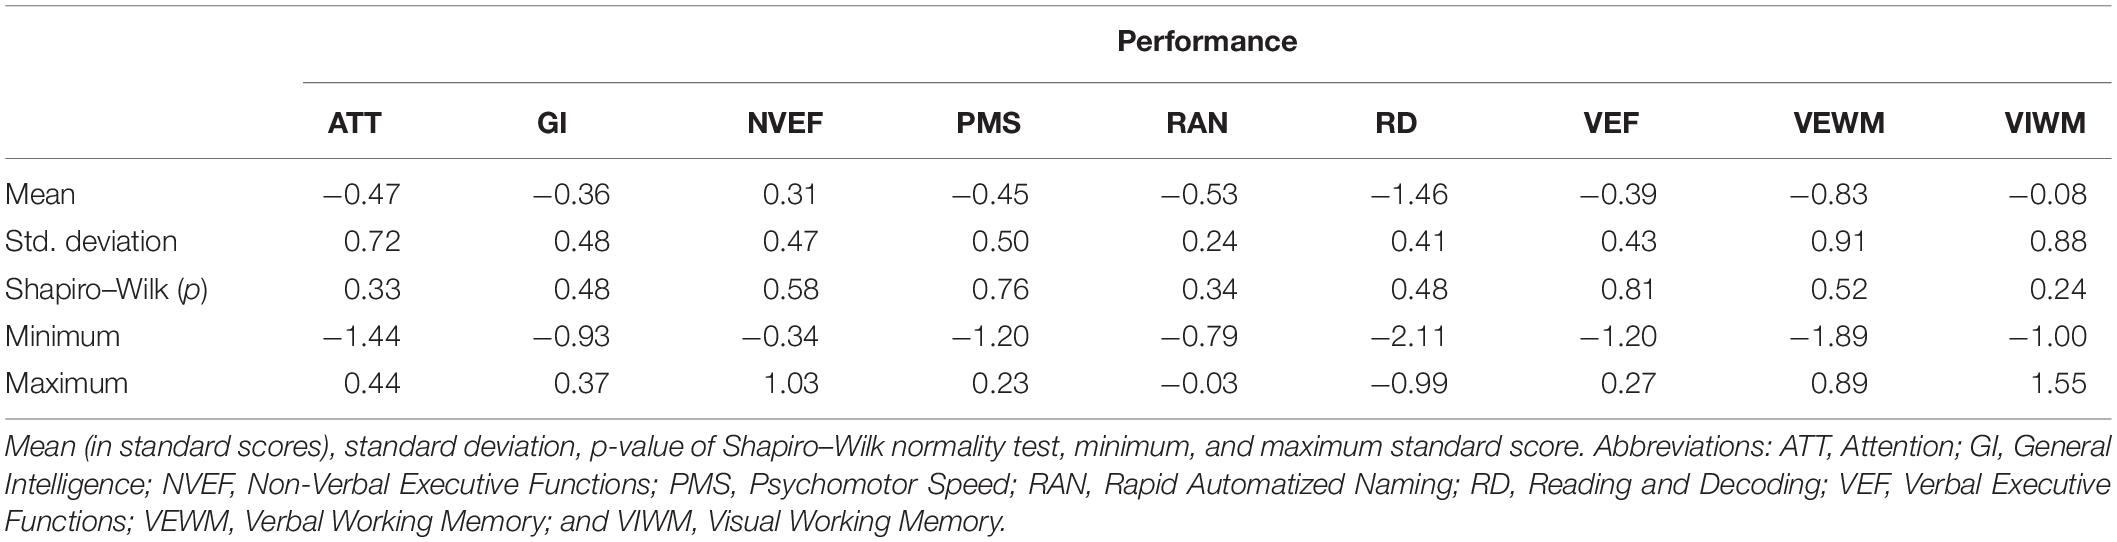
Table 2. Average performance per cognitive domain (N = 8).
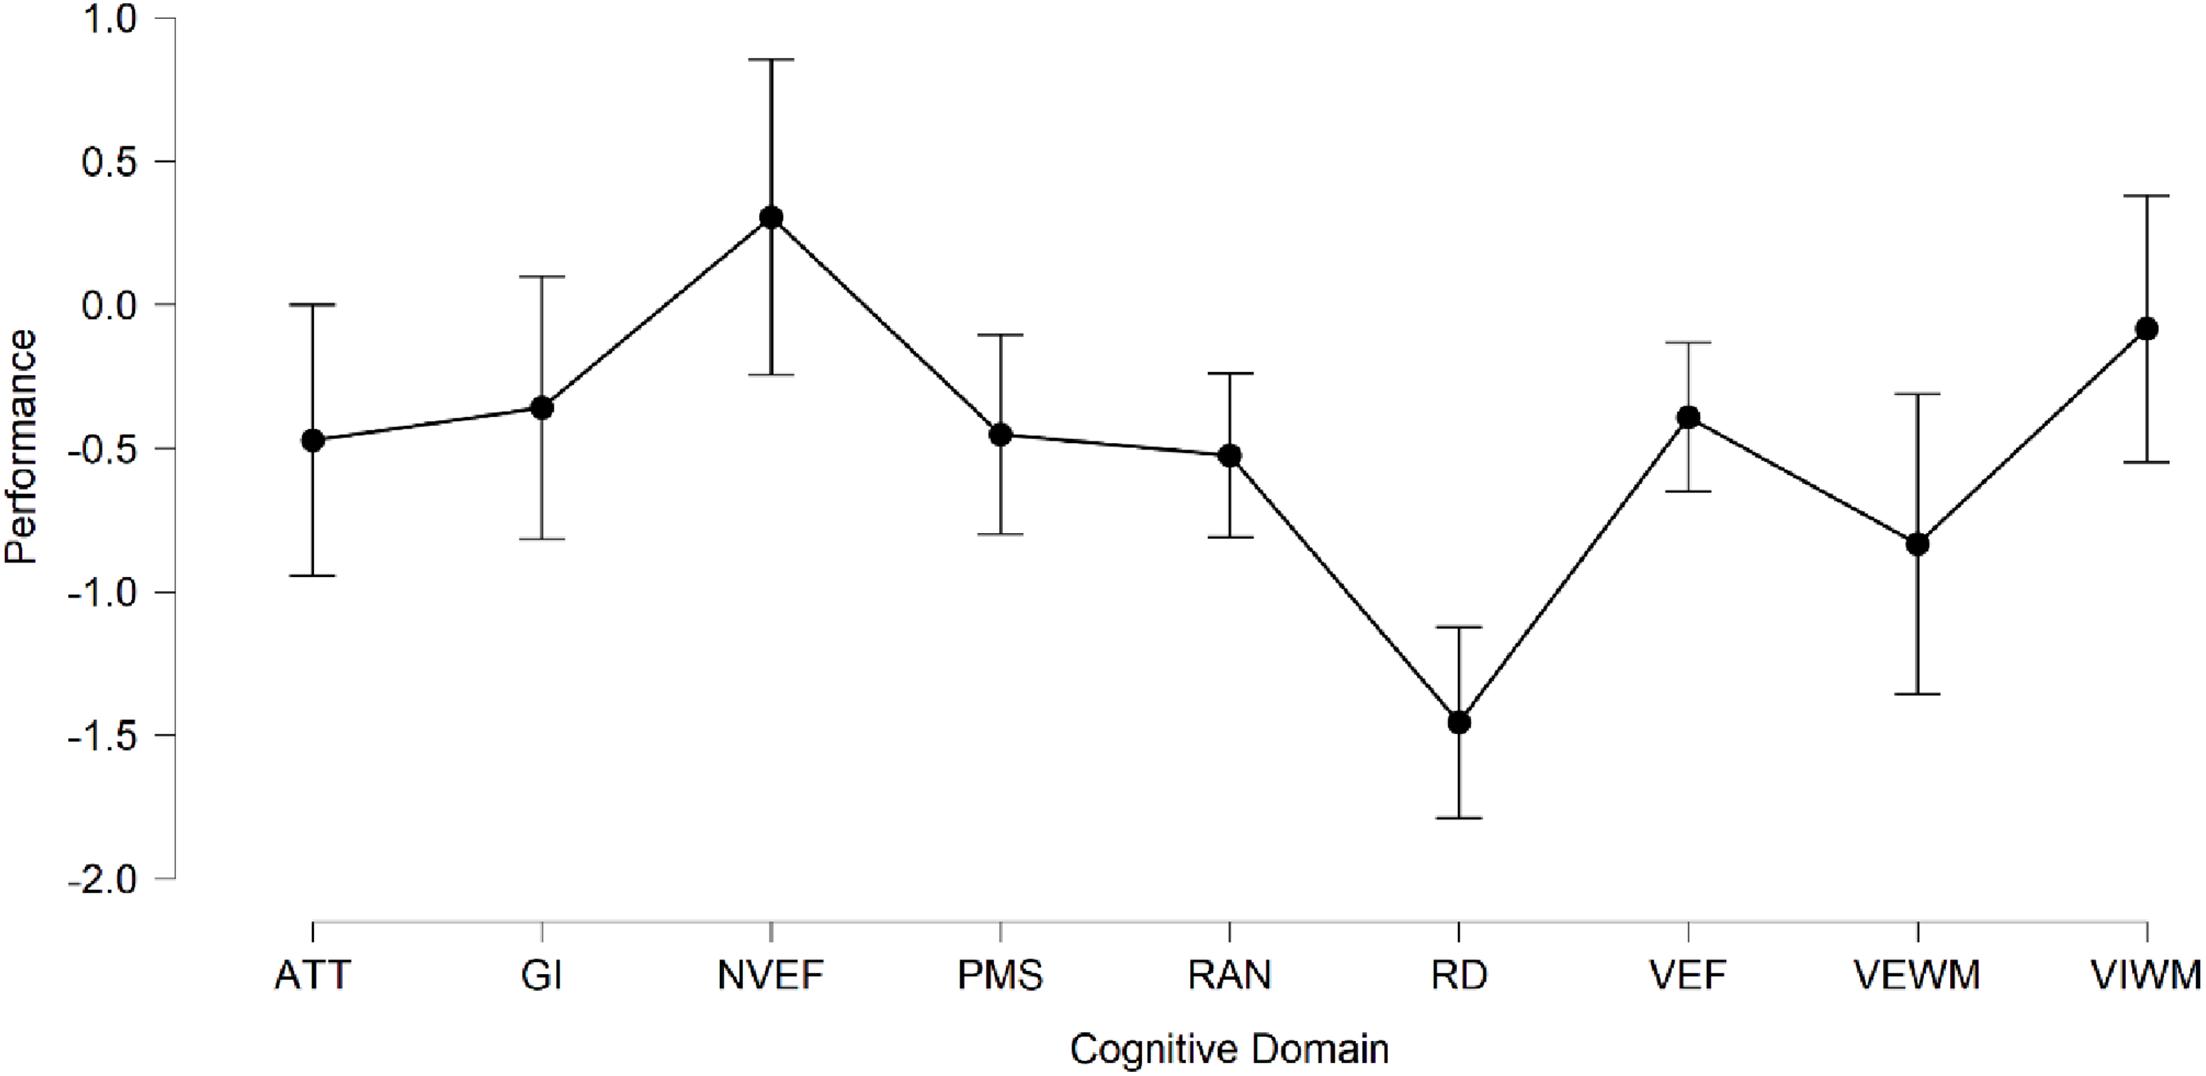
Figure 3. Mean performance per cognitive domain with 95% confidence intervals (N = 8). Abbreviations: ATT, Attention; GI, General Intelligence; NVEF, Non-Verbal Executive Functions; PMS, Psychomotor Speed; RAN, Rapid Automatized Naming; RD, Reading and Decoding; VEF, Verbal Executive Functions; VEWM, Verbal Working Memory; and VIWM, Visual Working Memory.
To understand whether there were any statistically significant differences in performance between cognitive domains, a one-way repeated measures (RM) ANOVA was performed, using cognitive domain as the RM factor with nine levels corresponding to each of the cognitive domains. Given that the average result for each individual domain was below the population mean (except for non-verbal executive functions), we were particularly interested in whether the performance on reading and decoding was significantly lower compared to the performance in other cognitive domains. The RM ANOVA assumption of sphericity was checked. Mauchly’s test of sphericity was non-significant, indicating that there were no significant differences between the variances of the differences in performance, and thus that the sphericity assumption was not violated (p = 0.35). Furthermore, the Shapiro–Wilk test of normality indicated no deviation from normality in any cognitive domain, as shown in Table 2. A significant difference in performance in different cognitive domains was found, F(8,56) = 7.36, p < 0.001, and ω2 = 0.33. Overall, 33% of the variance in performance could be attributed to cognitive domain. Post hoc testing with Holm corrections for multiple comparisons revealed that the performance on reading and decoding (M = −1.46, SD = 0.41) was significantly worse than the performance on any of the other cognitive tasks (p < 0.05), except for verbal working memory. Using the more conservative Bonferroni correction did not change the results. The only other significant difference observed was between verbal working memory (M = −0.83, SD = 0.91) and non-verbal executive function (M = 0.31, SD = 0.47). Again, this difference was statistically significant under both Holm and Bonferroni corrections (p = 0.001).
The fact that the average performance on verbal working memory tasks did not differ significantly from the performance on reading and decoding tasks is interesting, but not entirely surprising on the assumption that learning to read involves the ability to mentally maintain and manipulate sequential visual information based on one’s phonological knowledge and auditory system. Given the sequential nature of linguistic input, it might be expected that children with reading and decoding difficulties also struggle with other tasks involving sequential processing and conscious mental manipulation of symbols, such as letters and numbers.
It is also interesting to note that the difference in performance between reading/decoding and RAN was statistically significant. Previous research has suggested that RAN is a predictor of reading skill independent of other factors, such as phonological awareness. Thus, one might possibly have expected that the participants would perform on a par with reading/decoding on RAN, and therefore, that the difference in performance would not be significant. However, it is also well-established that the influence of rapid naming performance on reading skill decreases rapidly with age and that RAN is primarily useful as a predictor of reading skill in the early stages of reading instruction, often in first and second grade. Later, the relationship is considerably weaker. Torgesen et al. (1997), for example, show that from third grade, RAN performance does not predict any unique variance in reading measures, whereas phonological awareness continues to do so. The children in our study were attending third grade by the time of the neuropsychological assessment, which may explain why they perform significantly better on RAN than on reading/decoding. At this age, they may have automized the naming of letters in the alphabet, for example, but still be struggling with word decoding and reading.
Even though the average performance of the participant group is generally below the mean for age, only average reading and decoding ability deviates to an extent that would normally be considered indicative of a reading deficit in a clinical diagnostic setting. Importantly, however, this does not mean that all eight participants assessed with the neuropsychological test battery would be eligible for a dyslexia diagnosis. While all participants performed below the population mean in reading and decoding, there is a considerable variability in the results. The subject who had the strongest result on reading and decoding performed approximately one standard deviation below the mean, and the subject who had the weakest result performed approximately two standard deviations below the mean. Thus, there is a range of approximately one standard deviation in reading and decoding ability among the participants. Which of them who would meet the criteria for dyslexia ultimately depends on a number of factors, including the selection of a critical cut-off score relative to the norm (e.g., 10th percentile).
To conclude we summarize the three most important findings, relating the results of the neuropsychological assessment to the screening system that originally identified the study participants as being at risk of dyslexia.
Children who were predicted to be at risk of dyslexia by the eye tracking screener:
1. Performed on average below the mean for age in all cognitive domains, except for non-verbal executive functions.
2. Performed on average significantly worse in reading and decoding than in all other cognitive domains, except verbal working memory.
3. Did not perform significantly differently in cognitive domains other than reading and decoding (except that performance in verbal working memory was significantly lower than in non-verbal executive functions).
Individual Level
The group level analysis in section “Group level” was helpful to understand the common characteristics and overall cognitive profile of the participant group. However, the eye tracking screener is first and foremost intended for use at the individual level. From a practitioner’s point of view (e.g., a special needs teacher who is planning to use the screener in school) it is the predictions produced at this level that are of primary interest. The results of the neuropsychological assessment are summarized on a case-by-case basis in Figure 4. Performance that is 1.25 standard deviations or more below the mean (i.e., approximately the 10th percentile) for age in any domain is considered a deviation from the norm that may be indicative of a potential deficit. Along with each subject’s median performance across domains, the interquartile range (IQR), or the difference between the 75th percentile and the 25th percentile (i.e., the middle half of the data), is also reported as a measure of spread and variability.
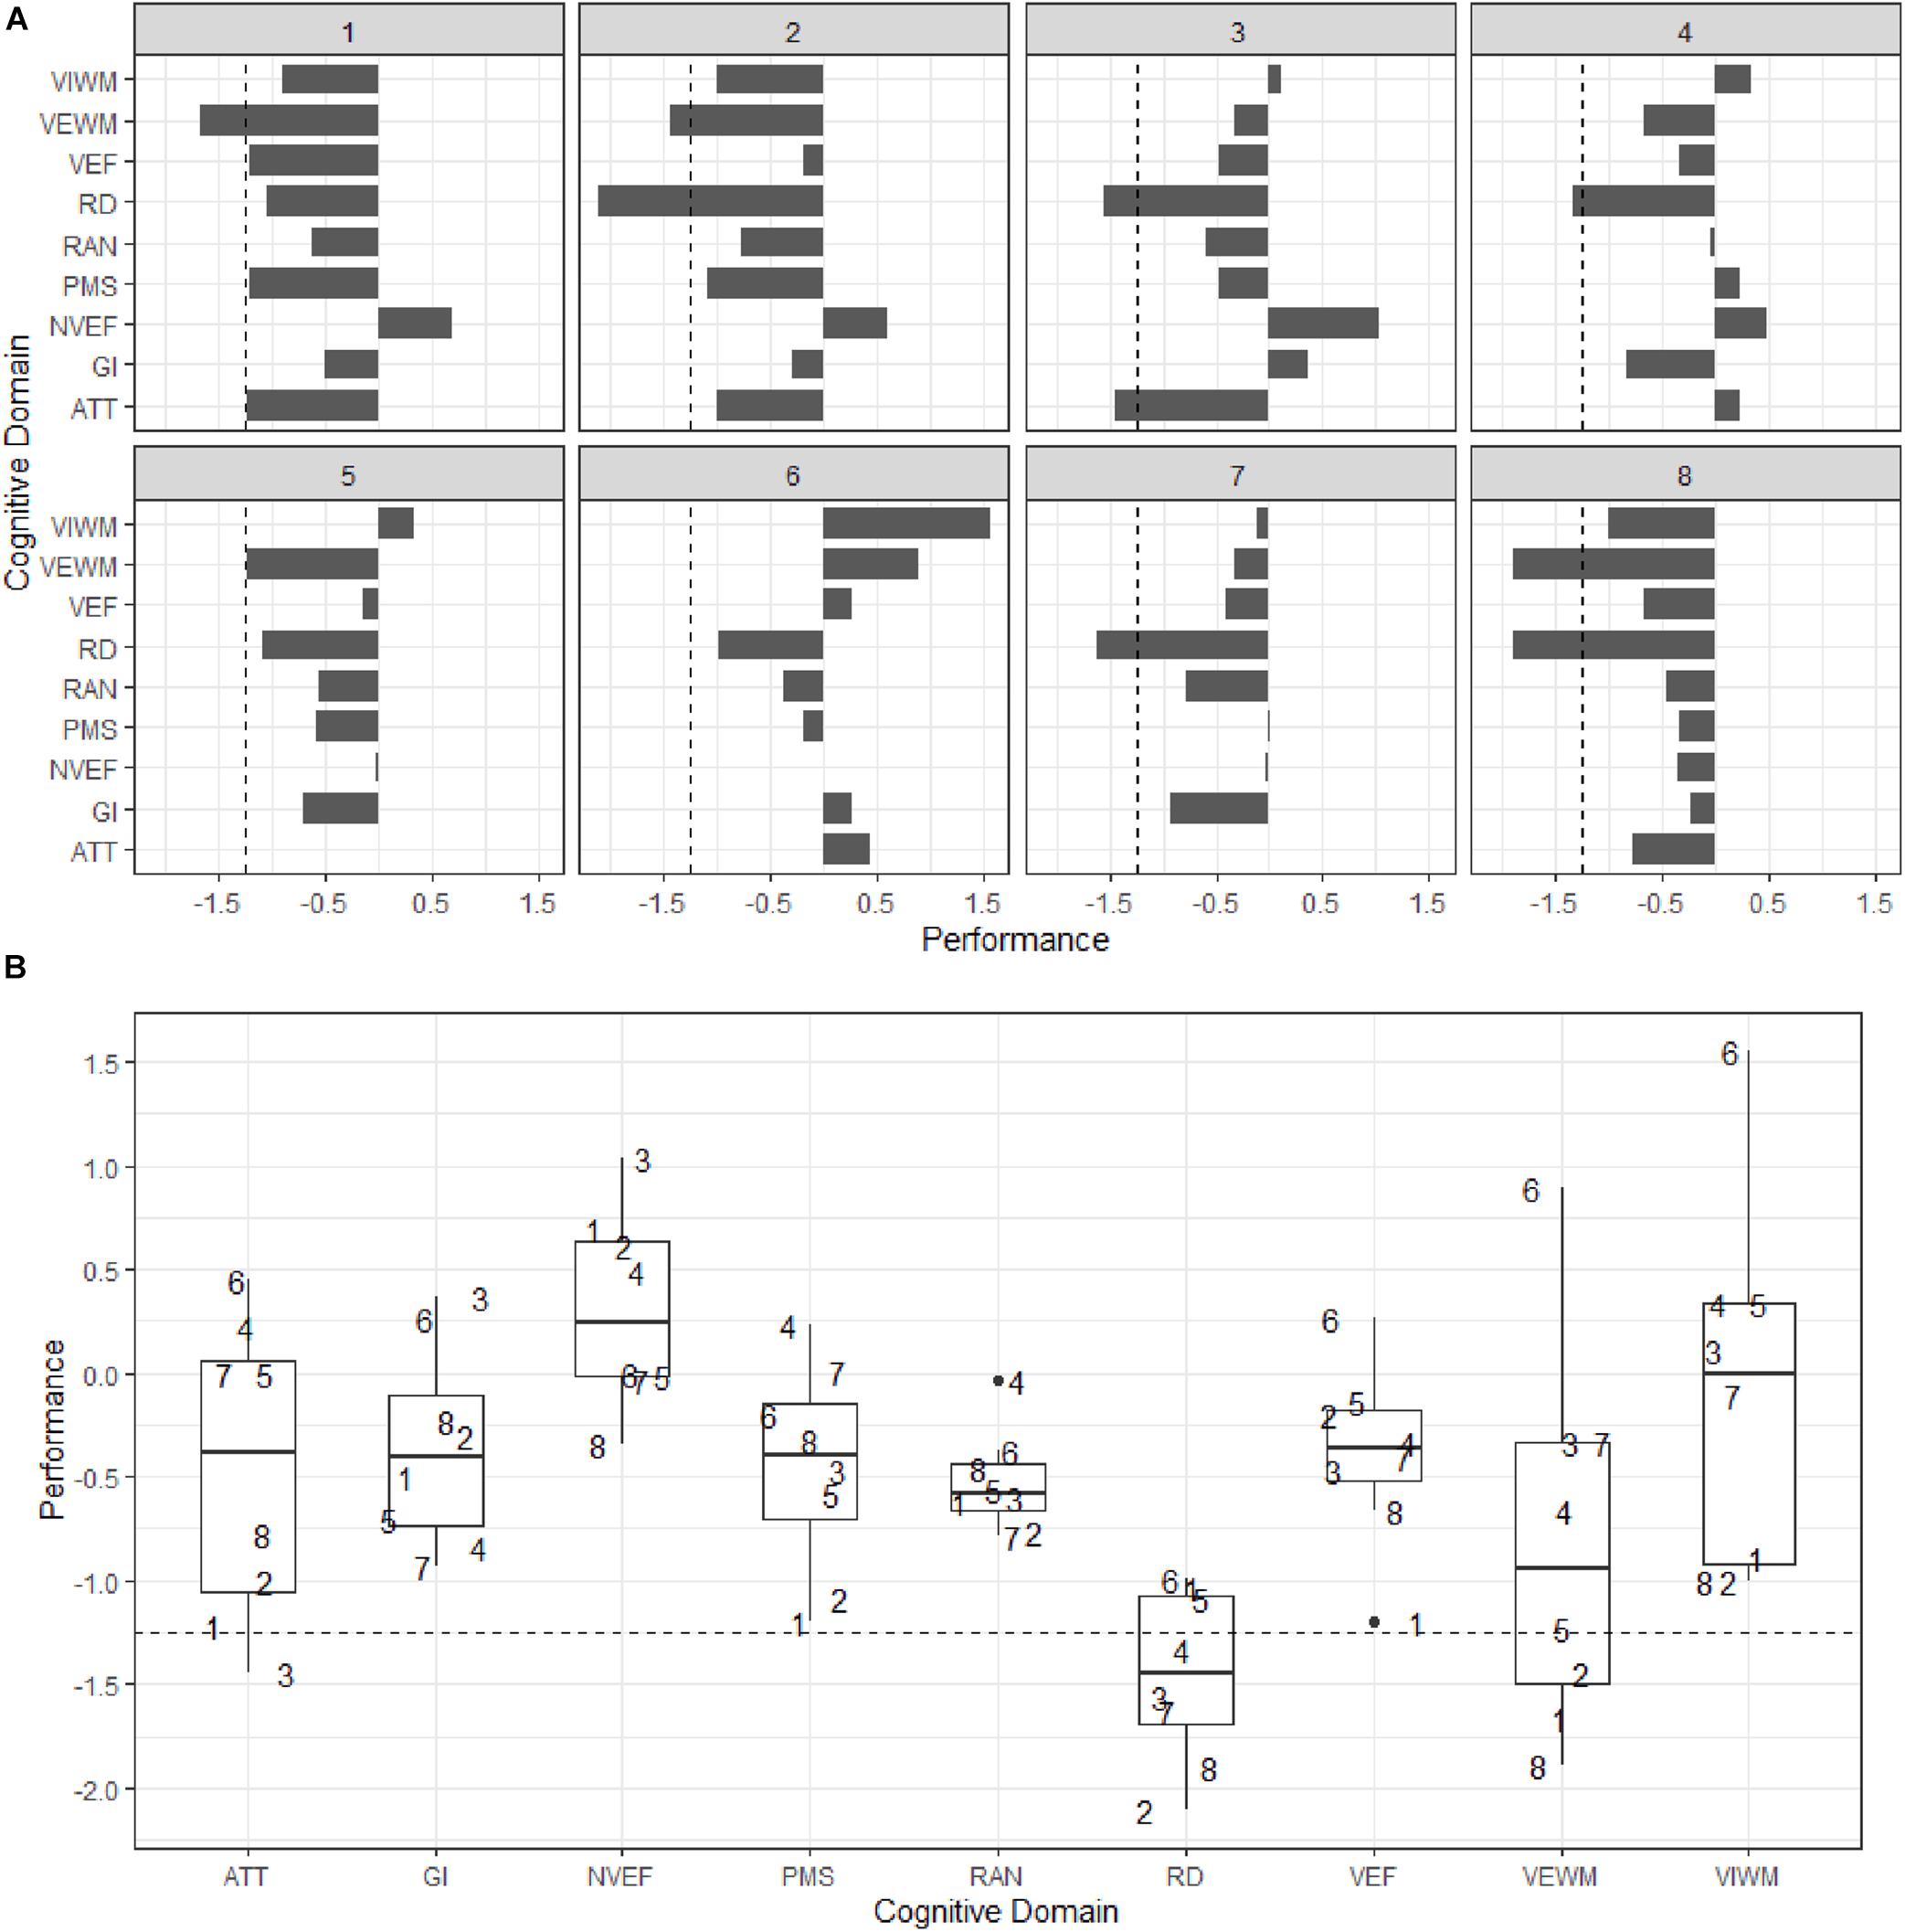
Figure 4. (A) Bar plots of individual performance (x) by cognitive domain (y). (B) Box plots of performance (y) by cognitive domain (x). Subjects are numbered 1–8. Dashed lines represent 1.25 SD below mean for age. Abbreviations: ATT, Attention; GI, General Intelligence; NVEF, Non- Verbal Executive Functions; PMS, Psychomotor Speed; RAN, Rapid Automatized Naming; RD, Reading and Decoding; VEF, Verbal Executive Functions; VEWM, Verbal Working Memory; and VIWM, Visual Working Memory.
Subject 1 has a median performance of −1.04 (IQR = 0.58) across all cognitive domains and performs below the mean for age in all domains except NVEF. The subject performs at or below cut-off in four domains, VEF (−1.2), PMS (−1.2), ATT (−1.22), and VEWM (−1.67). In RD, the subject’s performance is −1.04. Subject 2 has a median performance of −1.00 (IQR = 0.78) across cognitive domains and performs below the mean for age in all domains except NVEF. The subject performs below cut-off in two domains, VEWM (−1.44) and RD (−2.1). Subject 3 has a median performance of −0.47 (IQR = 0.71) across cognitive domains and performs below the mean for age in all domains except GI, VIWM, and NVEF. The subject performs below cut-off in two domains, ATT (−1.44) and RD (−1.56). Subject 4 has a median performance of −0.03 (IQR = 0.9) across cognitive domains and performs below the mean for age in five domains, GI, VEWM, VEF, RAN, and RD. Performance is below cut-off in one domain, RD (−1.34). Subject 5 has a median performance of −0.56 across domains (IQR = 0.69) and performs below the mean for age in all domains except VIWM and ATT. The subject does not perform below cut-off in any domain, but the weakest performance is observed in RD (−1.1) and VEWM (−1.22). Subject 6 has a median performance of +0.27 across cognitive domains (IQR = 0.64) and performs below the mean for age in three domains, PMS, RAN, and RD. Performance is not below cut-off in any domain, but the weakest performance is observed in RD (−0.99). Subject 7 has a median performance of −0.33 across cognitive domains (IQR = 0.76) and performs below the mean for age in all domains except ATT and PMS. The subject performs below cut-off in one domain, RD (−1.63). Subject 8 has a median performance of −0.67 across cognitive domains (IQR = 0.66) and performs below the mean for age in all domains. Performance is below cut-off in two domains, VEWM (−1.89) and RD (−1.90).
None of the participants performed below cut-off in General Intelligence, Non-verbal Executive Functions, Psychomotor speed, Verbal Executive Functions, RAN, or Visual Working Memory, indicating that these cognitive domains were generally not impaired, although performance was frequently below the mean for the age group. The cognitive domains that were found to be below the deficiency cut-off in one or more individuals were Attention, Verbal Working Memory, and Reading/Decoding. Six out of eight participants performed below cut-off in at least one of these three cognitive domains. Five participants performed below the deficiency cut-off in Reading/Decoding. Among these five participants, two performed below cut-off in Reading/Decoding only, two performed below cut-off in both Reading/Decoding and Verbal Working Memory, and one performed below cut-off in both Reading/Decoding and Attention. One participant performed below cut-off in Verbal Working Memory only. Notably, Reading/Decoding was the only domain for which the median performance across the group was below the deficiency cut-off threshold, which further reinforces the conclusion that Reading/Decoding was the most adversely affected cognitive domain among the participants. It is also interesting to note that two participants performed at or below the 1.25 threshold in the attention domain, which suggests that children who are predicted to be at risk of dyslexia by the eye tracking screener may in some instances also have an associated attention-related deficit. The variability within subjects across cognitive domains ranged between 0.58–0.9 (M = 0.72). The largest variability between subjects was observed in Visual Working Memory (IQR = 1.25), and the smallest variability in RAN (IQR = 0.22). Reading and decoding had an IQR of 0.61, which was slightly less than the mean variability across all domains (IQR = 0.72).
Correlation Between Domains
In our final analysis, we look at the strength of association in performance between different cognitive domains. Pearson’s correlation coefficient (r) for all pairwise correlations are shown in the matrix in Figure 5. Significant correlations were found between Verbal Working Memory and Visual Working Memory (r = 0.89, p < 0.01), between Attention and Visual Working Memory (r = 0.71, p < 0.05), and between Visual Working Memory and Verbal Executive Functions (r = 0.73, p < 0.05). Given the small sample size (n = 8), one must interpret the correlation coefficients with caution, since an association may appear to be present even though none exists. Reading/Decoding was moderately but not significantly correlated with Verbal Working Memory (r = 0.4), Visual Working Memory (r = 0.64), Attention (r = 0.42), and RAN (r = 0.36). General Intelligence, Verbal and Non-Verbal Executive Functions, and Psychomotor speed did not correlate with Reading/Decoding performance. Overall, these results were in line with the relationships that our previous analyses have identified.
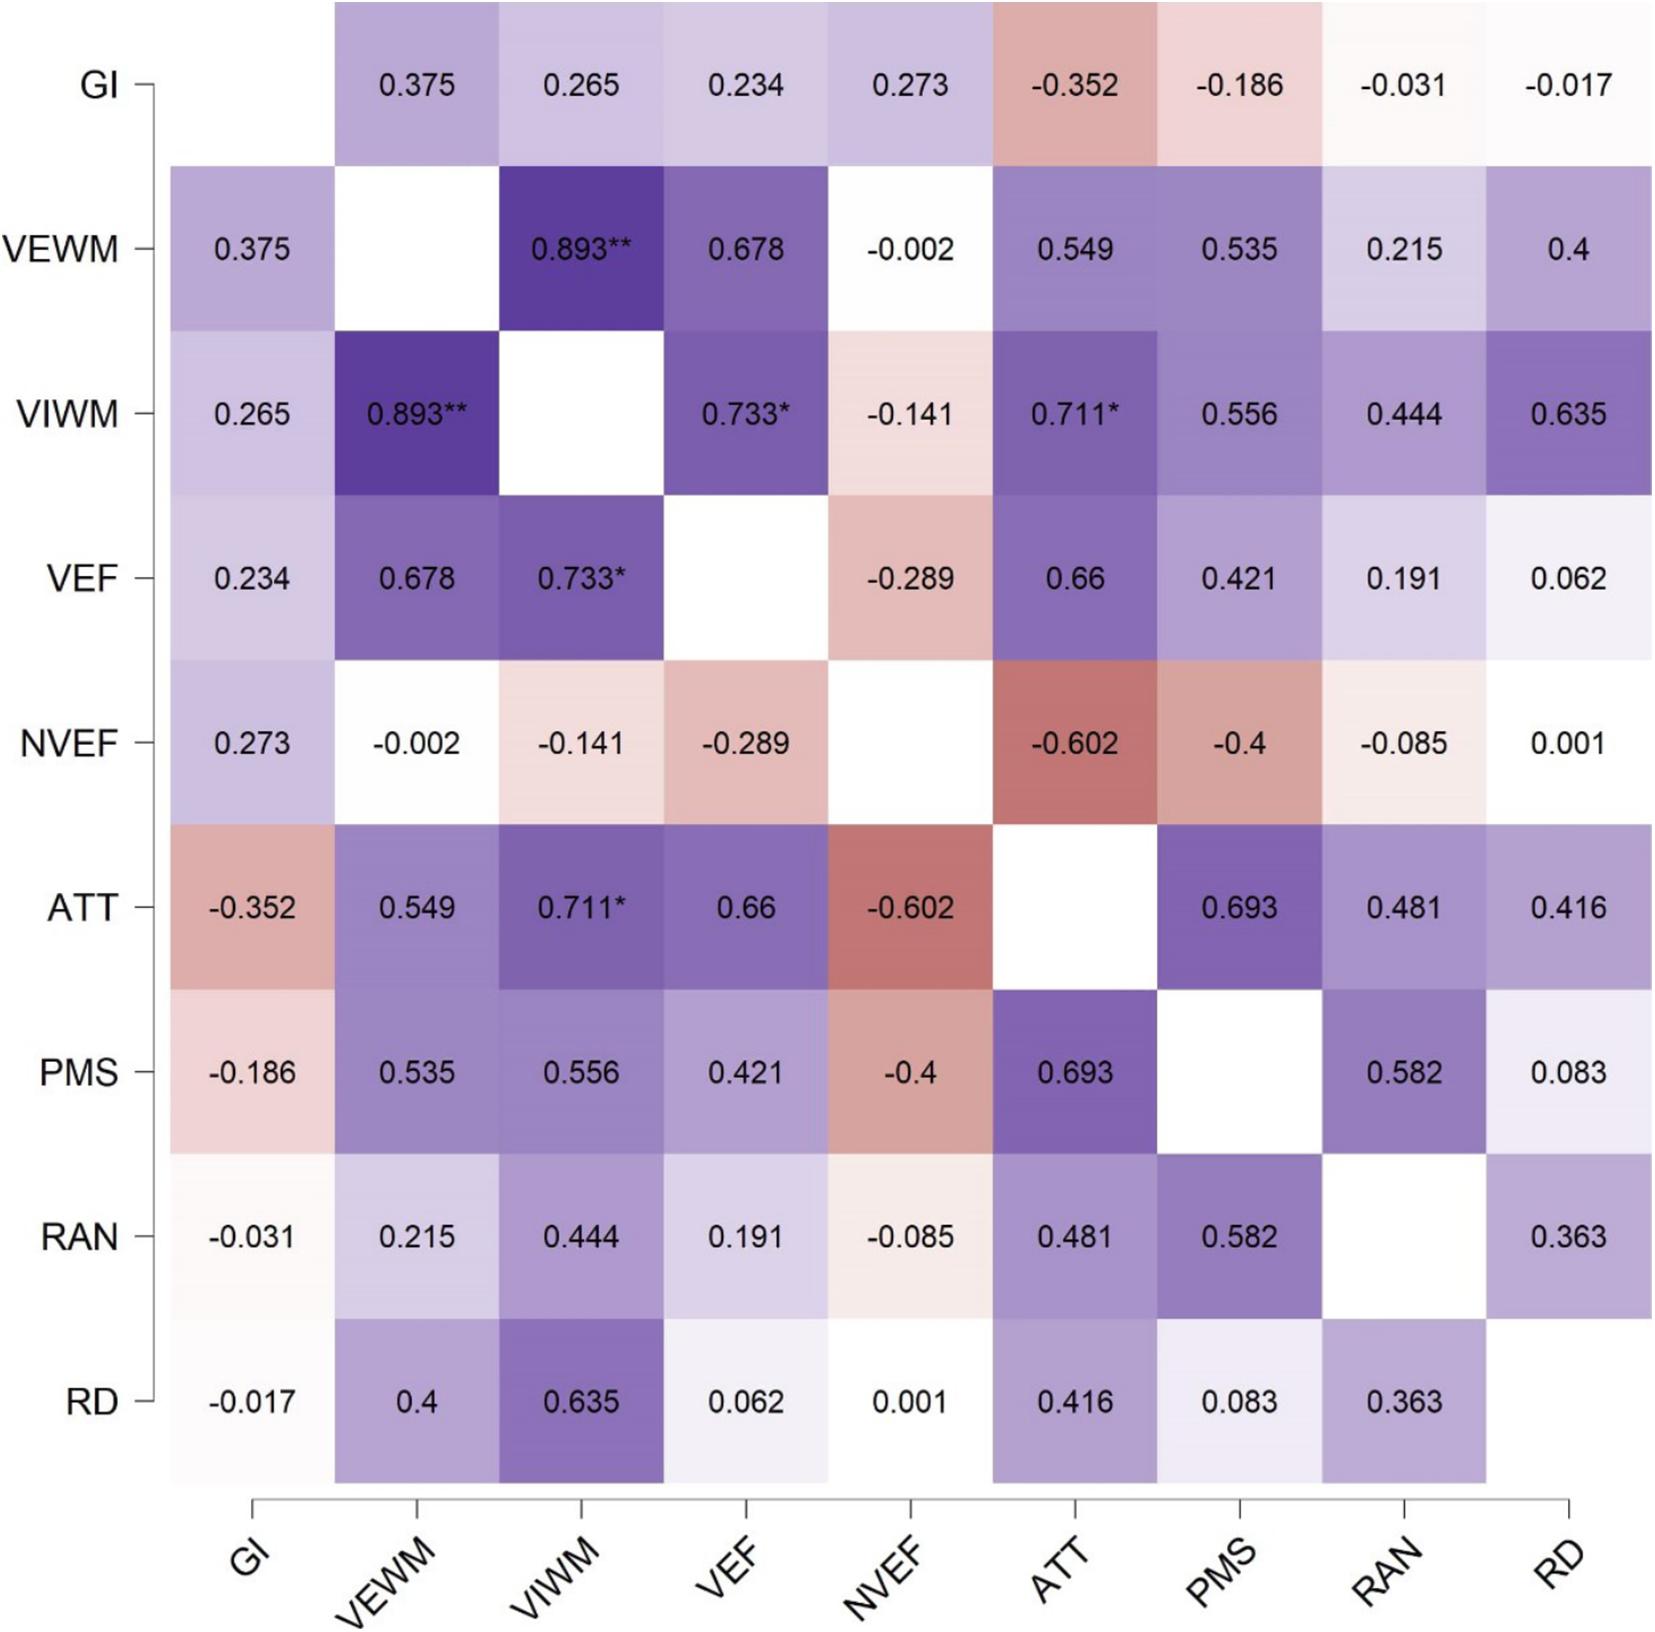
Figure 5. Correlation matrix with Pearson’s product-moment correlation coefficient (r) between the performance in all cognitive domains, ∗p < 0.05, ∗∗p < 0.01. Abbreviations: ATT, Attention; GI, General Intelligence; NVEF, Non-Verbal Executive Functions; PMS, Psychomotor Speed; RAN, Rapid Automatized Naming; RD, Reading and Decoding; VEF, Verbal Executive Functions; VEWM, Verbal Working Memory; VIWM, Visual Working Memory.
Discussion
The purpose of this study was to assess the validity of predictions of risk for dyslexia made by an eye tracking screening system by comparing the predictions against the results of a comprehensive neuropsychological assessment of cognitive ability. Overall, we found a good agreement between the eye tracking predictions and the cognitive assessments. However, our study has a number of limitations which make the generalization of results difficult. The most obvious limitation is the small number of participants included. In hindsight, it might have been preferable to reduce the extent of the neuropsychological battery to make room for assessing more participants, which would have provided more robust and reliable statistical results. On the other hand, we wanted to change as little as possible in the cognitive assessment to ensure that the test battery was comparable to a standard clinical assessment of children’s cognitive abilities. A further limitation is the absence of a matched control group. Ideally, another set of aged-matched subjects who were not at risk of dyslexia according to the eye tracking screening method should have been included. Assuming the cognitive assessment represents the gold standard, we are currently only able to assess the sensitivity (true positive rate) of the eye tracking screener, not its specificity (true negative rate). In other words, our analysis does not say anything about the extent of agreement between children who were predicted to be at no risk and their performance in a neuropsychological assessment. Nevertheless, analyzing the sensitivity of the eye tracking predictions is an important first step in understanding how the results of eye tracking based screening relate to the results of comprehensive cognitive assessments. Another potential limitation is the fact that some of the reading and decoding tests that were used in the neuropsychological assessments had also previously been used in the development of the eye tracking based machine learning model. In hindsight, it might have been better to use a completely different set of reading and decoding tests in the cognitive assessment to ensure complete independence from the eye tracking testing. On the other hand, most reading and decoding tests for dyslexia are similar and purport to measure the same construct or ability, so it is not clear that it would have had any particular effect on the outcome.
Based on the results of our analysis it is not possible to conclude that the eye tracking screener is able to identify children who only experience difficulties in reading. An associated co-occurring deficit in the domain of attention was observed in two study participants. Research shows that it is not unusual for dyslexia to co-occur with attention-related disorders such as ADHD and it is estimated that approximately 15–20% of children and adolescents with dyslexia also have ADHD (Handler and Fierson, 2011). Thus, it is not surprising that some of the children who were predicted to be at risk of dyslexia showed strong traits of attention deficits. On the contrary, it is expected and in line with empirical evidence. More generally, given the known comorbidities and associations with other learning disorders (see, for example, Carroll et al., 2004; Willcutt et al., 2010; Margari et al., 2013), many children with dyslexia can be expected to struggle broadly in school and experience problems not only in reading but in other areas as well (Peterson and Pennington, 2012). Overall, the results from this study are in line with this prediction. This is indicated, for example, by the fact that six out of eight children predicted to be at risk of dyslexia performed below the mean for age in the majority of the cognitive domains investigated. Nevertheless, performance in reading and decoding was the only cognitive domain for which the median performance across the group was more than 1.25 standard deviations below the mean for age, indicating the presence of a primary reading deficit in at least half of the study participants. For the practitioner or special needs teacher who is working with struggling readers, it is important to be aware of co-occurring difficulties that may affect learning and development. These difficulties may not be directly related to problems in reading and decoding, but they may still have a negative impact on reading development (Handler and Fierson, 2011). The extent and nature of co-occurring difficulties, however, are unlikely to be evident from eye tracking based screening alone. Therefore, a follow-up of screening results indicating risk of dyslexia is necessary to gather a more comprehensive understanding of an individual’s whole cognitive profile. Such an understanding is likely to facilitate the development of coordinated interventions tuned to individual needs. It is worth noting, however, that the same reasoning applies with respect to the outcome of all traditional screening instruments that assess reading skill and risk of dyslexia, it is not unique to eye tracking based screening systems.
Considering that the majority of children who participated in the cognitive assessment appeared to have some learning difficulty, one may wonder whether these problems persisted over time, or whether they were of a more temporary nature and decreased as the children got older. While we cannot provide a definitive answer to this question, we conducted a minor follow-up interview with the special educational needs teachers of most of the children in 5th grade, approximately 2 years after the assessment, to get a general idea of the children’s developmental status. From these interviews it is clear that a number of children either already had been or were presently being referred to the health services with concerns about their learning development. Three children had been diagnosed with dyslexia and a fourth were currently under investigation for dyslexia. Among those four children, two had also been diagnosed with ADHD and a third were under investigation for ADHD. One child, who previously had a diagnosis of autism spectrum disorder, had now also received an ADHD diagnosis. This child also had difficulties with reading and had been investigated for dyslexia, but the disorder could not be established. Another child struggled a lot with reading, according to the special needs teacher, but reached the necessary requirements and had thus not been investigated for dyslexia. Finally, one of the children had had a positive development with respect to reading and was not under consideration for referral or further evaluation.
A long line of research on eye movements during reading in cognitive psychology has shown that language processes have an essentially immediate influence on eye movements and gaze behavior (see, for example, Huey, 1908; Just and Carpenter, 1980; Rayner et al., 2012). Therefore, it is not surprising that eye movement analysis can be useful in assessing reading skill and risk of dyslexia. Even though atypical eye movements are only a secondary consequence of dyslexia, eye tracking is an effective method to assess the extent of cognitive processing demands that children experience during reading. Interestingly, similar methods using eye tracking and machine learning have been applied in recent years to develop predictive and automated screening tools to identify various other neurological diseases and conditions, for example, Parkinson’s disease (Tseng et al., 2013), schizophrenia (Benson et al., 2012), and autism spectrum disorders (Carette et al., 2019).
Conclusion
Eye tracking has been proposed as an objective, efficient and accurate screening method that can be used to obtain a basic assessment of children’s reading skill and potential risk of dyslexia. Overall, our results lend further support to this view. The eye tracking screening system managed to accurately identify children who had significant difficulties in learning to read relative to their age. Thus, our findings indicate that eye tracking can be useful for identifying children with an atypical reading development (which could be caused by dyslexia) and who need additional support. However, it is important to be aware that children who are identified as at risk by an eye tracking screening system may have additional cognitive difficulties that extend beyond just reading and decoding, most likely problems relating to attention. Based on the neuropsychological assessment, however, it is fair to say that all participants in this study were in need of further support in their reading development, and identifying such children is exactly the purpose of the screening system. From this perspective, there is no disagreement between the eye tracking based predictions and the results of the neuropsychological assessment.
Data Availability Statement
The raw data supporting the conclusions of this article will be made available by the authors, without undue reservation.
Ethics Statement
The studies involving human participants were reviewed and approved by Central Ethical Review Board of Sweden. Written informed consent to participate in this study was provided by the participants’ legal guardian/next of kin.
Author Contributions
AGE, MNB, and GÖS contributed to conception and design of the study. AGE performed the neuropsychological assessments. MNB and GÖS processed the data and performed the statistical analysis. AGE and MNB wrote the draft of the manuscript. All authors contributed to manuscript revision, read, and approved the submitted version.
Conflict of Interest
MNB and GÖS are co-founders of Optolexia, in which they own equity. Optolexia is a company whose aim is to develop and offer screening tools for neurological disorders based on eye tracking. They are also part-time employees in the affiliated company Lexplore, which is a company that offers a screening solution for assessing reading skill in school children based on eye tracking and machine learning technology. The company started as part of a research project funded by Sweden’s innovation agency – VINNOVA – (2014–03459) and the competing interest was at the time of the project approved by the Swedish Central Ethical Review Board (Ö 13/2015).
The remaining author declares that the research was conducted in the absence of any commercial or financial relationships that could be construed as a potential conflict of interest.
Funding
This work was supported by funding from the Ulla and Ingemar Dahlberg Foundation; Sweden’s Innovation Agency (VINNOVA), http://www.vinnova.se/; and the Promobilia Foundation, http://www.promobilia.se/. The funders had no role or involvement in study design, data collection, analysis and interpretation of data, in the writing of the report, or in the decision to submit the article for publication.
Acknowledgments
The authors wish to express their gratitude to the Sigvard and Marianne Bernadotte Research Foundation for Children’s Eye Care for their invaluable support and vision for the future.
Supplementary Material
The Supplementary Material for this article can be found online at: https://www.frontiersin.org/articles/10.3389/feduc.2021.643232/full#supplementary-material
References
Alexander-Passe, N. (2006). How dyslexic teenagers cope: an investigation of self-esteem, coping and depression. Dyslexia 12, 256–275. doi: 10.1002/dys.318
American Psychiatric Association [APA] (2013). Diagnostic and Statistical Manual of Mental Disorders, DSM-5, 5th Edn. Arlington, VA: American Psychiatric Publishing.
Benfatto, M. N., Seimyr, G. Ö, Ygge, J., Pansell, T., Rydberg, A., and Jacobson, C. (2016). Screening for dyslexia using eye tracking during reading. PloS One 11:e0165508. doi: 10.1371/journal.pone.0165508
Benson, P. J., Beedie, S. A., Shephard, E., Giegling, I., Rujescu, D., and St. Clair, D. (2012). Simple viewing tests can detect eye movement abnormalities that distinguish schizophrenia cases from controls with exceptional accuracy. Biol. Psychiatry 72, 716–724. doi: 10.1016/j.biopsych.2012.04.019
Carette, R., Elbattah, M., Cilia, F., Dequen, G., Guérin, J., and Bosche, J. (2019). “Learning to predict autism spectrum disorder based on the visual patterns of eye-tracking scanpaths,” in Proceedings of the 12th International Joint Conference on Biomedical Engineering Systems and Technologies, HEALTHINF, Vol. 5 (Setúbal: SciTePress), 103–112. doi: 10.5220/0007402601030112
Carroll, J. M., Maughan, B., Goodman, R., and Meltzer, H. (2004). Literacy difficulties and psychiatric disorders: evidence for comorbidity. J. Child Psychol. Psychiatry 46, 524–532. doi: 10.1111/j.1469-7610.2004.00366.x
Ceravolo, I. D. A., Brasil, A. R., and Komati, K. S. (2019). “Classifying readers with dyslexia from eye movements using machine learning and wavelets,” in Proceedings of 8th Brazilian Conference on Intelligent Systems (BRACIS), Salvador. Available online at: https://sol.sbc.org.br/index.php/eniac/article/download/9342/9244/
Clifton, C., Staub, A., and Rayner, K. (2007). “Eye movements in reading words and sentences,” in Eye Movements: A Window on Mind and Brain, ed. R. van Gompel (Amsterdam: Elsevier), 341–372. doi: 10.1016/b978-008044980-7/50017-3
Delis, D. C., Kaplan, E., and Kramer, J. H. (2001a). Delis Kaplan Executive Function System. San Antonio: Pearson.
Delis, D. C., Kaplan, E., and Kramer, J. H. (2001b). Delis Kaplan Executive Function System Examiners Manual. San Antonio: Pearson.
Denckla, M. B., and Rudel, R. G. (1976b). Rapid ‘automatized’ naming (R.A.N.): dyslexia differentiated from other learning disabilities. Neuropsychologia 14, 471–479. doi: 10.1016/0028-3932(76)90075-0
Denckla, M. B., and Rudel, R. G. (1976ba). Naming of object-drawings by dyslexic and other learning disabled children. Brain Lang. 3, 1–15. doi: 10.1016/0093-934x(76)90001-8
Elwér, Å, Fridolfsson, I., Samuelsson, S., and Wiklund, C. (2013). LäSt Test I Läsning och Stavning för åk 1-6. Stockholm: Hogrefe Psykologiförlaget AB.
Flanagan, D. P., and Kaufman, A. S. (2004). Essentials of WISC-IV Assessment. New Jersey, NJ: John Wiley & Sons, Inc. Hoboken.
Florea, L. (2018). Future trends in early diagnosis for cognition impairments in children based on eye measurements. IEEE Instrum. Meas. Mag. 21, 41–42. doi: 10.1109/mim.2018.8360918
Gustafsson, J.-E., Allodi, M., Alin Åkerman, B., Ericsson, C., Eriksson, L., Fischbein, S., et al. (2010). School Learning and Mental Health. A Systematic Review. Stockholm: Health Committee, Royal Swedish Academy of Sciences.
Handler, S. M., and Fierson, W. M. (2011). Learning disabilities, dyslexia, and vision. Pediatrics 127, e818–e856.
Heaton, R. K., Chelune, G. J., Talley, J. L., Kay, G. G., and Curtiss, G. (1993). Wisconsin Card Sorting Test. Florida: PAR (Psychological Assessment Resources).
Jothi Prabha, A., and Bhargavi, R. (2019). Prediction of dyslexia from eye movements using machine learning. IETE J. Res. 1–10. doi: 10.1080/03772063.2019.1622461
Just, M. A., and Carpenter, P. A. (1980). A theory of reading: from eye fixations to comprehension. Psychol. Rev. 87:329. doi: 10.1037/0033-295x.87.4.329
Kuhn, M. (2008). Building predictive models in R using the caret package. J. Stat. Softw. 28, 1–26. doi: 10.18637/jss.v028.i05
Landerl, K., Ramus, F., Moll, K., Lyytinen, H., Leppänen, P. H., Lohvansuu, K., et al. (2013). Predictors of developmental dyslexia in European orthographies with varying complexity. J. Child Psychol. Psychiatry Allied Discip. 54, 686–694.
Long, L., MacBlain, S., and MacBlain, M. (2007). Supporting students with dyslexia at the secondary level: an emotional model of literacy. J. Adolescent Adult Liter. 51, 124–134. doi: 10.1598/jaal.51.2.4
Margari, L., Buttiglione, M., and Craig, F. (2013). Neuropsychopathological comorbidities in learning disorders. BMC Neurol. 13:198. doi: 10.1186/1471-2377-13-198
McConkie, G. W., and Rayner, K. (1975). The span of the effective stimulus during a fixation in reading. Percept. Psychophys. 17, 578–586. doi: 10.3758/bf03203972
McConkie, G. W., and Rayner, K. (1976). Asymmetry of the perceptual span in reading. Bull. Psychonomic Soc. 8, 365–368. doi: 10.3758/bf03335168
Nilsson, M. (2013). “Predicting Reading Disability from Eye Movements,” in Proceeding of the Book of Abstracts of the 17th European Conference on Eye Movements, 11-16 August 2013, eds K. Holmqvist, F. Mulvey, and R. Johansson (Lund: Journal of Eye Movements Research), 65.
Pavlidis, G. T. (1981). Do eye movements hold the key to dyslexia? Neuropsychologia 19, 57–64. doi: 10.1016/0028-3932(81)90044-0
Pavlidis, G. T. (1985). Eye movement differences between dyslexics, normal and slow readers while sequentially fixating digits. Am. J. Optom. Physiol. Optics 62, 820–822. doi: 10.1097/00006324-198512000-00003
Prabha, A. J., and Bhargavi, R. (2020). Predictive model for dyslexia from fixations and saccadic eye movement events. Comput. Methods Programs Biomed. 195:105538. doi: 10.1016/j.cmpb.2020.105538
R Core Team (2020). R: A Language and Environment for Statistical Computing. R Foundation for Statistical Computing. Vienna: R Core Team.
Rayner, K. (1998). Eye movements in reading and information processing: 20 years of research. Psychol. Bull. 124, 372–422. doi: 10.1037/0033-2909.124.3.372
Rayner, K. (2009). Eye movements and attention in reading, scene perception, and visual search. Q. J. Exp. Psychol. 62, 1457–1506. doi: 10.1080/17470210902816461
Rayner, K., and Bertera, J. H. (1979). Reading without a fovea. Science 206, 468–469. doi: 10.1126/science.504987
Rayner, K., Pollatsek, A., Ashby, J., and Clifton, C. Jr. (2012). Psychology of Reading. New York, NY: Psychology Press.
Rello, L., and Ballesteros, M. (2015). “Detecting readers with dyslexia using machine learning with eye tracking measures,” in Proceedings of the 12th International Web for All Conference (W4A ’15), Vol. 16 (New York, NY: Association for Computing Machinery), 1–8. doi: 10.1145/2745555.2746644
Riddick, B. (2009). Living with Dyslexia: The Social and Emotional Consequences of Specific Learning Difficulties/Disabilities. Abingdon: Routledge.
Rizwana, A. (2019). “Eye Tracking as a Tool for Diagnosing Specific Learning Disabilities,” in Emerging Trends in the Diagnosis and Intervention of Neurodevelopmental Disorders, eds S. Venkatesan, R. Kumar, S. P. Goswami, and S. K. Gupta (Pennsylvania, PA: IGI Global), 153–170. doi: 10.4018/978-1-5225-7004-2.ch008
Shaywitz, B. A., Shaywitz, S. E., Blachman, B. A., Pugh, K. R., Fulbright, R. K., Skudlarski, P., et al. (2004). Development of left occipitotemporal systems for skilled reading in children after a phonologically-based intervention. Biol. Psychiatry 55, 926–933. doi: 10.1016/j.biopsych.2003.12.019
Shaywitz, S. E., Escobar, M. D., Shaywitz, B. A., Fletcher, J. M., and Makugh, R. (1992). Evidence that dyslexia may represent the lower tail of a normal distribution of reading ability. New England J. Med. 326, 145–150. doi: 10.1056/nejm199201163260301
Shaywitz, S. E., and Shaywitz, B. A. (2005). Dyslexia (specific reading disability). Biol. Psychiatry 57, 1301–1309. doi: 10.1016/j.biopsych.2005.01.043
Snowling, M. J. (2013). Early identification and interventions for dyslexia: a contemporary view. J. Res. Special Educ. Needs 13, 7–14. doi: 10.1111/j.1471-3802.2012.01262.x
Snowling, M. J. (2014). Dyslexia: a language learning impairment. J. Br. Acad. 2, 3–58. doi: 10.5871/jba/002.043
Torgesen, J. K., Wagner, R. K., Rashotte, C. A., Burgess, S., and Hecht, S. (1997). Contributions of phonological awareness and rapid automatic naming ability to the growth of word-reading skills in second-to-fifth-grade children. Sci. Stud. Read. 1, 161–185. doi: 10.1207/s1532799xssr0102_4
Tseng, P., Cameron, I. G. M., Pari, G., Reynolds, J. N., Munoz, D. P., and Itti, L. (2013). High-throughput classification of clinical populations from natural viewing eye movements. J. Neurol. 260, 275–284. doi: 10.1007/s00415-012-6631-2
Vaughn, S., Cirino, P. T., Wanzek, J., Wexler, J., Fletcher, J. M., Denton, C. D., et al. (2010). Response to intervention for middle school students with reading difficulties: effects of a primary and secondary intervention. School Psychol. Rev. 39, 3–21. doi: 10.1080/02796015.2010.12087786
Vellutino, F. R., Scanlon, D. M., Sipay, E. R., Small, S. G., Pratt, A., Chen, R., et al. (1996). Cognitive profiles of difficult-to-remediate and readily remediated poor readers: early intervention as a vehicle for distinguishing between cognitive and experiential deficits as basic causes of specific reading disability. J. Educ. Psychol. 88, 601–638. doi: 10.1037/0022-0663.88.4.601
Wagner, R. K., Torgensen, J. K., Rashotte, C. A., and Pearson, N. A. (2013). Comprehensive Test of Phonological Processing 2nd ed, CTOPP-2, 2nd End Edn. San Antonio: Pearson Pro-Ed USA.
Wechsler, D. (2003). Wechsler Intelligence Scale for Children – Fourth Edition, Technical and Interpretive Manual. London: Hartcourt Assessment.
Wechsler, D., Fein, D., Kramer, J., Morris, R., Delis, D., and Maerlender, A. (2004). Wechsler Intelligence scale for Children – Fourth Edition, Integrated. San Antonio: Pearson.
Willcutt, E. G., Pennington, B. F., Duncan, L., Smith, S. D., Keenan, J. M., Wadsworth, S., et al. (2010). Understanding the complex etiologies of developmental disorders: behavioral and molecular genetic approaches. J. Dev. Behav. Pediatr. 31, 533–544. doi: 10.1097/dbp.0b013e3181ef42a1
Wolf, M., Bally, H., and Morris, R. (1986). Automaticity, retrieval processes, and reading: a longitudinal study in average and impaired readers. Child Dev. 57, 988–1000. doi: 10.2307/1130373
Keywords: reading difficulties, dyslexia, screening, eye tracking, eye movements, neuropsychological assessment, cognitive assessment, machine learning
Citation: Gran Ekstrand AC, Nilsson Benfatto M and Öqvist Seimyr G (2021) Screening for Reading Difficulties: Comparing Eye Tracking Outcomes to Neuropsychological Assessments. Front. Educ. 6:643232. doi: 10.3389/feduc.2021.643232
Received: 17 December 2020; Accepted: 04 March 2021;
Published: 30 March 2021.
Edited by:
Gregor Ross Maxwell, Arctic University of Norway, NorwayReviewed by:
Roald Øien, UiT The Arctic University of Norway, NorwayIngalill Gimbler Berglund, Jönköping University, Sweden
Copyright © 2021 Gran Ekstrand, Nilsson Benfatto and Öqvist Seimyr. This is an open-access article distributed under the terms of the Creative Commons Attribution License (CC BY). The use, distribution or reproduction in other forums is permitted, provided the original author(s) and the copyright owner(s) are credited and that the original publication in this journal is cited, in accordance with accepted academic practice. No use, distribution or reproduction is permitted which does not comply with these terms.
*Correspondence: Mattias Nilsson Benfatto, mattias.nilsson@ki.se
†These authors have contributed equally to this work and share first authorship