Measuring the effects of course modularizations in online courses for life-long learners
 Sebastian Serth
 Thomas Staubitz
 Martin van Elten
 Christoph Meinel
- Internet Technologies and Systems Group, Hasso Plattner Institute, University of Potsdam, Potsdam, Germany
Many participants in Massive Open Online Courses are full-time employees seeking greater flexibility in their time commitment and the available learning paths. We recently addressed these requirements by splitting up our 6-week courses into three 2-week modules followed by a separate exam. Modularizing courses offers many advantages: Shorter modules are more sustainable and can be combined, reused, and incorporated into learning paths more easily. Time flexibility for learners is also improved as exams can now be offered multiple times per year, while the learning content is available independently. In this article, we answer the question of which impact this modularization has on key learning metrics, such as course completion rates, learning success, and no-show rates. Furthermore, we investigate the influence of longer breaks between modules on these metrics. According to our analysis, course modules facilitate more selective learning behaviors that encourage learners to focus on topics they are the most interested in. At the same time, participation in overarching exams across all modules seems to be less appealing compared to an integrated exam of a 6-week course. While breaks between the modules increase the distinctive appearance of individual modules, a break before the final exam further reduces initial interest in the exams. We further reveal that participation in self-paced courses as a preparation for the final exam is unlikely to attract new learners to the course offerings, even though learners' performance is comparable to instructor-paced courses. The results of our long-term study on course modularization provide a solid foundation for future research and enable educators to make informed decisions about the design of their courses.
1. Introduction
More than a decade ago, in 2008, Stephen Downes and George Siemens offered the course Connectivism and Connective Knowledge at the University of Manitoba (McGill Association of University Teachers, 2015). In response to that course, Dave Cormier coined the term MOOC for Massive Open Online Courses (Digital Pedagogy Lab, 2022). Hundreds of learners from various backgrounds all over the world joined the regularly enrolled students in a new learning experience (Smith and Eng, 2013). A few years later, American researchers and educators modified this concept and turned it into a mass phenomenon. Since 2012, MOOCs have evolved into an inherent part of the educational landscape. Although many of the initial goals of this movement, such as democratizing or revolutionizing education or closing the digital gap in hindsight have to be considered as failed, the huge popularity among participants shows that the format itself is very successful. Class Central's 2021 MOOC report lists over 220 million users, 3,100 courses, 500 micro-credentials (Shah, 2021). These numbers are even more impressive as Class Central has decided to exclude China from their analysis for various reasons (Shah, 2021).
Since 2012, we are offering MOOCs on our own platform openHPI1. Our regular courses have a length of 6 weeks, plus an additional week for a final exam. These courses are always offered in a semi-synchronous fashion. The courses have a dedicated start and end date and the course materials are published weekly. Once the materials are published, they can be accessed at any time. Assignments, however, have dedicated deadlines. Therefore, the learning materials have to be consumed within a week after they are published, to successfully participate in the weekly assignments. Due to the deadlines, participants can only earn a certificate during the official run-time of a course. For some participants, this lacks flexibility.
One approach to bypass this limitation is to modularize the courses into a series of course modules. We have split up the original 6-week course into three separate 2-week modules, plus a separate final exam. (Partial) Certificates can be earned for each of the modules by passing the modules' weekly assignment. This still requires semi-synchronicity. As the overall exam has been separated from the content, however, we can offer this exam several times a year and thus significantly increase the flexibility for the participants.
Furthermore, modularizing the courses allows participants to choose the content they are really interested in more flexibly. It is much easier to create learning paths without duplicate content by combining multiple modules. Additionally, our research indicates that the barrier to participate in a course is lowered; particularly for lifelong learners, it is more feasible to commit to a 2-week course than to a 6-week course. For us as a content provider, this modularization also improves the sustainability by allowing us to reuse well-received content more easily and simplify processes for expanding it with new modules.
For the remainder of this article, we will use the term monolith for a 6-week course and module series for a course that has been split into three 2-week course modules and a separate exam.
In the article at hand, we aim to answer the following research questions:
RQ 1: Has this modularization had a negative effect on course enrollments or participation?
RQ 2: To what extent are breaks between modules influencing dropout rates and learning outcomes?
RQ 3: Which differences can we observe in selective learning behavior between the course offerings?
2. Context
The key course statistics of the openHPI platform provide the basic data for our analysis. Our research interest is to determine the differences between monoliths and module series. We, therefore, removed all courses that have not been offered in both formats. Two course topics remained. The fundamentals of web technologies (abbreviated as WWW) and internet security (abbreviated as ISec): Both courses have been offered multiple times as monoliths and as module series with and without breaks between modules and exams.
Figure 1 shows the different formats of the examined courses. ISec 2014, ISec 2016, ISec 2018, and ISec 2020, as well as WWW 2015 and WWW 2017, are monoliths with 6 weekly assignments and an integrated final exam. ISec 2019, ISec 2021, ISec 2022, and WWW 2021 are module series with a separate exam.
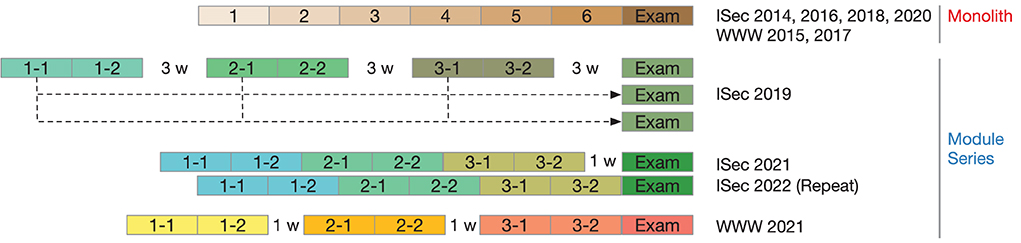
Figure 1. Comparison of the structure of the different course types: monoliths vs. module series and a separated exam. Color-coded are the different courses with an annotation of the length of breaks between modules.
All investigated courses on our platform follow a similar design with the learning content grouped into 2 or 6 weeks (for module series or monoliths, respectively). Each week consists of multiple short video units with subsequent ungraded self-tests. These self-tests are multiple-choice quizzes, can be repeated an unlimited number of times, and serve as a preparation for the graded homework assignment. Additionally, courses can contain hands-on exercises, peer-assessed projects to be solved either alone or in teams, or interactive exercises. At the end of each week, learners may participate exactly once in a time-limited homework assignment.
Monoliths close with an additional final exam consisting of multiple-choice questions covering topics from all learning units. Therefore, monoliths contain a total of seven graded assignments (6 weekly homework assignments and one final exam). Upon achieving at least half of all points in the seven assignments, learners will receive a graded certificate. In the modules of the module series, each week still contains a graded homework assignment. However, none of the modules includes any overarching final exam. This exam is offered separately to be taken within a 3–4 week schedule (the so-called exam period) for enhanced flexibility. It still covers topics from all three underlying modules, but certification is based solely on the performance in the final exam. Participation in the exam is voluntary, but the completion of all three underlying modules with at least a Confirmation of Participation (CoP)2 is mandatory.
For some of the module series, the final exam was offered multiple times. The intention was to offer more learners the opportunity to participate and successfully complete a module series. Additionally, those repeated iterations allowed us to test various breaks of different lengths: We offered module series with equal breaks (no break or a 3-week break) between the modules and before the final exam, just a break prior to the exam or only breaks between the individual modules. Those differences and the length of the breaks are also shown in Figure 1.
Furthermore, an additional distinction can be made for the module series: The decoupling of the learning content (provided in the modules) and the examination allowed for a more fine-granular repetition of the offerings. For example, the module series ISec 2019 was only offered once with the support from a teaching team. Later on, only the final exam was re-offered3 consisting of a one-month exam period for those learners finishing the course modules themselves. Usually, a teaching team provides active support for the participants in the discussion forum during the original course period. This support is not available outside of the course period or for other modules in self-paced mode (such as the standalone exams). Learners in this case cannot post new questions or replies, but still, browse the discussion forum with all previous conversations.
3. Related work
Our work is based on previous research in the context of completion rates in MOOCs, the impact of course reruns and differences in self-paced courses as well as course dropouts and individual learning paths. An excerpt of related research is presented in the following paragraphs.
3.1. Completion rates and dropouts in MOOCs
Our research design with modularized courses continues a previous analysis comparing the retention and completion rates in two similar MOOC versions (Padilla Rodriguez et al., 2020). In their course design, Padilla Rodriguez et al. (2020) prepared a monolith 6-week course (with 323 learners) and two 3-week modules (with 294 learners overall). Their study reveals several interesting findings: Even though they attracted a similar number of learners for both variants, only 134 learners enrolled for both 3-week courses of the modularized variant (less than half of all learners). However, the authors identified that 110 out of those 134 learners (82.09%) were actively engaged with the course content or in discussions, much more than those learners enrolling in either of the two modules or the 6-week variant. Furthermore, the completion rates drastically differed between the monolith with 15.6% and their modularized variant with 61.8%. Therefore, Padilla Rodriguez et al. (2020) highlight previous recommendations of shorter, modularized courses (Engle et al., 2015; Jordan, 2015a). Jordan identified a negative correlation between course length and completion rate (Jordan, 2015a). She highlights that the modularization of MOOCs has been suggested previously (Bol cited in Harvard Magazine Online, 2013; Challen and Seltzer, 2014), but notes that further research is required to identify the effects of course modules (Jordan, 2015a). In another study with 122 MITx courses offered between 2012 and 2016, no direct correlation between the completion rate and the course length but rather the modules was reported, as well as a negative correlation between the number of modules in a course and the certification rate (Celik et al., 2020). Shorter course modules are also expected to introduce enhanced flexibility for learners as well as for instructors (Bol cited in Harvard Magazine Online, 2013). While Bol imagines learners customizing their university degrees with modular learning units, he also considers the reduced effort required by instructors to create those modules. In contrast, Challen and Seltzer (2014) express one main criticism toward MOOCs stating that “today's MOOCs are not modular” but whole courses offered in a package as one, non-separable unit. Therefore, the authors argue that it is rather hard to employ them as teaching material within regular university courses. (Padilla Rodriguez et al., 2020), therefore, encourage MOOC instructors to “move away from the standard length of 6–10 weeks (Hollands and Tirthali, 2014)”. Besides the completion rate, their research further indicates that the retention increases with shorter course modules.
Daniel (2016) suggests that students perform best in courses with a length of between 5 and 6 weeks, although there are other, shorter courses rewarding a certificate upon completion. Barr (2014), who analyzed one of the first Bioelectricity MOOCs in 2012 (with a length of 9 weeks), concluded that shorter modules with 3–6 weeks might be suitable. Last but not least, Andone et al. (2015) even imagined so-called “Mini-MOOCs” as 2-week courses. These Mini-MOOCs, or modular MOOCs, include many advantages according to previous research: For example, they can be tested and improved separately or updated by instructors to match the learners' anticipated needs (Challen and Seltzer, 2014). They can also be seen as a response to current trends in education with the implementation of shorter (online) courses, a new curricula design and new teaching methods (Andone et al., 2015).
On openHPI, most previous courses were four to 6 weeks long. A previous analysis conducted by Willems et al. (2014) examined the completion rates and the participant behavior in various MOOCs on openHPI in 2012 and 2013. Their results show that most of the so-called dropouts quit the course after the first week. From then on, course participation in most of the MOOCs only slightly decreases toward the end of the course. Sometimes, even a slight increase in the final course week can be observed (Willems et al., 2014). Considering the courses on openHPI, we usually have completion rates ranging between 20 and 45% (Hagedorn et al., 2017), which can be considered above average based on the data published by Jordan (2015b). With these numbers, we especially have another base line than Padilla Rodriguez et al. (2020) that identified an average completion rate of 15.6% for 6-week courses.
That said, another aspect should be considered: the usage of the term “dropout”—and thereby the definition of completion rates—has been discussed controversially and it was suggested that any participant that was able to learn something should not be considered a course dropout (Liyanagunawardena et al., 2014). Other researchers further state that the dropout rate itself (if used at all) should not be seen as the single indicator to rate the success of a MOOC (Maya-Jariego et al., 2020). The authors also acknowledge in their work that learners enroll for various reasons and some intend to access only the most interesting parts for them. In particular, those learners do not necessarily want to gain a certificate but rather “experiment with online interaction, seek entertainment, and try to meet a personal challenge or simply enjoy learning” (Maya-Jariego et al., 2020). Therefore, in this article, we also differentiate the reasons for learners not continuing a course (considering their initial motivation for enrolling) and present our definition of course dropouts, no-shows, and selective learners in Section 4.1. Avello et al. (2020) also avoid using the term “dropouts” for those learners who do not complete a course. Rather, they use the terminology introduced by HarvardX and MITx identifying some (selective) learners as “explorers” (Ho et al., 2015).
3.2. Individual learning paths and micro-learning
In an interview with Harvard Magazine, Bol even posits that very few registrations come from learners who want to earn a certificate or complete an entire online course (Harvard Magazine Online, 2013). Based on this assumption, he even formulates the question of whether instructors should invest in producing full courses or rather shorter modules that can be browsed independently by learners (Bol cited in Harvard Magazine Online, 2013). With the broad availability of many (free) online courses, Wang et al. (2018) already see “more selective learning opportunities” for learners allowing them to choose topics of their choice. Although the authors attribute learners an autonomous development of individual learning paths, Wang et al. (2018) further state that learners often experience a lack of time, motivation or do not have the prerequisites necessary to successfully participate in a course of their choice.
To meet the needs of learners and based on a study with 52 participants, El Said proposes to offer a catalog of standalone modules that can be completed separately and combined (or even integrated) with other courses (El Said, 2017). Optional links from other courses would serve as an enhanced encyclopedia and could allow learners to complete those modules with a separate certificate. This way, the author imagines a higher MOOC completion rate as learners might only register for those modules they wish to complete (El Said, 2017). Those smaller modules can also be seen as a prerequisite for a personalized curriculum that would fit the individual learning needs, especially as a fixed learning path is unlikely to be suited for all learners (Chen, 2008; Sun et al., 2018). However, the author also mentions that MOOCs are still too big for micro-learning units (rather than single video items) to be suited for a customized micro-learning experience (Sun et al., 2018). In the absence of other modules, Zheng et al. (2015) observed that learners often use MOOCs as modularized resources. Rather than participating in the complete course, they pick those parts of the course that are most relevant to them (Zheng et al., 2015). Eriksson et al. (2017) also observed this usage pattern and concluded that “[...] more flexibility regarding time constraints could help learners to overcome external factors”.
3.3. Impact of reruns, exams, and self-paced courses
Teusner et al. (2015) examined the differences in course participation and completion rates in several iterations of the same MOOC on openHPI. The iterations of the examined MOOC were provided yearly to the registered users on the platform from 2012 to 2014. Except for some minor adjustments in the content, the MOOCs were identical. The completion rates were on a similar level and support our previous results (Teusner et al., 2015). While the teaching content mostly stayed the same, a few adjustments and changes were made to the graded quizzes (Teusner et al., 2015). Manallack and Yuriev (2016) created ten rules for creating a MOOC. There, they express the expectation that a well-received course should be repeated periodically (Manallack and Yuriev, 2016). To prevent cheating by learners, exam questions in graded exams should be modified for a new iteration.
Those courses analyzed by Teusner et al. offered new course content weekly and learners were supported in the forum by a teaching team (similar to our course design as described in Section 2). The category of those courses is also referred to as instructor-paced, in opposite to self-paced courses without fixed deadlines and reduced or no support from a teaching team. Some sources indicate that learners might learn more time-efficiently in those self-paced courses and achieve slightly higher scores in quizzes (Rohloff et al., 2020). Other sources doubt the impact of the self-paced mode on learning behavior and instead point to more diverse motivations for learners to start learning (Watson et al., 2018). Furthermore, Avello et al. (2020) pointed out that learner engagement in self-paced courses is not higher than in instructor-paced courses despite the enhanced flexibility. Neither have they observed a higher chance of learners accessing more of the course content—although the course material was fully available from the start—nor have they observed higher completion rates (Avello et al., 2020).
4. Evaluation
As outlined in Section 2, our evaluation is based on a total of 10 monoliths and module series. Before outlining key course metrics, we describe the methodology and the approach we use for our analysis in detail. Furthermore, we will discuss and classify our results in Section 4.3.
4.1. Methodology
Answering our research questions (see Section 2) requires an analysis of enrollment numbers and course participation (RQ 1 and RQ 2), engagement with the final exam (RQ 2) as well as overall differences between the monoliths and module series (RQ 3). Therefore, in the following paragraphs, we introduce our approach to the analysis, the data we analyze, and the specifics to consider.
4.1.1. Investigated course metrics
To compare the monoliths with the module series, we mainly focus on course enrollments and participation in the assignments as required for a graded certificate. Other metrics, such as videos watched or self-tests taken, are not considered for certification and therefore not further investigated. For the course enrollments, we consider all learners who signed up for a specific course before the submission deadline of the final exam (either within a monolith itself or the separated exam for module series). For the participation in assignments, we considered all learners who submitted any response to the respective assignment. Further, we identified the overall performance for assignments as the number of learners scoring at least half of the available points. New submissions are only possible before the deadline of an assignment, so these numbers only include active learners who participated during the official course period.
For better comparability of user behavior and enrollments in both course types, we first align the structure of the activity data. In a first step, we formed three groups of 2 weeks each and separated the final exam of monoliths for our analysis. Thereby, the monoliths are better comparable to the module series with the separated exam. In a second step, we removed all learners not being active in the respective group, which means learners who did not visit at least 50 % of the content of the respective course weeks. We assume that those learners (for whatever reason) did not actively engage with the provided learning content. The result of this analysis is shown in Section 4.2., where we present the combined data of all analyzed courses separated by course type in one Venn diagram each. The chosen visualization allows us to illustrate all combinations of learners actively engaging with any of the four groups (the first, second, third module, or the final exam).
In this context, the visualization in the Venn diagrams also has an advantage regarding the identification of learner navigation patterns, as dropouts and selective learners become easily identifiable. Many online courses suffer from declining participation over the course period (Goopio and Cheung, 2021). This problem begins way before the course period, as learners enroll beforehand and then do not begin learning. Traditionally, those learners that enroll for a course, never visit any learning unit and do not achieve any score in the assignments are considered as “no-shows” (Mustafaraj, 2014). Among the learners that started but did not complete an entire course or module series with a graded certificate, we distinguish two additional groups next to no-shows: course dropouts, as well as selective learners. For this article, we define no-shows as learners that enroll for a course offering before the start but never access the course later. We further see dropouts are users who opt out during the monolith or module series during the course runtime as defined in Section 3.1, while selective learners only take parts of a course or series of modules that interest them.
4.1.2. Participation in the weekly assignments and final exams
While the overall enrollment numbers in the courses provide an overview of those learners reached with the course offerings, an analysis of the participation numbers in the assignments allows more detailed insights into the learners' activities. To compare the courses with each other, we set the number of no-shows in relation to the number of enrollments. Thereby, we focus on all learners that engaged with any of the weekly homework or the final exam, including completers with a graded certificate, explorers with a confirmation of participation, course dropouts, and selective learners.
As we use participation in the weekly homework assignments and exams as a proxy for engagement with the weekly-provided content, we refrained from analyzing participation in the discussion forum, or evaluating learners' unique learning paths, or the progress on individual learning items. However, on a weekly scale, we also investigated the differences of breaks between the modules and the final exam.
4.1.3. Breaks between modules and exams
In our study design with modularized courses, we carefully considered various combinations of breaks between course modules and the overarching final exam. For this analysis, we distinguish between two types of breaks: First, a break might be planned between two course modules with new learning content or, second, between the last course module and the final exam. In any new module series, we have slightly adjusted the number and duration of breaks. Thereby, we want to answer our second research question and investigate how breaks between course modules and before the exam affect learning success, in particular, whether course breaks have a positive or negative impact on completion rates.
For each exam offered for the module series, we mainly focus on three key metrics. As an indicator of the overall interest of learners, we consider the enrollment numbers for the exam to provide a considerably good measurement. Together with the initial publication of the module series, we also published the exam as a separate offering and invited users to enroll at any time. Thereby, users could choose to enroll for the module(s) of their choice or participate in the full module series with the final exam. While enrolling for an exam always was unrestricted and available to everyone, access to the exam was only granted those learners who participated in all three underlying course modules. This prerequisite was communicated clearly and learners' eligibility to participate in the exam was shown individually on the platform.
As a second measurement, we collected the no-show rate of the exams offered. According to our previous definition of no-shows (see Section 4.1.1), we consider no-shows to be learners that enrolled for the exam but did not access it. This could either be learners who lost interest in the exam or who did not meet the prerequisite of participating in all three course modules (e.g., because they were only interested in a single module). Third, we analyze participation in the exam and differences between successful and unsuccessful participation following our certification guidelines. Learners achieving at least 50% of all possible points are awarded a graded certificate and are also considered to successfully pass the exam. Based on these metrics, the overall interest of learners (as measured with the enrollment numbers), the no-show rate, and participation in the exams, we aim to identify differences based on the length and availability of breaks within the module series in terms of impact on the overarching final exams.
4.2. Results
We analyzed a total of six monoliths and four module series with more than 50,000 actively enrolled learners. Before presenting the results of the individual courses and participation in the exams, we first provide an overview of the courses in general and their differences.
4.2.1. Participation in monoliths and module series
A comparison of the monoliths and the module series yielded slightly varying patterns of learner engagement. As described in Section 4.1, we formed 2-week groups for the analysis, so that a monolith is divided into three groups (each consisting of 2 weeks) and a final exam. Figure 2 shows the participation in each of these groups and the final exam for all monoliths analyzed in this article. Each group is annotated with the total number of active learners, i.e., those who accessed at least 50% of the available course content in the respective weeks. The overlaps of the various groups in the diagram show the overall engagement of all active learners. For example, 10% of all learners participated in the first 4 weeks (group Week 1 & Week 2 and group Week 3 & Week 4) but neither in Week 5 & Week 6 nor the Exam. With about 64% of all learners, most active users fully participate in a course and also the exam offered.
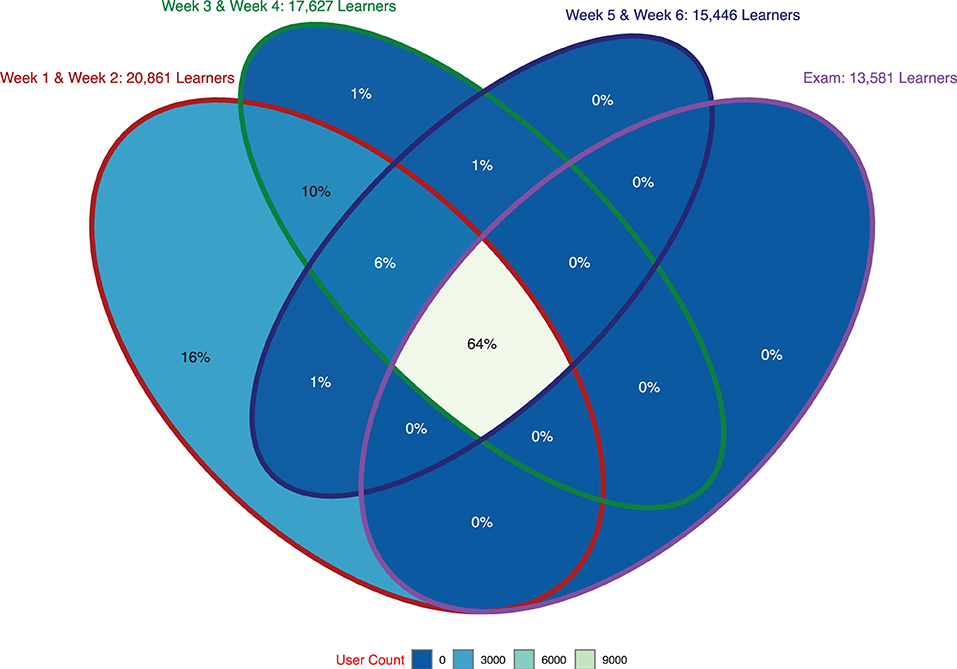
Figure 2. Active participation in the monoliths (i.e., ISec 2014, ISec 2016, ISec 2018, ISec 2020, WWW 2015, and WWW 2017). The Venn diagram visualizes how many users participated in any given combination of course weeks or the final exam, respectively.
Besides the aggregated diagram covering all six monoliths (as shown in Figure 2), we also analyzed each course individually. The ISec courses range between 68 and 75% (median: 74%) of learners accessing course materials from all weeks, where the WWW courses have 50% (WWW 2015) and 65% (WWW 2017), respectively.
Similarly, Figure 3 depicts the participation in the three modules and the separated final exam that together form a module series. Again, each module shows the number of learners (with their enrollments) actively participating in any of the first course modules. Therefore, the overlaps indicate how many learners enrolled and participated in more than a single module. According to our analysis, however, about 33% of learners participated and enrolled only in the first module of a module series. As shown in Figure 3, 14% of all learners participated in all three modules without the exam and another 15% additionally participated in the final exam (compared to 6 and 64% in the monoliths, see Figure 2).
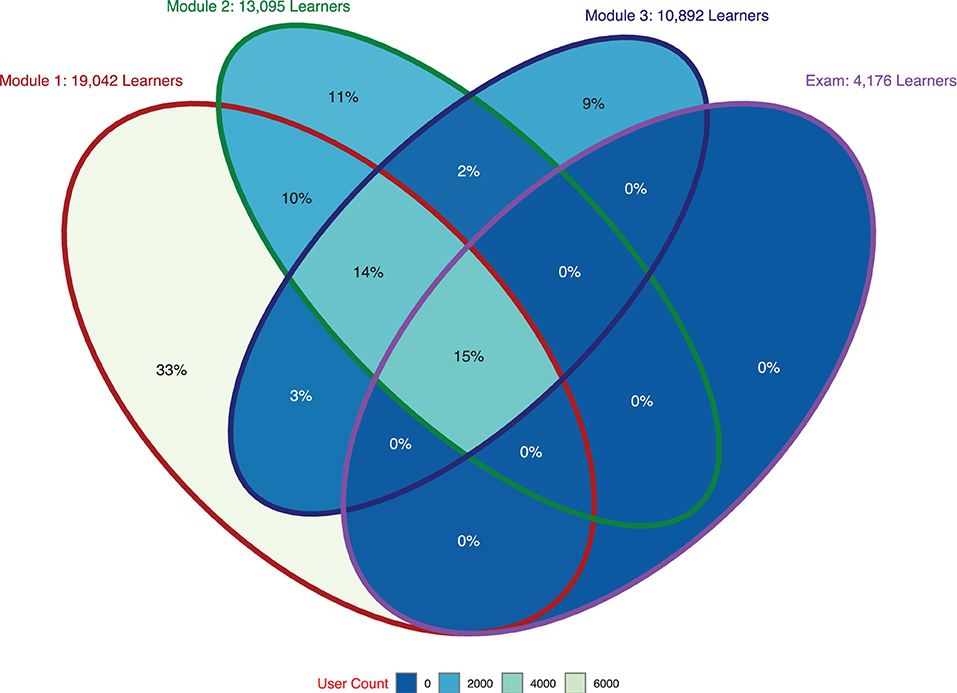
Figure 3. Active participation in the module series (i.e., ISec 2019, ISec 2021, ISec 2022, and WWW 2021). The Venn diagram visualizes how many users participated in any given combination of course modules or the final exam respectively.
Similar to monoliths, we also analyzed each module series individually first. This time, full participation in all three modules and the final exam ranged between 32 and 46% (median: 43%) for the ISec series and was at 36% for the WWW module series. In this respect, the course modules have a lower participation than their monolith counterparts, even though the topics and their presentation styles are comparable. We further noticed that the ISec courses usually attract more learners to finish the learning than the WWW courses.
4.2.2. Weekly and overall enrollments in the module series
While the Venn diagrams show clear differences in the participation of learners in a monolith or the complete module series, the analysis of the no-show rates for the learning content does not show any significant difference (Welch Two Sample t-test t = −1.16, p = 0.14) between monoliths (mean 26.7%, σ = 0.04) and module series (mean 23.4%, σ = 0.06). However, the participation in exams is overall relatively low compared to the number of enrollments. Analyzing the no-show rate for the exams shows a statistically significant difference (Welch Two Sample t-test t = −3.40, p < 0.01) based on overall enrollment numbers for the corresponding monolith or module series: The exam embedded into monoliths had a mean no-show rate of 70.7% (σ = 0.11), the separated exam in module series a mean no-show rate of 86.7% (σ = 0.04). Considering only learners who actively enrolled for the separated final exam of a module series (and thus decided to undertake an examination for the overarching certificate) the mean no-show rate is reduced to 57.1%. As visualized in Figures 4–6, the no-show rate of those final exams ranges from 41.6% over 57.7 to 77.4% (regarding the first exam offered as part of ISec 2019 module series, ISec 2022, and the third exam of ISec 2019). The figures not only show the absolute number of enrollments for each of the final exams but also indicates how many learners participated in the exam (regardless of their score) and further visualizes the number of learners successfully passing the exams (and thus receiving a graded certificate). In addition, the Figures 4–6 show a timeline of the modules and respective enrollment numbers.
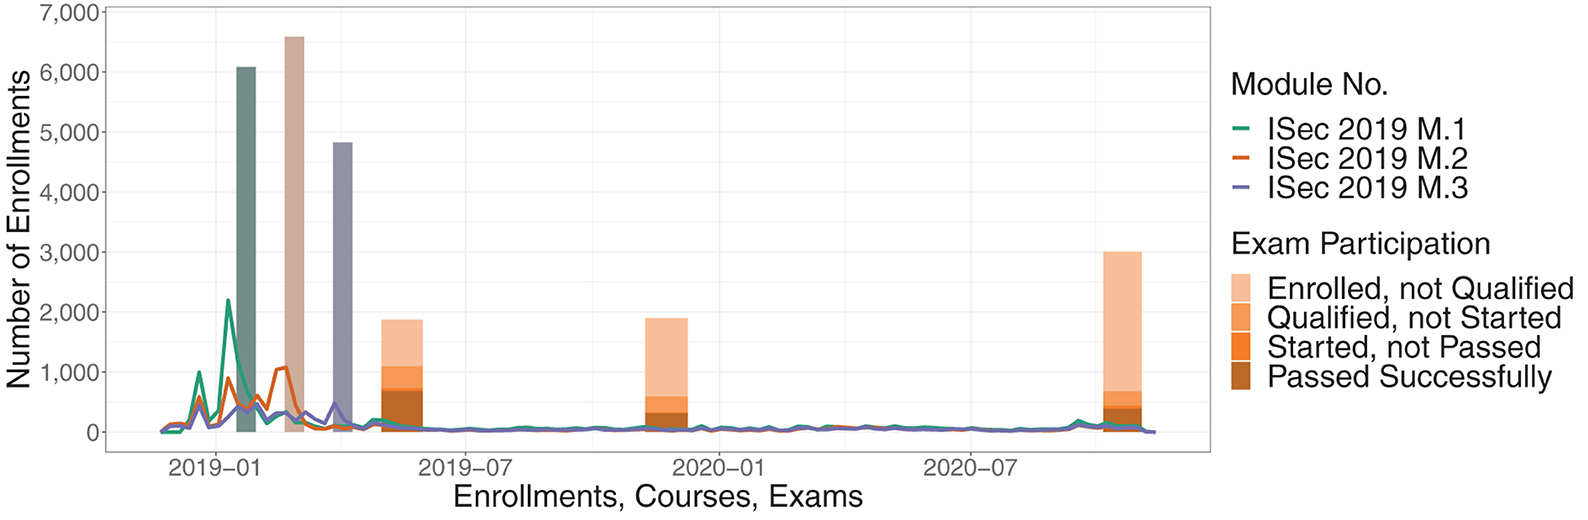
Figure 4. ISec 2019 with three exam opportunities and the required modules. The lines show the weekly enrollments. The first three bars show the original course periods and the total enrollments in each of the course modules. The orange bars show the three final exams including their period.
An analysis of the enrollment numbers for the ISec 2019 module series is shown in Figure 4. The graph depicts the weekly enrollment numbers for the three modules as line charts from the initial publication of each module until the end of the third exam. Furthermore, Figure 4 marks the course periods of each module series with the enrollment numbers at the end of the respective module in 2019. The line chart shows that most learners enrolled for the courses before or during the official course period. Specifically, the weekly enrollment numbers show the first peak shortly after the course publication in late 2018 and a second increase shortly before the respective course start. In addition to the course periods, Figure 4 includes the enrollment numbers for each exam period. Interestingly, we observe only a slight increase in weekly enrollments for the first and third exams but no similar effect for the second exam period. Overall, a total of nearly 2,000 learners have registered for the second exam in early 2020 and about 3,000 for the third exam in late 2020.
In 2021 and 2022, we offered a new iteration of the three ISec modules referred to as ISec 2021 and ISec 2022, respectively. Contrary to the second and third exam opportunity of ISec 2019, we also repeated the module series for the final exam in 2022. Figure 5 visualizes the weekly course enrollments, the course and exam periods as well as the total enrollments up to the course end or submission deadline of the exam. Similar to the first iteration of the ISec modules, we saw the first peak of new enrollments after course publication in late 2020 and 2021, respectively, and a second increase shortly before each course started.
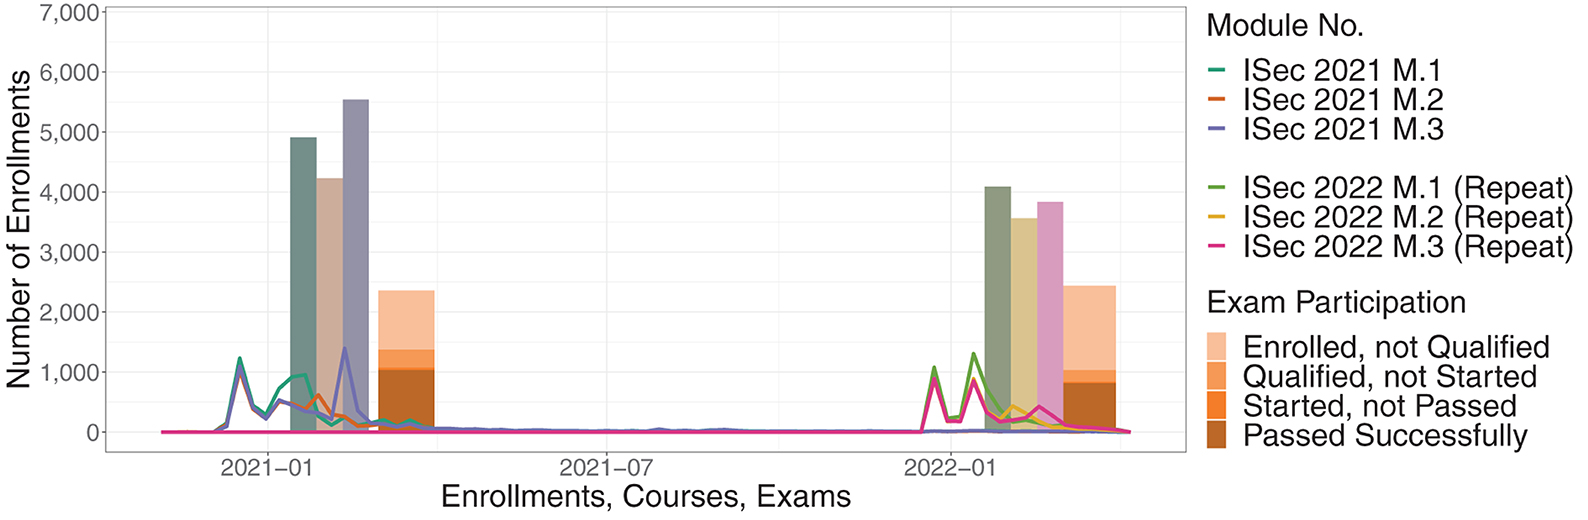
Figure 5. ISec 2021 and ISec 2022 with both exam opportunities and the required modules. The lines show the weekly enrollments. The first three bars show the original course periods and the total enrollments in each of the course modules. The orange bars show the final exams including their period.
The enrollment numbers for the WWW modules offered in 2021 show a slightly different pattern than the previous course modules. Figure 6 depicts that the module series was announced in early 2021 but did not attract many weekly enrollments until the first module started. While offering a break between the modules, we allowed learners to complete the module series by taking the final exam immediately after finishing with the learning content from the second week of the third module.
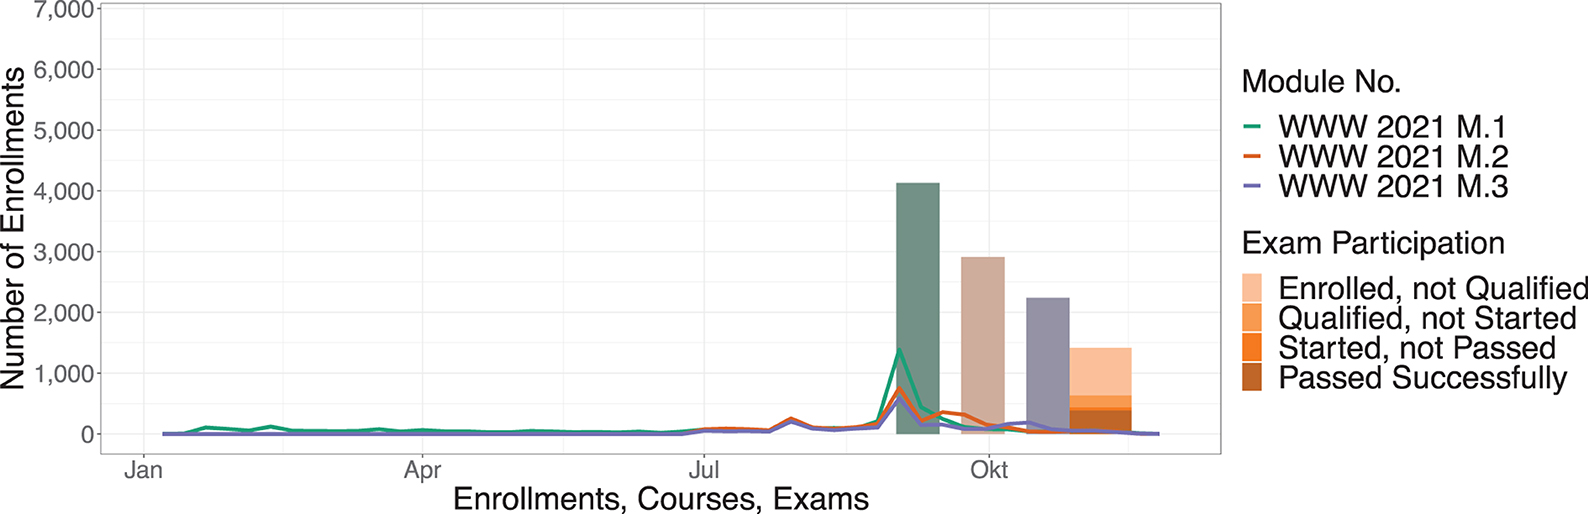
Figure 6. WWW 2021 with the exam opportunity and the required modules. The lines show the weekly enrollments. The first three bars show the original course periods and the total enrollments in each of the course modules. The orange bar show the final exam period.
4.2.3. Engagement with the assignments
Figure 7 shows the participation of all assignments in the investigated course offerings, annotated with the course type and course language. For monoliths, it visualizes decreasing engagement with the assignments during the course period. However, the module series with a final exam, reveal a different participation pattern. While the engagement with the assignments decreases within each of the three modules, we partially observe no further decrease or even an increase when a new module starts (such as for the ISec 2019 series). In the specific case of the ISec 2019 module series (among others), the relative participation in some homework assignments also raises above 100% (e.g., in week 3). This indicates that a latter course module attracted more learners than a previous one, so that more learners participated in the respective homework assignment in the given week compared to the first week (our reference point of 100%).

Figure 7. Development of the participation in course assignments over the course period in relation to the participation in the homework assignment of the first week.
For the visualization in Figure 7, we focused on differences between the monoliths and the module series and decided not to differ between the specific exam opportunity used by learners. For example, any learner taking the final exam of the ISec 2019 series is considered, regardless of whether they chose the first, second, or third exam repetition. Only ISec 2022 is shown separately (even though the modules were a rerun of the ISec 2021 modules) as the full module series was offered again with teaching team support.
4.2.4. Breaks between course modules and impact on exams
Regarding breaks between the modules, we do not see any major influence on course enrollments or course participation in our data. We only see some indicators that learners might enroll more selectively for modules when those have breaks in-between each other. For example, we observed that course registrations for the first module of the ISec 2019 series were higher than those registrations for the second or third module. In comparison, weekly enrollments for the individual modules of the ISec 2022 series were at a similar rate indicating learners enrolling for all modules at the same time.
For the final exam, however, we made slightly different observations regarding breaks: If the final exam was offered with a 1-week break from the previous module (as it was the case for the ISec 2021 series), relatively fewer learners participating in the modules registered for the exam. When allowing learners to take the exam without a break after the last module, the share of learners registering for the exam was higher (as seen for ISec 2022). More specifically, ISec 2021 had a mean of 4,912 learners per module, but only 2,361 enrollments for the exam (48.1%). While ISec 2022 featured the same content but no break before the final exam, the module series attracted a mean of 4,089 learners per module and 2,439 enrollments for the exam (59.6%).
At the same time of increasing initial interest in the exam without a break (measured with the number of enrollments), the no-show rate also increases from 41.9% for a 1-week break offered in ISec 2021 to 57.7% in ISec 2022. When longer breaks are present between the course modules and an opportunity to take the exam (e.g., with ISec 2019), overall participation in the exams decreases and the no-show rate increases. Our data indicates an increasing no-show rate for the first, second, and third exam opportunity of ISec 2019 with 41.6, 68.8, and 77.4%, respectively.
Besides the no-show rate, we also analyzed how many learners completed the exam successfully. The results of our analysis for the module series are also visualized in Figures 4–6 with different colors for the exam periods. In our data, we cannot see a similar change for the successful participation between repeated exam opportunities as with the no-show rate. For ISec 2019, 93.2% of all participants passed the first exam, 93.1% the second and 88.9% the third exam. Similarly, ISec 2021 and ISec 2022 share a similar success rate of 96.2 and 96.9%, respectively.
4.3. Discussion
When comparing the enrollment numbers of the various courses (see Figures 4–6), we identified that most learners enroll before or during the course period to participate in the course, take the weekly assignments and join the social interactions in the discussion forum. Only a few learners enroll in the course modules shortly before the exam period starts (e.g., 1 week before the first exam opportunity of ISec 2019, see Figure 4). These comparably low enrollment numbers also apply to new exam opportunities offered independently from the original course modules (such as the second or third exam opportunity of ISec 2019).
4.3.1. Repeated exam opportunities and course reruns
Thereby, we conclude that “just” offering the exam is not enough to attract many new learners to a module series. However, we still see about 2,000 enrollments for a second exam offered half a year after the first one and about 3,000 for a third exam offered after another year. Following the enrollment numbers of the three modules, we conclude that these repeated exam opportunities attracted two types of learners: Either, learners originally participating in the course modules (and thus being already enrolled for these modules), or some new learners enrolling in the course modules after the modules officially ended (to access the learning content in self-paced mode). Conclusively, these learners either wanted to learn at their own pace without participating in the first exam, were interested in a second attempt to achieve a better result, or heard about the module series at a later date. Our observation regarding the low participation rate in the second or third exam is also consistent with previous findings on the retention rate of knowledge acquired in MOOCs (Teusner et al., 2018). Consequently, learners would need to revisit many knowledge areas if they participated in the modules several months ago.
Since self-paced courses and the mere offering of exams turned out to be not enough to attract new learners for a module series (or a MOOC platform in general), we recommend also offering a rerun of the learning content. Within a rerun, learners are presented with new content on a weekly basis, can participate in forum discussions, and are supported by a teaching team in case of further questions. Thereby, the experience for learners in a rerun is comparable to the original version, however, the workload for teaching teams is greatly reduced. The impact of a rerun on exam participation can be observed with the differences in third exam of ISec 2019 and the ISec 2022 offering. In both cases, the previous opportunity to take the exam was about a year ago (with the second exam of ISec 2019 and the initial ISec 2021 module series). However, actual participation in the ISec 2022 exam was almost twice as high with 42.3% than in the third exam opportunity of ISec 2019 with 22.6%. We mostly attribute the increased participation and decreased no-show rate to the availability of the underlying course modules in instructor-paced mode.
4.3.2. Participation in assignments
Nevertheless, the participation in exams was relatively low in relation to the overall number of enrollments in the module series, as previously described in Section 4.2.2. The increased number of no-shows in the exams (compared to the modules) might be caused by a combination of an early publication date, no new learning material, and reduced social interaction during the examination. Yet, our analysis shows that these factors did not necessarily lead to higher failure rates in the exams. Similarly, the breaks do not seem to influence successful participation in an repeated opportunity of the final exam. Therefore, this result is in accordance with related work, indicating that self-paced learning of new content (that was required to participate successfully in the exam) does not necessarily lead to higher completion rates (Avello et al., 2020).
Compared to monoliths, participation in the separated exams of module series was significantly worse. As shown in Figures 2, 3, fewer learners initially enrolled and participated in the exams. Furthermore, the no-show rate also increased from 70.7% (monoliths) to 86.7% (module series) based on overall enrollment numbers for the entire course or module series. When comparing only active learners participating in the weekly homework assignments, we see similar results: In a monolith, most of the learners participating in the last homework assignments also take the final exam (see Figure 7). However, our data also suggests that fewer learners who participated in the third module also take the exam.
4.3.3. Selective learning behavior and course dropouts
We assume that the varying participation rates in the weekly and final exams are caused by multiple reasons. Therefore, we differentiate between no-shows, course dropouts, and selective learners (as introduced in Section 4.1.2) Identifying multiple heterogeneous groups within the learner community is in line with previous research, such as Rohloff et al. (2019), on individual learning objectives. Grouping the learning material into multiple learning goals is one way proposed in the literature, separating longer 6-week courses into multiple shorter modules could be another approach.
The applicability of this approach is emphasized by the learners' adoption of the course modules: For example, we observed in Figure 7 higher participation in some of the second or third modules of a module series than in the first module. This is unique to the module series and without a counterpart in the monoliths we analyzed. Thus, based on our analysis, we conclude the applicability of modularized courses as one further approach to meet the flexibility demands raised by learners on our platform. According to our analysis, modularizing course offerings does not have a negative effect on completion rates within a module but rather supports more selective learning behavior. We further see that the share of learners participating in all modules of a module series (and the final exam) is much lower compared to the monoliths (see Figures 2, 3).
4.3.4. Influence of breaks in a module series
While modularizing courses with a separated exam generally worked and did not yield reduced completion rates in the modules, we also investigated the impact of breaks between the modules. Our analysis revealed that breaks affected the learners' behavior of enrolling for the module series: With almost no break or a 1-week break between the modules, many learners immediately enrolled for all three modules. In case of the 3-week break between the modules of the first ISec 2019 module series, more learners selectively enrolled only for a single module at a time. While the observed effect might be influenced by an enhanced communication of the course design or recurring learners getting used to the smaller course modules being offered, the differences might also be related to a more distinctive appearance of the individual modules caused by the breaks.
However, when considering the drop in participation between the six homework assignment and the final exam in ISec 2021 and ISec 2022, a break before the exam (in case of ISec 2021) might prevent some learners from waiting another week for their participation. As seen in Figure 7, the presence of a 1-week break causes less learners previously participating in the third module to take the exam. We observed a similar effect when comparing the enrollment numbers for the exam period for ISec 2021 (48.1%) and ISec 2022 (59.6%) based on initial interest for the underlying course modules. Therefore, we conclude, that more learners plan to participate in the final exam if it is offered without a break (and thus register). However, this increased interest in the exam was not yet reflected in an actual increase in participation, as the number of no-shows increased at the same time. Those learners participating in any exam (regardless of the length of a break) achieved similar results, even though a longer break (and the associated self-paced study) might reduce the overall scores slightly.
4.3.5. Potential limitations of our study
The study design at hand is based on two courses offered in various iterations to a German and English learning community over 8 years. While we consider them to be similar with the same course instructor and, therefore, be suitable for our analysis, some iterations featured updated learning materials to stay up-to-date. A few courses even included interactive assignments and hands-on experiences to reiterate the learning content. Required participation in larger assignments has been shown to impact completion rates negatively (Staubitz, 2020). Therefore, the interactive assignments featured in the courses under supervision were purely optional or only contributed marginally to the overall course score. Thereby, learners were still able to gain a graded certificate for the courses without their participation in interactive assignments, reducing the impact of those elements on our analysis. Additionally, some modules were offered during the global COVID-19 pandemic, which was accompanied by various lockdowns. In our data, we did not find evidence that our observations have been influenced by the pandemic. For example, a comparison of participation of weekly homework assignments (see Figure 7) yielded similar effects for all monoliths and module series regardless of the year they were offered.
5. Future work
So far, we analyzed course enrollments and participation rates for several iterations of two popular courses on web technologies and internet security on openHPI. While our evaluation provides first insights on learner behavior in modularized courses, we plan to expand our research on more platforms: For example, we observed a switch from 6-week courses to shorter 4-week courses offered on openSAP4. These changes are also intended to accommodate a higher level of flexibility for learners, similar to our efforts. Another example are longer running courses on eGov-Campus5, which are partially intended for students. While these are only two examples, we intend to continue our research with other courses and additional platforms to identify more generalizable recommendations for course designs.
As part of a more detailed analysis, we will also use additional metrics to compare the learning behavior. While, so far, we have focused on the number of enrollments, no-shows, and participation in the homework assignments and exams as a proxy, we plan to expand our analysis: For example, we will consider when the individual learning items within a course week were accessed (e.g., during the original course period or subsequently in self-paced mode). Moreover, we will investigate whether the usage of the discussion forum (and thereby the sense of community) within the monolith and the module series differs.
Furthermore, we also see the course modules investigated as the first step toward individualized learning paths. Following this direction, we would like to allow learners to combine different modules themselves and offer them more flexible exams based on their learning path. In the subsequent analysis, we will evaluate how learners use this opportunity and which effects it has on key course metrics. Additionally, the future study will contribute to the field of self-regulated learning and the influence of learning goals.
6. Conclusion
In the article at hand, we compared our traditional monolith courses to our new module series. By analyzing key course metrics, such as the no-show and completion rate, as well as the learners' success in the exams, we answer the following research questions:
RQ 1: Has this modularization had a negative effect on course enrollments or participation?
RQ 2: To what extent are breaks between modules influencing dropout rates and learning outcomes?
RQ 3: Which differences can we observe in selective learning behavior between the course offerings?
RQ 1: Within each of the modules, we did not find any negative effects on participation or completion rates. Further, we did not observe significantly higher dropout rates in the shorter modules in comparison to the monoliths. However, overall participation in the final exams of the module series was lower than in the integrated exams of a monolith. This results from the more selective learning behavior in module series (see RQ 3) and breaks between the modules (see RQ 2). Despite the decreased participation in the exam of the module series, the weekly homework assignments of the modules do not show the same declining participation pattern as we have observed within the monoliths. Instead, we have shown that more new learners are attracted by starting a new module than by publishing a new week in an ongoing monolith.
RQ 2: Our analysis indicates that offering a module series with or without a break between the modules did not affect course dropouts in comparison to a monolith. However, the presence of breaks between modules leads to a higher selective learning behavior. Furthermore, the length of a break particularly between the last module and the exam has a proportionally negative effect on participation in the exam. Therefore, we recommend to offer exams without a prior break. Additional exam opportunities offered after half a year or a full year provide more flexibility for learners originally participating during the course period, but only attract a few new learners to join the self-paced courses and prepare for the exam on their own. In contrast to the increased no-show rate, we found only marginal differences in the learners' performance in those later exams.
RQ 3: Compared to a monolith, learners in module series show a more selective learning behavior, where participation in the final exam appears less appealing. As an overarching certification is not their primary motivation, the share of learners completing a module series is lower than those completing a monolith. Additionally, we observed that self-paced courses do not attract additional learners. Just offering a new possibility to earn an overarching certificate in a new iteration of an exam does not improve this. Instructor-paced courses, however, are much more popular and every additional iteration attracts a similar amount of new learners.
Besides the results discussed, we pointed out further research opportunities, such as potential differences in the usage of discussion forums or access patterns of learning items. We also introduced a simplified proxy—measuring learners' participation in weekly assignments—to observe selective learning behavior in online courses. This allowed us to uncover different levels of interest and engagement in individual weeks in addition to analyzing active learners in each module. With our analysis of course modularizations and selective learning behavior, we contribute to the ongoing research on more flexible learning opportunities and pave the way for individualized learning paths. Our results show the acceptance of modules and provide recommendations to accommodate learners' requirements regarding breaks between individual courses to reduce the number of course dropouts.
Data availability statement
The data analyzed in this study is subject to the following licenses/restrictions: the data analyzed is based on the enrolment and participation numbers of learners on the MOOC platform openHPI. In accordance with the data protection regulations of the platform, we may only share aggregated results. Requests to access these datasets should be directed to SS, sebastian.serth@hpi.de.
Ethics statement
Ethical review and approval was not required for the study on human participants in accordance with the local legislation and institutional requirements. The patients/participants provided their written informed consent to participate in this study.
Author contributions
SS and TS mainly focussed on planning the research, analysing the data recorded, and summarizing the findings. SS and TS contributed to the written text, where SS mostly authored the evaluation. ME supported in writing and restructuring the evaluation and finally polished the paper. CM advised the research project and conducted the examined courses. All authors contributed to the article and approved the submitted version.
Funding
This work was funded by the Deutsche Forschungsgemeinschaft (DFG, German Research Foundation)—Projektnummer 491466077.
Conflict of interest
The authors declare that the research was conducted in the absence of any commercial or financial relationships that could be construed as a potential conflict of interest.
Publisher's note
All claims expressed in this article are solely those of the authors and do not necessarily represent those of their affiliated organizations, or those of the publisher, the editors and the reviewers. Any product that may be evaluated in this article, or claim that may be made by its manufacturer, is not guaranteed or endorsed by the publisher.
Footnotes
. ^2 To earn a CoP, the participants has to consume at least half of the course materials. It is not necessary to successfully complete the weekly assignments, therefore, the modules can also be attended in self-paced mode outside the actual course period.
. ^3 End of 2019 and in late 2020.
References
Andone, D., Mihaescu, V., Ternauciuc, A., and Vasiu, R. (2015). “Integrating MOOCs in traditional higher education,” in Proceedings of the Third European MOOCs Stakeholder Summit (Mons), 71–75.
Avello, M., Wiltrout, M. E., Bell, A., Haar, C. V., and Fruchtman, S. (2020). “Impact of course delivery mode on learner engagement in MOOCs,” in 2020 IEEE Learning With MOOCS (LWMOOCS) (Antigua Guatemala), 68–72. doi: 10.1109/LWMOOCS50143.2020.9234325
Barr, R. C. (2014). “Bioelectricity-AQA, one of the first MOOC courses in engineering,” in 2014 36th Annual International Conference of the IEEE Engineering in Medicine and Biology Society (Chicago, IL), 1805–1808. doi: 10.1109/EMBC.2014.6943959
Celik, B., Cagiltay, K., and Cagiltay, N. E. (2020). An analysis of course characteristics, learner characteristics, and certification rates in MITx MOOCs. Int. Rev. Res. Open Distrib. Learn. 21, 121–139. doi: 10.19173/irrodl.v21i3.4698
Challen, G., and Seltzer, M. (2014). “Enabling MOOC collaborations through modularity,” in Proceedings of the 2014 Learning with MOOCs Practitioner's Workshop (Cambridge, MA), 1.
Chen, C.-M. (2008). Intelligent web-based learning system with personalized learning path guidance. Comput. Educ. 51, 787–814. doi: 10.1016/j.compedu.2007.08.004
Daniel, J. (2016). Massive open online courses: what will be their legacy? FEMS Microbiol. Lett. 363, 5. doi: 10.1093/femsle/fnw055
Digital Pedagogy Lab (2022). Dave Cormier. Available online at: https://www.digitalpedagogylab.com/dave-cormier/ (accessed September 3, 2022).
El Said, G. R. (2017). Understanding how learners use massive open online courses and why they drop out: thematic analysis of an interview study in a developing country. J. Educ. Comput. Res. 55, 724–752. doi: 10.1177/0735633116681302
Engle, D., Mankoff, C., and Carbrey, J. (2015). Coursera's introductory human physiology course: factors that characterize successful completion of a MOOC. Int. Rev. Res. Open Distrib. Learn. 16, 46–86. doi: 10.19173/irrodl.v16i2.2010
Eriksson, T., Adawi, T., and Stöhr, C. (2017). “Time is the bottleneck”: a qualitative study exploring why learners drop out of MOOCs. J. Comput. High. Educ. 29, 133–146. doi: 10.1007/s12528-016-9127-8
Goopio, J., and Cheung, C. (2021). The MOOC dropout phenomenon and retention strategies. J. Teach. Travel Tour. 21, 177–197. doi: 10.1080/15313220.2020.1809050
Hagedorn, C., Renz, J., and Meinel, C. (2017). “Introducing digital game-based learning in MOOCs: what do the learners want and need?,” in 2017 IEEE Global Engineering Education Conference (EDUCON) (Athens), 1101–1110. doi: 10.1109/EDUCON.2017.7942987
Harvard Magazine Online (2013). What Modularity Means for MOOCs. Available online at: https://www.harvardmagazine.com/2013/12/harvard-mit-online-education-views-changing (accessed September 19, 2022).
Ho, A. D., Chuang, I., Reich, J., Coleman, C. A., Whitehill, J., Northcutt, C. G., et al. (2015). HarvardX and MITx: two years of open online courses fall 2012-summer 2014. SSRN Electron. J. 1–37. doi: 10.2139/ssrn.2586847
Hollands, F. M., and Tirthali, D. (2014). MOOCs: Expectations and Reality: Full Report. Technical report, Center for Benefit-Cost Studies of Education, Teachers College, Columbia University, New York, NY.
Jordan, K. (2015a). Massive open online course completion rates revisited: assessment, length and attrition. Int. Rev. Res. Open Distrib. Learn. 16, 341–358. doi: 10.19173/irrodl.v16i3.2112
Jordan, K. (2015b). MOOC Completion Rates: The Data. Available online at: http://www.katyjordan.com/MOOCproject.html
Liyanagunawardena, T., Parslow, P., and Williams, S. (2014). “Dropout: MOOC participants' perspective,” in Proceedings of the Second MOOC European Stakeholders Summit (Lausanne), 95–100.
Manallack, D. T., and Yuriev, E. (2016). Ten simple rules for developing a MOOC. PLoS Comput. Biol. 12, e1005061. doi: 10.1371/journal.pcbi.1005061
Maya-Jariego, I., Holgado, D., González-Tinoco, E., Casta no-Mu noz, J., and Punie, Y. (2020). Typology of motivation and learning intentions of users in MOOCs: the MOOCKNOWLEDGE study. Educ. Technol. Res. Dev. 68, 203–224. doi: 10.1007/s11423-019-09682-3
McGill Association of University Teachers (2015). A Brief History of MOOCs. Available online at: https://www.mcgill.ca/maut/news-current-affairs/moocs/history (accessed September 3, 09).
Mustafaraj, E. (2014). “What does enrollment in a MOOC mean?,” in Proceedings of the First ACM Conference on Learning @ Scale Conference (Atlanta GA: ACM), 203–204. doi: 10.1145/2556325.2567882
Padilla Rodriguez, B. C., Armellini, A., and Rodriguez Nieto, M. C. (2020). Learner engagement, retention and success: why size matters in massive open online courses (MOOCs). Open Learn. 35, 46–62. doi: 10.1080/02680513.2019.1665503
Rohloff, T., Sauer, D., and Meinel, C. (2019). “On the acceptance and usefulness of personalized learning objectives in MOOCs,” in Proceedings of the Sixth (2019) ACM Conference on Learning @ Scale, L@S '19 (New York, NY: ACM), 10. doi: 10.1145/3330430.3333624
Rohloff, T., Schwerer, F., Schenk, N., and Meinel, C. (2020). openSAP: learner behavior and activity in self-paced enterprise MOOCs. Int. J. Adv. Corp. Learn. 13:30. doi: 10.3991/ijac.v13i2.16531
Shah, D. (2021). A Decade of MOOCs: A Review of MOOC Stats and Trends in 2021. Available online at: https://www.classcentral.com/report/moocs-stats-and-trends-2021/ (accessed March 30, 2022).
Smith, B., and Eng, M. (2013). “MOOCs: a learning journey,” in Hybrid Learning and Continuing Education, Vol. 8038, eds D. Hutchison, T. Kanade, J. Kittler, J. M. Kleinberg, F. Mattern, J. C. Mitchell, M. Naor, O. Nierstrasz, C. Pandu Rangan, B. Steffen, M. Sudan, D. Terzopoulos, D. Tygar, M. Y. Vardi, G. Weikum, S. K. S. Cheung, J. Fong, W. Fong, F. L. Wang, and L. F. Kwok (Berlin; Heidelberg: Springer), 244–255. doi: 10.1007/978-3-642-39750-9_23
Staubitz, T. (2020). Gradable team assignments in large scale learning environments (Doctoral thesis). Universität Potsdam, Potsdam, Germany.
Sun, G., Cui, T., Yong, J., Shen, J., and Chen, S. (2018). MLaaS: a cloud-based system for delivering adaptive micro learning in mobile MOOC learning. IEEE Trans. Services Comput. 11, 292–305. doi: 10.1109/TSC.2015.2473854
Teusner, R., Matthies, C., and Staubitz, T. (2018). “What stays in mind? - retention rates in programming MOOCs,” in 2018 IEEE Frontiers in Education Conference (FIE) (San Jose, CA), 1–9. doi: 10.1109/FIE.2018.8658890
Teusner, R., Richly, K., Staubitz, T., and Renz, J. (2015). “Enhancing content between Iterations of a MOOC - effects on key metrics,” in EMOOCs 2015: Third European MOOCs Stakeholder Summit (Mons), Vol. 1, 147–156.
Wang, L., Hu, G., and Zhou, T. (2018). Semantic analysis of learners' emotional tendencies on online MOOC education. Sustainability 10, 1921. doi: 10.3390/su10061921
Watson, W. R., Yu, J. H., and Watson, S. L. (2018). Perceived attitudinal learning in a self-paced versus fixed-schedule MOOC. Educ. Media Int. 55, 170–181. doi: 10.1080/09523987.2018.1484044
Willems, C., Renz, J., Staubitz, T., and Meinel, C. (2014). “Reflections on enrollment numbers and success rates at the openHPI MOOC platform,” in Proceedings of the Second MOOC European Stakeholders Summit (EMOOCs2014) (Lausanne), 6.
Zheng, S., Rosson, M. B., Shih, P. C., and Carroll, J. M. (2015). “Understanding student motivation, behaviors and perceptions in MOOCs,” in Proceedings of the 18th ACM Conference on Computer Supported Cooperative Work & Social Computing, CSCW '15 (New York, NY: Association for Computing Machinery), 1882–1895. doi: 10.1145/2675133.2675217
Keywords: Massive Open Online Course (MOOC), course design, modularization, learning path, flexibility, e-learning, assignments, self-paced learning
Citation: Serth S, Staubitz T, van Elten M and Meinel C (2022) Measuring the effects of course modularizations in online courses for life-long learners. Front. Educ. 7:1008545. doi: 10.3389/feduc.2022.1008545
Received: 31 July 2022; Accepted: 12 September 2022;
Published: 12 October 2022.
Edited by:
Dilrukshi Gamage, Tokyo Institute of Technology, JapanReviewed by:
Mary Ellen Wiltrout, Massachusetts Institute of Technology, United StatesDilani Lokuhetty, University of Colombo, Sri Lanka
S. Parasuraman, AIMST University, Malaysia
Copyright © 2022 Serth, Staubitz, van Elten and Meinel. This is an open-access article distributed under the terms of the Creative Commons Attribution License (CC BY). The use, distribution or reproduction in other forums is permitted, provided the original author(s) and the copyright owner(s) are credited and that the original publication in this journal is cited, in accordance with accepted academic practice. No use, distribution or reproduction is permitted which does not comply with these terms.
*Correspondence: Sebastian Serth, sebastian.serth@hpi.de