Abstract
Diagram use is generally considered an effective strategy in solving mathematical word problems, and many teachers demonstrate the use of this strategy when they are teaching. Despite such demonstrations, however, the majority of students evidence poor, ineffective use of diagrams in problem solving. This may be due to a lack of task-appropriate instruction, but to date, there is inadequate evidence to support this idea. Therefore, the present study aimed to better understand the development of diagram use competence following the provision of task-appropriate instruction, focusing on both behavioral and neurophysiological evidence (i.e., brain activity, using functional near-infrared spectroscopy or fNIRS). Sixteen participants (mean age 15.7 years) were asked to solve mathematical word problems for which the use of tables (which is one kind of diagram) was deemed effective. Data collection progressed in three phases: (1) Pre-test without the demand for diagram use, (2) Pre-test with demand to use a table, and (3) Post-test (after participants received instruction on table use for problem solving). Although table use increased in Phase 2, it was only in Phase 3 that such use led to increases in correct answers. In Phase 3, fNIRS measurements also indicated an increase in blood flow to the frontal area (DLPFC and VLPFC) of the brain usually associated with working memory activity. These results demonstrate important neurophysiological changes resulting from task-appropriate instruction that promotes effective strategy use and improves learning performance.
Introduction
“A factory manufactures automobile parts, packing 150 parts in each box, and carries as many boxes as possible to an assembly plant every day. If the number of parts left is more than 75, the factory will produce 180 parts the next day. Otherwise, it will produce 220 parts. The number of the parts left on day 1 was 130. How many parts will be left on day 365?”
Even elementary school students can probably reach the correct answer to this word problem by repeated calculations. However, it would take a tremendous amount of effort and time to do that. Mathematical word problems (often abbreviated as just word problems or WPs) are taught at all levels of education to develop the ability to apply mathematical knowledge to the real world. The word problems usually represent the relevant information in a short narrative rather than mathematical notation. For solving word problems efficiently, diagrams play an important role. However, teachers tend to face difficulty in getting students to master strategies for using diagrams. This study aimed to shed light on developing students’ ability to use diagrams that are appropriate for solving corresponding types of word problems. To deepen our understanding of the mechanisms involved in the development of such ability, we included a neurophysiological approach using functional near-infrared spectroscopy (fNIRS) to the behavioral approach mainly utilized in psychology and educational science.
Mathematical word problem solving and diagram use
It is necessary for us to use mathematics in various facets of everyday life, from making proportional adjustments to amounts of ingredients when cooking to planning travel activities. For this reason, developing skills in solving mathematical word problems is important because such problems contextualize the need to apply mathematical knowledge and skills, rendering them useful practice for real-life situations. Therefore, it is important that instruction provided in school is effective in developing such skills. The school curriculum in most countries normally includes mathematical word problem solving. However, previous research studies have reported that not only students, but people in general are not good at solving such problems (Riley et al., 1983; Lewis and Mayer, 1987; Hegarty et al., 1992; Daroczy et al., 2015).
Mathematical word problems have been portrayed as being one of the most difficult and complex types of problems that students encounter during their mathematics education (Daroczy et al., 2015). The difficulties arise from (i) the linguistic complexity of the text describing the problems, (ii) the numerical complexity of the mathematical problems themselves, and (iii) the complexity of the linguistic and numerical relationships portrayed in those problems. The knowledge and skills necessary for managing the third of these sources of difficulties are not usually explicitly taught in any school subject as they lie in the interaction between knowledge domains (in this case, between language and mathematics). However, in modern societies like those that most of us inhabit in the current century, competence in dealing with interactions between knowledge domains is crucial because real-world problems will present similar complexities. This is why training in reality-emulating problem solving—like mathematical word problem solving—is so important (Education 2030; OECD, 2018).
Diagrams are considered effective to use when solving mathematical word problems (Larkin and Simon, 1987; Novick and Hurley, 2001; García et al., 2006; Ainsworth et al., 2011; Boonen et al., 2016). A meta-analysis that included 487 studies reported that diagrams can be considered one of the most effective heuristics to use for such problem solving (Hembree, 1992). Mathematics teachers in general are knowledgeable about the effectiveness of diagram use, and they often demonstrate how to use diagrams when teaching. Diagrams can help their students understand the linguistic and numerical relationships present in mathematical word problems (Van Garderen, 2007; Daroczy et al., 2015). However, despite such demonstrations of diagram use, students tend not to use diagrams when solving mathematical word problems and, even when they do use diagrams, they often fail to derive the correct answers (Uesaka and Manalo, 2006; Uesaka et al., 2010). There are at least two problems that exist.
Problems in diagram use
The first problem is that students tend not to spontaneously use diagrams for solving mathematical word problems (e.g., Uesaka et al., 2007; Uesaka and Manalo, 2012). Apart from simply not knowing how to use diagrams, one important reason that has been identified regarding this problem concerns cognitive load. Understanding the text of the mathematical word problem and the terms of the problem that it conveys is already cognitively demanding (Sweller et al., 1998; Sweller, 2010; Paas et al., 2011; Schmeck et al., 2015). However, the procedure for translating the pertinent parts of the mathematical word problem into a diagram is an additional high load that students need to bear (Uesaka and Manalo, 2012). The resulting high cognitive load involved in using a diagram during the problem solving process can make such use prohibitive for students (Uesaka and Manalo, 2012; Ayabe and Manalo, 2018). Thus, high cognitive load may lead to production deficiencies in utilizing diagrams as a strategy (cf. Bjorklund et al., 1997, where strategy use in general is concerned).
The second problem is that students cannot always solve the mathematical word problem successfully despite using what could be considered the appropriate kinds of diagram (Larkin and Simon, 1987; Mayer and Gallini, 1990). Instruction on the use of diagrams have been indicated in previous research as effective for encouraging students to create the necessary kinds of diagrams for the problems given, but the construction of those diagrams does not always lead to the production of correct answers (Uesaka and Manalo, 2006; Uesaka et al., 2010). The results indicate that only creating the appropriate kind of diagram is not enough for students to solve the mathematical word problem successfully: they need to also be able to include the necessary problem-specific numerical and other details in those diagrams in order to work out the answers, as well as to be able to draw the necessary problem-specific inferences from those diagrams (e.g., Cartesian graphs enable working out the relative changes in two quantities usually across time, and tables are appropriate for discovering the rule that governs predictable change in quantities). Therefore, inadequate problem-appropriate details included in instruction on diagram use may lead to such a utilization deficiency in using diagrams as a strategy (cf. Bjorklund et al., 1997; Reuter et al., 2015).
To consider why the utilization deficiency occurs, we need to focus on whether the diagram constructed contains the numerical and other details necessary to meet the cognitive demands of the problem. Any problem can have multiple alternative forms of external representation, drawing attention to different features and providing “representational guidance” (Suthers, 2003; Schnotz and Kürschner, 2008). For example, most students can create a visual-schematic representation of a problem situation, such as illustrations or schematic diagrams. The use of such diagrams has been demonstrated in previous studies to lead to the generation of correct solutions in problem solving (Hegarty and Kozhevnikov, 1999; Boonen et al., 2014). Their purpose, however, is simply to visually represent the problem situation in a more-or-less concrete form (e.g., where objects are located in relation to each other), so that the problem solver can understand how it may be possible to solve it. We define the knowledge necessary to use such external representations as “general knowledge” (about diagrammatic representations). Such knowledge can be used to approach solutions to a wide range of word problems. However, general knowledge about the use of diagrams (like in this example) is often inadequate for solving more complex problems. Those types of problems usually require more abstract forms of diagrams to solve: concrete representation of the problem situation is usually not enough, and the diagram itself needs to directly facilitate the working out of the solution. For such problems, specific diagram knowledge is necessary. Specific diagram knowledge enables matching of the requirements of the problem to the “problem-appropriate diagram” that needs to be used. The important point to note here is that, when solving more complex and/or more abstract problems, usually not any diagrammatic representation will suffice: a specific kind of diagram needs to be used correctly to enable the appropriate operations for solving the problem to be executed (cf. Zhang and Norman, 1994; Zhang, 1997; Duval, 2006).
The problem is that in many classroom settings, when teachers simply demonstrate the use of diagrams such as tables to solve more complex mathematical word problems, they do not provide sufficient instruction to cultivate the problem-appropriate knowledge necessary for the correct construction and use of such diagrams (JSME, 2009). Thus, many students only apprehend the general aspects of the abstract diagram: for example, they understand that tables can be used to solve complicated problems, but they do not know the exact details of how to construct and use tables correctly for such purposes.
Purpose and rationale of the present study
The present study had a twofold purpose. First, it examined whether the provision of problem-appropriate instruction might help develop diagram use competence that would result in overcoming the two problems noted in the previous subsection. In other words, that both spontaneity in appropriate diagram use and generation of correct answers would be promoted. Second, it sought not only behavioral evidence, but also neurophysiological evidence that the cognitive mechanisms that drive the ability to simply construct a diagram and the ability to correctly construct and use a diagram according to task specific requirements are distinct and identifiable. This study used arithmetic or numeric mathematical word problems, which are only a small part of the types of problems available.
Previous studies have reported that declarative knowledge (“what to use”), procedural knowledge (“how to use”), and conditional knowledge (“when to use”) are all necessary to successfully use learning strategies (Brown et al., 1981; Paris et al., 1983; Garner, 1990). When teachers explain how to solve a particular mathematical word problem through the use of a diagram, they may generally believe that demonstration of such use is sufficient. However, it may only largely promote the acquisition of declarative knowledge (i.e., what to use = diagram strategy) and, although both procedural knowledge and conditional knowledge would be implicit in such a demonstration, they may not be adequately salient or detailed enough to facilitate acquisition. Instruction therefore needs to include sufficient details of the steps to take in correctly using the strategy in specific types of problems, and explicit explanations of the conditions for when to use the strategy (including specific steps that may only apply when certain conditions are present in the problem given). On top of such instruction, practice would be indispensable: it would help consolidate procedural and conditional knowledge necessary for correctly using the strategy (diagrams in this case) for the specific types of problems being considered.
If instruction is provided not in a broad-brush manner but specifically, dealing with details of the types of word problems that students should be able to solve and the ways that appropriate kinds of diagrams can be constructed and used to solve those problems, the understanding of the problem-appropriate diagram can effectively be conveyed to students. Combined with adequate practice with feedback, students should then be able to not only overcome their lack of spontaneity in using diagrams, but also the problem of failing to generate the correct answers despite diagram use. They would not only know that the problem-appropriate diagram would help in solving the problem—and hence spontaneously use it, but also how to construct and use that diagram to help obtain the answer required.
The solution proposed above needs to be tested and verified, and doing so requires not only measurements of problem solving behavior and performance, but also of the cognitive process involved in changes that are proposed to occur. It is often difficult to ascertain when students have acquired problem-appropriate diagram knowledge as opposed to general knowledge about diagram use based on behavioral and performance measures alone as those do not objectively portray the changes that occur in the minds of students. Recently, however, physiological studies have clarified the various localization of brain functions. Therefore, we believe it useful to examine whether there might be neurophysiological correlates of the changes in behavior/performance that we were hypothesizing would occur as a consequence of providing problem-appropriate diagram use instruction. Evidence of such correlates would confirm that such instruction leads to enabling at least some of the cognitive processes that are necessary for students to develop.
As mentioned earlier, the cognitive processing involved in solving mathematical word problems is complex. However, focusing on the prefrontal cortex will ascertain whether diagram use works successfully. Solving mathematical word problem includes at least numerical and linguistic processing. Numeric processing involves the frontal-parietal network (Dehaene et al., 1999; De Smedt et al., 2011), and linguistic processing involves the frontal, temporal, and parietal network (Sugiura et al., 2011). Researchers have revealed more detailed brain connections in recent years (Peters and De Smedt, 2018; Vogel and De Smedt, 2021), but significantly, activation in the prefrontal cortex underlies cognitive processing in common (Soltanlou et al., 2018). One of the mechanisms that mediate the prefrontal cortex’s hemodynamics and cognitive mechanisms is the working memory system, a central theory in cognitive science.
Working memory comprises a cognitive system that integrates (in what has been called the “episodic buffer”) and processes (in its “executive function”) visual information (in what has been called the “visuospatial sketch pad”) and verbal information (in what has been called the “phonological loop”) while temporarily retaining those kinds of information (Baddeley, 1992, 2000). Solving a mathematical word problem would require the use of working memory related to schema construction and application (Sweller et al., 1998).
The central executive system of working memory and its two sub-systems of the phonological loop and the visuospatial sketch pad have been found to correspond to frontal lobe functions in neuroscience (i.e., the prefrontal cortex of the left and right hemispheres of the brain) (D’Esposito et al., 1995; Smith et al., 1996; Kane and Engle, 2002). The DLPFC (dorsolateral prefrontal cortex) processes endogenous, complex, and higher-order information based on attention and concentration (Corbetta and Shulman, 2002; Petrides, 2005; O’Reilly, 2010), while the VLPFC (ventrolateral prefrontal cortex) processes exogenous stimuli as “simple working memory” content and the functions of selection and comparison as “first-order executive functions.” Numerical (linguistic) processing activates the left DLPFC, and retention and updating of that information—presumably in the phonological loop—activate the left VLPFC (Paulesu et al., 1993; Boisgueheneuc et al., 2006). Spatial (non-linguistic) cognitive processing—which is supposed to be undertaken through the visuospatial sketch pad—activates the right VLPFC and DLPFC (Smith et al., 1996).
Cognitive neuroscientific studies on diagram use also reported that the prefrontal cortex plays an important role. An fMRI study using a simple syllogism task showed lower brain activity in the left PFC (frontal lobe) when presented with an Euler diagram than with text alone. The results suggest that problem-appropriate diagrams assist the visual channels of working memory and facilitate logical reasoning (Sato et al., 2015). On the other hand, an fNIRS study using the Cleveland task (Cleveland and McGill, 1984) comparing pie charts and bar charts showed lower activity in the prefrontal cortex when using diagrams less appropriate to the problem (Peck et al., 2013). These two findings seem contradictory at first glance. However, they are consistent with working memory system theory (cognitive load theory; CLT; Sweller, 2010; Sweller et al., 1998) because we can consider that the former was due to a decrease in extrinsic cognitive load and the latter to a failure to allocate germane cognitive load. Importantly, these results provide neuroscientific evidence for an association between diagram use and brain activity. Therefore, evaluating behavioral outcomes based on these findings should help identify more detailed cognitive processes.
We selected a near-infrared optical functional brain imaging device (fNIRS) because it can be considered suitable for examining cognitive processes in school children and students when they are solving mathematical word problems with the use of a diagram. Many studies examining mathematical cognitive processes use fMRI, EEG, and fNIRS because they are non-invasive. fMRI has high spatial resolution and has the advantage of being able to measure the whole brain. However, it is sensitive to motion artifacts, which raises the problem of ecological plausibility if attempting to examine cognitive processes that involve movement. MR scanners produce a loud noise and force cramped spaces, putting school children and students in a harsh situation (Skau et al., 2022). EEG, on the other hand, can capture the instantaneous potential of neuronal firing with its high temporal resolution. However, EEG also is sensitive to motion artifacts. EEG analysis usually attempts to remove artifacts widely ranging from eye movements to faulty electrodes (Reis et al., 2014; Jiang et al., 2019). Therefore, unexpected and sudden movements cause critical problems. The availability of mobile EEG for practical use has recently improved (Biondi et al., 2022). However, most mobile devices are purpose-designed with low density (only some electrodes, including Fp1/Fp2). Many of those employ dry electrodes, which are more sensitive to motion artifacts. Accordingly, future validation and standardization must improve signal quality, validity, and reliability (Lau-Zhu et al., 2019). For those reasons, using an EEG device, whether conventional or mobile, is challenging for this study focusing on complex cognitive activity when school children and students solve for a number of minutes in an erratic, unpredictable manner (Xu and Zhong, 2018). Finally, fNIRS signals can show long-lasting changes to examine what happens during mathematical word problem solving (Sakai, 2022). Compared to fMRI, fNIRS has a lower spatial resolution and cannot detect blood flow activity in deeper brain regions (over 1–2 cm). Also, compared to EEG, fNIRS has (a higher spatial resolution but) a lower time resolution. Despite these functional limitations, the ability of fNIRS is sufficient for this study to focus on cerebral blood flow in the prefrontal cortex during students’ attempts at solving problems using diagrams. fNIRS is more robust to the motion artifacts than the other methods, enabling the assessment of the neural basis of cognitive processes with movement (Soltanlou et al., 2018). fNIRS is a friendly device even for children and young students to use in a realistic environment with almost no noise (Pinti et al., 2020). fNIRS has the advantage of producing data that are highly correlated with data gathered using fMRI (Cui et al., 2011) and it is both inexpensive and portable.
Main questions and hypotheses
There are a number of questions we wanted to address in this research. The first question was whether students would be able to construct what could be considered problem-appropriate diagrams for a particular type of problem given to them, and whether despite such diagram construction their problem solving performance (i.e., ability to produce the correct answers) would not improve. To answer this question, we use mathematical word problems like the one we introduced at the beginning of this article. We designed them so that the use of a diagram would be necessary. In such problems, students cannot easily imagine how to solve them and use routine algorithmic computation procedures. The use of such problems therefore can help in determining students’ diagram knowledge (Reuter et al., 2015). In this case, the kind of diagrams appropriate for the mathematical word problems we designed and administered to the students was tables. We decided on this design because all students in Japan are supposed to learn how to use tables for solving mathematical word problems (Ayabe et al., 2021a). To examine the level of table knowledge students have, the prompt “Use TABLE to solve the word problem” can be helpful. When the prompt is given, the students can create the table because they should know what it is. However, if they do so and they cannot use the table to solve the problem, it would suggest that they possessed adequate general knowledge about tables (i.e., enough to know what they are and how to construct them when asked to do so), but not enough to construct them with the details necessary to meet the requirements of the problem and/or to execute the operations that tables would allow in order to produce the correct answer (Mayer and Gallini, 1990; Reuter et al., 2015).
Our second question was whether students’ abilities to produce correct answers would improve after they receive problem-appropriate instruction on the use of tables for solving those problems. If they prove able to do this, it would suggest that such instruction equipped them with problem-appropriate knowledge about table use—in this case, specific to solving the types of problem they were administered.
A third question we had was whether, apart from evidence from problem solving performance, it would be possible to verify such differences in general and problem-appropriate knowledge about the use of a diagram (tables) through neurophysiological evidence (i.e., differences in brain activity). The possession of the relevant general knowledge would likely be adequate to enable the construction of tables. However, with the possession of only such knowledge, students are unlikely to be able to utilize the table they construct to correctly solve the problem they have been given. In such a situation, we predicted the blood flow in the prefrontal cortex (VLPFC and DLPFC) would decrease.
We can verify the prediction by manipulating the prompt described before. If we do not give the prompt, the students are free to answer in any way they choose. They can perform calculations using numbers and conditions in the problem on their own. In addition, they probably would not construct tables (Uesaka et al., 2007; Elia et al., 2009), they can also allocate the germane cognitive load to their surplus cognitive resources in a way they believe (CLT; Sweller et al., 1998; Sweller, 2010). It means the executive function of working memory works actively. Therefore, cerebral blood flow in the prefrontal cortex should be large.
On the other hand, the prompt “Use TABLE to solve the word problem” would restrict free solvers’ behavior and cognition. They would struggle if they do not have table knowledge for solving problems. Even if they constructed a table, it would likely remain incomplete because they know the table only in language and general appearance. Most of them should not be able to visualize it completely (Mayer and Gallini, 1990; Reuter et al., 2015). In this case, allocation of germane cognitive load would likely fail and result in the stagnation of the executive function of working memory. Therefore, cerebral blood flow in the prefrontal cortex should be small.
In contrast, problem-appropriate knowledge which could be developed following the provision of problem-appropriate instruction in table use could enable successful table use for solving and calculating the correct answer to the problem given. If that occurs, we predicted that the cerebral blood flow in the prefrontal cortex would increase in order to execute the executive function of working memory, as previously explained. In other words, we predicted that differences in cerebral blood flow in the VLPFC and DLPFC regions may indicate differences in the general or problem-appropriate knowledge about table use that our participants possessed.
The following were the corresponding hypotheses we tested:
H1. That, when prompted to construct tables during problem solving, the majority of students would be able to do so—hence, that table use would increase after providing a prompt for its use.
H2. That correct answer rates following the prompt to use tables would evidence no change compared to previous performance.
H3. That in the VLPFC and DLPFC regions of the brain, cerebral blood flow would decrease after the prompt for students to use tables in their problem solving.
H4. That spontaneous table use would increase after the provision of problem-appropriate instruction in table use.
H5. That correct answer rates would increase after the provision of problem-appropriate instruction in table use.
H6. That in the VLPFC and DLPFC regions of the brain, cerebral blood flow would increase after the provision of problem-appropriate instruction in table use.
Materials and methods
Ethics approval
The conduct of this study was approved by the research ethics committee of the university to which all the authors belong, with the exception of the third author. All the students who participated in the study did so voluntarily and provided informed consent for their participation. In the case of minors, parental consent was also obtained.
Participants
The participants were 16 right-handed students from elementary school to undergraduate university levels (female = 6; mean age = 15.7 ± 2.9 years, from 10 to 19 years; laterality quotient = + 69.6 ± 22.5, Oldfield, 1971) recruited from students who were attending an after-school tutoring service in Japan. The decision on the wide age range of participants for the study was based on previous findings (Ayabe et al., 2021b). In that Ayabe et al. study, no significant age effect was found for scores in diagram use, although they conducted similar experiments. They provided instruction to improve diagram knowledge about tables in 40 students ranging in age from 10 to 20 years (15.0 ± 3.1 years old). The results showed no correlation between age and frequency of table use, and correct answer rates when solving the mathematical word problem.
We used G*Power (Faul et al., 2007) to estimate the minimum sample size for our within-participant design with three phases. That estimated that seven participants would be required to detect a statistically significant difference for the assumed large effect size based on the Ayabe et al. study (f = 0.54, alpha-level p = 0.05, power = 0.80). As the sample sizes of one group in previous fNIRS studies in mathematics and language were from 8 to 15 (see Soltanlou et al., 2018 for a review), we decided the necessary sample size to be 15. In the experiment, 20 students participated, but four missed some sessions. We used data from 16 students in the analyses after excluding the four.
To confirm the equivalence of three mathematical word problems that were used during the assessment sessions, the participants were randomly assigned to one of three groups according to the sequence with which they received those problems (Group A, n = 6; Group B, n = 5; Group C, n = 5; see Table 1).
TABLE 1
| Phase | Purpose | Task and requirement | fNIRS | Problems to solve | ||
| Group A | Group B | Group C | ||||
| 1 | Pretest 1 | Solve problem; no requirement | Yes | Time | Sweets | Parts |
| 2 | Pretest 2 | Solve problem; use table | Yes | Sweets | Parts | Time |
| 3 | Intervention | Receive instruction; practice | No | – | – | – |
| 4 | Post-test | Solve problem; no requirement | Yes | Parts | Time | Sweets |
Outline of the experimental design and procedure.
Experimental design and procedure
A pre- and post-intervention design within participants, with four phases was used (see Table 1 for an outline). In Phase 1 (Pretest 1), participants were asked to solve one of three mathematical word problems according to the group they were randomly assigned. Apart from being asked to solve the problem, no other instruction or information was provided. Phase 2 (Pretest 2) was identical to Phase 1 in that participants were again asked to solve a different but isomorphic problem. However, this time, they were explicitly asked to construct and use a diagram—more specifically, a table—in their attempts at solving the problem. Phase 3 was the Intervention phase, during which the participants received instruction and practice in the construction and use of tables in mathematical word problems like those administered in the assessment sessions of this study. Finally, in Phase 4 (Post-test), the participants were administered a third problem to solve (different but again isomorphic to the previous two they had received). Like in Phase 1, they received no other instruction or requirement (i.e., it was up to them how to approach solving the problem, including whether to use a table or not).
During Phases 1, 2, and 4, brain activity data (cerebral blood flow) was also taken using fNIRS (functional near-infrared spectroscopy) equipment during the time the participants were solving the word problems. These phases were conducted in a laboratory to enable the use of the fNIRS equipment. We also measured the solving time, which is the time taken to solve each of the mathematical word problems. The solving time provides a measurement of the participants’ duration of engagement in relation to their problem solving performance and cerebral blood flow. The instruction provided in Phase 3 was conducted in a different experimental room. Phases 1, 2, and 4 took approximately 20 min each (including attachment and detachment of the fNIRS equipment), while Phase 3 took 30 min. All procedures were conducted individually for each participant. For each participant, all sessions were held on the same day. The four phases were conducted in sequence, one after the other, with short rest breaks of about 5 min in between.
All the materials used in the experiment were collected immediately after each phase to ensure that they would have no influence on the participants’ learning or problem solving performance outside of the sessions provided (e.g., that the participants would not look over and think about them during the short breaks).
Problems used
The problems used were all mathematical word problems in which tables were deemed to be helpful for solving. They all required the apprehension of the pattern of change in numbers described in the problem, and the prediction of a future quantity (see Table 2). All the problems were presented in sentences only and did not include expressions to explicitly induce the use of diagrams. Preliminary statistical analysis confirmed their isomorphism in terms of difficulty, as no significant differences between problems occurred in all phases. Here, isomorphic problems refer to problems that have different cover stories but have equivalent solving structures.
TABLE 2
| Name | Problem wording (translated from Japanese) |
| Time | Studying and playing time: A boy spends 150 min every day studying and playing games. If his study time is longer than playing games, he will play games 30 min longer the next day. Otherwise, he will study 45 min longer than the time spent playing games on the previous day. He studied for 50 min on day 1. (Question) How many minutes will he study for on day 365? |
| Sweets | Sweets tree: There is a sweets tree that bears 111 macaroons and eclairs every day. If the eclairs are more than the macaroons, it will bear 33 more macaroons the next day than the number of eclairs on the previous day. Otherwise, it will bear 22 fewer macaroons than the previous day. It bore 99 macaroons on day 1. (Question) How many macaroons will the tree bear on day 365? |
| Parts | Automobile factory: A factory manufactures automobile parts, packing 150 parts in each box, and carries as many boxes as possible to an assembly plant every day. If the number of parts left is more than 75, the factory will produce 180 parts the next day. Otherwise, it will produce 220 parts. The number of the parts left on day 1 was 130. (Question) How many parts will be left on day 365? |
Problems used.
The problem stories were printed on the answer sheets provided to the students, so that it would be easier for them to read them as well as underline or mark any parts of the stories they want to. The question corresponding to the problem given was displayed on the computer screen. The text length of the mathematical word problems was about 110 characters in Japanese (about 57 words in English). They were deemed too complicated to be solved mentally. However, if the participants identified and then arranged the necessary numbers/quantities in sequence in an array or table according to the rules provided in the problem, they were expected to discover the pattern of change. That would then facilitate inductive reasoning and, as a result, the ability to predict or calculate the future quantity required. Similar problems are included in Japanese elementary school textbooks (e.g., Souma, 2020).
Experimental setup for problem solving and functional near-infrared spectroscopy measurement
After attaching the fNIRS holder to his/her head to measure brain activity (cerebral blood flow), each participant was seated in the laboratory (in the shield room constructed so that it is not affected by external electric or magnetic fields and does not leak to the outside.). A computer monitor was installed on a desk in front of the seat, and instructions and questions were displayed on that monitor (see Figure 1). The LCD monitor (21.5 inches) was 70 cm away from the participant’s face.
FIGURE 1
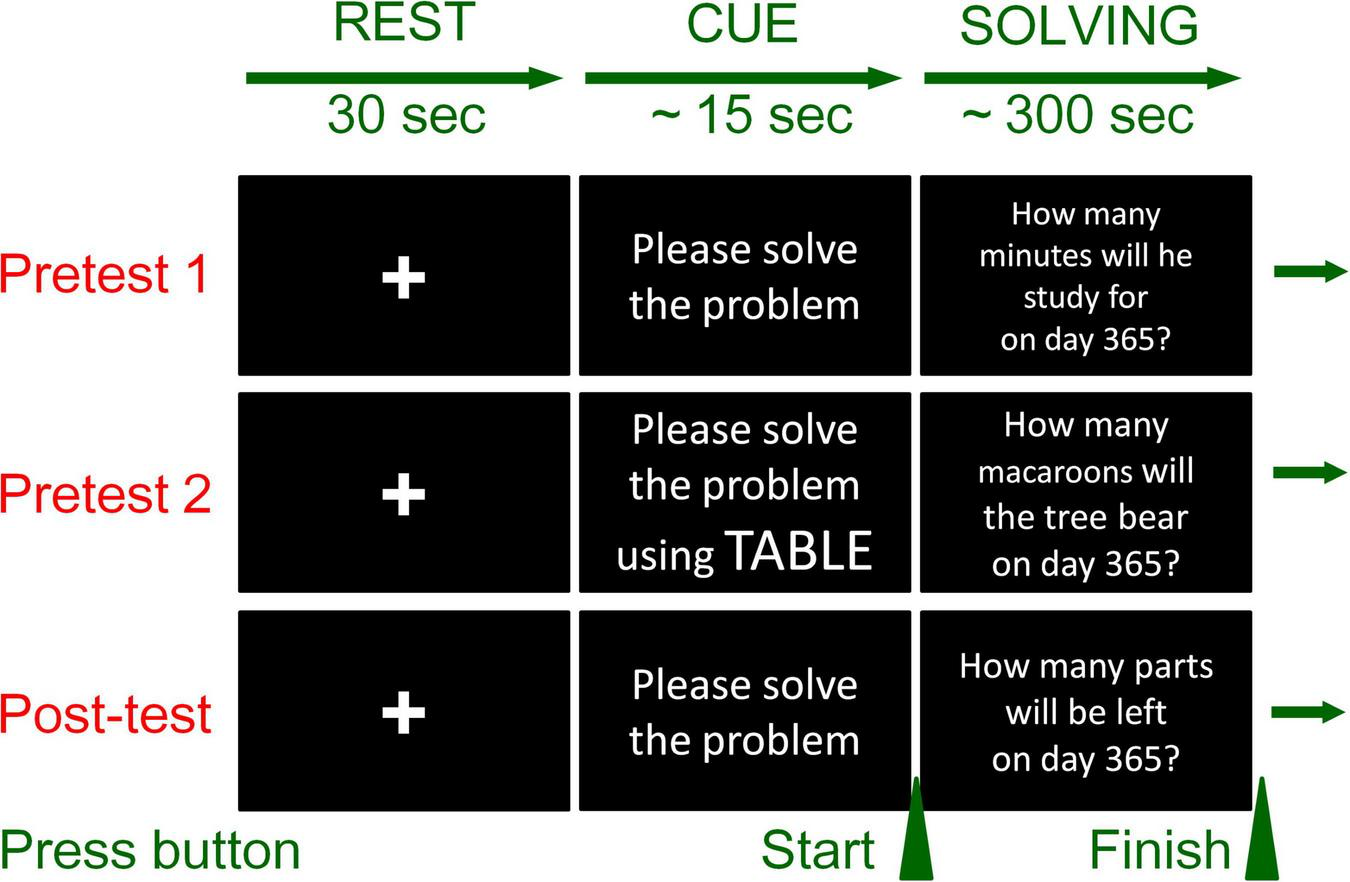
Test condition and procedure. Example of Group A (problems presented depends on the group; see Table 1). The procedures for all three test sessions were the same. Only in pretest 2 was the prompt to solve using the table given in the clue phase.
The test procedures performed in Phases 1, 2, and 4 were all the same, but the problems provided according to group assignment were different (see Table 1). The time course was as follows. First, the participants were asked to rest with their eyes closed (30 s). After that, the problem answer sheet, which also contains the problem story was provided to the participants (see Table 2). The question for the problem was displayed on the computer monitor on the desk. After reading the problem story and the question, the participant could then start his/her attempt at answering the question (for which they had up to 5 min). Note that, only in Phase 2, instruction to “Please solve the problem using a TABLE” was displayed on the computer screen just before (i.e., above) the question for the problem. To ensure that the student would follow the instruction, the experimenter asked if the student had understood the display and only allowed the student to move on to the problem solving phase after receiving a YES response.
Instruction
In Phase 3, the intervention session, instruction to develop procedural and conditional knowledge for the use of tables was provided. This phase comprised two parts: instruction and practice. The third author and a teacher with no vested interest in the outcomes of this research provided the instructions and facilitated the practice session for each participant individually. To ensure procedural fidelity and consistency in the conduct of this intervention, PowerPoint slides and worksheets were used. The intervention was conducted in an experimental room different from the shielded room used in Phases 1, 2, and 4.
In the instruction part, how to determine the rules that govern change in the relevant numbers provided in a problem by arranging them in a table was demonstrated and explained. Then, how to inductively draw inferences and calculate the required amount based on the “rule” that has been apprehended was covered. Mathematical word problems, which were different but isomorphic in structure and requirements to those administered in Phases 1, 2, and 4, were used in these demonstrations and the subsequent practice. The instruction part took 10 min. In the practice part, which took 20 min, the participant was asked to solve two problems and was given feedback and advice as was required to ensure that he/she could correctly solve those problems by constructing and using tables (see Table 3).
TABLE 3
| Teaching table use strategy knowledge | ||
| 1 | Declarative knowledge: Knowing that | |
| A table is a visual representation that allows arrangement of numbers/quantities in lines or rows for each item and for organizing them compactly for easy viewing | ||
| 2 | Conditional knowledge: Knowing when and why | |
| To use a table to find the change rule when solving problems with varying numbers/quantities | ||
| 3 | Procedural knowledge: Knowing how | |
| 1. Create a table focusing on the number/quantity required to solve the problem. 2. Find the change rule, such as the repetition period, from the sequence in the table. 3. Inductively infer general laws from the change rules. 4. Calculate the answer using the general formula. | ||
| Diagram use instruction | Example of parts problem | |
| Constructing stage | ||
| 1 | Read the problem carefully | |
| 2 | Underline necessary numbers and conditions | |
| 3 | Identify changing number (variables) | Day, the number of stock before (B) and after shipping (A) |
| 4 | Create a frame for the table, if necessary | |
| 5 | Write the numbers given in the problem into the table | 130 as the number of stock (B) on Day 1 |
| 6 | Calculate the numbers of stock (B, A) on Day 2 according to the problem condition | (310, 10) |
| 7 | Similarly, calculate the numbers of stock (B, A) after Day 3 | (235, 85), (265, 115), (295, 145), (325, 25), (250, 100), (280, 130), (310, 10) |
| Inferring and computing stage | ||
| 8 | Infer the change rule of the numbers of stock (B, A) | If the same value appears on the table, for example on Days 1 and 8, then it may signal that one periodic sequence is complete and is being repeated. |
| 9 | Find the periodic length | 7 (days) |
| 10 | Calculate the remainder by dividing 365 by the periodic length | 365 ÷ 7 = 52 remainder 1 |
| 11 | Find the number in the order of remainder in the periodic sequence | 130 (the 1st number of the periodic sequence) |
Instruction procedure.
The example above was in the case of the Parts problem (see Table 2). The experimenter taught students how to construct and use tables for solving the problem according to the above instructions. After the instructions, the experimenter had the students practice two more isomorphic problems. In the instruction and practice sessions, we used isomorphic problems different from those used in Pretest 1, Pretest 2, and Post-test.
Behavioral data acquisition
The presence/absence of a table (Table included/used: Yes/No) created by the participants, the correctness of all the numbers in a table students provided (Correct numbers: Yes: 1, No: 0), the correctness of the formulas to find the answer after inferring using the table (Correct formulas: Yes: 1, No: 0), and the answer they provided (Correct answer provided: Yes/No) were examined. Two teachers with no vested interest in the research outcomes undertook this scoring independently. The values of the kappa coefficients showing the agreement between the inter-raters (i.e., these two teachers) were 0.95 in Table use, 1.00 in the correctness of numbers, formulas, and answers, indicating almost perfect and perfect concordance, respectively (Cohen, 1960; Landis and Koch, 1977).
Functional near-infrared spectroscopy data acquisition
An fNIRS device was used to determine cerebral blood flow in the frontal lobe during solving of the mathematical word problems. For near-infrared spectroscopy, a multi-channel spectrometer operating at 780-, 805-, and 830-nm wavelengths (Foire-3000, Shimadzu, Japan) was used to measure temporal changes in concentrations of oxygenated hemoglobin (oxy-Hb), deoxygenated hemoglobin, and total hemoglobin. We used only oxy-Hb changes for analysis because oxy-Hb corresponds most with the blood oxygenation level-dependent signal of fNIRS (Strangman et al., 2002). We used a 3 × 9 array of 27 probes (fNIRS Folder for forehead measurement 551-07600-01; 14 light-emitting and 13 detecting probes), which enabled measuring in 42 channels (see Figure 2). Following the international 10–20 system (Sharbrough, 1991), we fitted 19 ch. and 24 ch. to F8 and F7, respectively. This fitting placed 38 ch. around Fp1 and 39 ch. around Fp2. The sampling time was 220 msec. In order to minimize artifacts, we asked participants to, as much as possible, limit their bodily movements to only those that are necessary to execute the task administered (i.e., solving the problem).
FIGURE 2
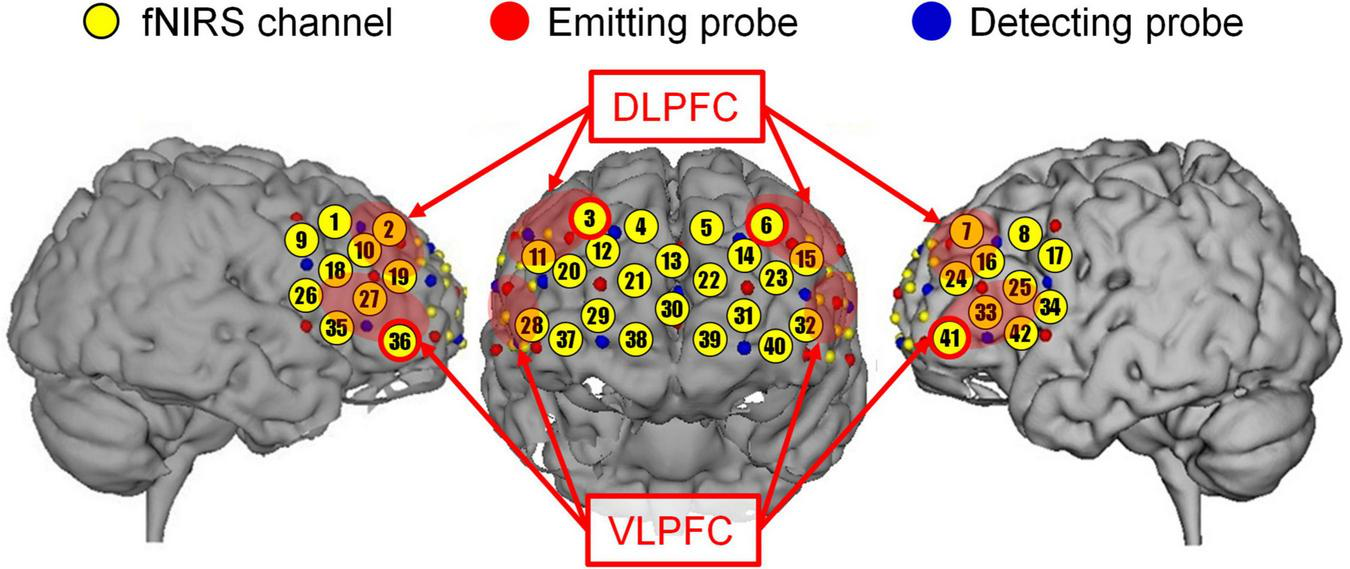
Anatomical space of each functional near-infrared spectroscopy (fNIRS) channel. Regions of interest (ROIs) are circled in red. Upper left circle, right DLPFC (3 ch.); upper right circle, left DLPFC (6 ch.); lower left circle, right VLPFC (36 ch.); lower right circle, left VLPFC (41 ch.); Red shadings are the estimated anatomical regions (right DLPFC, 2, 3, 10, 11, and 19 ch.; left DLPFC, 6, 7, 15, 16, and 24 ch.; right VLPFC, 18, 27, 28, 35, and 36 ch.; left VLPFC, 25, 32, 33, 41, and 42 ch.; e.g., Yamaya et al., 2021).
Before analysis, the fNIRS data were filtered through a low pass filter at 0.5 Hz and fifth order. Since cerebral blood flow changes several seconds later than neural activity, fNIRS data for the initial 10 s of stimuli onset in rest and solving phases were removed from the analysis. We subtracted the average oxy-Hb during the rest phase (30 s) from the average during the solving phase for each phase (e.g., Pretest 1—rest) and defined this relative oxy-Hb change as activation of the pre-frontal cortex (PFC) (Δoxy-Hb). After that, we subtracted the Δoxy-Hb in the two tests (Pretest 2—Pretest 1, Post-test—Pretest 2, Post-test—Pretest 1) and calculated the changes between the solving phases. Note that the rest phase immediately prior to each test session was set as the baseline for each test.
We estimated the anatomical data of the fNIRS channel using a three-dimensional digitizer and mapped the anatomical data on the image of the brain using a mapping software (Fusion, Shimadzu, Japan). As previously noted, the area of interest in the present study was the dorsolateral prefrontal cortex (DLPFC) and the ventrolateral prefrontal cortex (VLPFC). According to the international 10–20 system, the target channels based on this fNIRS probe placement were 3 ch. for right-DLPFC, 6 ch. for left-DLPFC, 36 ch. for right-VLPFC, and 41 ch. for left-VLPFC (Himichi and Nomura, 2015; Jin et al., 2019).
Analysis
We used three kinds of analysis to examine the dependent measures (behavioral and physiological data) depending on the variable type. First, we used Cochran’s Q test, a non-parametric statistical test, to analyze the data about the students’ table use and the correctness of their answers, as these were binary data (0 or 1). For pairwise comparisons of simple main effects, we used McNemar’s test as it is likewise suitable for detecting differences in dichotomous dependent variables. The null hypotheses were set against each effect of prompt for table use (before Pretest 2) and problem-appropriate instruction on table use (before Post-test). Second, we used paired t-tests to analyze the students’ cerebral blood flow before and after the prompt and the instruction. In order to understand variations in blood flow in the entire frontal lobe, we performed an analysis on all 42 channels measured. However, further analysis focused on the four channels above (the ROIs).
Results
Table 4 shows the results of the acquired behavioral data. And Figure 3 shows an example of tables drawn by the students for Pretest 1, Pretest 2, and Post-test. In Pretest 1, most students wrote numbers, calculation formulas, and calculations on paper, like in Figure 3. Four students drew a table, and another drew an illustration. In Pretest 2, 11 students drew tables, one drew an illustration, one drew a flow chart, and the other three only used calculation formulas. In Post-test, all 16 students drew (nearly) complete tables. Note that, for any test, it does not matter if the values in the table are correct or not.
TABLE 4
| Table use | Numbers | Formulas | Correct answer | |||||
| Use | Rate | Correct | Rate | Correct | Rate | Correct | Rate | |
| Pretest 1 | 4 | 0.25 | 1 | 0.06 | 0 | 0.00 | 0 | 0.00 |
| Pretest 2 | 11 | 0.69 | 4 | 0.25 | 1 | 0.06 | 1 | 0.06 |
| Post-test | 16 | 1.00 | 7 | 0.44 | 6 | 0.38 | 6 | 0.38 |
Table use, numbers, formulas, and correct answer.
N = 16.
Table use: the presence of a table students provided (Yes: 1, No: 0); Numbers: the correctness of all the numbers in the table (Yes: 1, No: 0); Formulas: the correctness of the formulas for finding the answer by inferring using the table (Yes: 1, No: 0); Correct answer: the correctness of the answer students provided (Yes: 1, No: 0).
FIGURE 3
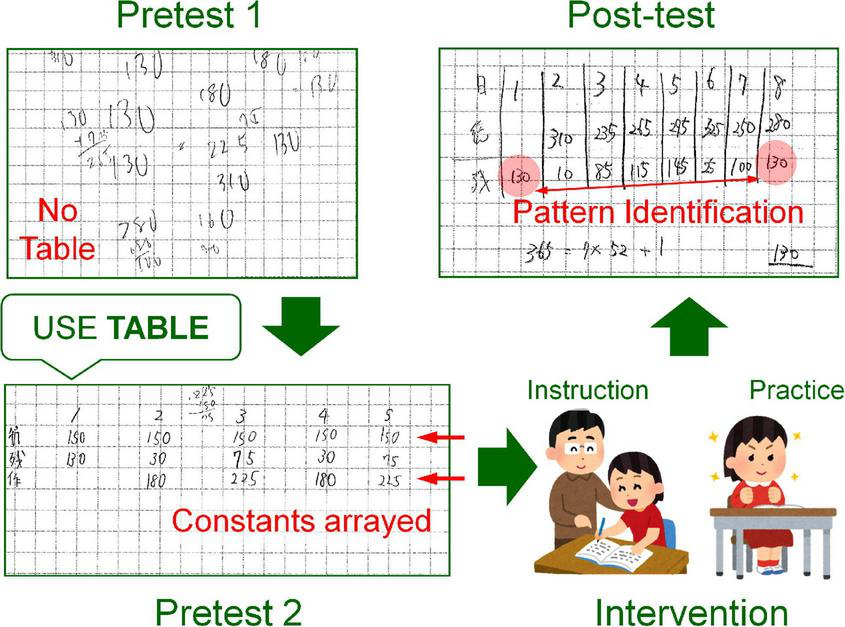
Examples of TABLES drawn by students.
Did table use increase after the provision of a prompt for its use?
One of the four students who constructed and used a table in Pretest 1 did not construct a table in Pretest 2 despite being prompted to use a table. However, eight students followed the prompt and constructed a table for the first time in the experiment.
A comparison of participant table use in Pretest 1 and Pretest 2 revealed that table use significantly increased following the prompt to construct and use it during problem solving. This can be seen in Figure 4, which shows Table use as a function of the test phases. The percentages of answer sheets that included a table (represented by the red bars) before and after the prompt (i.e., at Pretest 1 and at Pretest 2) are shown. In Pretest 1, most of the participants tried to solve the mathematical word problem by calculation alone, without using tables. In Pretest 2, as expected, after the provision of the prompt to use a table, table use increased.
FIGURE 4
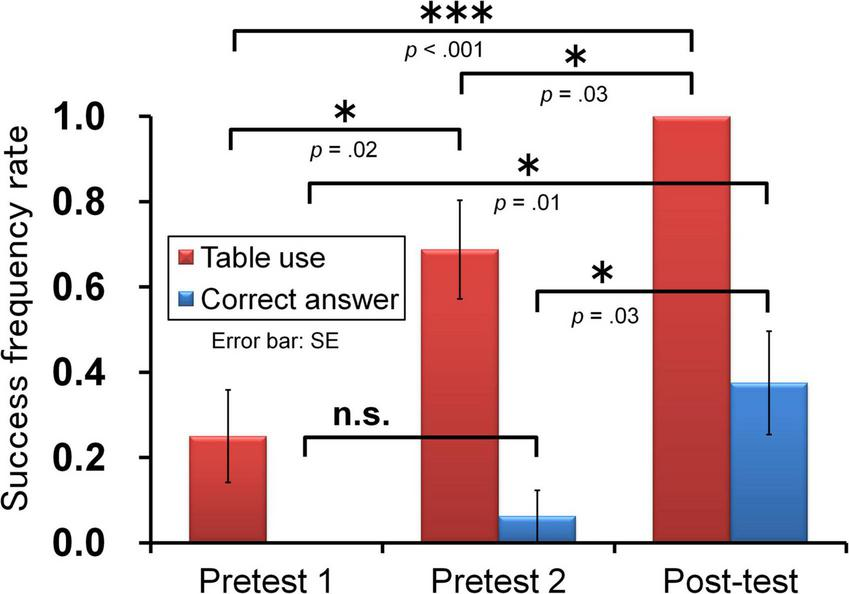
Changes in table use and correct answer rate (N = 16). *p < 0.05, **p < 0.01, ***p < 0.001.
The analysis showed a significant test phase effect for table use, Q(2) = 16.77, p < 0.001 [where Q(df) = Cochran’s Q value with the corresponding degrees of freedom]. Moreover, a significant difference was found in table use between the test immediately before and after the prompt for table use [Pretest 1 vs. Pretest 2: χ2(1) = 5.44, p < 0.05, where χ2(df) = McNemar’s χ2 with the corresponding degrees of freedom].
This result provides full support for the first hypothesis. Note, however, that in Pretest 2, five students did not construct a table despite being instructed to do so. As noted in the “Materials and methods” section, the experimenter asked all students to use a table by displaying the prompt on the monitor and soliciting verbal confirmation of the student’s understanding of the instruction. Also, all students wrote something on their answer sheet (i.e., none of them failed to write anything).
Did correct answer rates increase after the prompt for table use?
No students answered the problem correctly in Pretest 1. Only one student answered correctly in Pretest 2. That student constructed a table in both tests (i.e., with and without the prompt), failed to correctly solve the problem in Pretest 1, but succeeded in Pretest 2.
A comparison of participants’ correct answer rates in Pretest 1 and Pretest 2 revealed no improvement in their correct answer rates. Figure 4 shows table use as a function of the test phases. The blue bars in Figure 4 show that no correct answers were produced in Pretest 1 and only a very slight increase occurred at Pretest 2. The statistical analysis confirmed this—that is, despite a significant test phase effect for correct answer rates, Q(2) = 10.33, p < 0.01 [where Q(df) = Cochran’s Q value with the corresponding degrees of freedom], there was no significant difference between the correct answer rates immediately before and after the prompt to use tables [Pretest 1 vs. Pretest 2: χ2(1) = 1.00, p ≥ 0.1].
This result provides full support for the second hypothesis. In other words, despite using tables in attempts to solve the problem given during Pretest 2, there was no significant improvement in the participants’ ability to produce correct solutions.
Did the cerebral blood flow in the dorsolateral prefrontal cortex and ventrolateral prefrontal cortex regions of the brain decrease after the prompt for table use?
As explained in the Introduction section, the students were entirely free to solve the mathematical word problem in Pretest 1 using any approach they liked. However, in Pretest 2, they were restricted in their answering approach by being asked to use a table. Eight students changed their approach from calculating only to using tables, and five students were not able to follow the prompts. Based on these, we compared the cerebral blood flow data in Pretest 1 with those in Pretest 2 (see Figure 5).
FIGURE 5
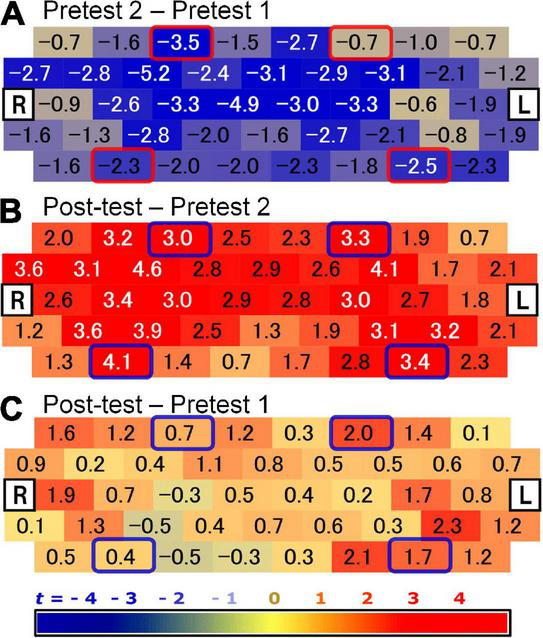
Changes in cerebral blood flow. The numbers on the figure are t values for changes in the average cerebral blood flow concentration per unit time between test phases; (A) Pretest 2—Pretest 1; (B) Post-test—Pretest 2; (C) Post-test—Pretest 1; (R) right, (L) left; N = 16. ROIs are circled. Upper left circle, right DLPFC (3 ch.); upper right circle, left DLPFC (6 ch.); lower left circle, right VLPFC (36 ch.); lower right circle, left VLPFC (41 ch.) (see Figure 2).
Significant decreases in cerebral blood flow were found in the right DLPFC area as well as the left and right VLPFC areas of the brain following the prompt for table use. However, no decrease was found in the left DLPFC region. These are portrayed in Figure 5A, which shows changes in cerebral blood flow while solving the mathematical word problem in Pretest 2 compared to Pretest 1. The color scale indicates the changes on the measured channel from red (increase) to blue (decrease). Circles on the figure indicate the regions of interest (ROIs) in the brain area. That is, the upper left circle represents the right DLPFC (3 ch.), the upper right circle represents the left DLPFC (6 ch.), the lower left circle represents the right VLPFC (36 ch), and the lower right circle represents the left VLPFC (41 ch.). As Figure 5A shows, the cerebral blood flow other than in the left DLPFC, more specifically in the right DLPFC area and left/right VLPFC areas, decreased when comparing Pretest 2 to Pretest 1.
The numbers in Figure 5A indicate the t-test values in comparing the blood flow in Pretest 2 to that in Pretest 1. Significant differences in cerebral blood flow were found in the right DLPFC [t(15) = −3.47, p < 0.01], right VLPFC [t(15) = −2.26, p < 0.05] and left VLPFC [t(15) = −2.45, p < 0.05] areas. However, no significant difference in cerebral blood flow was found in left DLPFC area [t(15) = −0.69, p ≥ 0.1].
These results provide partial support for the third hypothesis that, despite using tables to solve the problem during Pretest 2, rather than an increase in blood flow in these ROIs, there was instead a tendence for blood flow to decrease.
Did spontaneous table use increase after the provision of problem-appropriate instruction in table use?
In Pretest 2, 11 students constructed a table following the prompt, but in Post-test, all 16 students constructed a table without being prompted (see Table 4). A comparison of participant table use in Pretest 2 and Post-test revealed that Table use significantly increased following the provision of problem-appropriate instruction in table use. This is shown by the red bars in Figure 4.
The statistical analysis revealed a significant test phase effect for Table use, Q(2) = 16.77, p < 0.001. Moreover, significant difference was found when comparing Table use between Pretest 2 and Post-test (i.e., before and after instruction had been provided), χ2(1) = 5.00, p < 0.05.
These results provide full support for the fourth hypothesis. In other words, there is evidence indicating that provision of problem-appropriate instruction in table use led to improvements in participants’ ability to use tables spontaneously to solve the type of mathematical word problems. Note that in Post-test, the students were not prompted to use the table to solve the problem.
Did correct answer rates increase after the provision of problem-appropriate instruction in table use?
Only one student succeeded in deriving the correct answer in Pretest 2, but six students succeeded in the Post-test. The only student who succeeded in Pretest 2 also succeeded in Post-test. Five students failed to obtain the correct answer in Pretest 2 despite constructing tables but succeeded for the first time in the Post-test (see Table 4).
There was a significant increase in the correct answers produced by participants at Post-test compared to Pretest 2. This is shown by the blue bars in Figure 4. The statistical analysis revealed a significant test phase effect for the correct answer rates [Q(2) = 10.33, p < 0.01]. Moreover, significant difference was found when comparing correct answer rates between Pretest 2 and Post-test (i.e., before and after instruction had been provided), χ2(1) = 5.00, p < 0.05.
These results provide full support for the fifth hypothesis. In other words, there is evidence indicating that provision of problem-appropriate instruction in table use led to improvements in participants’ ability to solve the type of mathematical word problems that would benefit from the use of tables (i.e., those that require working out the pattern and rule of change in amounts). There were, however, ten students who failed to obtain the correct answer in the Post-test, and they constructed nearly complete tables. A close examination of their answer sheets showed that although they all undertook the appropriate approach in attempting to solve the problem, they made mistakes in the arithmetic procedure to determine or infer the values/numbers that make up the tables.
Did cerebral blood flow in the dorsolateral prefrontal cortex and ventrolateral prefrontal cortex regions of the brain increase after the provision of problem-appropriate instruction in table use?
In Pretest 2, we instructed students to use a table, but most of them could not create and use a table as the problem demanded. As described before, all students used a table spontaneously in Post-test. The tables they drew were nearly complete ones (see Figure 3), so they likely engaged in similar cognitive activities regardless of their success or failure in correctly solving the problem. Based on these, we compared the cerebral blood flow while solving the mathematical word problem in Pretest 2 with that in the Post-test.
There was a significant increase in cerebral blood flow to the left and right DLPFC and VLPFC regions of the brain at Post-test compared to Pretest 2. This is shown in Figure 5B: pay particular attention to the circled ROIs. The numbers in Figure 5B indicate the t-values on each of the fNIRS channels. When comparing cerebral blood flow readings between Post-test and Pretest 2, the analysis found significant differences in blood flow in the right DLPFC [t(15) = 3.00, p < 0.01], the left DLPFC [t(15) = 3.29, p < 0.01], the right VLPFC [t(15) = 4.13, p < 0.01], and the left VLPFC [t(15) = 3.35, p < 0.01].
These results provide full support for the sixth hypothesis: following problem-appropriate instruction in table use, there was a significant increase in blood flow to the DLPFC and VLPFC regions of the brain when participants were working on the problem they were given, suggesting active engagement of working memory functions noted earlier.
Finally, although not directly related to the hypothesis of this study, the results of comparing brain activity in Pretest 1 and the Post-test are shown in Figure 4C. No significant difference was found in any ROI. Apart from the ROI, a significant difference was seen on only one channel (33 ch.; t(15) = 2.32, p = 0.04). Therefore, this result shows the brain activities in Pretest 1 and Post-test were comparable if considering the multiple tests.
Means of cerebral blood flow and solving time by success or failure
For a more detailed analysis, we considered it necessary to examine the differences in brain activity between students who succeeded in the Post-test (6 students) and those who failed (10 students). As mentioned above, we speculated that they engaged in similar cognitive activities/efforts regardless of their success or failure outcome in solving the problem. However, those small sample sizes made statistical validation useless. We report only aggregated results here. Tables 5, 6 show the average cerebral blood flow in all channels and ROIs (four channels), respectively. We also considered solving time to be an essential factor. If students engaged in similar cognitive activities/efforts regardless of success or failure, there should be no difference in the solving time. However, for the same reason above, it was difficult for us to report statistical analysis results, so Table 7 shows only the aggregate results of the solving time.
TABLE 5
| All | Success (N = 6) | Failure (N = 10) | ||||
| Mean | SD | Mean | SD | Mean | SD | |
| Pretest 1 | 0.0181 | 0.0182 | 0.0178 | 0.0224 | 0.0184 | 0.0165 |
| Pretest 2 | 0.0014 | 0.0178 | 0.0014 | 0.0238 | 0.0014 | 0.0145 |
| Post-test | 0.0308 | 0.0268 | 0.0462 | 0.0320 | 0.0154 | 0.0152 |
Cerebral blood flow (prefrontal cortex).
N = 16.
Mean cerebral blood flow and the standard deviation for all 42 channels (mM⋅mm).
TABLE 6
| All | Success (N = 6) | Failure (N = 10) | ||||
| Mean | SD | Mean | SD | Mean | SD | |
| Pretest 1 | 0.0914 | 0.0951 | 0.1089 | 0.1229 | 0.0739 | 0.0785 |
| Pretest 2 | 0.0168 | 0.0613 | 0.0358 | 0.0815 | −0.0022 | 0.0445 |
| Post-test | 0.1664 | 0.1563 | 0.2334 | 0.2164 | 0.0993 | 0.0850 |
Cerebral blood flow (ROI).
N = 16.
Mean cerebral blood flow and the standard deviation for the four ROI channels (mM⋅mm).
TABLE 7
| All | Success (N = 6) | Failure (N = 10) | ||||
| Mean | SD | Mean | SD | Mean | SD | |
| Pretest 1 | 203.6 | 93.6 | 219.7 | 78.7 | 187.6 | 104.4 |
| Pretest 2 | 230.6 | 81.8 | 258.8 | 49.4 | 202.4 | 92.1 |
| Post-test | 238.7 | 61.7 | 226.3 | 57.6 | 251.1 | 65.2 |
Solving time.
N = 16.
Mean solving time and the standard deviation (sec).
Discussion
Summary of the main finding and interpretation of results
In the present study, we were able to obtain performance/behavioral and neurophysiological evidence of the effect of providing problem-appropriate instruction, which develops students’ ability to construct and use diagrams for solving mathematical word problems. As far as we know, this is the first study to report cerebral blood flow changes as a consequence of developing strategy use knowledge in problem solving. Our results showed that:
(1) If students were required to use diagrams (tables), they could construct them. However, such construction rarely led to successful problem solving.
(2) In that case, cerebral blood flow to regions of the brain related to working memory functions (i.e., the VLPFC and DLPFC areas) decreased compared to when students were not required to use tables in problem solving.
(3) After problem-appropriate instruction had been provided, both the students’ spontaneous use of diagrams (i.e., without prompting) and their production of correct answers increased.
(4) In that case, cerebral blood flow to the regions of the brain associated with working memory functions increased compared to measurements prior to the provision of instruction.
Evaluation of methods and assumptions
In this study, we experimentally verified the distinction between two kinds of diagram use knowledge (i.e., general and problem-appropriate) in the way they affect problem solving—in terms of both performance and brain response. We were able to confirm that problem-appropriate instruction can develop problem-appropriate knowledge that can address prevalent student deficits in the production and use of diagrams (Zahner and Corter, 2010; Van Garderen et al., 2013; Reuter et al., 2015). This finding may help contribute to overcome the repeatedly reported the utilization deficiency of diagrams (Uesaka and Manalo, 2006; Uesaka et al., 2010; Ayabe and Manalo, 2018).
Furthermore, we were able to demonstrate the usefulness of fNIRS as a tool for establishing neurophysiological evidence for strategy use acquisition—in near normal teaching and learning settings (i.e., participants were able to behave as they normally would in problem solving, which would have been difficult to do with the use of more movement-restrictive equipment such as fMRI and EEG; Soltanlou et al., 2018).
Finally, the mathematical word problems designed for this study helped to control table use knowledge effectively. Suppose the problem is not difficult to solve without tables or is easily solved by external representations other than tables. In that case, the assumption that table use is appropriate does not hold (e.g., Reuter et al., 2015). If those mathematical word problems were such, it would not have distinguished the three kinds of knowledge (Paris et al., 1983) for mastering table use strategies. In this study, all students failed in Pretest 1, where they were allowed to solve freely, and in the Post-test after table use knowledge instruction, the correct answer rate improved as table use increased. Therefore, the mathematical word problems used in this study can be taken as having worked to identify the components of table use knowledge.
Answers to questions raised
We had three main questions we were trying to answer in this research. The first of those was whether students would be able to construct tables when asked to do so for solving mathematical word problems (for which the use tables would be considered appropriate) (H1), and whether such demand would lead to increases in correct answers (H2). First of all, researchers have often reported that students do not construct diagrams spontaneously, even though they know diagrams help solve mathematical word problems (e.g., Uesaka et al., 2007). Only four students (25%) constructed a table in the Pretest in this experiment. This result confirmed the problem of lack of spontaneity in diagram use. Based on these, this question was generated in consideration of an advice often given by teachers in mathematics classrooms (i.e., “Use diagrams to solve this math word problem!”). As expected, asking students to use a table led to an increase in the use of tables during problem solving (from 4 to 11 students), but the correct answer rates did not improve (from 0 to 1 student). This result is congruent with those of previous studies that students, when encouraged to use diagrams, can construct diagrams—but that, without adequate problem-appropriate instruction, they are often unable to effectively use the diagrams for the task given (Uesaka and Manalo, 2006; Uesaka et al., 2010; Manalo and Uesaka, 2016).
As mentioned earlier, all students would know what a table is (Ayabe et al., 2021a). We also carefully gave them instructions that they needed to use a table for solving the problem given (monitor display and verbal confirmation). Therefore, the five students who did not construct a table probably gave up on constructing one because they did not know how to use it. Also, of the 11 students who constructed a table according to the instructions, only one student succeeded in Pretest 2. The rest (10 students) failed to solve the problem even though prompted to use a table.
A simpler mathematical word problem may be possible to solve by drawing items described in the problem and constructing a schema (e.g., Boonen et al., 2013; Daroczy et al., 2015): such diagram construction can be undertaken with the use of general knowledge about diagrams as visual representations. However, such general knowledge is insufficient for solving more difficult word problems, which require problem-appropriate knowledge for constructing and using the appropriate diagram so that it would not only visually represent the problem but also enable its actual solving (e.g., in the case of tables, it should enable the apprehension of the pattern of recurring change in numerical values; cf. Duval, 1999, 2006). This point highlights the importance of improving teachers’ teaching methods for diagram use strategy. The advice to “use a table to solve this problem,” which is the extent of explicit instruction many teachers provide, is far from adequate as it only provides declarative knowledge (i.e., it only answers the questions of: What strategy should I use? cf. Paris et al., 1983). The limited value of such advice was clearly demonstrated by our result of students being able to construct tables but failing to use them to work out the required answers.
The second question was whether the provision of problem-appropriate instruction about table use would further increase students’ spontaneous use of tables during problem solving (H4) and improve their ability to produce correct answers (H5). More specifically, all 16 students constructed a table spontaneously and completely in the Post-test. Six of them succeeded in correctly solving the problem. As mentioned above, the cause of the failure appeared to have been calculation errors (Table 4). Therefore, it indicates that the instruction and practice on table use provided in the intervention session helped them overcome the lack of spontaneity and to acquire knowledge about table use. This result is consistent with previous studies that have provided similar interventions (Ayabe and Manalo, 2018; Ayabe et al., 2021b).
The results at Post-test showed that both table use and correct answers increased. The problem-appropriate knowledge about table use provided during instruction students to not only construct a more useful table for the problem they were given (paying attention and extracting relevant numerical and other details from the text of the problem itself), but also to visually apprehend patterns of number changes, to inductively infer the rules that govern such patterns, and to undertake more efficient calculations of the answer required. The crucial point is that after teaching them that knowledge, the students possessed the necessary procedural and conditional knowledge appropriate for solving the type of problem given. Without problem-appropriate instruction, the table can be drawn, but it will unlikely lead to the production of the correct solution.
The third question was whether neurophysiological measurements (using fNIRS) could detect differences between the possession of general and problem-appropriate knowledge about table use. This study focused on the relationship between the working memory system and frontal cerebral blood flow (Wijeakumar et al., 2017; Soltanlou et al., 2018). At Pretest 1, the students would have been free to solve the problem given in any way they wanted, including just trying to numerically compute the answer and drawing pictures or illustrations. Brain activity measurement at this phase might reflect the state of natural mental effort and cognitive activity. At Pretest 2, cerebral blood flow was found to be lower overall than at Pretest 1 (H3). The reason may have been due to deficiencies in the students’ diagram use strategy (Bjorklund et al., 1997). In other words, the requirement to use a table might have turned into a stumbling block because, although most of the students would have known how to construct a basic table, many proved not to know how to construct and use a table to solve the problem they were given (cf. Uesaka and Manalo, 2006; Uesaka et al., 2010). The requirement to use an appropriate diagram (table) that they did not have sufficient knowledge about, could have activated the ACC area of the brain instead to try to resolve the problem (Botvinick et al., 1999; Cao et al., 2016), or the mPFC area to search for the way to use the table (Euston et al., 2012; Kurczek et al., 2015; Yonelinas et al., 2019). The net effect would have been the observed decreases in blood flow to the DLPFC and VLPFC regions of the brain. As previously noted, fNIRS would not have captured the activations in the deep PFC region (Fishburn et al., 2014), only the blood flow reductions in the DLPFC and VLPFC regions.
Finally, at Post-test, the cerebral blood flows became higher than those in Pretest 2 (H6). The activation of DLPFC and VLPFC would suggest that the working memory system is related to the use of problem-appropriate knowledge about table use (cf. Corbetta and Shulman, 2002; Petrides, 2005; O’Reilly, 2010), facilitating the execution of solving procedures, drawing of inferences, and more efficient computation (cf. Larkin and Simon, 1987; De Smedt et al., 2011; Giardino, 2017). In addition, the goal-oriented thinking process may activate PFC (Curtis and D’Esposito, 2003).
Working memory demands could explain the reason for no difference in activity in the prefrontal cortex between Pretest 1 and Post-test. In other words, whether diagrams were used or not, those working memory demands were the same. Therefore, we can interpret that the table use improved problem-solving performance, even though no differences were found in brain activity.
Significance of findings
An important educational implication of the present study is that the problem-appropriate declarative, conditional, and procedural knowledge pertaining to strategy use (Paris et al., 1983) needs to be directly addressed through problem-appropriate strategy/diagram use instruction. Most teachers would show and tell students to use diagrams to solve mathematical word problems. However, such general and largely superficial instructions may be limited to just imparting declarative knowledge. The teachers may believe that the student would be able to solve problems if they provide a careful explanation, including the conditions for when to use the diagram. However, if the student cannot connect the declarative and conditional knowledge they have gained with the necessary procedural knowledge, it is likely that the student will fail in correctly using a diagram to solve the problem. To effectively connect and integrate declarative, procedural, and conditional knowledge for strategy use, problem-appropriate instruction on the strategy to use (in this case, tables for solving particular types of mathematical word problems) is necessary.
Limitation and future research
One limitation of this study is the small sample size (N = 16). In the future, it is necessary to confirm the reliability and validity of the findings obtained here on larger numbers of participants. Another limitation is that this study focused only on one particular type of mathematical word problems and the corresponding kind of diagram (i.e., table) deemed effective for solving it. Most diagrams have domain-specific functions, and their inference types are abundant (Ainsworth, 1999; Arcavi, 2003; Ayabe and Manalo, 2018). In order to contribute to improving students’ diagram competencies, follow-up research is needed to cover the wider range of problem types and corresponding kinds of diagrams. Diagrams are an interactive and powerful thinking tool. Therefore, a better understanding of the correspondences between the functions that different kinds of diagrams can serve in mathematical word problem solving and the range of problem types that can be encountered, not only in the classroom but also in real life, can equip students with a powerful thinking tool for the duration of their formal education and the rest of their lives.
Statements
Data availability statement
The raw data supporting the conclusions of this article will be made available by the authors, without undue reservation.
Ethics statement
The studies involving human participants were reviewed and approved by the Research Ethics Committee Kyoto University. Written informed consent to participate in this study was provided by the participants’ legal guardian/next of kin. Written informed consent was obtained from the minor(s)’ legal guardian/next of kin for the publication of any potentially identifiable images or data included in this article.
Author contributions
HA and EM contributed to conception and design of the study. NH, HF, MN, and HA organized the experiment. HA performed the statistical analysis and wrote the first draft of the manuscript. EM, HF, and HA wrote sections of the manuscript. All authors contributed to manuscript revision, read, and approved the submitted version.
Funding
HA’s work on this research was supported by Grant-in-aid for JSPS (Japan Society for the Promotion of Science) Fellows (20J23507). EM’s work on this research was supported by a grant-in-aid (20K20516) received from JSPS.
Acknowledgments
The authors express their gratitude to the students and teachers of Achieve Academy, Gifu, Japan, for their assistance in collecting and analyzing the data.
Conflict of interest
The authors declare that the research was conducted in the absence of any commercial or financial relationships that could be construed as a potential conflict of interest.
Publisher’s note
All claims expressed in this article are solely those of the authors and do not necessarily represent those of their affiliated organizations, or those of the publisher, the editors and the reviewers. Any product that may be evaluated in this article, or claim that may be made by its manufacturer, is not guaranteed or endorsed by the publisher.
References
1
AinsworthS. (1999). The functions of multiple representations.Comput. Educ.33131–152. 10.1016/S0360-1315(99)00029-9
2
AinsworthS.PrainV.TytlerR. (2011). Drawing to learn in science.Science3331096–1097. 10.1126/science.1204153
3
ArcaviA. (2003). The role of visual representations in the learning of mathematics.Educ. Stud. Math.52215–241. 10.1023/A:1024312321077
4
AyabeH.ManaloE. (2018). “Can spontaneous diagram use be promoted in math word problem solving?,” in Diagrammatic representation and inference diagrqms 2018, lecture notes in computer science, Vol. 10871edsChapmanP.StapletonG.MoktefiA.Perez-KrizS.BellucciF.Cham: Springer International Publishing, 817–820. 10.1007/978-3-319-91376-6
5
AyabeH.ManaloE.FukudaM.SadatoN. (2021a). “What diagrams are considered useful for solving mathematical word problems in japan?,” in Proceedings of the diagrammatic representation and inference. Diagrams 2021. Lecture notes in computer science, Vol. 12909, edsBasuA.StapletonG.LinkerS.LeggC.ManaloE.VianaP. (Cham: Springer), 79–83. 10.1007/978-3-030-86062-2_8
6
AyabeH.ManaloE.HanakiN. (2021b). The effect of instruction on the domain specificity of diagrams based on the functional solution structure of mathematics word problems. Jpn. J. Educ. Technol.45, 17–20. 10.15077/jjet.S45011
7
BaddeleyA. (1992). Working Memory.Science255556–559. 10.1126/science.1736359
8
BaddeleyA. (2000). The episodic buffer: a new component of working memory?Trends in Cogn. Sci.4417–423. 10.1016/S1364-6613(00)01538-2
9
BiondiA.SantoroV.VianaP. F.LaiouP.PalD. K.BrunoE.et al (2022). Noninvasive mobile EEG as a tool for seizure monitoring and management: A systematic review.Epilepsia631041–1063. 10.1111/epi.17220
10
BjorklundD. F.MillerP. H.CoyleT. R.SlawinskiJ. L. (1997). Instructing children to use memory strategies: evidence of utilization deficiencies in memory training studies.Dev. Rev.17411–441. 10.1006/drev.1997.0440
11
BoisgueheneucF. D.LevyR.VolleE.SeassauM.DuffauH.KinkingnehunS.et al (2006). Functions of the left superior frontal gyrus in humans: a lesion study.Brain1293315–3328. 10.1093/brain/awl244
12
BoonenA. J. H.de KoningB. B.JollesJ.van der SchootM. (2016). Word problem solving in contemporary math education: A plea for reading comprehension skills training.Front. Psychol.7:191. 10.3389/fpsyg.2016.00191
13
BoonenA. J. H.van der SchootM.van WeselF.de VriesM. H.JollesJ. (2013). What underlies successful word problem solving? A path analysis in sixth grade students.Contemp. Educ. Psychol.38271–279. 10.1016/j.cedpsych.2013.05.001
14
BoonenA. J. H.van WeselF.JollesJ.van der SchootM. (2014). The role of visual representation type, spatial ability, and reading comprehension in word problem solving: An item-level analysis in elementary school children.Int. J. Educ. Res.6815–26. 10.1016/j.ijer.2014.08.001
15
BotvinickM.NystromL. E.FissellK.CarterC. S.CohenJ. D. (1999). Conflict monitoring versus selection-for-action in anterior cingulate cortex.Nature402179–181. 10.1038/46035
16
BrownA. L.CanpioneJ. C.DayJ. D. (1981). Learning to learn: on training students to learn from texts.Educ. Res.1014–21. 10.3102/0013189X010002014
17
CaoB.LiW.LiF.LiH. (2016). Dissociable roles of medial and lateral PFC in rule learning.Brain Behav.6:e00551. 10.1002/brb3.551
18
ClevelandW. S.McGillR. (1984). Graphical perception: Theory, experimentation, and application to the development of graphical methods.J. Am. Stat. Assoc.79531–554. 10.1080/01621459.1984.10478080
19
CohenJ. (1960). A coefficient of agreement for nominal scales.Educ. Psychol.Meas.2037–46. 10.1177/001316446002000104
20
CorbettaM.ShulmanG. L. (2002). Control of goal-directed and stimulus-driven attention in the brain.Nat. Rev. Neurosci.3201–215. 10.1038/nrn755
21
CuiX.BrayS.BryantD. M.GloverG. H.ReissA. L. (2011). A quantitative comparison of NIRS and fMRI across multiple cognitive tasks.NeuroImage542808–2821. 10.1016/j.neuroimage.2010.10.069
22
CurtisC. E.D’EspositoM. (2003). Persistent activity in the prefrontal cortex during working memory.Trends Cogn. Sci.7415–423. 10.1016/S1364-6613(03)00197-9
23
D’EspositoM.DetreJ. A.AlsopD. C.ShinR. K.AtlasS.GrossmanM. (1995). The neural basis of the central executive system of working memory.Nature378279–281. 10.1038/378279a0
24
DaroczyG.WolskaM.MeurersW. D.NuerkH.-C. (2015). Word problems: a review of linguistic and numerical factors contributing to their difficulty.Front. Psychol.6:348. 10.3389/fpsyg.2015.00348
25
De SmedtB.HollowayI. D.AnsariD. (2011). Effects of problem size and arithmetic operation on brain activation during calculation in children with varying levels of arithmetical fluency.NeuroImage57771–781. 10.1016/j.neuroimage.2010.12.037
26
DehaeneS.SpelkeE.PinelP.StanescuR.TsivkinS. (1999). Sources of mathematical thinking: Behavioral and brain-imaging evidence.Science284970–974. 10.1126/science.284.5416.970
27
DuvalR. (1999). “Representation, vision and visualization: Cognitive functions in mathematical thinking. Basic issues for learning,” in Proceedings of the Twenty First Annual Meeting of the North American Chapter of the International Group for the Psychology of Mathematics Education, Vol. 1Cuernavaca, 3–26.
28
DuvalR. (2006). A cognitive analysis of problems of comprehension in a learning of mathematics.Educ. Stud. Math.61103–131. 10.1007/s10649-006-0400-z
29
EliaI.van den Heuvel-PanhuizenM.KolovouA. (2009). Exploring strategy use and strategy flexibility in non-routine problem solving by primary school high achievers in mathematics.ZDM Int. J. Math. Educ.41605–618. 10.1007/s11858-009-0184-6
30
EustonD. R.GruberA. J.McNaughtonB. L. (2012). The role of medial prefrontal cortex in memory and decision making.Neuron761057–1070. 10.1016/j.neuron.2012.12.002
31
FaulF.ErdfelderE.LangA.-G.BuchnerA. (2007). G*Power 3: A flexible statistical power analysis program for the social, behavioral, and biomedical sciences.Behav. Res. Methods39175–191. 10.3758/BF03193146
32
FishburnF. A.NorrM. E.MedvedevA. V.VaidyaC. J. (2014). Sensitivity of fNIRS to cognitive state and load.Front. Hum. Neurosci.8:76. 10.3389/fnhum.2014.00076
33
GarcíaA. I.JiménezJ. E.HessS. (2006). Solving arithmetic word problems.J. Learn. Disabil.39270–281. 10.1177/00222194060390030601
34
GarnerR. (1990). When children and adults do not use learning strategies: Toward a theory of settings.Rev. Educ. Res.60:517. 10.2307/1170504
35
GiardinoV. (2017). “Diagrammatic Reasoning in Mathematics,” in Springer Handbook of Model-Based Science. Springer Handbooks, edsMagnaniL.BertolottiT.Berlin: Springer, 499–522. 10.1007/978-3-319-30526-4_22
36
HegartyM.KozhevnikovM. (1999). Types of visual–spatial representations and mathematical problem solving.J. Educ. Psychol.91684–689. 10.1037/0022-0663.91.4.684
37
HegartyM.MayerR. E.GreenC. E. (1992). Comprehension of arithmetic word problems: Evidence from students’ eye fixations.J. Educ. Psychol.8476–84. 10.1037/0022-0663.84.1.76
38
HembreeR. (1992). Experiments and relational studies in problem solving: A meta-analysis.J. Res. Math. Educ.23:242. 10.2307/749120
39
HimichiT.NomuraM. (2015). Modulation of empathy in the left ventrolateral prefrontal cortex facilitates altruistic behavior: An fNIRS study.J. Integr. Neurosci.14207–222. 10.1142/S0219635215500120
40
JiangX.BianG. B.TianZ. (2019). Removal of artifacts from EEG signals: A review.Sensors (Switzerland)191–18. 10.3390/s19050987
41
JinX.ChenC.ZhouX.YangX. (2019). Stimulating the dorsolateral prefrontal cortex decreases the asset bubble: A tDCS study.Front. Psychol.10:1031. 10.3389/fpsyg.2019.01031
42
JSME (2009). Sansuu kyoiku shido yogo jiten (Arithmetic education guidance glossary), 4th Edn. Tokyo: Japan Society of Mathematical Education.
43
KaneM. J.EngleR. W. (2002). The role of prefrontal cortex in working-memory capacity, executive attention, and general fluid intelligence: An individual-differences perspective.Psychon. Bull. Rev.9637–671. 10.3758/BF03196323
44
KurczekJ.WechslerE.AhujaS.JensenU.CohenN. J.TranelD.et al (2015). Differential contributions of hippocampus and medial prefrontal cortex to self-projection and self-referential processing.Neuropsychologia73116–126. 10.1016/j.neuropsychologia.2015.05.002
45
LandisJ. R.KochG. G. (1977). The measurement of observer agreement for categorical data.Biometrics33:159. 10.2307/2529310
46
LarkinJ. H.SimonH. A. (1987). Why a diagram is (sometimes) worth ten thousand words.Cogn. Sci.1165–100. 10.1111/j.1551-6708.1987.tb00863.x
47
Lau-ZhuA.LauM. P. H.McLoughlinG. (2019). Mobile EEG in research on neurodevelopmental disorders: Opportunities and challenges.Dev. Cogn. Neurosci.36:100635. 10.1016/j.dcn.2019.100635
48
LewisA. B.MayerR. E. (1987). Students’ miscomprehension of relational statements in arithmetic word problems.J. Educ. Psychol.79363–371. 10.1037/0022-0663.79.4.363
49
ManaloE.UesakaY. (2016). “Hint, instruction, and practice: the necessary components for promoting spontaneous diagram use in students’ written work?,” in Diagrammatic Representation and Inference Diagrams 2018, Lecture Notes in Computer Science, Vol. 2980edsJamnikM.UesakaY.Elzer SchwartzS.Cham: Springer, 157–171. 10.1007/978-3-319-42333-3_12
50
MayerR. E.GalliniJ. K. (1990). When is an illustration worth ten thousand words?J. Educ. Psychol.82715–726. 10.1037/0022-0663.82.4.715
51
NovickL. R.HurleyS. M. (2001). To matrix, network, or hierarchy: That is the question.Cogn. Psychol.42158–216. 10.1006/cogp.2000.0746
52
O’ReillyR. C. (2010). The What and How of prefrontal cortical organization.Trends Neurosci.33355–361. 10.1016/j.tins.2010.05.002
53
OECD (2018). The Future of Education and Skills: Education 2030. In OECD Education Working Papers. Available online at: http://www.oecd.org/education/2030/E2030 Position Paper (accessed April 5, 2018).
54
OldfieldR. C. (1971). The assessment and analysis of handedness: The Edinburgh inventory.Neuropsychologia997–113. 10.1016/0028-3932(71)90067-4
55
PaasF.TuovinenJ. E.TabbersH.Van GervenP. W. M. (2011). Cognitive load measurement as a means to advance cognitive load theory cognitive load measurement as a means to advance cognitive load theory.Educ. Technol.3837–41. 10.1186/s12909-015-0452-9
56
ParisS. G.LipsonM. Y.WixsonK. K. (1983). Becoming a strategic reader.Contemp. Educ. Psychol.8293–316. 10.1016/0361-476X(83)90018-8
57
PaulesuE.FrithC. D.FrackowiakR. S. J. (1993). The neural correlates of the verbal component of working memory.Nature362342–345. 10.1038/362342a0
58
PeckE. M.YukselB. F.OttleyA.JacobR. J. K.ChangR. (2013). “Using fNIRS brain sensing to evaluate information visualization interfaces,” in Proceedings of the conference on human factors in computing systems, (New York, NY), 473–482. 10.1145/2470654.2470723
59
PetersL.De SmedtB. (2018). Arithmetic in the developing brain: A review of brain imaging studies.Dev. Cogn. Neurosci.30265–279. 10.1016/j.dcn.2017.05.002
60
PetridesM. (2005). Lateral prefrontal cortex: Architectonic and functional organization.Philos. Trans. R. Soc. B: Biol. Sci.360781–795. 10.1098/rstb.2005.1631
61
PintiP.TachtsidisI.HamiltonA.HirschJ.AichelburgC.GilbertS.et al (2020). The present and future use of functional near-infrared spectroscopy (Fnirs) for cognitive neuroscience.Ann. N Y Acad. Sci.14645–29. 10.1111/nyas.13948
62
ReisP. M. R.HebenstreitF.GabsteigerF.von TscharnerV.LochmannM. (2014). Methodological aspects of EEG and body dynamics measurements during motion.Front. Hum. Neurosci.8:156. 10.3389/fnhum.2014.00156
63
ReuterT.SchnotzW.RaschR. (2015). Drawings and tables as cognitive tools for solving non-routine word porblems in primary school.Am. J. Educ. Res.31387–1397. 10.12691/education-3-11-7
64
RileyM.GreenoJ.HellerJ. (1983). “Development of children’s problem solving ability in arithmetic,” in The Development of Mathematical Thinking, ed.GinsburgH.New York, NY: Academic Press, 153–196.
65
SakaiJ. (2022). Functional near-infrared spectroscopy reveals brain activity on the move.Proc. Natl. Acad. Sci. U. S. A.1191–4. 10.1073/pnas.2208729119
66
SatoY.MasudaS.SomeyaY.TsujiiT.WatanabeS. (2015). “An fMRI analysis of the efficacy of Euler diagrams in logical reasoning,” in Proceedings of the IEEE symposium on visual languages and human-centric computing, VL/HCC, 2015-Decem, (Atlanta, GA: IEEE), 143–151. 10.1109/VLHCC.2015.7357209
67
SchmeckA.OpfermannM.van GogT.PaasF.LeutnerD. (2015). Measuring cognitive load with subjective rating scales during problem solving: differences between immediate and delayed ratings.Instr. Sci.4393–114. 10.1007/s11251-014-9328-3
68
SchnotzW.KürschnerC. (2008). External and internal representations in the acquisition and use of knowledge: Visualization effects on mental model construction.Instr. Sci.36175–190. 10.1007/s11251-007-9029-2
69
SharbroughF. (1991). American electroencephalographic society guidelines for standard electrode position nomenclature.J. Clin. Neurophysiol.8200–202. 10.1097/00004691-199104000-00007
70
SkauS.HeleniusO.SundbergK.Bunketorp-KällL.KuhnH.-G. (2022). Proactive cognitive control, mathematical cognition and functional activity in the frontal and parietal cortex in primary school children: An fNIRS study.Trends Neurosci. Educ.28:100180. 10.1016/j.tine.2022.100180
71
SmithE. E.JonidesJ.KoeppeR. A. (1996). Dissociating verbal and spatial working memory using PET.Cereb. Cortex611–20. 10.1093/cercor/6.1.11
72
SoltanlouM.SitnikovaM. A.NuerkH.-C.DreslerT. (2018). Applications of functional near-infrared spectroscopy (fNIRS) in studying cognitive development: The case of mathematics and language.Front. Psychol.9:277. 10.3389/fpsyg.2018.00277
73
SoumaK. (2020). Tanoshii Sansuu 6 Nen (Fun Math Grade 6), 1st Edn. Tokyo: Dainippon Tosho Publishing.
74
StrangmanG.CulverJ. P.ThompsonJ. H.BoasD. A. (2002). A quantitative comparison of simultaneous BOLD fMRI and NIRS recordings during functional brain activation.NeuroImage17719–731. 10.1006/nimg.2002.1227
75
SugiuraL.OjimaS.Matsuba-KuritaH.DanI.TsuzukiD.KaturaT.et al (2011). Sound to language: Different cortical processing for first and second languages in elementary school children as revealed by a large-scale study using fNIRS.Cereb. Cortex212374–2393. 10.1093/cercor/bhr023
76
SuthersD. D. (2003). Representational guidance for collaborative inquiry.Arguing Learn199427–46. 10.1007/978-94-017-0781-7_2
77
SwellerJ. (2010). Element interactivity and intrinsic, extraneous, and germane cognitive load.Educ. Psychol. Rev.22123–138. 10.1007/s10648-010-9128-5
78
SwellerJ.Van MerrienboerJ. J. G.PaasF. G. W. C. (1998). Cognitive architecture and instructional design.Educ. Psychol. Rev.10251–296. 10.1023/A:1022193728205
79
UesakaY.ManaloE. (2006). “Active comparison as a means of promoting the development of abstract conditional knowledge and appropriate choice of diagrams in math word problem solving,” in Diagrammatic Representation and Inference Diagrams 2006, Lecture Notes in Computer Science, Vol. 4045edsBarker-PlummerD.CoxR.SwobodaN.Berlin: Springer, 181–195. 10.1007/11783183_25
80
UesakaY.ManaloE. (2012). Task-related factors that influence the spontaneous use of diagrams in math word problems.Appl. Cogn. Psychol.26251–260. 10.1002/acp.1816
81
UesakaY.ManaloE.IchikawaS. (2007). What kinds of perceptions and daily learning behaviors promote students’ use of diagrams in mathematics problem solving?Learn. Instr.17322–335. 10.1016/j.learninstruc.2007.02.006
82
UesakaY.ManaloE.IchikawaS. (2010). “The effects of perception of efficacy and diagram construction skills on students’ spontaneous use of diagrams when solving math word problems,” in Diagrammatic Representation and Inference Diagrams 2010, Lecture Notes in Computer Science, Vol. 6170edsGoelA. K.JamnikM.NarayananN. H.Berlin: Springer, 197–211. 10.1007/978-3-642-14600-8_19
83
Van GarderenD. (2007). Teaching students with LD to use diagrams to solve mathematical word problems.J. Learn. Disabil.40540–553. 10.1177/00222194070400060501
84
Van GarderenD.ScheuermannA.JacksonC. (2013). Examining how students with diverse abilities use diagrams to solve mathematics word problems.Learn. Disabil. Q.36145–160. 10.1177/0731948712438558
85
VogelS. E.De SmedtB. (2021). Developmental brain dynamics of numerical and arithmetic abilities.NPJ Sci. Learn.61–11. 10.1038/s41539-021-00099-3
86
WijeakumarS.HuppertT. J.MagnottaV. A.BussA. T.SpencerJ. P. (2017). Validating an image-based fNIRS approach with fMRI and a working memory task.NeuroImage147204–218. 10.1016/j.neuroimage.2016.12.007
87
XuJ.ZhongB. (2018). Review on portable EEG technology in educational research.Comput. Hum. Behav.81340–349. 10.1016/j.chb.2017.12.037
88
YamayaN.TsuchiyaK.TakizawaI.ShimodaK.KitazawaK.TozatoF. (2021). Effect of one-session focused attention meditation on the working memory capacity of meditation novices: A functional near-infrared spectroscopy study.Brain Behav.111–11. 10.1002/brb3.2288
89
YonelinasA. P.RanganathC.EkstromA. D.WiltgenB. J. (2019). A contextual binding theory of episodic memory: systems consolidation reconsidered.Nat. Rev. Neurosci.20364–375. 10.1038/s41583-019-0150-4
90
ZahnerD.CorterJ. E. (2010). The process of probability problem solving: Use of external visual representations.Math. Think. Learn.12177–204.
91
ZhangJ. (1997). The nature of external representations in problem solving.Cogn. Sci.21179–217. 10.1016/S0364-0213(99)80022-6gan image-based fNIRS appr
92
ZhangJ.NormanD. A. (1994). Representations in distributed cognitive tasks.Cogn. Sci.1887–122. 10.1207/s15516709cog1801_3
Summary
Keywords
self-constructed diagrams, mathematics education, problem solving, tables and arrays, brain imaging, functional near-infrared spectroscopy (fNIRS), learning strategy use, working memory
Citation
Ayabe H, Manalo E, Hanaki N, Fujita H and Nomura M (2022) Brain imaging provides insights about the interaction between instruction and diagram use for mathematical word problem solving. Front. Educ. 7:893829. doi: 10.3389/feduc.2022.893829
Received
10 March 2022
Accepted
23 September 2022
Published
21 October 2022
Volume
7 - 2022
Edited by
Antonio P. Gutierrez de Blume, Georgia Southern University, United States
Reviewed by
Yuri Sato, The University of Tokyo, Japan; Shogo Kajimura, Tamagawa University, Japan
Updates
Copyright
© 2022 Ayabe, Manalo, Hanaki, Fujita and Nomura.
This is an open-access article distributed under the terms of the Creative Commons Attribution License (CC BY). The use, distribution or reproduction in other forums is permitted, provided the original author(s) and the copyright owner(s) are credited and that the original publication in this journal is cited, in accordance with accepted academic practice. No use, distribution or reproduction is permitted which does not comply with these terms.
*Correspondence: Hiroaki Ayabe, ayabe@academion.com
This article was submitted to Educational Psychology, a section of the journal Frontiers in Education
Disclaimer
All claims expressed in this article are solely those of the authors and do not necessarily represent those of their affiliated organizations, or those of the publisher, the editors and the reviewers. Any product that may be evaluated in this article or claim that may be made by its manufacturer is not guaranteed or endorsed by the publisher.