Paper-based and computer-based admission tests for medicine – are they equivalent?
 Malvin Escher1,2*
  Daniel Weppert3
  Dorothee Amelung2 Thorben Huelmann4
  Stephan Stegt2
  Johanna Hissbach4
- 1Department of Psychology, Heidelberg University, Heidelberg, Germany
- 2Medical Faculty, Heidelberg University, Heidelberg, Germany
- 3Institute for Test Development and Talent Research, ITB Consulting GmbH, Bonn, Germany
- 4Department of Biochemistry and Molecular Cell Biology, University Medical Center Hamburg-Eppendorf (UKE), Hamburg, Germany
Admission tests are among the most widespread and effective criteria for student selection in medicine in Germany. As such, the Test for Medical Studies (TMS) and the Hamburg Assessment Test for Medicine, Natural Sciences (HAM-Nat) are two major selection instruments assessing applicants’ discipline-specific knowledge and cognitive abilities. Both are currently administered in a paper-based format and taken by a majority of approximately 40,000 medicine applicants under high-stakes conditions yearly. Computer-based formats have not yet been used in the high-stakes setting, although this format may optimize student selection processes substantially. For an effective transition to computer-based testing, the test formats’ equivalence (i.e., measurement invariance) is an essential prerequisite. The present study examines measurement invariance across test formats for both the TMS and HAM-Nat. Results are derived from a large, representative sample of university applicants in Germany. Measurement invariance was examined via multiple-group confirmatory factor analysis. Analyses demonstrated partial scalar invariance for both admission tests indicating initial evidence of equivalence across test formats. Generalizability of the results is examined, and implications for the transition to computer-based testing are discussed.
1. Introduction
In higher education, academic disciplines like medicine tend to have far more study applicants than available study places. Inevitably, thorough student selection becomes necessary. In Germany, allocating university admission spots must, in principle, follow the criterion of aptitude (Bundesverfassungsgericht [BVerfG], 2017). To meet this objective, various selection criteria have been used over the past few years, ranging from easily accessible measures like high school grade point average (GPA) to more complex criteria like situational judgement tests, multiple mini-interviews, or admission tests (Schwibbe et al., 2018). The latter are predominantly used to capture applicants’ cognitive abilities and, thus, predict academic achievement above conventional measures like GPA (e.g., Schult et al., 2019).
Traditionally, admission tests were conducted in a paper-based format. However, using a computer-based format has several advantages over the traditional approach. Although dependent on the type of computer-based testing (e.g., pre-assembled test forms vs. computer-adaptive tests), some of these advantages seem to be overarching. For example, computer-based testing has the clear benefit of faster administration, processing, and delivery of test results to test takers and examination institutions (Kikis-Papadakis and Kollias, 2009). Further, computer-based testing can be more sustainable (e.g., reduced logistics) and offer cost advantages (Farcot and Latour, 2009). Considering these benefits, it may seem attractive for institutions to transition to a computer-based test format, and several large-scale assessments in admission, like the Medical College Admission Test (MCAT) or University Clinical Aptitude Test (UCAT), are already conducted in a computer-based format. However, if results from different test formats are meant to be compared, ensuring equivalence between these formats is essential. Testing standards, like the Standards for Educational and Psychological Testing (American Educational Research Association et al., 2014), require the documentation of psychometric properties of different test formats and direct proof of score comparability. These requirements can be adequately met by examining measurement invariance across different test formats.
Measurement invariance is given if a scale’s measurement properties are stable between two or more groups. Groups may be defined by participants’ characteristics (e.g., academic degree), measurement points, or, as in the present study, different conditions (i.e., paper-based vs. computer-based format). Only in the case of a scale’s measurement invariance, meaningful comparisons of statistics, such as mean scores and regression coefficients between groups, are feasible (Chen, 2008). If the measurement invariance of a scale is examined, it is not simply a question of whether the scale is invariant or not, but multiple levels of invariance can be distinguished (e.g., Vandenberg and Lance, 2000). The most prevalent way to examine these levels, based on classical test theory, is to use multiple-group confirmatory factor analysis. Briefly summarized, four hierarchical steps are administered to examine the degree of invariance (e.g., Putnick and Bornstein, 2016). First, the most basic level of invariance is tested, which is known as configural invariance. Configural invariance tests whether the factorial structure of a predetermined model is similar between groups. No other equality constraints are made, and values of parameters within the model may vary. Second, metric invariance is tested by constraining factor loadings between latent and manifest variables to be equal across groups. Third, scalar invariance is tested. In addition to constraining factor loadings, item intercepts are hold equal across groups as well. If scalar invariance is established, latent variable mean scores can be compared meaningfully between groups (Vandenberg, 2002). Lastly, the most restrictive level of invariance is tested, known as strict invariance. In this step, residual variances are also fixed across groups. Only if residual invariance is established, the latent constructs are measured identically across groups. However, if differences in latent mean scores or factorial structure are of interest, strict invariance is not required (Pendergast et al., 2017) and is therefore omitted in further analyses.
In case of admission tests, assessing the measurement invariance between paper-based and computer-based formats is of particular importance. This is mainly due to the fact that test results in many academic disciplines can be used for admission over several years and, therefore, applicants with test scores from different test years apply simultaneously. In case the test modality of a selection criterion changes from a paper-based to a computer-based format from one year to the next, a sufficient level of measurement invariance (i.e., scalar or strict invariance) must be established to allow applicants’ scores to be compared adequately. A lower level of measurement invariance would compromise the fairness of the selection criterion because applicants with an identical ability level would not necessarily obtain identical test scores in different test modalities.
Several meta-analytical studies suggest that the effects of test modalities on cognitive ability seem to be marginal to nonexistent (e.g., Mead and Drasgow, 1993; Wang et al., 2008), although heterogonous findings have been reported. However, many reviewed studies are based on manifest approaches like the comparisons of mean scores. Schroeders (2009) pointed out that a mere comparison of mean differences of manifest or latent scores to assess equivalence is insufficient. Instead, advanced methods based on confirmatory factor analysis (CFA) and item response theory (IRT) models are required to test adequately for equivalence. Empirical evidence on the equivalence of cognitive abilities across test modalities based on such advanced methods is drastically reduced, and existing studies (e.g., Schroeders and Wilhelm, 2011; Bailey et al., 2018; Vermeent et al., 2022) vary considerably regarding their design, method of equivalence testing, and cognitive ability examined. Thus, results cannot be easily compared, and equivalence (i.e., measurement invariance) should be investigated on a case-by-case basis. Bailey et al. (2018) explicitly caution against implementing computer-based formats without testing for measurement invariance. This is particularly important for cognitive ability tests used in the field of student selection, where test results influence the lives of test-takers and often determine an individual’s future career path.
In the present study, we seek to examine the measurement invariance between traditional paper-based and computer-based formats of cognitive ability tests used as selection criteria for the study of medicine. For this purpose, we investigate the two major admission tests used by universities in Germany: (1) the Test für medizinische Studiengänge (TMS; en. Test for Medical Studies) and (2) the Hamburger Naturwissenschaftstest (HAM-Nat; en. Hamburg Assessment Test for Medicine, Natural Sciences). Approximately 70% of all available university places, after deduction of preliminary quotas, are affected by the score in the TMS or HAM-Nat, and the number of annual test-takers amounts to over 30,000 and 2,000, respectively. Both tests are currently administered in a paper-based format and, in the future, may transition to a computer-based format. Following recommendations reiterated by many scholars, we investigate the measurement invariance between these two test modalities before the implementation of the computer-based format in order to justify its use in a high-stakes setting. In view of the considerable importance of both tests in the selection process in Germany, an unbiased assessment is not only desirable but urgently needed. Additionally, we seek to provide further support for the measurement invariance of cognitive ability tests across test modalities, as previous findings are heterogeneous.
2. Methods
2.1. Materials
2.1.1. TMS
The TMS is a psychometric aptitude test measuring cognitive abilities relevant to the medical field. The test consists of eight subtests (e.g., comprehension and analysis of longer schoolbook-like texts, and mental rotation of three-dimensional objects), and the overall test time amounts to 5 h and 7 min. In the present study, solely the core subtests of the TMS (Trost et al., 1998) were included: Medizinisch naturwissenschaftliches Grundverständnis (MNGV; en. Basic Medical and Scientific Understanding), Quantitative und formale Probleme (QFP; en. Quantitative and Formal Problems), Textverständnis (TV; en. Text Comprehension), and Diagramme und Tabellen (DUT; en. Diagrams and Tables). An overview of these subtests, including a brief description, is listed in Table 1.
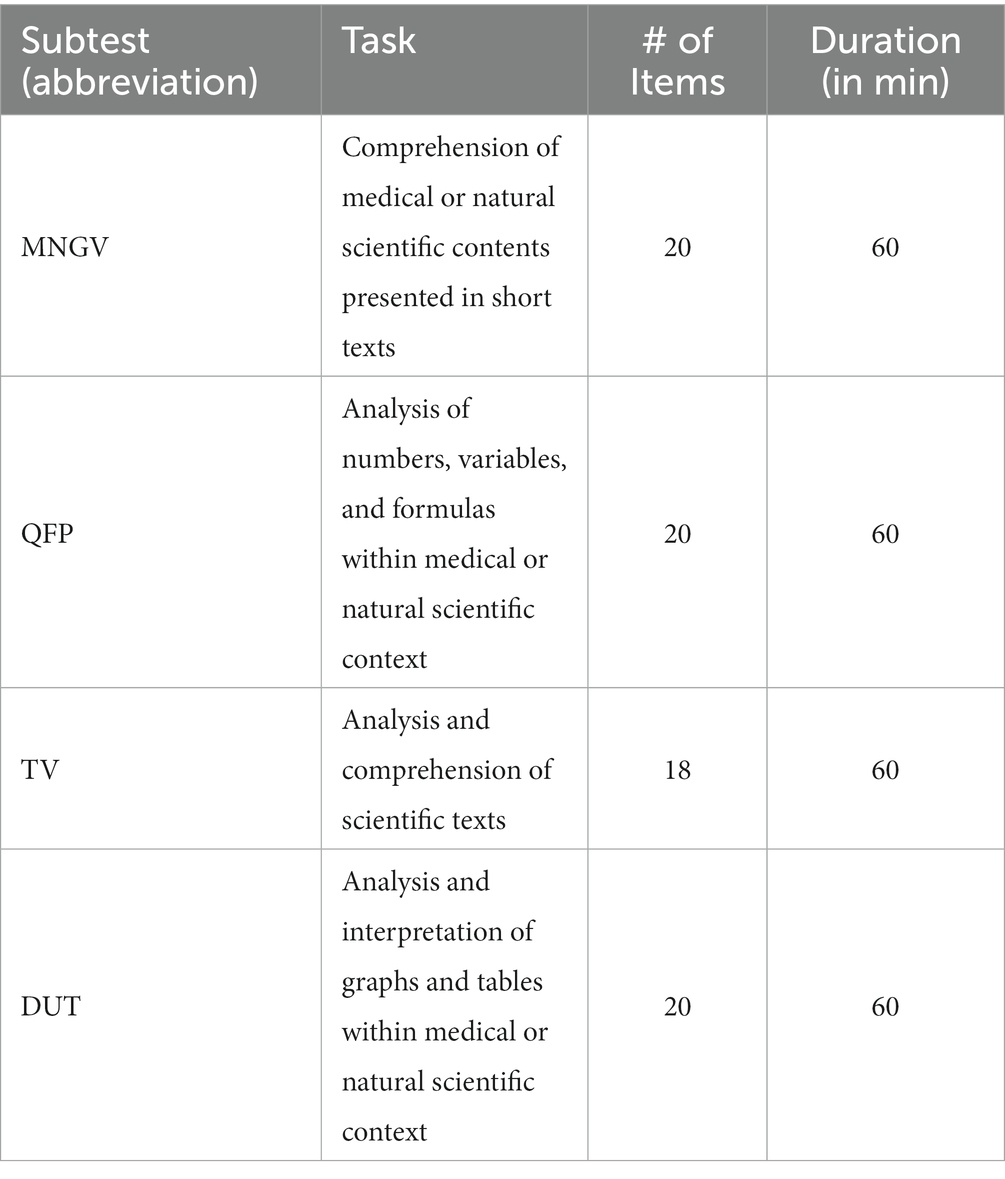
Table 1. Overview of examined TMS subtests.
In 2021, the paper-based test was used as a selection criterion by 37 universities. Overall, four parallel versions (version A, B C, and D) of the TMS were used on four different test days in that year. All versions were included in the analyses and were used to split the total sample for validation purposes.
2.1.2. HAM-Nat
The HAM-Nat test is a multiple-choice ability test including a natural science knowledge part (Nat) and three reasoning tests (numerical, verbal, and figural reasoning). Again, we only included the core of the test (i.e., the Nat-subtest). The Nat-subtest, which has been used for 15 years, consists of questions drawn from a published item bank with approximately 900 items.1 Therefore, it was possible to compare the item parameters of the items used in the computer-based format with those from the paper-based format. This, however, was not possible for the three reasoning subtests that were only recently added to the HAM-Nat. Items of the Nat-subtest consist of an item stem, four distractors, and one correct answer. Test participants have 90 min to answer the 60 items test, which has been designed to maximize discrimination in the upper quarter. Thus, the test is rather difficult. The current list of topics is available online at UKE - Prodekanat für Lehre.
2.2. Procedure
Six weeks prior to the high-stakes test dates of TMS and HAM-Nat, applicants were contacted and invited to a computer-based preparation study. As an incentive, participants in both preparation studies were given the opportunity to use the study content in preparation for the high-stakes test. Participation in both preparation studies was permitted. For reasons of feasibility, both preparation studies were administered in an unproctored setting.
The computer-based tests were designed to be as similar as possible to the respective paper-based test. Test parts were time-limited accordingly, but in contrast to the high-stakes condition, participants were allowed to take breaks between test parts. All items were transferred to fit on one single screen and were scored dichotomously (right/wrong).
Additional arrangements were introduced to ensure maximum similarity between the paper-based and computer-based format. First, participants were instructed to emulate a high-stake test situation (e.g., quiet environment, sufficient time frame). Second, participants were given the opportunity to go back and forth within each subtest to review and change previous answers. Third, test parts of the TMS were presented in the same order as in the paper-based condition. Last, immediate feedback in terms of percentiles was provided to maximize participants’ motivation in the low-stakes setting (i.e., computer-based test format) and, therefore, enhancing participants’ efforts to do their best. By doing so, participants were given the opportunity to receive rather accurate information about their performance level as well as their chances for admission.
2.3. Study design and participants
We investigated measurement invariance across test modalities in two separate studies, one for each admission test (i.e., TMS and HAM-Nat). The studies were done as part of the research cooperation network Studierendenauswahl-Verbund (stav; en. student selection network2) funded by the German Federal Ministry of Education and Research. All participants of TMS and HAM-Nat in 2021 were invited to participate in the computer-based preparation tests. Participation was voluntary and all participants gave written informed consent.
2.3.1. Study 1 (TMS)
In a within-subjects design, participants first completed the computer-based test and six weeks later the paper-based format. The latter was used as a selection criterion for the study of medicine in 2021. For confidentiality reasons, a previously administered version of the TMS was used in the computer-based format (ITB Consulting GmbH, 2019).
A total of n = 4,529 applicants to medical schools in Germany completed the computer-based TMS amounting to approximately 28.1% of the original TMS cohort. Of those participants with both computer-based and paper-based test data, n = 3,044 (18.9%) were included in the analysis. Participants were excluded if they did not answer at least one item correctly in one or more subtests in the computer-based format (n = 1,142) to ensure that an appropriate amount of time on the low-stakes test was spent (e.g., Attali, 2016). Further, due to loss of data in the paper-based format, n = 343 participants were excluded as well. Within the final sample, n = 2,205 (72.4%) identified as female. Participants’ age ranged from 18 to 52 (Mage = 19.6; SDage = 2.6).
2.3.2. Study 2 (HAM-Nat)
In a between-subjects design, participants of the HAM-Nat in 2021 were invited to the computer-based study. All 60 items used in this study were assembled from the published item bank (as described in section 2.1.2) and, therefore, have been used in the high-stakes paper-based setting over the previous years. To form a comparable sample of test-takers who took the paper-based test, only test-takers who had completed at least 55 of the 60 items used in the computer-based study were selected. Due to this procedure, missing data was induced in the paper-based sample and imputed by logistic regression (Van Buuren, 2018). For the imputation, all remaining items were used to predict missing answers to items. To increase the sample size and enhance generalizability, not only test-takers of the cohort of 2021 were included, but of the cohorts of 2010 to 2021 instead.
A total of n = 660 applicants (27.5% of the original HAM-Nat cohort) participated in the computer-based study of the HAM-Nat. Again, participants who did not answer any item correctly (n = 4) were excluded, resulting in a final sample of n = 656 participants. Within this sample, n = 463 (71.7%) identified as female and participants’ age ranged from 18 to 27 (Mage = 20.7; SDage = 2.1). The final sample of the paper-based format included N = 844 participants. For the paper-based format, due to the sampling technique, sample characteristics were not available. However, the 2021 test-takers showed comparable demographic details as the computer-based sample (Mage = 20.8; SDage = 2.8; 71.0% identified as female).
2.4. Data analysis
We tested for measurement invariance by multiple-group confirmatory factor analysis. To evaluate the fit between hypothesized models and observed data, we followed recommendations of Jackson et al. (2009) by reporting several fit indices and relying on alternative fit indices. Specifically, we based evaluation of model fit on the chi-square value, associated degrees of freedom and probability values, the comparative fit index (CFI) as an index to describe the incremental fit, and the root mean square error of approximation (RMSEA) and its associated confidence intervals as well as the standardized root mean squared residual (SRMR) as residual-based measures. As suggested by Hu and Bentler (1999), we assumed an acceptable model fit if CFI ≥ 0.950, RMSEA ≤ 0.060, and SRMR ≤ 0.080.
To assess the level of measurement invariance, we compared increasingly restrictive models. To establish the next higher level of invariance, a change of CFI (∆CFI) < 0.010 paired with a change of RMSEA (∆RMSEA) < 0.015 and a change of SRMR (∆SRMR) < 0.030 for metric invariance and < 0.015 for scalar invariance is required (Chen, 2007). In case of violation of full measurement invariance in any of the steps, we tested for partial invariance by sequentially releasing constraints beginning with the highest modification index (Yoon and Kim, 2014).
As item-level multiple-group confirmatory factor analyses of the TMS models yielded some improper solutions (i.e., Heywood cases) and some models did not converge, we used parcels as indicators of latent factors instead of items. The practice of item parceling is widely used in confirmatory factor analysis (Williams and O’Boyle, 2008) and measurement invariance testing. However, some researchers have raised concerns regarding its use, such as biased estimates of model parameters (e.g., Bandalos, 2008; Little et al., 2013). Therefore, it is commonly agreed that item-level analysis should be preferred over parcel-level analysis when data is well-suited. To avoid malpractice, we followed established recommendations by Little et al. (2013) and parceling strategies by Matsunaga (2008). More specifically, we applied random methods of combining items into parcels if a scale was unidimensional and an internal-consistency method (e.g., Kishton and Widaman, 1994) if a scale was multidimensional. The latter approach aims to capture similar facets of the structure into the same parcel. Before applying both methods, it is, however, important to empirically scrutinize and understand the dimensionality of the TMS’ subtests. In the context of item parceling, Matsunaga (2008) recommends using confirmatory factor analysis for this purpose. Consequently, we proceeded by imposing a 1-factor model on each of the MNGV-, QFP-, and DUT-subtest. For the TV-subtest, however, a 3-dimensional structure meets theoretical assumptions best, as six items refer to one of three different texts, respectively, and therefore represent a testlet. For each subtest, the conceptualized structure fitted the data well. Next, items were assigned to parcels. As recommended by Matsunaga (2008), we utilized three parcels per latent factor. For the MNGV-, QFP-, and DUT-subtest, we randomly assigned each item to one of the parcels without replacement. Thus, an unequal number of items per parcel was used (i.e., two 7-item parcels and one 6-item parcel). As we established a 3-factor model for the TV-subtest, we used three 6-item parcels representing one factor each. Lastly, we checked for normality of parcels. Distribution of all parcels was excellent.
All statistical analyses were carried out with the statistics software R (R Core Team, 2020). Multiple-group confirmatory factor analyses were performed with the R packages semTools (v0.5-6; Jorgensen et al., 2022) and lavaan (v0.6-12; Rosseel, 2012). For item-level multiple-group confirmatory factor analysis, we used weighted least squares means and variance adjusted (WLSMV) estimation as data was dichotomous (Beauducel and Herzberg, 2006). For parcel-level multiple-group confirmatory factor analysis, we used robust maximum likelihood (MLR) estimation. Imputation of missing data was conducted using the multivariate imputation by chained equations technique available in the mice package in R (v3.16.0; Van Buuren and Groothuis-Oudshoorn, 2011).
2.4.1. Validation
To assess the generalizability of the results, the TMS sample was split in four sub-samples, and analyses were repeated within each sub-sample. The allocation of participants to sub-samples was based on the respective version used in the paper-based test (i.e., versions A, B, C, or D). Test versions used in the computer-based format were identical in all sub-samples. Sample characteristics and descriptive statistics of each sub-sample are reported in the Supplementary Tables 1–9. No noticeably large differences between sub-samples were observed.
For the validation process, sub-sample A was used as a calibration sample, as it provided the largest sample size. Then, in a first step, multiple psychometric models were evaluated (see section 3.2) to establish an appropriate baseline model. Next, measurement invariance analyses, as described in section 2.4, were conducted. Sub-samples B, C, and D served as validation samples. Within each of these sub-samples, the model derived from the analysis in sub-sample A was adopted and additional measurement invariance analyses were conducted. Results of the latter were compared with results of the analysis in calibration sample A.
An identical approach was used to validate the results of the HAM-Nat. The model did not, however, converge in both, the calibration and the validation sample. Consequently, validation analyses were omitted.
3. Results
3.1. Descriptive statistics
Descriptive statistics of the TMS and HAM-Nat separated by test modality are summarized in Table 2. Participants correctly answered just over half of the items across all subtests in the paper-based format of the TMS (M = 46.43, SD = 11.43) as well as in the computer-based format of the TMS (M = 46.15, SD = 12.08). Only three out of 3,044 participants correctly answered all items in the computer-based format, while no participant correctly answered all items in the paper-based format. Therefore, ceiling effects can be ruled out. Participants who took the paper-based HAM-Nat correctly answered M = 26.10 (SD = 11.08) out of 60 items. In the computer-based format of the HAM-Nat, participants correctly answered M = 33.33 (SD = 13.59) items. Again, there were no ceiling effects.

Table 2. Descriptive statistics of paper-based and computer-based TMS and HAM-Nat formats.
To estimate reliability, we used Cronbach’s alpha (α), reflecting a lower bound of reliability estimation, and McDonald’s omega (ω) to correct for a potential underestimation bias of α when assumptions of tau-equivalence are violated (Dunn et al., 2014). For the TMS, all subtests showed acceptable values of McDonald’s omega (Cronbach’s alpha), with reliability estimates ranging between 0.68 ≤ ω ≤ 0.75 (0.66 ≤ α ≤ 0.74) for the paper-based format and between 0.71 ≤ ω ≤ 0.77 (0.69 ≤ α ≤ 0.75) for the computer-based format. Estimated over all of the presently examined subtests, reliability values were high both for the paper-based format (ω = 0.88; α = 0.89) and the computer-based format (ω = 0.90; α = 0.90). Similarly, reliability estimates for the HAM-Nat were high both for the paper-based format (ω = 0.90; α = 0.90) and the computer-based format (ω = 0.94; α = 0.94).
The correlations between TMS subtests across both test modalities are presented in Table 3. All correlations were significant and substantial between TMS subtests within the paper-based format (0.52 ≤ r ≤ 0.64) and the computer-based format (0.47 ≤ r ≤ 0.64).
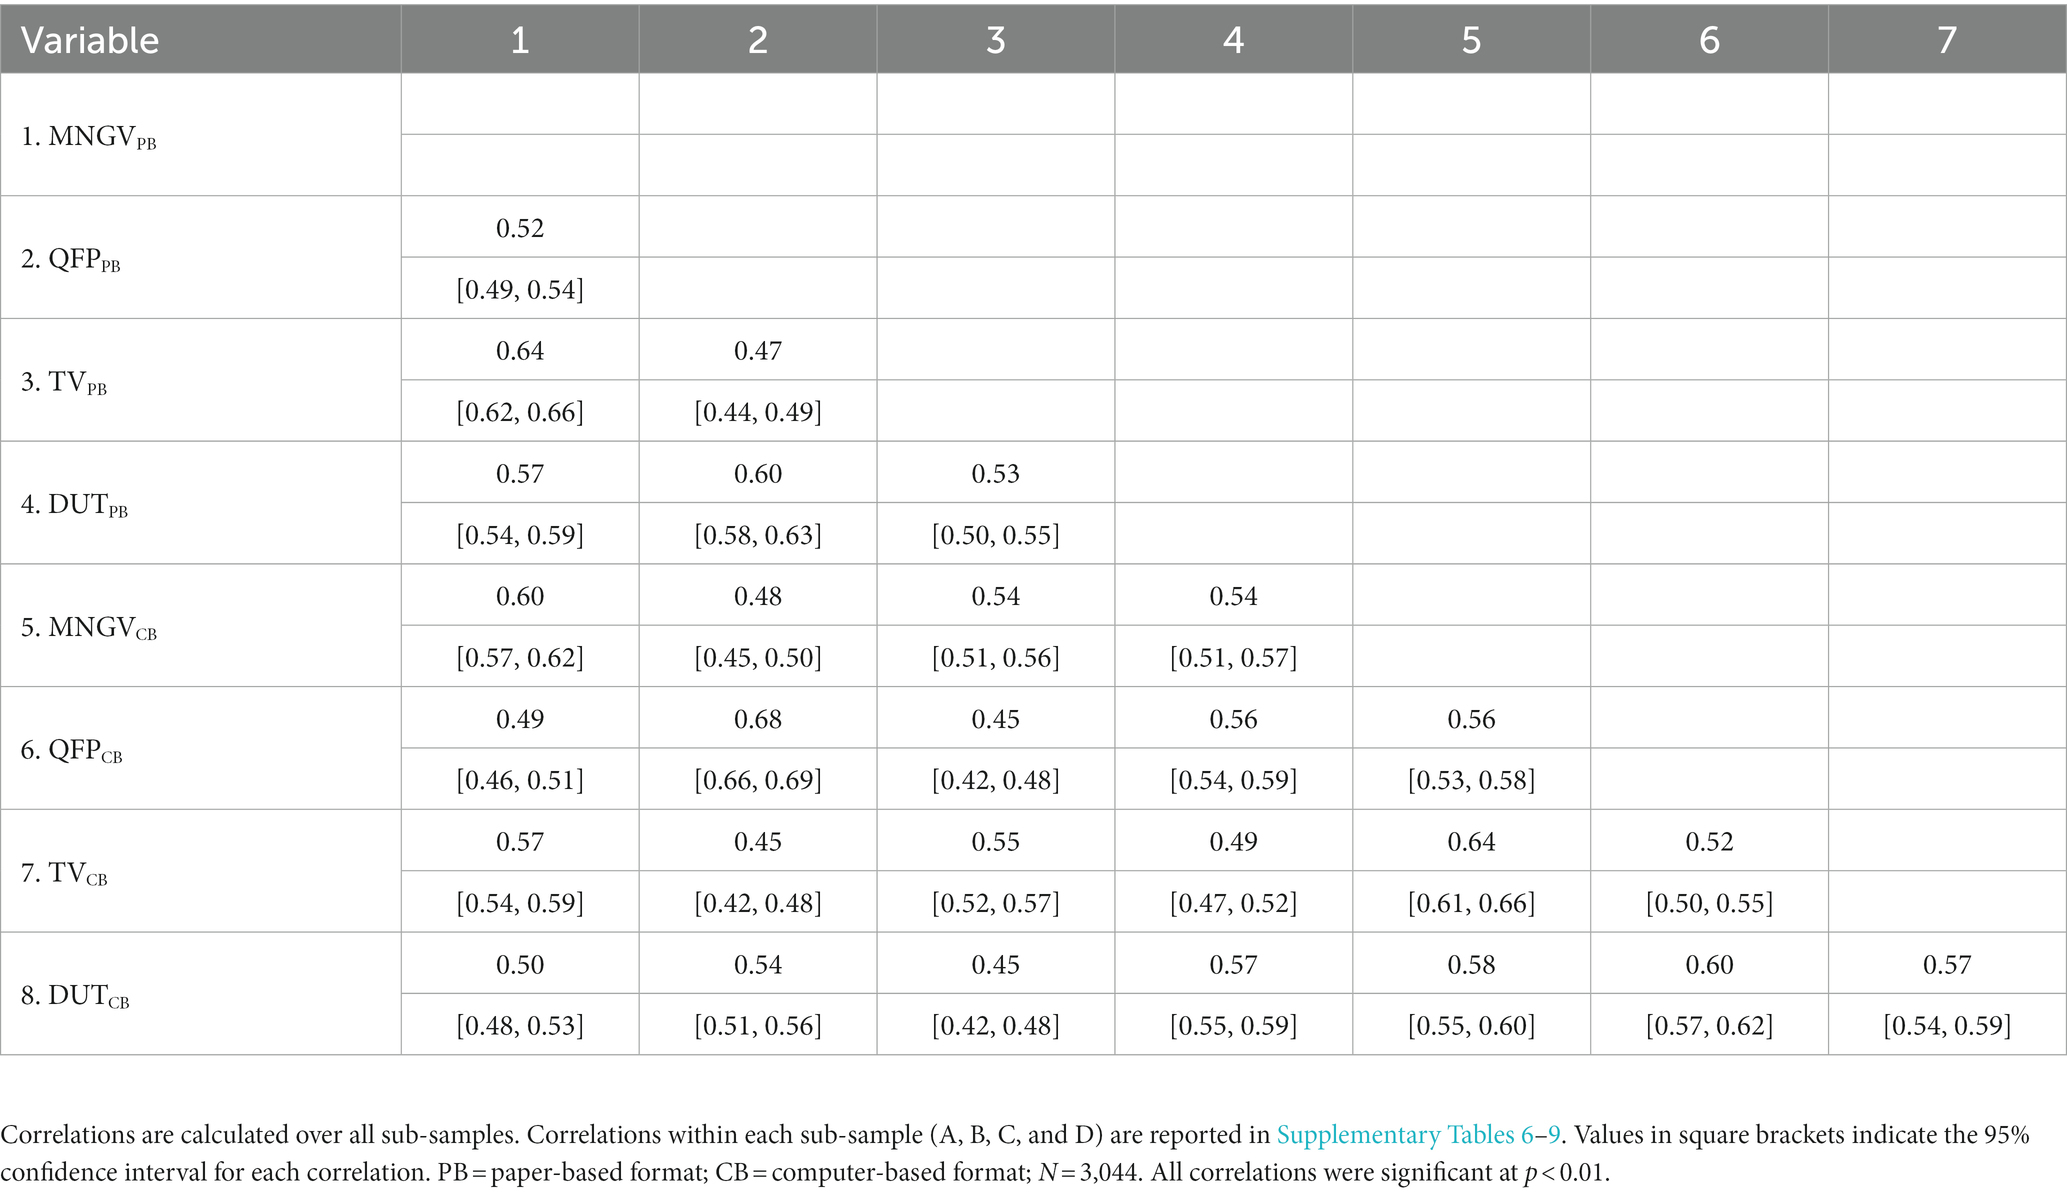
Table 3. Pearson correlations of TMS subtests.
3.2. Baseline models and single-group CFAs
Prior to the measurement invariance analyses, three different TMS models were compared to establish an appropriate longitudinal baseline model in the calibration sample: first, a general factor model, in which all parcels were specified to load on a single factor, second, a higher-order model with four first-order factors (i.e., one for each TMS subtest), which were specified to load on a single second-order factor, and third, a common-factor model with four correlated factors. Again, all parcels of the same TMS subtest were specified to load on one of the four factors. In contrast to the TMS, there is no theoretical justification for using a higher-order or common-factor model to analyse the HAM-Nat, as the test is constructed without subtests. Therefore, we continued the analysis with a general factor model.
Table 4 shows the model fit of the TMS baseline models in the calibration sample. Since the TMS general factor model did not show an adequate fit (CFI = 0.772, RMSEA = 0.100, SRMR = 0.062), it was not considered for further analyses. However, a good model fit was observed for both the TMS common-factor model (CFI = 0.986, RMSEA = 0.026, SRMR = 0.029) and the TMS higher-order model (CFI = 0.967, RMSEA = 0.039, SRMR = 0.046). Despite the common-factor model showing a significantly better fit (Δχ2 = 257.23, Δdf = 19, p < 0.001), the higher-order model was chosen for all subsequent analyses because a) it is the theoretically more plausible model and b) it also showed an acceptable fit according to our cut-off criteria. The final longitudinal TMS model is depicted in Figure 1. Parameter estimates are reported in Supplementary Table 10. Correlations of residual variances between parcels of the paper-based and computer-based format were not significantly different from zero for all but two correlations.
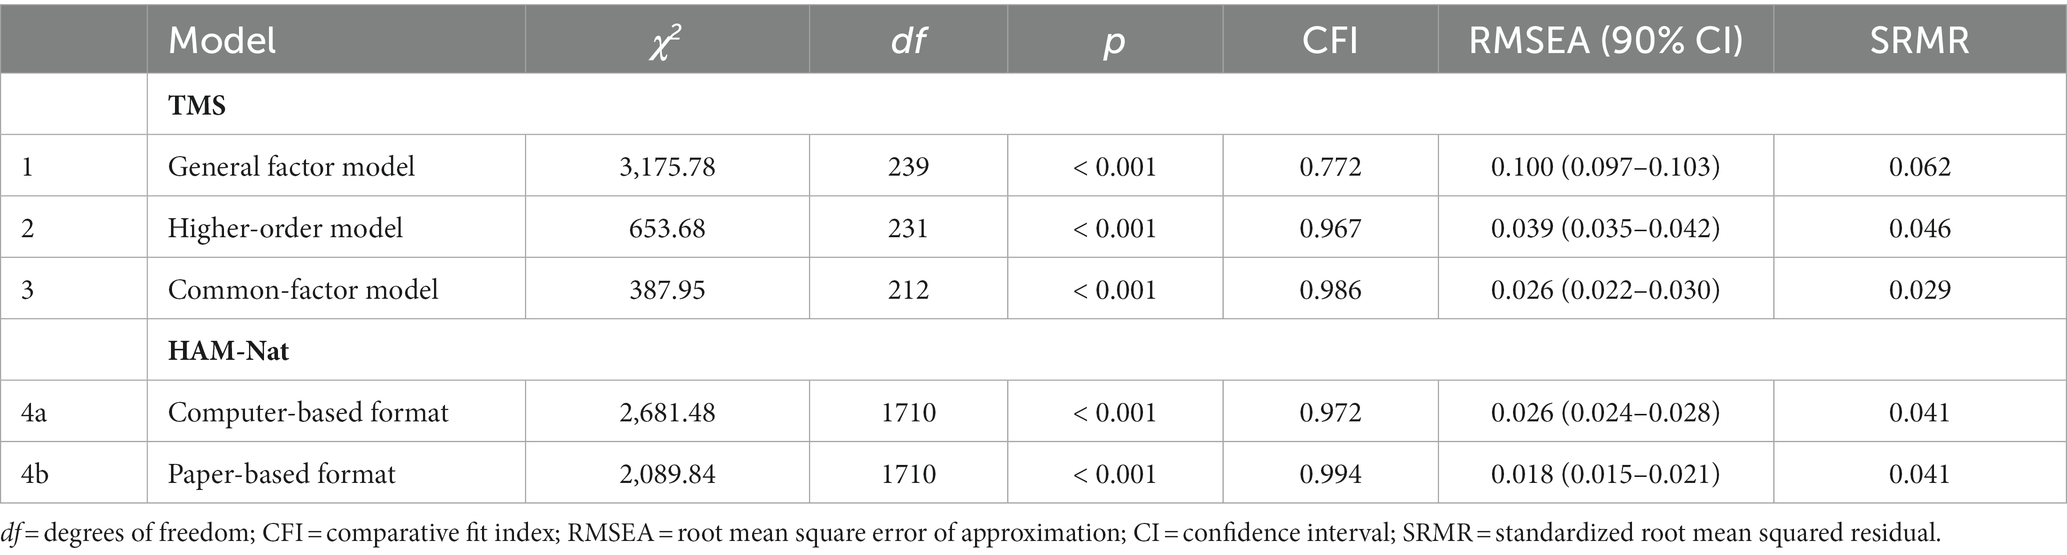
Table 4. Results of TMS baseline model fit in calibration sample A and HAM-Nat model fit separated by test modality.
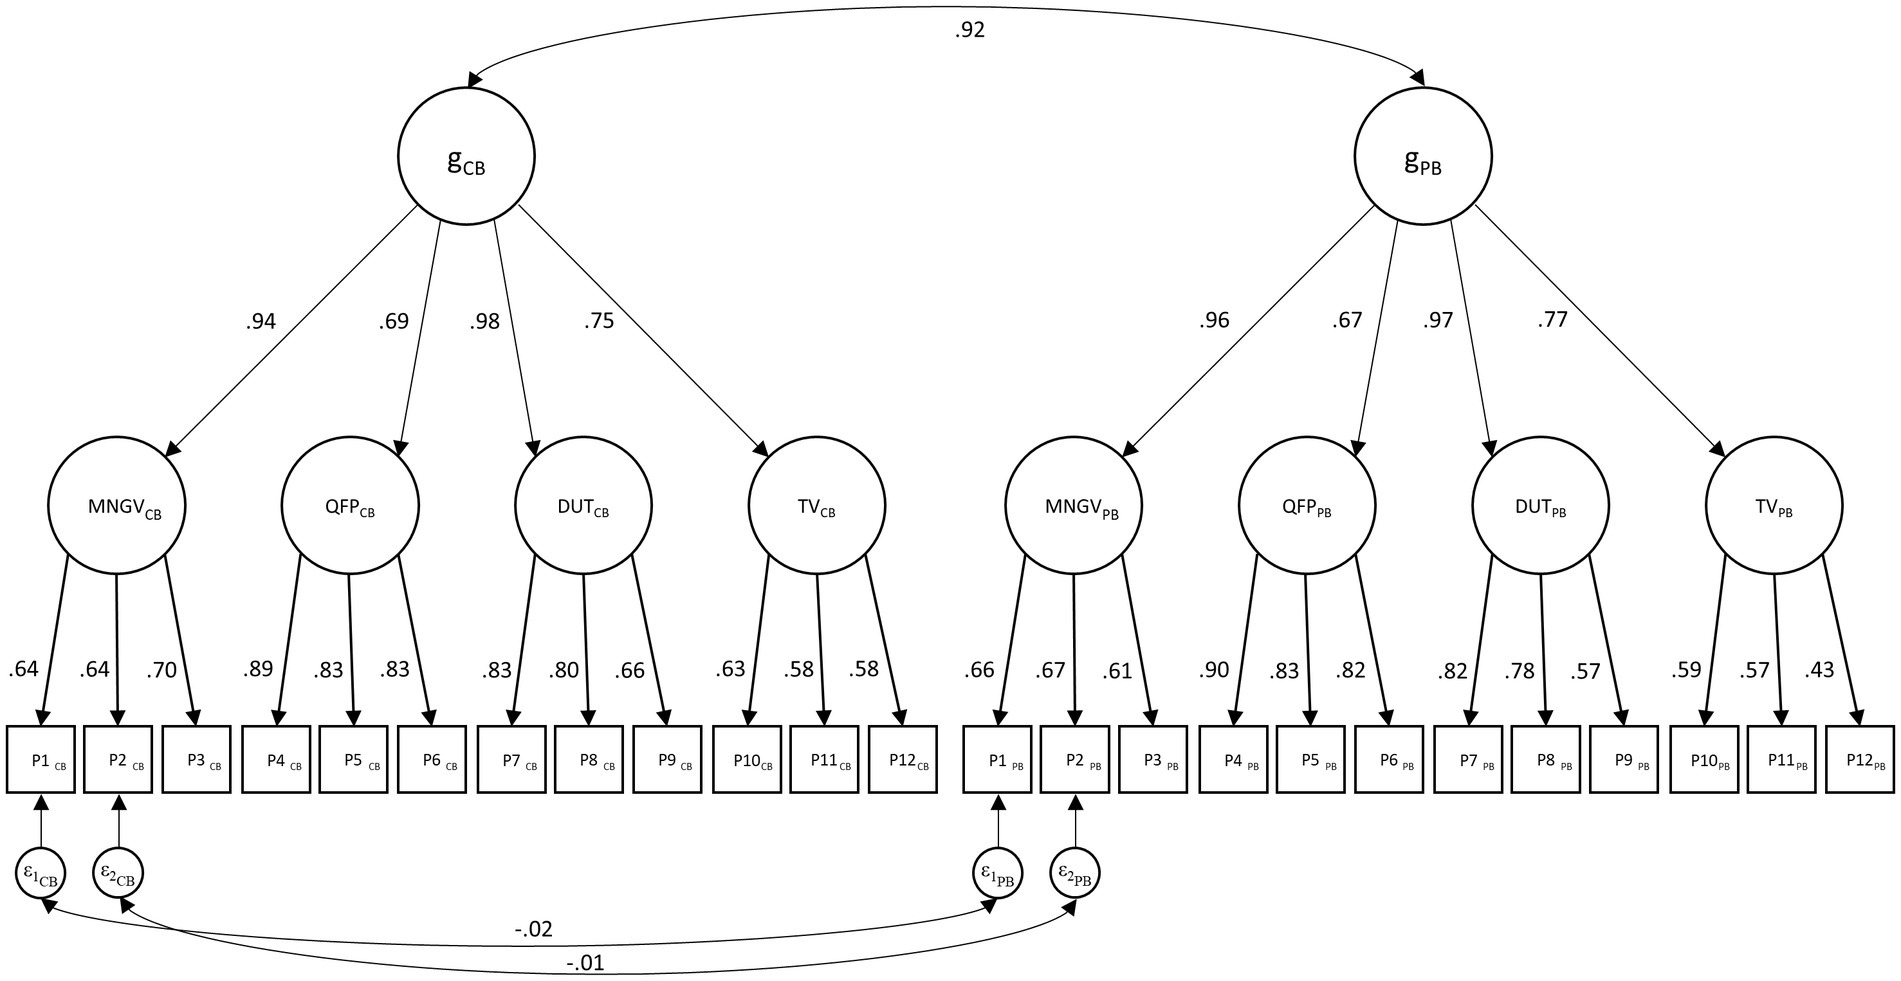
Figure 1. Longitudinal higher-order model of the TMS. PB = paper-based format; CB = computer-based format. For reasons of clarity only two correlated residuals across test modalities were displayed.
According to Pendergast et al. (2017), an important preliminary step to test for measurement invariance is to ensure that the respective model has at least an adequate fit for each group (i.e., test format). Due to the within-subjects design, this step is not necessary for the TMS model but only for the HAM-Nat model. The HAM-Nat model showed an excellent model fit for the paper-based format (CFI = 0.994, RMSEA = 0.018, SRMR = 0.041) and for the computer-based format (CFI = 0.972, RMSEA = 0.026, SRMR = 0.041), as indicated in Table 4.
3.3. Measurement invariance testing
Since all preliminary conditions are met, multiple-group confirmatory factor analyses were conducted to assess the level of measurement invariance across paper-based and computer-based formats of both admission tests. Results of the TMS are based on validation sample A. All results are reported in Table 5.
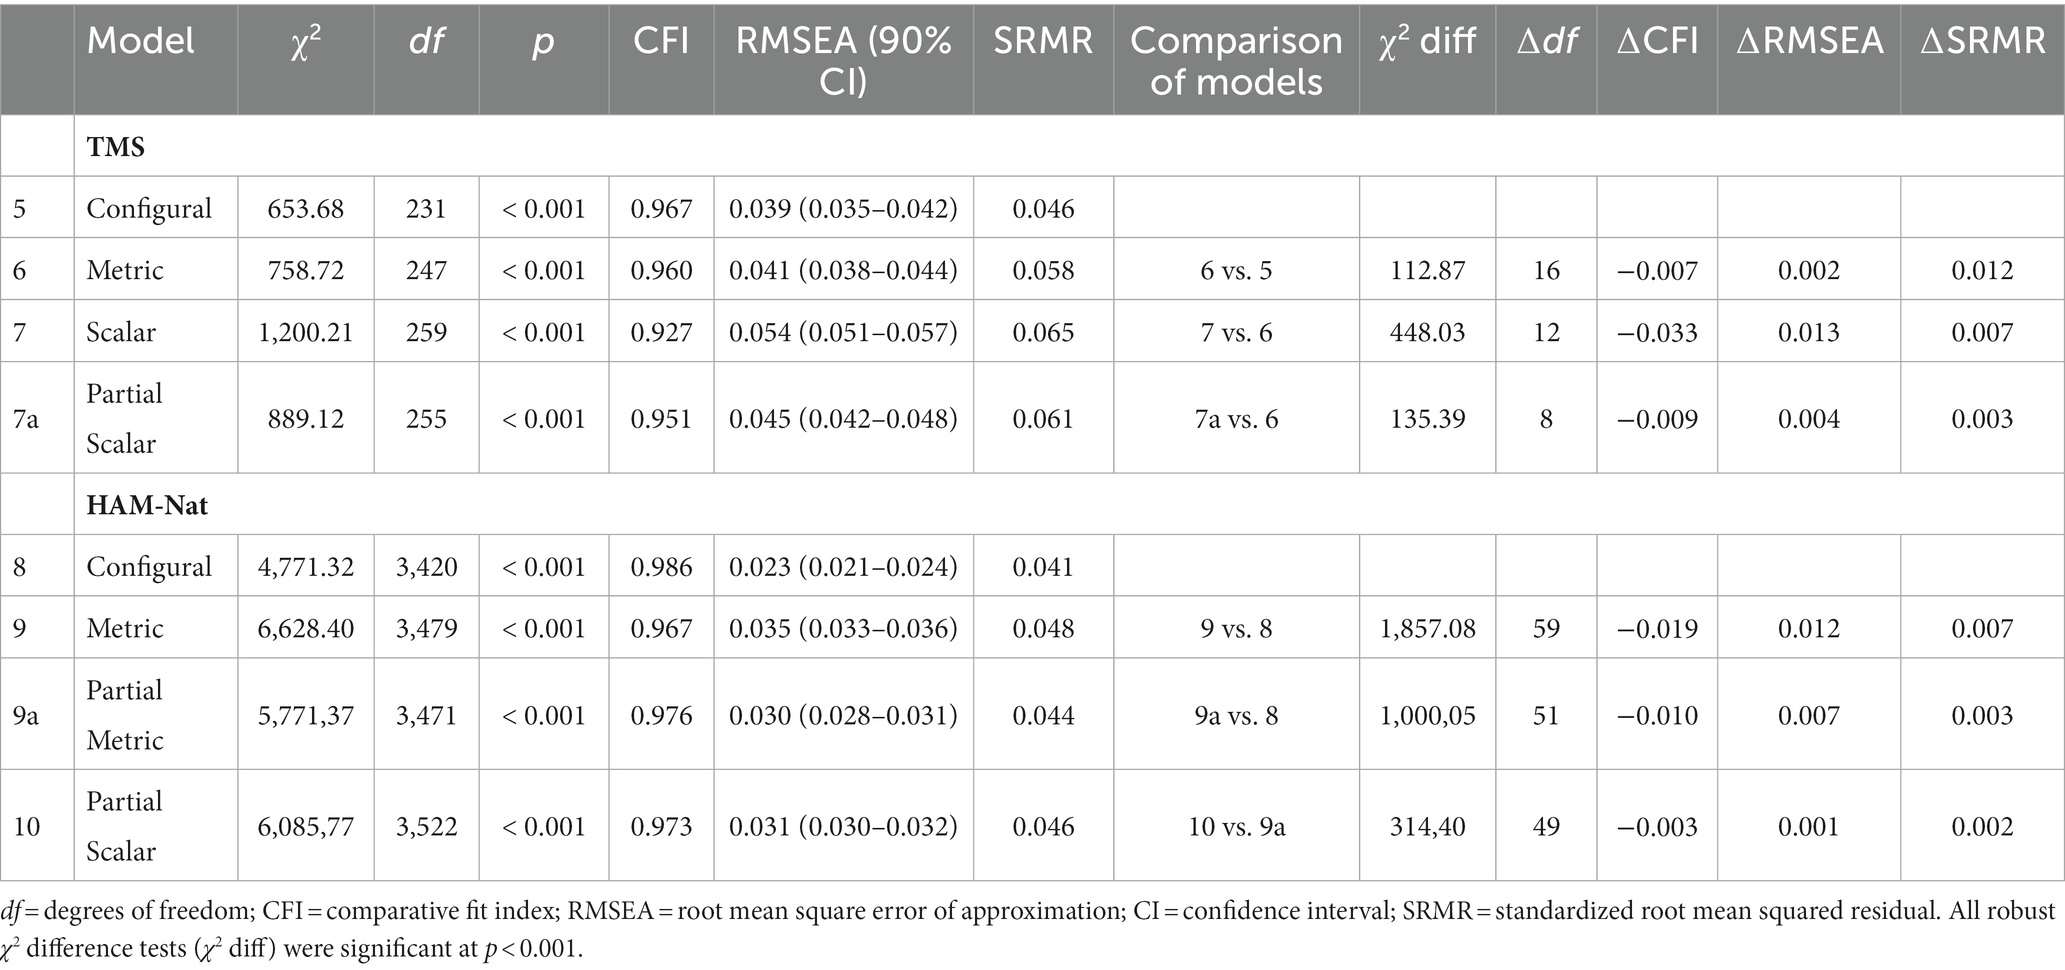
Table 5. Results of testing for measurement invariance across test modalities.
As an appropriate TMS baseline model had already been established, the first step of testing for measurement invariance (i.e., establishing configural invariance) was already taken. Therefore, we proceeded by constraining parcel loadings to be equal across both test modalities resulting in a well-fitting metric model (CFI = 0.960, RMSEA = 0.041, SRMR = 0.058). Cut-off criteria, as described by Chen (2007), were not surpassed (∆CFI = −0.007, ∆RMSEA = 0.002, ∆SRMR = 0.012), supporting metric invariance. We continued the analysis by testing for scalar invariance, in which parcel intercepts are constrained to be equal across test modalities. In this step, the cut-off value of the ΔCFI exceeded the threshold of −0.010 (∆CFI = −0.033). Therefore, full scalar invariance was not supported and we proceeded by testing for partial scalar invariance by releasing constraints in a backward fashion within each subtest. Modification indices suggested that the first parcel of the MNGV-subtest, the second parcel of the QFP-subtest, the third parcel of the TV-subtest, and the third parcel of the DUT-subtest lacked invariance the most. With free estimation of the intercepts of these parcels, the model fitted the data adequately (CFI = 0.951, RMSEA = 0.045, SRMR = 0.061), and the ΔCFI no longer exceeded the threshold of −0.010 (∆CFI = −0.009).
Analyses were conducted similarly for the HAM-Nat general factor model. The baseline model showed an excellent fit (CFI = 0.986, RMSEA = 0.023, SRMR = 0.041), establishing configural measurement invariance. We continued to check for metric invariance. Despite showing a good model fit (CFI = 0.967, RMSEA = 0.035, SRMR = 0.048), the cut-off value for the ΔCFI was surpassed (∆CFI = −0.019). Therefore, we proceeded to establish partial metric invariance by releasing factor constraints. After releasing eight constraints, partial metric invariance was established (∆CFI = −0.010, ∆RMSEA = 0.007, ∆SRMR = 0.003). In a final step, we tested for partial scalar invariance by constraining item intercepts and retaining the constraints applied in the previous step. Without releasing any other constraints, partial scalar invariance was established, as the model fitted the data well (CFI = 0.976, RMSEA = 0.030, SRMR = 0.046), and cut-off criteria were not surpassed (∆CFI = −0.003, ∆RMSEA = 0.001, ∆SRMR = 0.002).
3.3.1. Validation
Results of the measurement invariance analyses of the TMS in validation samples B, C, and D are reported in Table 6. Before conducting the measurement invariance analyses, prerequisites of item parceling were reexamined in each validation sample and successfully met. As established in calibration sample A, the higher-order model was chosen for further analyses and demonstrated good fit in each of the validation samples. Next, measurement invariance analyses were conducted to validate the results found in calibration sample A. In each validation sample, configural and metric invariance were successfully established. However, full scalar invariance was not achieved in any of the validation samples. Consequently, partial invariance was tested by first relaxing the same constraints as in calibration sample A (models 13a, 16a, and 19a). Partial scalar invariance was not achieved for any of these models. However, since different test versions were used in the paper-based format for sub-samples A – D, it is plausible that different parcels are responsible for the lack of scalar invariance in each validation sample. Therefore, additional analyses were conducted to examine whether partial scalar invariance could be achieved by relaxing individual constraints in each validation sample. In sub-sample B, partial scalar invariance could be achieved by relaxing constraints for the intercepts of the second and third TV-parcel as well as the first MNGV-parcel (model 13b). In sub-sample C, no reasonable partial invariance could be achieved as half of all the parcels would have required the intercept constraints to be relaxed. Lastly, partial scalar invariance was achieved in sub-sample D by relaxing constraints for the intercepts of the first and second parcels of MNGV and TV, respectively (model 19b).
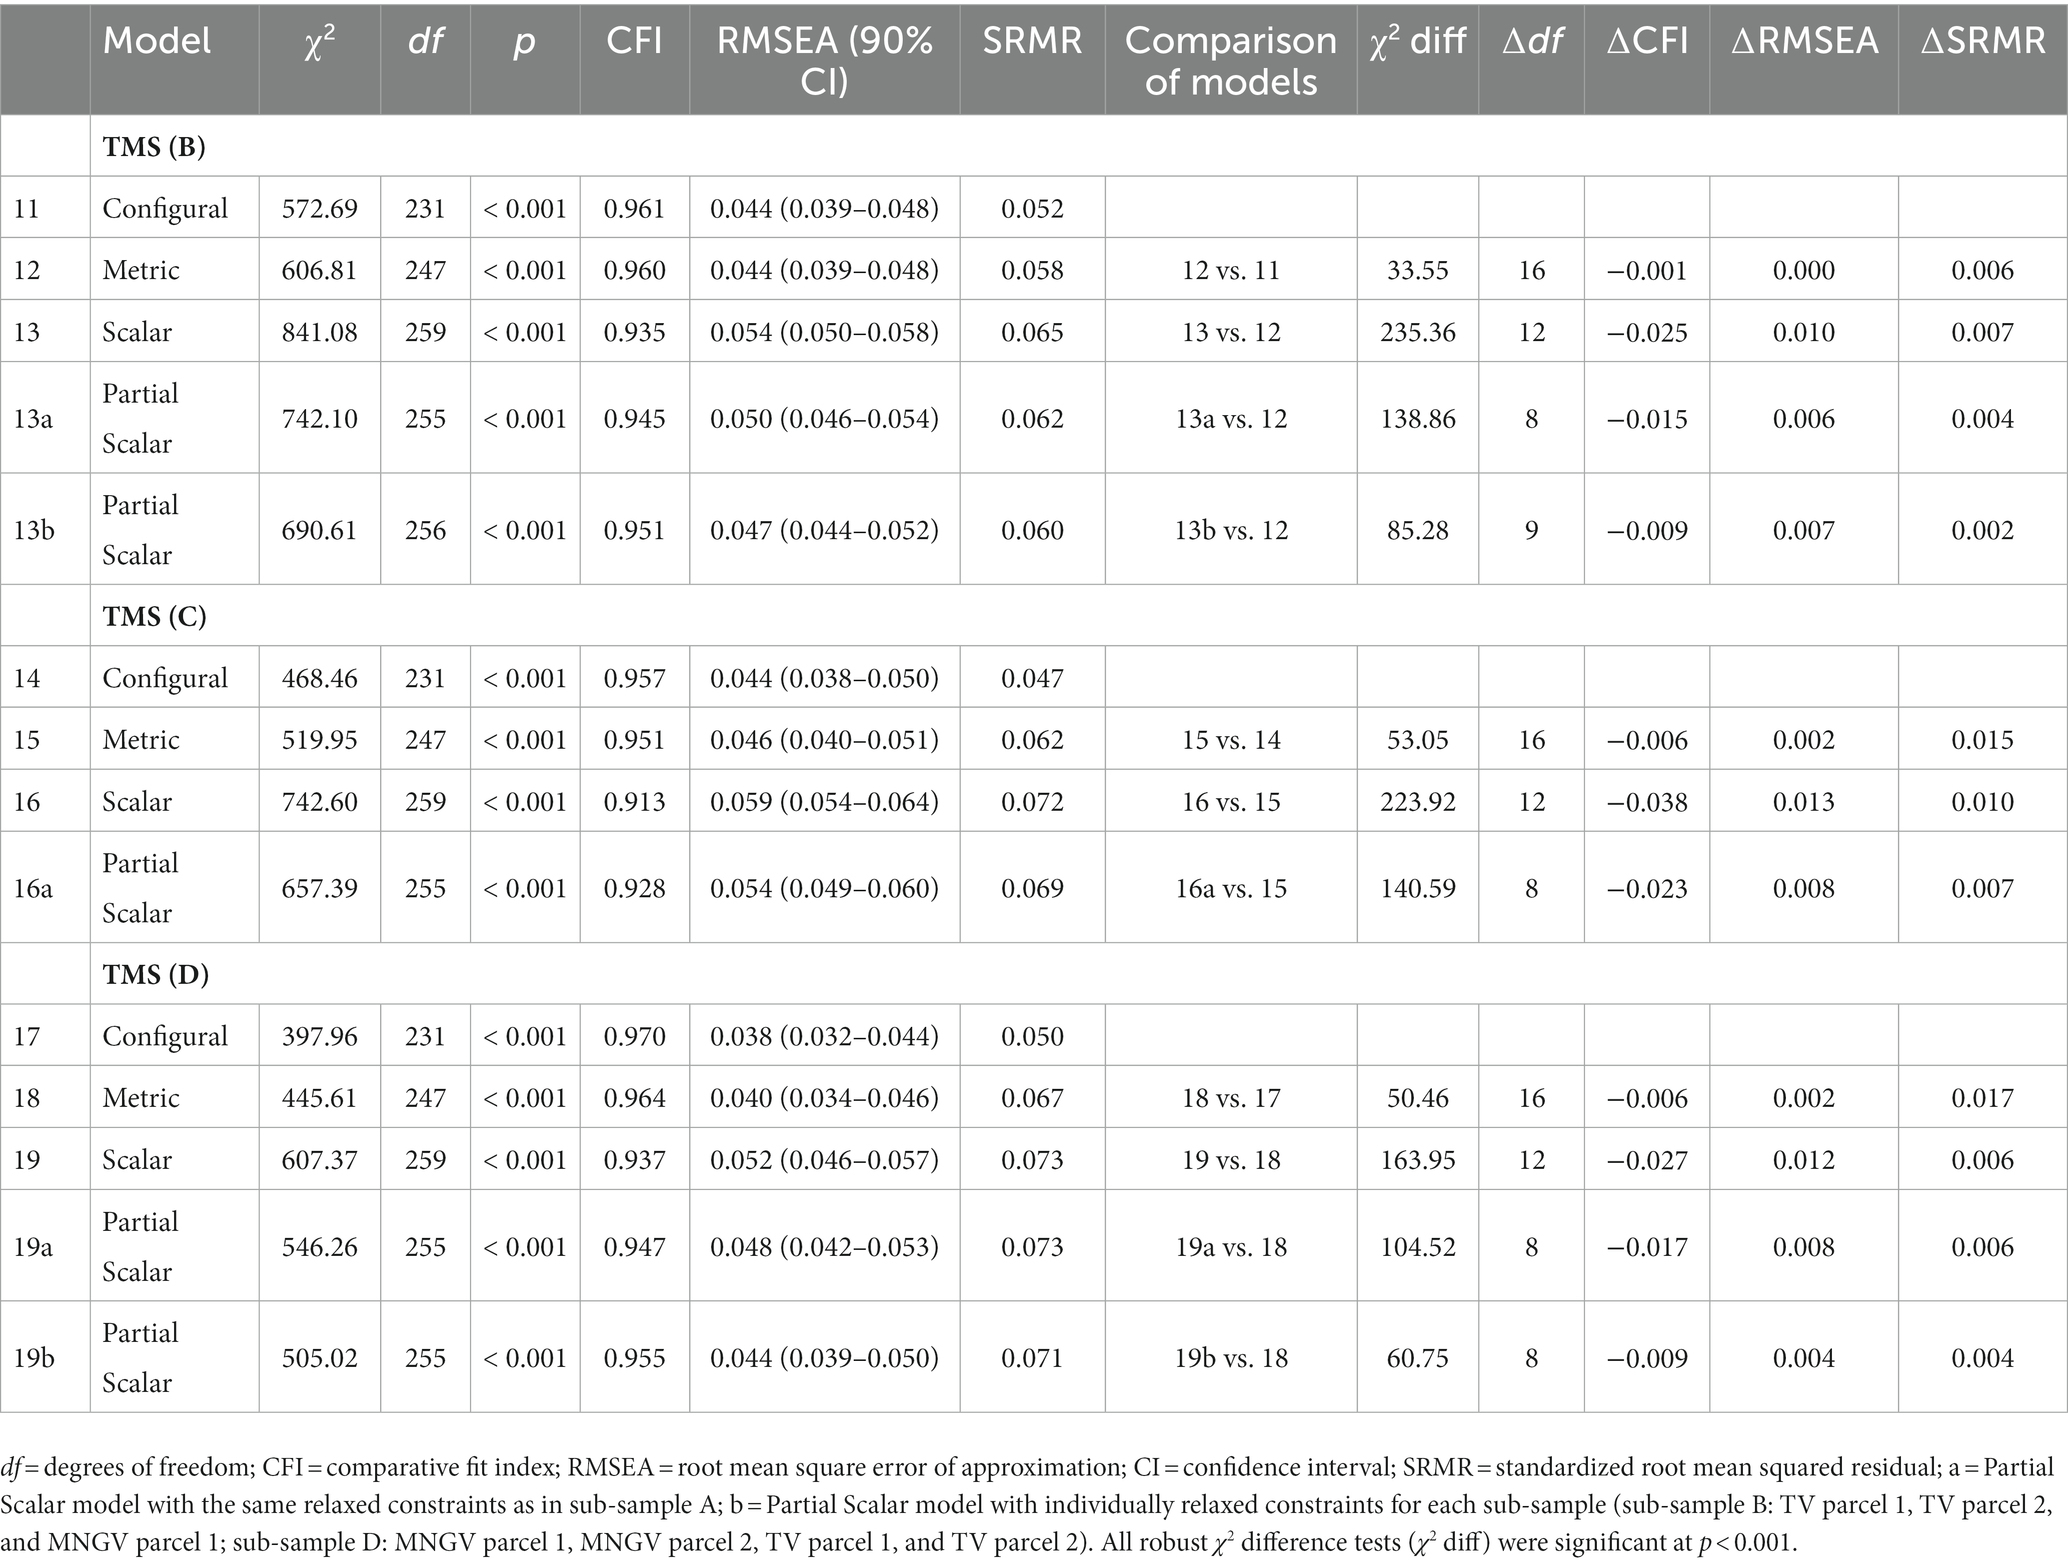
Table 6. Results of testing for measurement invariance across test modalities in validation samples B, C, and D of the TMS.
4. Discussion
The present study examined measurement invariance across paper-based and computer-based formats of two cognitive ability tests (i.e., TMS and HAM-Nat) used as criteria in student selection in medicine. Previous research has repeatedly indicated measurement invariance to be essential in order to meaningfully compare test results of different test formats (Vandenberg and Lance, 2000; Wicherts, 2016). Thus, establishing measurement invariance is an essential prerequisite to a fair selection process as applicants with test scores of both modalities compete for a study place in the transition to computer-based testing.
Our results are based on a large, representative sample of medical applicants in Germany. Overall, the results show clear initial evidence of measurement invariance between the paper-based and the computer-based cognitive ability tests, though with some limitations. In a stepwise procedure, partial scalar invariance was demonstrated for, both, the HAM-Nat and TMS. Despite missing support for full scalar invariance, the majority of items (parcels) were invariant (i.e., 52 out of 60 items in the HAM-Nat model and 8 out of 12 parcels in the TMS model). These results lead to the following implications: First, the factorial structure between paper-based and computer-based formats of both admission tests did not differ. Second, individual items (parcels) have similar weights and are equally salient to the presently examined subtests of the TMS and the HAM-Nat across both test formats. Third, a majority of item (parcel) intercepts are equivalent across test modalities. In conclusion, both the TMS and the HAM-Nat appear similarly but not identically conceptualized across paper-based and computer-based test formats.
To assess the generalizability of the TMS results, analyses were repeated in three comparable sub-samples. While configural and metric invariance were fully supported in all sub-samples, partial scalar invariance was established only in two out of three sub-samples when constraints were relaxed in each sub-sample individually. It is important to note, however, that the paper-based and computer-based versions of the TMS consisted of different items, and, further, different test versions in all of the paper-based formats were used. Both of these conditions are likely significant factors to the present findings. In order to disentangle the effects of test versions and test modalities, analyses with identical test versions in the computer-based and paper-based format of the TMS are required. Nonetheless, demonstrating partial scalar invariance in the initial sample as well as two out of three validation samples and full metric invariance despite different test versions serves as an indication of equivalence across test modalities of the TMS.
Based on the present findings, the transition from a paper-based to a computer-based format of both the TMS and the HAM-Nat is (partly) justified in terms of comparability of test scores without compromising the fairness of student selection, though should be treated with caution. Further investigation for both tests is still required and imperative. Institutions may change to a computer-based test format of the HAM-Nat while being able to meaningfully compare applicants’ test scores with results of paper-based formats. However, as each version of the HAM-Nat consists of assembled items from a larger item bank, investigating the equivalence of all items and replicating the present findings is necessary, as the latter was not possible in this study due to limited sample size. This study is a first step of understanding the HAM-Nats’ equivalence, analyzing 60 items which were used in previous high-stakes settings. Analyses revealed only eight items as being not invariant. Understanding the causes of non-invariance in these items is essential, as they may affect other items as well. So far, content-related reasons for the lack of invariance of these items remain unclear. A cautious interpretation of the reasons leads us back to the different processing conditions (high-stakes vs. low-stakes, proctored vs. unproctored). For example, it is conceivable that less capable test-takers are more likely to guess in the high-stakes setting, inducing randomness, while in the low-stakes setting they are more likely to omit the item or use unauthorized aid. Or, conversely, the more capable test-takers in the high-stakes setting make an effort to solve items, while omitting or guessing these items in a low-stakes context due to a lack of motivation. As for the TMS, even though results demonstrated a first indication of measurement invariance, a change in test format should be preceded by analyses on the item-level using identical items for all test formats.
On a broader scale, these findings may serve as an exemplification for other fields in higher education using cognitive ability tests in student selection when pursuing a transition from paper-based to computer-based test application. The heterogeneity of results found in different but comparable samples of the TMS emphasize the importance of carefully investigating measurement invariance in different conditions. For example, different test versions of a given cognitive ability test, which are typically used in student selection across years to avoid learning effects, may be completely, only partly, or not at all invariant. Thus, measurement invariance cannot be simply assumed and rather, should be treated as a localized issue, which needs to be established for each admission criterion and, put even more strongly, in each situation, in which raw test scores are meant to be treated interchangeably.
The present study has several limitations that need to be considered. First, computer-based formats of both admission tests were applied in a low-stakes setting, whereas the respective paper-based tests were applied in a high-stakes setting. As participants’ effort in low-stakes settings has shown to be a decisive factor to test performance (Wise and DeMars, 2005), the present difference in stakes needs to be considered. We attempted to increase participants’ effort in the low-stakes test situations (i.e., computer-based testing) by providing an opportunity to prepare for the high-stakes test (i.e., paper-based testing) and, additionally, providing immediate feedback in terms of raw scores and percentiles. To further minimize the effects of stakes, analyses solely included participants who completed the entire test in the low-stakes setting. By doing so, we ensured that participants spent an appropriate amount of time on the low-stakes tests, as this approach has been shown to lead to drastically reduced stakes effects (Attali, 2016). Second, different items were used in the paper-based and computer-based format of the TMS to not compromise the high-stakes tests. Therefore, parallel TMS versions in order to limit potential bias caused by different items were used. Although this approach has already been used and demonstrated effectively in previous analyses of measurement invariance (e.g., Bertola et al., 2021), the present results should be interpreted with this limitation in mind and may cause the heterogeneous findings in different TMS sub-samples. Lastly, results of the measurement invariance analysis of the TMS are based on parcels instead of items, as the TMS models did not converge on the item-level or yielded Heywood cases. Consequently, the identification of non-invariant items is hindered, but still possible on the parcel-level. Further, to account for the existing concerns in parceling for confirmatory factor analytic tests of measurement invariance (Meade and Kroustalis, 2006), we closely followed established parceling recommendations (Matsunaga, 2008) and checked preconditions carefully. Thus, results can nevertheless be meaningfully interpreted.
Finally, this study has shown that investigating measurement invariance across test modalities of cognitive ability tests in a high-stakes setting has several practical hurdles. Despite these hurdles, we have succeeded in creating initial prerequisites for a transition to computer-based testing that are important for our purposes: configural and metric invariance. Establishing scalar invariance, which is required for the direct comparison of test scores from both test modalities, was not fully supported. In this regard, further research is needed and identifying reasons that may cause invariance remains an important task.
Data availability statement
The datasets presented in this article are not readily available due to data privacy restrictions of the stav as data cannot be shared with external researchers. Requests to access the datasets should be directed to kontakt@projekt-stav.de.
Ethics statement
The studies involving human participants were reviewed and approved by Ethics Committee of the Medical Faculty of the University Heidelberg. The patients/participants provided their written informed consent to participate in this study.
Author contributions
ME: conceptualization, data curation, formal analysis, methodology, visualization, and writing – original draft preparation. DW and TH: conceptualization, formal analysis, and writing – review and editing. DA, SS, and JH: conceptualization and writing – review and editing. All authors contributed to the article and approved the submitted version.
Funding
This work was partly funded by the Federal Ministry of Education and Research (funding code: 01GK1801A).
Acknowledgments
We would like to thank all project partners of the stav who were involved in the test administration. For the publication fee we acknowledge financial support by Deutsche Forschungsgemeinschaft within the funding programme “Open Access Publikationskosten” as well as by Heidelberg University.
Conflict of interest
DW and SS are partner of ITB Consulting GmbH, the organization that is developing the TMS.
The remaining authors declare that the research was conducted in the absence of any commercial or financial relationships that could be construed as a potential conflict of interest.
Publisher’s note
All claims expressed in this article are solely those of the authors and do not necessarily represent those of their affiliated organizations, or those of the publisher, the editors and the reviewers. Any product that may be evaluated in this article, or claim that may be made by its manufacturer, is not guaranteed or endorsed by the publisher.
Supplementary material
The Supplementary material for this article can be found online at: https://www.frontiersin.org/articles/10.3389/feduc.2023.1209212/full#supplementary-material
Footnotes
References
American Educational Research Association, American Psychological Association, and National Council on Measurement in Education (2014). Standards for educational and psychological testing. Washington, DC: American Educational Research Association.
Attali, Y. (2016). Effort in low-stakes assessments: what does it take to perform as well as in a high-stakes setting? Educ. Psychol. Meas. 76, 1045–1058. doi: 10.1177/0013164416634789
Bailey, S. K. T., Neigel, A. R., Dhanani, L. Y., and Sims, V. K. (2018). Establishing measurement equivalence across computer- and paper-based tests of spatial cognition. Hum. Factors 60, 340–350. doi: 10.1177/0018720817747731
Bandalos, D. L. (2008). Is parceling really necessary? A comparison of results from item parceling and categorical variable methodology. Struct. Equ. Model. Multidiscip. J. 15, 211–240. doi: 10.1080/10705510801922340
Beauducel, A., and Herzberg, P. Y. (2006). On the performance of maximum likelihood versus means and variance adjusted weighted least squares estimation in CFA. Struct. Equ. Model. Multidiscip. J. 13, 186–203. doi: 10.1207/s15328007sem1302_2
Bertola, L., Benseñor, I. M., Gross, A. L., Caramelli, P., Barreto, S. M., Moreno, A. B., et al. (2021). Longitudinal measurement invariance of neuropsychological tests in a diverse sample from the ELSA-Brasil study. Braz. J. Psychiatry 43, 254–261. doi: 10.1590/1516-4446-2020-0978
Bundesverfassungsgericht [BVerfG] (2017). Urteil des Ersten Senats vom 19. Dezember 2017–1 BvL 3/14 – Rn. (1-253). Available at: http://www.bverfg.de/e/ls20171219_1bvl000314.html (Accessed April 13, 2023).
Chen, F. F. (2007). Sensitivity of goodness of fit indexes to lack of measurement invariance. Struct. Equ. Model. Multidiscip. J. 14, 464–504. doi: 10.1080/10705510701301834
Chen, F. F. (2008). What happens if we compare chopsticks with forks? The impact of making inappropriate comparisons in cross-cultural research. J. Pers. Soc. Psychol. 95, 1005–1018. doi: 10.1037/a0013193
Dunn, T. J., Baguley, T., and Brunsden, V. (2014). From alpha to omega: a practical solution to the pervasive problem of internal consistency estimation. Br. J. Psychol. 105, 399–412. doi: 10.1111/bjop.12046
Farcot, M., and Latour, T. (2009). “Transitioning to computer-based assessments: a question of costs” in The transition to computer-based assessment. New approaches to skills assessment and implications for large-scale testing. eds. F. Scheuermann and J. Björnsson (Luxemburg: Office for Official Publications of the European Communities), 108–116.
Hu, L., and Bentler, P. M. (1999). Cutoff criteria for fit indexes in covariance structure analysis: conventional criteria versus new alternatives. Struct. Equ. Model. Multidiscip. J. 6, 1–55. doi: 10.1080/10705519909540118
ITB Consulting GmbH (2019). Test für Medizinische Studiengänge und Eignungstest für das Medizinstudium III: Originalversion III des TMS/EMS. Göttingen: Hogrefe.
Jackson, D. L., Gillaspy, J. A., and Purc-Stephenson, R. (2009). Reporting practices in confirmatory factor analysis: an overview and some recommendations. Psychol. Methods 14, 6–23. doi: 10.1037/a0014694
Jorgensen, T. D., Pornprasertmanit, S., Schoemann, A. M., and Rosseel, Y. (2022). semTools: Useful tools for structural equation modeling. R package version 0.5-6. Available at: https://CRAN.R-project.org/package=semTools (Accessed April 13, 2023).
Kikis-Papadakis, K., and Kollias, A. (2009). “Reflections on paper-and-pencil tests to eAssessments: narrow and broadband paths to 21st century challenges” in The transition to computer-based assessment. New approaches to skills assessment and implications for large-scale testing. eds. F. Scheuermann and J. Björnsson (Luxemburg: Office for Official Publications of the European Communities), 92–96.
Kishton, J. M., and Widaman, K. F. (1994). Unidimensional versus domain representative parceling of questionnaire items: an empirical example. Educ. Psychol. Meas. 54, 757–765. doi: 10.1177/0013164494054003022
Little, T. D., Rhemtulla, M., Gibson, K., and Schoemann, A. M. (2013). Why the items versus parcels controversy needn’t be one. Psychol. Methods 18, 285–300. doi: 10.1037/a0033266
Matsunaga, M. (2008). Item parceling in structural equation modeling: a primer. Commun. Methods Meas. 2, 260–293. doi: 10.1080/19312450802458935
Mead, A. D., and Drasgow, F. (1993). Equivalence of computerized and paper-and-pencil cognitive ability tests: a meta-analysis. Psychol. Bull. 114, 449–458. doi: 10.1037/0033-2909.114.3.449
Meade, A. W., and Kroustalis, C. M. (2006). Problems with item parceling for confirmatory factor analytic tests of measurement invariance. Organ. Res. Methods 9, 369–403. doi: 10.1177/1094428105283384
Pendergast, L. L., Von Der Embse, N., Kilgus, S. P., and Eklund, K. R. (2017). Measurement equivalence: a non-technical primer on categorical multi-group confirmatory factor analysis in school psychology. J. Sch. Psychol. 60, 65–82. doi: 10.1016/j.jsp.2016.11.002
Putnick, D. L., and Bornstein, M. H. (2016). Measurement invariance conventions and reporting: the state of the art and future directions for psychological research. Dev. Rev. 41, 71–90. doi: 10.1016/j.dr.2016.06.004
R Core Team (2020). R: A language and environment for statistical computing. Vienna: R Foundation for Statistical Computing.
Rosseel, Y. (2012). Lavaan: an R package for structural equation modeling. J. Stat. Softw. 48, 1–36. doi: 10.18637/jss.v048.i02
Schroeders, U. (2009). “Testing for equivalence of test data across media” in The transition to computer-based assessment. New approaches to skills assessment and implications for large-scale testing. eds. F. Scheuermann and J. Björnsson (Luxemburg: Office for Official Publications of the European Communities), 164–170.
Schroeders, U., and Wilhelm, O. (2011). Equivalence of Reading and listening comprehension across test media. Educ. Psychol. Meas. 71, 849–869. doi: 10.1177/0013164410391468
Schult, J., Hofmann, A., and Stegt, S. J. (2019). Leisten fachspezifische Studierfähigkeitstests im deutschsprachigen Raum eine valide Studienerfolgsprognose?: Ein metaanalytisches Update. Zeitschrift Entwicklungspsychologie Pädagogische Psychol. 51, 16–30. doi: 10.1026/0049-8637/a000204
Schwibbe, A., Lackamp, J., Knorr, M., Hissbach, J., Kadmon, M., and Hampe, W. (2018). Medizinstudierendenauswahl in Deutschland: Messung kognitiver Fähigkeiten und psychosozialer Kompetenzen. Bundesgesundheitsbl 61, 178–186. doi: 10.1007/s00103-017-2670-2
Trost, G., Blum, F., Fay, E., Klieme, E., Maichle, U., Meyer, M., et al. (1998). Evaluation des Tests für medizinische Studiengänge (TMS). Synopse der Ergebnisse. Bonn: ITB.
Van Buuren, S., and Groothuis-Oudshoorn, K. (2011). Mice: multivariate imputation by chained equations in R. J. Stat. Softw. 45, 1–67. doi: 10.18637/jss.v045.i03
Vandenberg, R. J. (2002). Toward a further understanding of and improvement in measurement invariance methods and procedures. Organ. Res. Methods 5, 139–158. doi: 10.1177/1094428102005002001
Vandenberg, R. J., and Lance, C. E. (2000). A review and synthesis of the measurement invariance literature: suggestions, practices, and recommendations for organizational research. Organ. Res. Methods 3, 4–70. doi: 10.1177/109442810031002
Vermeent, S., Spaltman, M., Van Elswijk, G., Miller, J. B., and Schmand, B. (2022). Philips IntelliSpace cognition digital test battery: equivalence and measurement invariance compared to traditional analog test versions. Clin. Neuropsychol. 36, 2278–2299. doi: 10.1080/13854046.2021.1974565
Wang, S., Jiao, H., Young, M. J., Brooks, T., and Olson, J. (2008). Comparability of computer-based and paper-and-pencil testing in K–12 Reading assessments: a Meta-analysis of testing mode effects. Educ. Psychol. Meas. 68, 5–24. doi: 10.1177/0013164407305592
Wicherts, J. M. (2016). The importance of measurement invariance in neurocognitive ability testing. Clin. Neuropsychol. 30, 1006–1016. doi: 10.1080/13854046.2016.1205136
Williams, L. J., and O’Boyle, E. H. (2008). Measurement models for linking latent variables and indicators: a review of human resource management research using parcels. Hum. Resour. Manag. Rev. 18, 233–242. doi: 10.1016/j.hrmr.2008.07.002
Wise, S. L., and DeMars, C. E. (2005). Low examinee effort in low-stakes assessment: problems and potential solutions. Educ. Assess. 10, 1–17. doi: 10.1207/s15326977ea1001_1
Keywords: student selection, higher education, computer-based testing, measurement invariance, comparability, multiple-group confirmatory factor analysis
Citation: Escher M, Weppert D, Amelung D, Huelmann T, Stegt S and Hissbach J (2023) Paper-based and computer-based admission tests for medicine – are they equivalent? Front. Educ. 8:1209212. doi: 10.3389/feduc.2023.1209212
Edited by:
Xinya Liang, University of Arkansas, United StatesReviewed by:
Timo Lorenz, Medical School Berlin, GermanyAlyssa Counsell, Toronto Metropolitan University, Canada
Copyright © 2023 Escher, Weppert, Amelung, Huelmann, Stegt and Hissbach. This is an open-access article distributed under the terms of the Creative Commons Attribution License (CC BY). The use, distribution or reproduction in other forums is permitted, provided the original author(s) and the copyright owner(s) are credited and that the original publication in this journal is cited, in accordance with accepted academic practice. No use, distribution or reproduction is permitted which does not comply with these terms.
*Correspondence: Malvin Escher, malvin.escher@med.uni-heidelberg.de