Using the thin slices technique to assess interactional quality in early childhood education and care settings
 Konstantin Vinokic1,2*
  Franka Baron3
  Mareike Kunter1,2
  Anja Linberg4
  Lukas Begrich1,2
  Susanne Kuger2,4
- 1DIPF | Leibniz Institute for Research and Information in Education, Frankfurt, Germany
- 2IDeA Center for Research on Individual Development and Adaptive Education of Children at Risk, Frankfurt, Germany
- 3Interfaculty Centre for Educational Research, University of Bern, Bern, Switzerland
- 4German Youth Institute (DJI), München, Germany
There are a variety of instruments for measuring interaction quality of Early Childhood Education and Care (ECEC) teachers. However, these instruments are extremely resource-demanding in terms of time and money. Hence, a more economical and yet accurate method for measuring interaction quality of ECEC teachers would be desirable. The so-called thin slices technique has been applied to observe, measure and predict human behavior with only minimal amounts of information. In a wide array of research domains, thin slices ratings (i.e., ratings based on first impressions) proved to be accurate. The present study explores the accuracy of thin slices ratings of interaction quality in toddler classrooms along two CLASS Toddler domains (Emotional and Behavioral Support and Engaged Support for Learning). Eight CLASS-certified raters assessed interaction quality based on 30-s classroom videos. The findings suggest predominantly good reliabilities of these ratings. Confirmatory factor analysis yielded evidence for construct validity, meaning that thin slices raters could differentiate between two domains of interaction quality. Further, thin slices ratings correlated, at least partly, with ratings based on full-length videos, indicating that thin slices raters and raters watching the full-length videos had a similar impression of interaction quality of ECEC teachers.
1 Introduction
The quality of interaction in Early Childhood Education and Care (ECEC) settings is an important predictor of children’s outcomes (e.g., Belsky et al., 2007). ECEC quality is expected to yield a wide range of benefits. For example, increased child well-being and learning outcomes, as well as better social and economic development for society at large (OECD, 2011). For measuring childcare quality, ratings given by external observers seem to yield the most trustworthy results; however, these ratings are complex, expensive and time-consuming (Harms et al., 2017). Therefore, an economical alternative would be desirable. Perhaps, the so-called thin slices technique could serve as such an alternative (Ambady et al., 2000). A thin slice consists of a brief segment of behavior of one or more persons, less than 5 min long. The thin slices technique relies on first impressions, whereby raters assess characteristics of a target person or an interaction, relying solely on scarce information. In a multitude of research areas (e.g., clinical psychology, personality psychology or education), the thin slices technique yielded intriguingly accurate results (e.g., Wood, 2014; Murphy and Hall, 2021). Begrich et al. (2017, 2020, 2021) demonstrated that teaching quality at school can be accurately measured with 30-s classroom videos. Sokolovic et al. (2021) demonstrated that, under certain conditions, children’s outcomes can be predicted with the thin slices technique in ECEC settings. Based on Sokolovic et al. (2021), the present study addresses research gaps by examining further aspects of the psychometric accuracy of thin slices rating of interaction quality in ECEC.
2 Background and aims
2.1 Early childhood education and care research
During early childhood, learning environments, such as Early Childhood Education and Care (ECEC), impact children’s development (Bronfenbrenner and Morris, 2007). ECEC settings refer to a variety of center-based, regulated arrangements that provide education and care for children from birth to compulsory primary school age (European Commission, 2021). The majority of children and toddlers experience some type of ECEC during their preschool years (e.g., Burchinal et al., 2015). Quality in childcare centers encompasses various elements, including the creation of a caring community of learners, teaching practices aimed at enhancing development and learning, the use of a curriculum, regular assessment of children’s development, and fostering strong relationships with families (NAEYC, 2009). A large body of literature demonstrates the positive effects of ECEC on children’s development (Sammons et al., 2009; Anders, 2013; Melhuish et al., 2015). In particular, high-quality early childcare seems to be the driving force behind notable long-term effects on children’s development. For example, higher ECEC quality predicted higher vocabulary scores at the end of 6th grade (Belsky et al., 2007) and adolescent functioning at the end of high school (Vandell et al., 2016).
A frequently used measurement instrument of process quality in ECEC settings for the very young is the Classroom Assessment Scoring System: Toddler Version (CLASS-T; La Paro et al., 2012). The CLASS-T is an observational instrument developed to assess direct teacher-child interactions (i.e., process quality) in group settings for children between approximately 15 and 36 months (La Paro et al., 2012). The CLASS-T specifies two domains: Emotional and Behavioral Support (EBS) and Engaged Support for Learning (ESL). The EBS domain is defined by the teacher’s and children’s expression of emotion, the responsiveness and sensitivity of the teacher, the degree to which children’s perspectives are considered and the teacher’s support of behavioral regulation. The ESL domain focuses on the teacher’s quality of language modeling and feedback, as well as the teacher’s ability to facilitate children’s learning and development (La Paro et al., 2012). In a sample of 106 classrooms, an examination of the dimensional composition of the CLASS-T found empirical evidence for a two-factor structure (Bichay-Awadalla and Bulotsky-Shearer, 2022). Based on 19 studies, a meta-analysis revealed some, although small, evidence of predictive validity for the CLASS, indicating an association between the quality of teacher-child interaction and children’s outcomes (Perlman et al., 2016).
For measuring toddler childcare quality, observational instruments are considered to be the gold standard (Bäumer and Roßbach, 2016; Linberg et al., 2017). Measuring childcare quality by asking parents may be inaccurate because parents are only present for very brief periods of time or might not have enough knowledge (Barros and Leal, 2015). The staff’s perspective could be biased because they might perceive the survey as an evaluation of their own work (Barros and Leal, 2015). Children in early childhood, particularly those under the age of three, are too young to respond adequately to survey items or interview questions (Lenske and Helmke, 2015).
Video based measurement is time-consuming, labor-intensive and costly (Murphy and Hall, 2021). Classroom video footage is often lengthy (even more than an hour) and the broader context, for example, homework or work sheets has to be considered. The raters have to watch the whole video repeatedly or some scenes of the videos are observed frequently and discussed afterward by the raters. In general, the rating procedure takes twice the length of the video itself (Murphy, 2005). The coding of video material can be tedious and wearisome. Raters have to pay attention to a multitude of aspects of the rated behavior simultaneously in order to work through various items (Murphy, 2005). Regarding the instruments for measuring interaction quality of ECEC teachers (for an overview see Baron et al., 2022), a reliable handling of most of these instruments requires extensive amounts of schooling, calibration and ongoing supervision as well as extended periods of observation (either live or on video). For example, the Infant/Toddler and Early Childhood Environment Rating Scales (ITERS-R/ECERS-R; Harms et al., 2017) require at least three hours of observation for each classroom (Sokolovic et al., 2021). Hence, there is a need for a more economical alternative. The thin slices technique has the potential to serve as this cost-effective alternative.
2.2 The thin slices technique
The thin slices technique was designed as a behavioral measurement technique, examining the accuracy of ratings based on first impressions of social perceivers (Ambady and Rosenthal, 1992; Ambady et al., 2000; Murphy and Hall, 2021). A thin slice is an excerpt of dynamic information edited from the behavioral stream. It is less than 5 min long and can be sampled from any channel of communication, for example the voice, the body or the face (Ambady et al., 2000; Murphy and Hall, 2021).
The thin slices technique has been applied in various domains (e.g., pedagogy, social psychology, clinical psychology) to assess a multitude of psychological constructs (e.g., intelligence, personality, altruism). Thin slices ratings have been proven to be accurate or even highly accurate in terms of reliability (i.e., the agreement between observers) and validity (i.e., significant correlations with external criteria, like standardized tests, self-reports or longer video footage; see, e.g., Murphy, 2005; Fowler et al., 2009; Holleran et al., 2009; Murphy et al., 2015).
So far, various studies have been conducted to explore the accuracy of thin slices ratings in an educational context (Babad et al., 2004). For example, thin slices raters could successfully predict teachers’ life and job satisfaction in 5 to 8 years based on 60-s classroom clips (Pretsch et al., 2013). Thin slices raters could significantly predict end-of-semester students’ evaluations of their college teachers based on 60-s thin slices videos of teachers’ nonverbal behavior (Ambady and Rosenthal, 1993). Based on 10-s thin slices, ratings of high school teachers’ nonverbal behavior predicted students’ ratings of these teachers. In particular, positive associations were found between thin slices ratings and student ratings while the teachers were displaying disciplinary actions or interacting with students (Babad et al., 2003).
Begrich et al. (2017, 2020, 2021) applied the thin slices technique to assess instructional quality at school based on 30-s classroom videos. Instructional quality was operationalized with three basic dimensions of instructional quality (e.g., Klieme, 2006; Praetorius et al., 2018). In all studies, interrater reliability was good or even excellent, with intraclass correlation coefficients reaching up to 0.98 (Begrich et al., 2020). Multilevel confirmatory factor analysis confirmed the theoretically expected three factors, indicating that the raters were able to distinguish between different aspects of instructional quality (Begrich et al., 2021). Thin slices ratings and the ratings given by trained raters based on the full-length classroom videos correlated significantly (r up to 0.52), indicating evidence of convergent validity (Begrich et al., 2021). Further, thin slices ratings predicted how much students learned from different teachers, even when students’ prerequisites were controlled (Begrich et al., 2020).
Sokolovic et al. (2021) applied the thin slices technique to examine interaction quality between early childhood teachers and toddlers. Trained thin slices coders watched five- minute videos displaying either a standardized activity or mealtime observation and rated the process quality with the Responsive Interactions for Learning – Educator (RIFL-Ed.) measure (for further explanation, see Sokolovic et al., 2021). The authors examined the association between thin slices codings with the RIFL-Ed. and the ratings based on two- to three-hour live observations of the same teachers and settings with the Classroom Assessment Scoring System: Toddler Version (La Paro et al., 2012). Multilevel regression analyses revealed that the RIFL-Ed. scores obtained with a thin slices coding approach could be predicted by the CLASS-T scores during mealtime observations for the EBS domain (β = 0.19, p = 0.02), and to some extent, for the ESL domain (β = 0.15, p = 0.07). Their results provide preliminary evidence for the psychometric accuracy of thin slices codings of interaction quality in ECEC settings (for further details, see Sokolovic et al., 2021).
The present study aims to examine the accuracy of a thin slices measurement approach in evaluating interaction quality in ECEC by addressing various research gaps. So far, nothing is known about the interrater agreement of interaction quality as well as the explained variance by each component (the raters, the teachers or the items) of the measurement (i.e., reliability). Research should address whether thin slices raters are able to distinguish between domains of interaction quality (i.e., construct validity). As correlations between thin slices codings and live ratings were not differentiated according to quality domains (Sokolovic et al., 2021), more research is required to analyze the association between thin slices ratings and ratings based on longer videos, with a focus on distinguishing aspects of interaction quality (i.e., convergent validity). How do facial masks impact measurement accuracy in ECEC settings? Is it still possible to assess interaction quality with a thin slices approach accurately, even when the teachers were wearing facial masks?
2.3 Aims of the study
Considering the importance of high quality in ECEC centers for children’s development, it seems worthwhile to test an economical alternative. Sokolovic et al. (2021) found promising evidence for the measurement accuracy of the thin slices technique applied to assess interaction quality in ECEC.
The central aim of the present study is to examine the main measurement properties of thin slices ratings of interaction quality of early childcare teachers. Once a measurement instrument can demonstrate its reliability, it should be assessed whether it actually measures what it intends to measure (Field, 2009; De Souza et al., 2017). Construct validity refers to the degree to which a set of variables indeed represents the construct to be measured (De Souza et al., 2017). In the present study, we examine whether the thin slices procedure allows a differentiated assessment of interaction quality along two domains of the measurement instrument. Convergent validity refers to a high correlation between an instrument and another instrument that measures the same construct (De Souza et al., 2017). In the context of thin slices research, slice-whole validity refers to the representativeness of a thin slices video (edited from a whole video footage) and the totality of the measured behavior (Murphy and Hall, 2021). In the present study, we analyze whether thin slices rating overlap (i.e., correlate) with ratings based full-length classroom videos.
Since untrained thin slices raters were able to accurately assess teaching quality at schools (Begrich et al., 2017, 2020, 2021), the present study intends to examine the accuracy of highly trained thin slices raters in the ECEC context. Based on previous research results (Sokolovic et al., 2021), we assume that highly trained thin slices raters yield psychometrically accurate results, implying that highly trained experts may serve as conventional raters as well as thin slices raters. To our knowledge, only one study (Sokolovic et al., 2021) has applied a thin slices coding approach in early childcare settings to date. In Sokolovic’s study, a thin slices coding approach was compared to live observation. In contrast, the present study compares thin slices ratings with ratings based on the same, yet longer video material. Therefore, we sought to address research gaps through the following three research questions:
2.3.1 Research question 1: reliability
Are thin slices ratings of interaction quality in ECEC settings reliable? Various aspects of reliability were examined. First, to what degree do thin slices raters agree in their judgments about interaction quality (interrater agreement)? We expect to find moderate to high consensus among thin slices raters. Second, measurement error was assessed by decomposing the sources of variance (i.e., the raters, the items and the teachers) and by estimating the amount of variance contributed by each source. Further, we examined whether reliability was acceptable with the actual number of raters and how a hypothetical increase in the number of raters would affect reliability. Third, we analyzed the homogeneity of the multi-item measurement scales by calculating McDonald’s omega (internal consistency).
2.3.2 Research question 2: construct validity
Can thin slices raters, assessing interaction quality in ECEC, differentiate between the two domains of the measurement instrument? We expect to find evidence for a two-factor structure in the data reflecting the two domains of interaction quality of the CLASS-T with Emotional and Behavioral Support and Engaged Support for Learning as the latent factors. The verification of a two-factorial structure would yield evidence for the construct validity of thin slices ratings of interaction quality. To our knowledge, this question has not yet been examined empirically.
2.3.3 Research question 3: convergent validity
Do thin slices raters come to a similar conclusion regarding interaction quality in ECEC settings compared to raters observing the same, albeit much longer classroom videos? Bivariate Pearson’s correlations were conducted on the item level and on the level of the two domains, with an expectation of finding moderate to high correlations. We do not know about any other study that has examined this question previously.
3 Methodology
3.1 Data basis (the EarlyMath project)
The present study is based on data of the first cohort from the project EarlyMath: Mathematical Development and the Impact of Interaction Quality in Early Childcare (Lehrl et al., forthcoming Linberg et al., 2020). The EarlyMath project investigates comparatively the effects of different interventions (training for pedagogical staff) that promote global and mathematics-specific interaction behavior of ECEC teachers on the development of mathematical competencies of children between 2 and 4 years of age.
In the EarlyMath project, 46 teacher-child interactions of the first cohort of teachers were video recorded between December and April 2021. The videos captured a semi-standardized play situation in which one teacher interacted with usually three children (M = 2.53, range = 1–5) with a standardized toy set including books and board games. A student assistant was present in the classroom for recording, and the teachers and the children were aware that they were being recorded. 44 teachers were female, and the teachers’ mean age was 38.57 years (SD = 12.19), ranging from 20 to 64 years. Since the videos were recorded during the Covid-19 pandemic, all teachers were wearing facial masks, except for two who were wearing transparent facial shields and three who were wearing no facial masks at all. The average length of the videos was 19:27 min (SD = 2.27).
Childcare centers in the local area of the EarlyMath project were contacted during the Covid-19 pandemic and a voluntary sample of 53 centers were recruited. The final sample consisted of 46 childcare centers with one classroom per center and one teacher per classroom. All teachers and the parents of the children gave their written consent to participate in the study (Lehrl et al., forthcoming).
3.2 Standardized instrument: classroom assessment scoring system: Toddler version
In the EarlyMath project, teacher-child interactions were assessed (among others) by using the Classroom Assessment Scoring System (CLASS): Toddler Version (La Paro et al., 2012). Two domains (Emotional and Behavioral Support and Engaged Support for Learning) comprise eight different indicators (Positive Climate, Negative Climate, Teacher Sensitivity, Regard for Child Perspectives, Behavior Guidance, Facilitation of Learning and Development, Quality of Feedback and Language Modeling). The item Negative Climate was not observed in 54% (n = 27) of the teachers. Therefore, the item was neither included in the EarlyMath study nor in the current study. Since one teacher was assessed by one rater, no aggregation was necessary on the level of the indicators. For the two domains (EBS and ESL), a scale was constructed for each teacher by aggregating all indicators of the respective dimension.
In the EarlyMath project, 10 observers were trained for 2 days according to the official TeachStone criteria (La Paro et al., 2012). For certification, all observers successfully participated in the reliability testing, which implied that they coded five videos and passed the reliability standards when they achieved 80% agreement with the master coder across all five reliability videos. The scoring of the classroom videos involved observers watching the videos in their entirety and evaluating the interaction quality globally. The videos were scored on a 7-point Likert scale ranging from low (1, 2) to middle (3, 4, 5) to high (6, 7). These ratings from trained observers based on full-length video were considered as criterion variables for convergent validity in the present study. We refer to these ratings of the trained raters with access to the full-length videos as systematic ratings or systematic raters.
3.3 Thin slices ratings
In the current study, the thin slices videos were edited from the video footage from all 46 teachers participating in the EarlyMath project. The thin slices were sampled according to Ambady et al. (2000) and Begrich et al. (2017). A ten-second snippet was randomly cut from the beginning, middle and end of the entire video. These three ten-second snippets were then added in a consecutive manner to create a thin slice video of 30 s. The video quality as well as the audio quality of all videos were good. Begrich et al. (2017, 2020, 2021) demonstrated the accuracy of the thin slices technique based on 30-s videos. Since 30 s seems to convey sufficient information about teaching quality, we decided to use 30-s thin slices videos in the present study.
The thin slices rating instrument used in the present study was developed based on the rationale of the CLASS-T manual (La Paro et al., 2012). For each of the seven CLASS-T indicators, a short statement was created referring to the respective behavior described in the manual. Each of these short statements was rated on a seven-point Likert scale ranging from “does not apply” to “does fully apply.” The item wordings are listed in Table 1. The first 4 items operationalize the domain EBS and the last three items operationalize the domain ESL (La Paro et al., 2012).
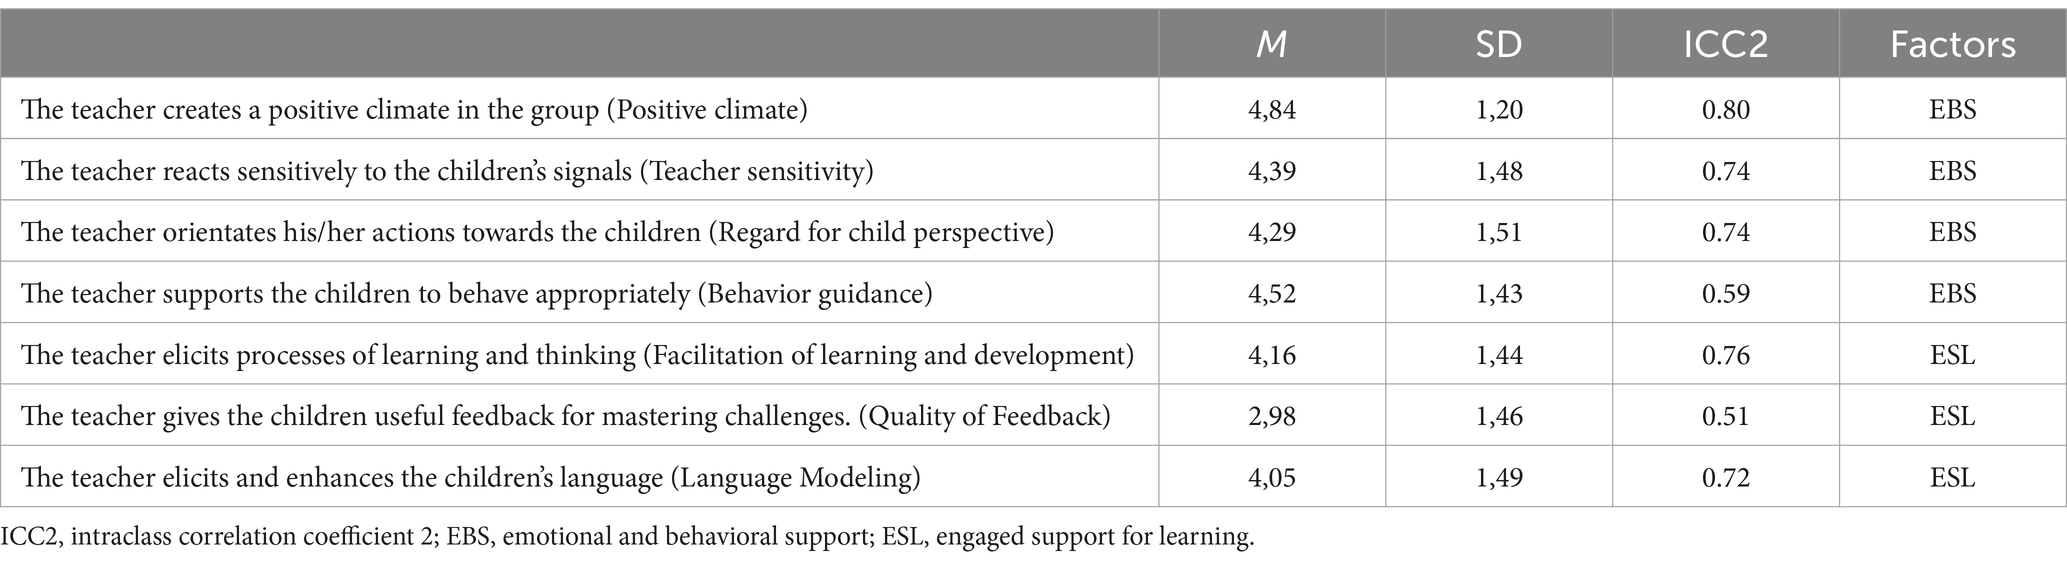
Table 1. Item texts, (Corresponding CLASS items), descriptive statistics, reliabilities and factors.
Eight CLASS-certified raters from the EarlyMath project participated in the present study as thin slices raters. The eight raters successfully completed the TeachStone training and met the TeachStone reliability standards (La Paro et al., 2012). The eight raters already had experience in rating classroom videos. Three of the eight raters had already rated one classroom video with the CLASS-T, which was also shown in the present study. The raters were undergraduates (6 persons; psychology or early childhood studies) or doctoral students (2 persons; early childhood studies). All raters were female. The mean age was 24.1 years (SD = 2.4), ranging from 21 to 28 years. They received no financial incentive for participating.
Before data collection started, the study was registered at https://osf.io/47dcs. The raters were told that the study focuses on first impressions. Therefore, they should rely on their gut feelings and intuition while rating the classroom videos. After the rating of the first video, participants were asked whether any further questions occurred and whether the procedure was understood. Rating continued almost immediately, since no questions needed clarification.
As calculations were not conducted based on the raw ratings of a single participant, scales were constructed in two ways: on the item level as well as on the level of the two domains. On the item level, over all participants’ ratings of a certain item, a mean was calculated for each teacher. On the level of the domains (EBS and ESL), a multi-item measurement scale was constructed by aggregating the mean item values resulting in two scores (one for each dimension) for each teacher.
3.4 Data analysis
3.4.1 Research question 1: reliability
In Research Question 1, we address the question of whether thin slices raters agree in their judgments of interaction quality. The intraclass correlation coefficient (ICC) is applied in a multilevel context for calculating interrater reliability (Fleiss and Cohen, 1973). The intraclass correlation coefficient 2 (ICC2) indicates the degree of reliability of a group of raters’ aggregated ratings for each item (Lüdtke et al., 2009). The ICC2 were calculated in RStudio using the multilevel package (Bliese et al., 2022). Koo and Li (2016) consider an intraclass correlation coefficient between 0.50 and 0.75 as moderate, between 0.75 and 0.90 as good and higher than 0.90 as excellent reliability.
A G theory is a statistical measurement evaluating the reliability of a behavioral measurement (Brennan, 2001; Webb and Shavelson, 2005). G theory study consists of a generalizability (g) study and a decision (d) study. A g study isolates and estimates the variance components of various sources (Webb and Shavelson, 2005). In the present study, the variance can be decomposed as the sum of seven variance components. The three main effects consist of the variances of the raters, the items and the teachers. The four interaction effects consist of the variances of the three two-way interactions between the teachers, the items and the raters each, as well as one three-way interaction between the teachers, the items and the raters, confounded with the unsystematic residual. A d study uses the variance components of the g study to estimate the optimal number of conditions for each facet (i.e., rater and items) in order to maximize reliability (Webb and Shavelson, 2005). In the present study, the relevant indicator calculated by a d study is the generalizability coefficient. The generalizability coefficient is a reliability-like coefficient for norm-referenced, relative decisions (Webb and Shavelson, 2005). A generalizability coefficient ≥ 0.70 is commonly considered to be sufficiently reliable (e.g., Jentsch et al., 2020). Generalizability (G) theory was conducted in RStudio using the package gtheory (Moore, 2016). In the present study, G theory was conducted for three reasons. Firstly, we expect the g study to deliver informative insights into the structure of variance. Secondly, we report the generalizability coefficient of the d study as an indicator for reliability for the actual number of items and raters used in this study. Thirdly, the generalizability coefficient of the d study serves as an estimator of how a hypothetical increase in the number of raters would correspond with an increase in reliability.
In order to estimate the internal consistency (i.e., reliability) of the multi-item measurement scales, McDonald’s omega was calculated in RStudio using the psych package (Revelle and Revelle, 2015). According to Feißt et al. (2019), an omega >0.80 can be interpreted as a good internal reliability.
3.4.2 Research question 2: construct validity
In Research Question 2, we examine whether thin slices raters can distinguish between the two domains of the CLASS-T: Emotional and Behavioral Support (EBS) and Engaged Support for Learning (ESL). Therefore, we examined whether the theoretically assumed two domains of the measurement instrument are verified by a two-factorial measurement model. We assume that the first four items of the rating instrument load on the factor EBS and that the last three items of the rating instrument load on the factor ESL (see Table 1). We conducted a Bayesian fully cross-classified multilevel confirmatory factor analysis. All 46 teachers were assessed by the same eight raters. As a result, the data is (1) fully cross-classified (i.e., a multirater design; Koch et al., 2016) as well as (2) hierarchically structured (i.e., the teachers and the children are nested within classrooms). Therefore, we modeled covariance structures at two levels. The observed individual scores (i.e., thin slices ratings) are located at level 1, the within-group component (i.e., within-teacher component). The aggregated thin slices ratings are located at level 2, the between-group component (i.e., between-teacher component and between-rater component; Muthén, 1994; Dyer et al., 2005). In the present study, the within-teacher component pertains to the observed thin slices ratings of interaction quality of each individual teacher, while the between-teacher and between-rater components refer to the raters’ averaged scores assessing interaction quality of the teachers. Factor loadings as well as inter-factor correlations were calculated, including the within-teacher covariance matrix (Level 1) as well as the between-teacher and between-rater covariance matrix (Level 2), explaining variance on both levels (Figure 1). Calculations were conducted using Mplus Version 8 (Muthén and Muthén, 2017) by applying the Bayesian statistical paradigm. In Mplus, diffuse priors are used as the default (Muthén, 2010).

Figure 1. 2-factor model of thin slices ratings of interaction quality. w = within, b = between. EBS, emotional and behavioral support; ESL, engaged support for learning. EBS1−EBS4, emotional and behavioral support item 1 − item 4. ESL1−ESL3, engaged support for learning item 1 − item 3. Left of the slash are the between rater loading. Right of the slash are the between teacher loadings.
Particularly in studies with small or moderate sample sizes, Bayesian statistics can produce reasonable results (Muthén and Asparouhov, 2012; Alamri, 2019). The two available fit indices to assess the fit of a model are the posterior predictive p-value (ppp-value) and the 95% credibility interval for the difference between the observed and the replicated chi square values (Muthén and Asparouhov, 2012). A ppp-value above 0.05 indicates a good model fit (Asparouhov and Muthén, 2021). The 95% credibility interval should encompass zero (Muthén and Asparouhov, 2012; Alamri, 2019). When comparing a model with an alternative model, a smaller Deviance Information Criterion (DIC) value indicates a better model fit (Muthén, 2010).
3.4.3 Research question 3: convergent validity
In Research Question 3, we examine the data for evidence of convergent validity of the thin slices technique, as indicated by the match between the thin slices ratings and the ratings of the EarlyMath project based on the full-length videos (i.e., systematic ratings). We conducted bivariate Pearson’s correlation. Thin slices ratings were correlated with systematic ratings in two ways: (1) by correlating the scales of the seven items and (2) by correlating the scales of the two domains (EBS and ESL). Firstly, for each item of the thin slices ratings a scale was constructed by calculating the arithmetic mean over all raters. The scales of the seven items of the thin slices rating instrument were correlated with the seven items of the CLASS ratings. Secondly, we calculated scales for each domain (EBS and ESL) and calculated correlations between the two scales of the two measurement approaches (thin slices ratings vs. systematic CLASS ratings). According to Cohen (2013), effect sizes between 0.1 and 0.3 are considered weak, between 0.3 and 0.5 are considered medium and above 0.5 are considered large.
4 Results
4.1 Research question 1: reliability
All ICC(2) scores on the item level are moderate or good (Table 1). For example, the item “The teacher creates a positive climate in the group” reaches the highest value, with an ICC(2) of 0.80. Four items have ICC(2) scores greater than 0.70. Two items have ICC(2) scores greater than 0.50. The lowest agreement among the raters occurs for the item “The teacher gives the children useful feedback for mastering challenges,” with an ICC(2) of 0.51. Overall, this indicates a moderate to good level of agreement between thin slices raters.
Table 2 shows the results of the g study. Besides the residual (26.9%), the teachers (i.e., the objects of measurements) contribute the largest share of variability (18.2%). This indicates that 18.2% of the total variance is due to natural differences between teachers. The raters contribute 8.2% to the total variance. This is less than half the share of the teachers. In other words, natural differences between the objects of measurement (i.e., the teachers), which we expect to vary, contribute more than twice as much to the total variance as the characteristics of the raters. The items contribute 12.4% to the total variance, implying that, to a small extent, some items are systematically rated higher or lower than others.
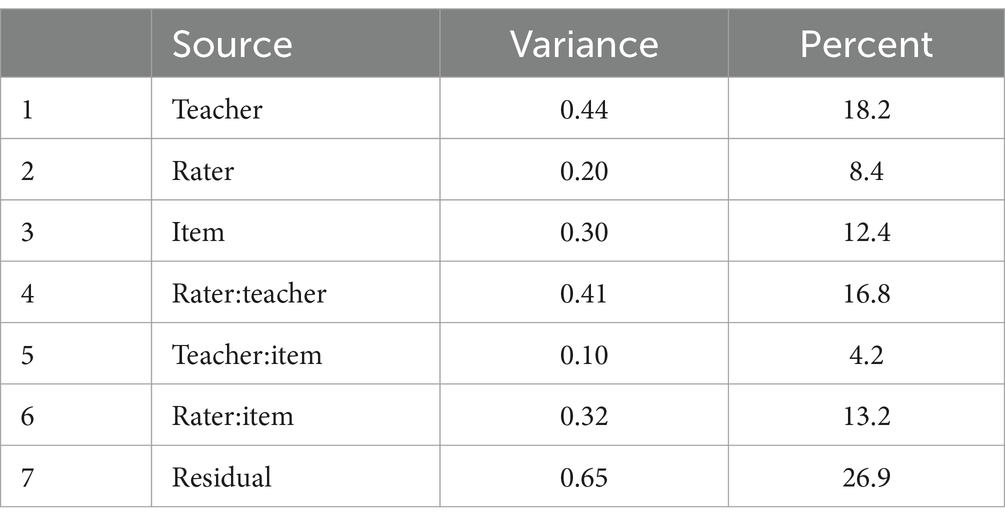
Table 2. G study: estimated variance components of the main effects, interaction effects and residual.
The d study (Table 3) yielded for the eight raters and seven items (the actual number of raters and items used in the present study) a generalizability coefficient of 0.85, which is far above the acceptable level of 0.70. As can be seen in Table 3, the returns from adding more raters are marginal. For example, a generalizability coefficient of 0.90 would be achieved with 15 raters using the same measurement instrument.

Table 3. D study: estimated generalizability coefficient for relative decisions.
The estimated McDonald’s omega value for the scale of the domain EBS was 0.86 and for the scale of the domain ESL was 0.87. An omega >0.80 can be interpreted as a good internal reliability (Feißt et al., 2019).
4.2 Research question 2 and 3: validity
To answer Research Question 2, we analyzed the data for evidence of construct validity (Figure 1). We specified a two-dimensional model of measurement to test whether thin slices ratings showed the expected two-factor structure. The results of the fully cross-classified multilevel confirmatory factor analysis indicated a two-factor structure. The ppp-value was 0.10 (larger than 0.05), indicating a good fit to the theoretically assumed model (e.g., Asparouhov and Muthén, 2021). The 95% confidence interval for the difference between the observed and the replicated chi square values ranged from −25.75 to 121.83. The values are encompassing zero. This implies an appropriate model fit as well (e.g., Arts et al., 2021). The DIC value was 6871.27. In comparison, a 1-factor model (i.e., all items loading on one factor) had a worse model fit, as indicated by the higher DIC value (7052.44). Moreover, in the 1-factor model, the ppp-value was 0.00 and the 95% confidence interval for the difference between the observed and the replicated chi square values ranged from 135.95 to 281.61.
To answer Research Question 3, we examined the data for evidence of convergent validity. Correlations were conducted in two ways. We correlated the scales of the seven items between the two approaches (i.e., thin slices ratings vs. systematic ratings; Table 4), and we correlated the scales of the two domains between the two approaches (Table 5).
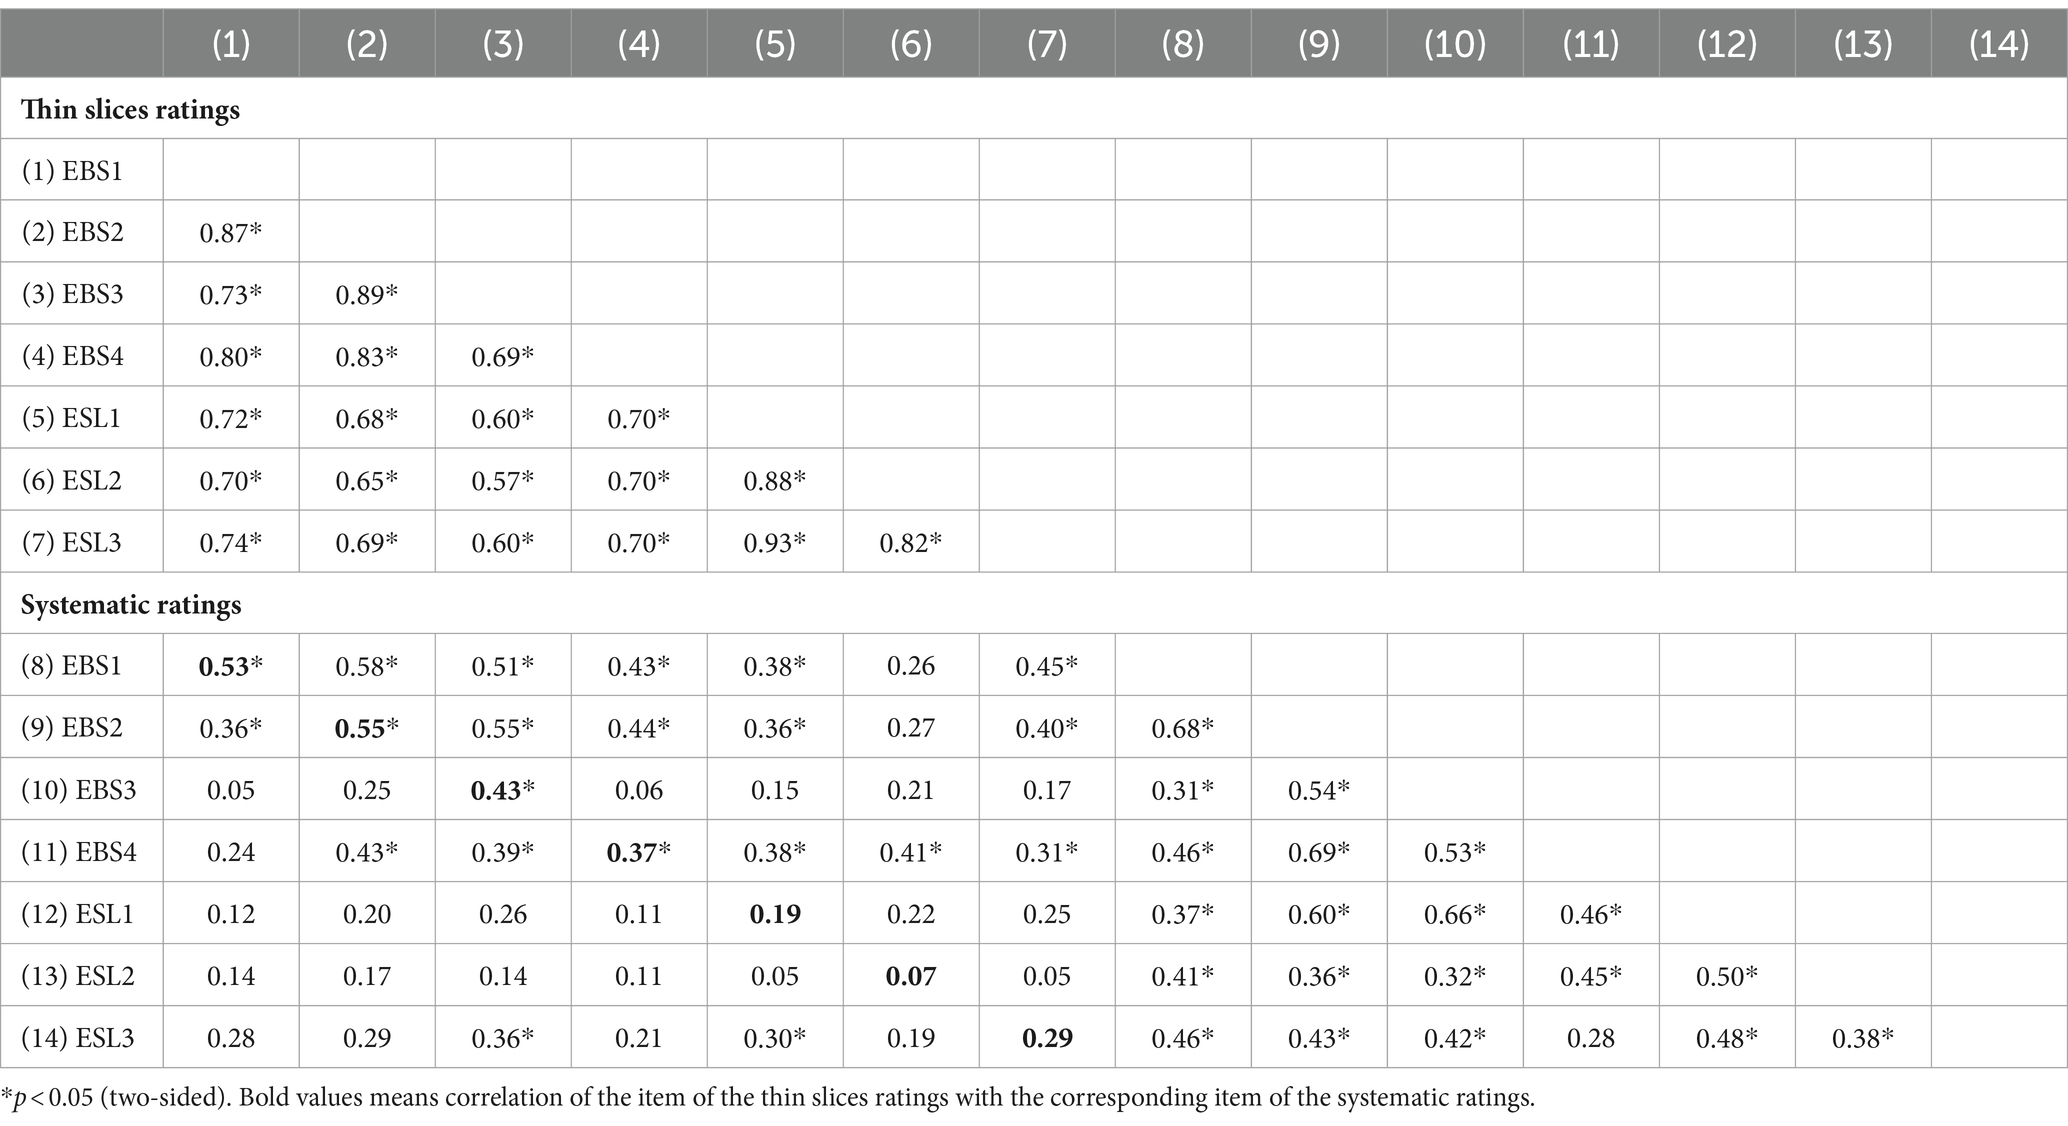
Table 4. Multitrait-multimethod matrix (Correlations between the thin slices ratings and systematic ratings on the item level).
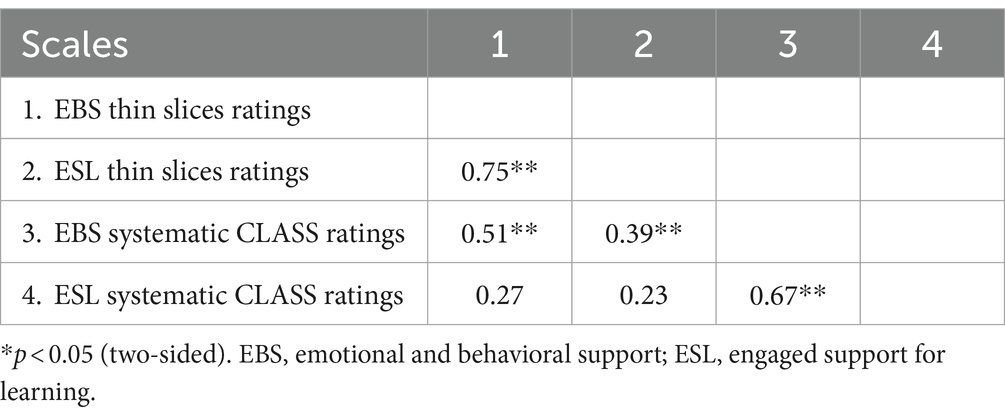
Table 5. Correlations between the two domains of the thin slices ratings and the systematic CLASS ratings.
As can be seen in Table 4 (rows 2 to 7), the inter-item correlations of the thin slices ratings in the heterotrait-monomethod triangle (Campbell and Fiske, 1959) were all highly significant. However, correlation estimates of thin slices items from different domains seem to be somewhat lower than within domains. In comparison, all inter-item correlation estimates of the CLASS ratings (rows 9 to 14 in columns 8 to 13) are significant as well.
The correlations of the thin slices items with the items of the systematic ratings can be seen in Table 4 in rows 8 to 14 in columns 1 to 7 (monotrait-heteromethod correlations; Campbell and Fiske, 1959). The coefficients of the validity diagonal (typeset in bold) represent the correlation of the thin slices item with the corresponding item of the systematic ratings. For the dimension EBS the correlations in the validity diagonal for all items were significant with medium or even large correlation estimates. We found high correlation estimates (r > 0.50) for the first two items. No significant correlations were found in the validity diagonal for the items of the dimension ESL. However, none of the items in the validity diagonal (typeset in bold) show exclusively the highest correlational values of their respective rows and columns. This means that items capturing different constructs correlate highest, instead of items capturing the same construct.
Table 5 shows the correlation of the scales of the two domains (EBS and ESL). Between the two measurement approaches (i.e., thin slices ratings vs. systematic ratings), the correlation of the EBS scales (r = 0.51) was highly significant, whereas the correlation of the ESL scales (r = 0.23) was not. In contrast, the correlations of the non-corresponding scales assessed via different approaches were in one case highly significant (r = 0.39). The highest correlations were found for the same approach of the corresponding dimension (r = 0.75; r = 0.68).
5 Discussion
The thin slices technique is applied in various research domains to observe, measure and predict human behavior based on minimal information. The thin slices technique seems to be a promising approach to assess interactional quality in ECEC centers as well as teaching quality in schools (Begrich et al., 2020, 2021; Sokolovic et al., 2021). Conventional observer studies in ECEC research are costly and labor-intensive, as the raters have to score classroom videos for several hours (Harms et al., 2017), and the coding of videos can be tedious and wearisome. The present study intends to examine whether thin slices raters relying solely on 30-s classroom videos accurately measure interaction quality in early childcare centers. We interpret the thin slices technique as a measurement approach and examine its psychometric accuracy by analyzing reliability (RQ1) and by collecting evidence of construct (RQ2) and convergent validity (RQ3). To our knowledge, no study has been conducted yet that examined evidence of construct and convergent validity of thin slices ratings of interaction quality in ECEC. Sokolovic et al. (2021) related thin slices ratings to live observation ratings and not to video-based ratings, as we did in the present study. Summarizing the results of the present study, thin slices ratings based on 30-s classroom videos showing a teacher interacting with children in early childcare centers are (1) predominantly reliable, (2) thin slices raters seem to be able to distinguish between the two domains of the measurement instrument, indicating evidence of construct validity and (3) thin slices ratings overlap at least partly with ratings based on the full-length videos, providing evidence of convergent validity.
5.1 Reliability of thin slices ratings (research question 1)
We examined the reliability of the measurement (i.e., thin slices ratings) in three ways. Firstly, we examined the interrater agreement. Secondly, we analyzed the internal consistency of the scales. Thirdly, we isolated and estimated the variances from various sources of the measurement (Generalizability theory; Brennan, 2001).
Interrater agreement on the item level (ICC2) was acceptable to good, indicating that the thin slices raters have a similar first impression about the teachers on the item level. The high McDonald’s omega values for both scales indicate that the items within each scale are strongly correlated and measure the same underlying construct, reflecting good internal reliability. In other words, the thin slices ratings are to a high degree similar and seem to be consistent regarding the measured construct. The results of the Generalizability theory (Brennan, 2001) indicate that the variability in the data can be attributed much more to natural differences between the teachers and much less to characteristics of the raters. Characteristics of the raters, such as leniency, strictness or the error of central tendency, contribute to a much lesser degree to the total variability in the data than the expected differences among teachers (i.e., the objects of measurement). Moreover, the relative g coefficient of the G theory also indicates a good reliability.
Looking at the reliability of the two domains, it seems that thin slices raters assess the domain Emotional and Behavioral Support (EBS) more reliably than the domain Engaged Support for Learning (ESL). We may engage in speculation about whether ESL is harder to assess reliably for thin slices raters in general or whether hints of teacher behavior related to ESL rarely occur in 30-s videos, and therefore 30-s thin slices videos suffer from insufficient information.
Comparing the results with another thin slices study conducted in ECEC centers, we note that the reliability of the thin slices ratings in the present study exceeds the reliability of previous research. Sokolovic et al. (2021) applied a thin slices coding approach to measure interaction quality in ECEC in two pedagogical situations—during mealtime observation and during a standardized situation. In particular, in the standardized situation, Cronbach’s alpha was higher in the present study (0.87) compared to Sokolovic and colleagues (0.76).
To put the results in perspective, the findings of the present study are less reliable compared to thin slices studies assessing teaching quality at school. Begrich et al. (2017, 2020, 2021) applied the thin slices technique to assess teaching quality at school along three quality dimensions. The reliability of these ratings proved to be excellent, with ICC2 up to 0.98. Although the reliability was not that high in the present study, we still consider the overall reliability to be predominantly good. For example, the estimated generalizability coefficient was 0.85 for the actual number of raters and items used in the present study, which is far above the acceptable level of 0.70.
By contrasting the results of the present study with the reliabilities of conventional rater studies in ECEC research, it seems that thin slices ratings are similarly reliable. In a meta-analysis (Egert et al., 2018), Cronbach’s alpha was <0.70 (or not reported) in 197 out of 289 studies, indicating that the reliability of thin slices ratings in the present study may compete with conventional ratings in ECEC research. Moreover, in almost half of the studies, the ICC or kappa was below (or not reported) 0.80, implying that the reliability of the present study seems to be in an almost similar range compared to conventional ratings in ECEC research (Egert et al., 2018). Using another example, and comparing the internal consistency of the present study with Cronbach’s alpha values from a conventional rater study (Thorpe et al., 2020), the EBS scale (0.86) and the ESL scale (0.84) in the present study demonstrated more reliable results compared to the respective scales (Cronbach’s alpha of 0.69 and 0.83) in the conventional rater study (Thorpe et al., 2020).
Considering the degree of standardization and the associated learning aims, we assume that a highly standardized situation, focusing on children’s learning progress, might induce various aspects of ESL more likely than a less standardized situation. Therefore, in a standardized situation, ESL might be assessed more reliably than in a less standardized situation. Further research is needed in order to examine the reliability of thin slices ratings of ESL according to the degree of standardization and the associated learning aims.
Overall, EBS seems to be measured more reliably compared to ESL. Moreover, thin slices ratings seem to yield similar reliable results compared to conventional studies in ECEC research. We did not find excellent reliabilities, however, we found predominantly good reliabilities. Therefore, we consider the expectations of Research Question 1 to be confirmed.
5.2 Validity of thin slices ratings (research question 2 and 3)
In Research Question 2 and 3, we examined the data for evidence of construct and convergent validity. To our knowledge, evidence of construct and convergent validity of thin slices ratings of interaction quality in ECEC settings has not yet been investigated empirically.
To examine evidence of construct validity (Research Question 2) of thin slices ratings along two domains (EBS and ESL) of interaction quality in ECEC settings, we conducted a fully cross-classified multilevel confirmatory factor analysis. We expected to find empirical evidence for the two-dimensional structure of the rating instrument. The parameters of the two-factor model (all items load on two factors as theoretically expected) indicated a good model fit. The results favored a two-factor model compared to a one-factor model (all items load on one factor).
Comparing the results of the present study (Research Question Q2) with a conventional observer study, we note that the thin slices technique may compete with traditional approaches. In a sample of 106 classrooms, evidence for the two-factor structure of the CLASS-T was found in conventional observer studies (Bichay-Awadalla and Bulotsky-Shearer, 2022). In line with these findings, our results also indicate evidence for a two-factor structure of the measurement instrument used in the present study. However, the measurement instrument of the present study was not the CLASS-T, but it was constructed based on the rationale of the CLASS-T and comprised the equivalent two domains.
To put the results of the present study (Research Question 2) in perspective, we juxtapose them with a similar thin slices study from Begrich et al. (2021), which examined evidence of construct validity of thin slices ratings of teaching quality at school. Teaching quality was conceptualized with three dimensions. The theoretically assumed three-dimensional structure of the measurement instrument was empirically confirmed with a three-factor measurement model. Similarly, we found evidence for construct validity of thin slices ratings along two domains of interaction quality in the present study. So far, the evidence of thin slices research implies that thin slices raters (of interaction quality in ECEC settings or of teaching quality at school) are able to differentiate between certain aspects of a measurement instrument.
The halo effect is a cognitive bias referring to the tendency that a positive impression in one area influences one’s opinion in other areas (Thorndike, 1920; Feeley, 2002). The results of Research Question 2 demonstrate that thin slices raters judged teachers according to their performance in the two domains of the measurement instrument and not based on an overall impression, such as sympathy or attractiveness. We interpret the findings of the present study that no evidence for the halo effect was detected.
Summarizing the results of Research Question 2, we found empirical evidence for a two-dimensional structure in the data, which we interpret as evidence for construct validity of thin slices ratings along two domains (EBS and ESL) of interaction quality in ECEC settings. We consider the expectations of Research Question 2 to be confirmed.
Following Research Question 3, we collected evidence of convergent validity of thin slices ratings. We analyzed the associations between the two approaches—thin slices ratings and ratings of observers who had watched the same, albeit full-length classroom videos (i.e., systematic ratings). We compared the associations between the two approaches on the item level as well as on the scale level.
Looking at the associations on the item level, the ratings between the two rater groups (thin slices raters vs. systematic raters) overlap substantially for the items of the first domain of interaction quality (EBS), meaning that interactional quality was judged similarly in both rater groups. In particular, the correlations between the first two items of the EBS domain were substantial. For the items of the second domain, ESL, thin slices raters and systematic raters hardly agree on the item level.
Regarding the overlap of the two domains (scale level) between the two approaches (thin slices ratings vs. systematic ratings), the EBS scales were highly associated. This means that both rater groups have a similar impression of interaction quality. However, the overlap between the ESL scales was low. This implies that the rater groups do not assess interaction quality related to learning similarly.
To contextualize the results of Research Question 3, we compare them with a similar thin slices study by Begrich et al. (2017, 2021), which analyzed evidence of convergent validity of thin slices ratings at school. Similarly, they found that both rater groups (thin slices raters and systematic raters) had a similar impression of supportive teacher behavior. However, the results from Begrich and colleagues indicated a substantial overlap between the two approaches for cognitively activating teacher behavior. This quality dimension covers similar aspects as the ESL domain. In the present study, no substantial correlations were found for ELS between the two approaches.
Although the eight thin slices raters had a similar impression of ESL (reliability), their ratings of ESL did not overlap with those of the systematic raters (validity). However, we do not know whether the systematic raters assess ESL indeed accurately. Conceivably, it is the ratings from the systematic raters relying on the full-length video that are incorrect and not those of the thin slices raters.
More research is required to analyze whether ESL is harder to observe per se, or whether it simply occurs more rarely and was not represented in the thin slices videos. Looking at the three teaching quality dimensions at school, Praetorius et al. (2014) demonstrated that cognitive activation is harder to assess accurately compared to teacher support because much more information is needed (i.e., more lessons need to be observed). From this stance, our finding may be in line with similar results detected in conventional rater studies in the context of teaching quality at school (Praetorius et al., 2014). The results of the present study raise the question whether the thin slices technique is an adequate approach to accurately measure ESL.
Summarizing the findings of Research Question 3, it seems that thin slices ratings overlap substantially with systematic ratings with respect to the EBS domain. However, the two approaches do not overlap with regard to the ESL domain. The results suggest that EBS might be assessed accurately with the thin slices technique. We consider the expectations of Research Question 3 to be at least partly confirmed.
5.3 General discussion
We conclude that thin slices raters form a similar first impression of interaction quality in ECEC based on minimal information. 30-s audiovisual stimulus material seems to be sufficient to induce in thin slices raters similar impressions of the teachers and the interactions seen in the videos. Further, thin slices ratings seem to be similarly accurate compared to conventional observer ratings based on considerably longer observational time. We have to stress that the video snippets were selected randomly. This means that the videos were not screened for specific teachers’ behaviors or actions. Thus, the teachers may not have displayed any behaviors indicative of the construct to be rated. Moreover, the thin slices technique can yield accurate results, although the videos contain no information about the context, such as learning materials, a lesson plan or the topic. For example, the thin slices raters do not need extra time to review learning materials. This advantage makes the thin slices technique a highly effective and economic assessment approach because the thin slices raters do not have to base their judgments on further information.
Almost all teachers were wearing facial masks, implying that their facial expressions were barely visible to the thin slices raters. Nonetheless, the thin slices ratings proved to be predominantly psychometrically accurate. Although facial expressions are crucial elements of nonverbal behavior, enough information related to the teacher’s (and children’s) nonverbal (or verbal) behavior seems to be conveyed, resulting in accurate thin slices ratings. Aspects of a person’s state, personality or characteristics of an interaction seem to chronically “leak through” in behavior (“nonverbal leakage”) and provide additional information that is not available in the verbal channel (Ekman and Friesen, 1969). The concept of nonverbal leakage might be involved in the explanation of the accuracy of the thin slices raters in the present study. Considering the sparse time for judgment formation and the diminished visibility of the facial expressions, the accuracy of the results could be attributed to the subtle nonverbal leakage of the teachers and the children. The results of the present study do not allow conclusions about a specific micro-behavior that could be particularly relevant for impression formation. While we cannot infer from the results which kind of micro-behavior was relevant for impression formation, we might infer which kind of micro-behavior was not relevant. The mouth (and the nose) were covered by facial masks by almost all teachers. Consequently, smiling may have had little to no influence on impression formation. This finding is not in line with Babad et al. (2003) who conducted a micro-analysis of molecular behavior, revealing that smiling, a relaxed face and the general facial expression seem to be important nonverbal cues. However, an alternative explanation could be that visible facial features, such as the eyes, which are related to smiling, convey information that social perceivers correctly interpreted as a smile.
From the perspective cognitive psychology, the accuracy of the thin slices technique is generally explained with dual process theories of social cognition (e.g., Wood, 2014). Dual process theories try to explain social cognition with two different systems of information processing. System 1 operates fast, automatically, associatively, intuitively and without conscious control. Typical processes of System 2 function analytically, reflectively, deliberately and consciously (Kahneman, 2011; Stanovich et al., 2014). Since the thin slices technique relies on minimal information, the quick and autonomous System 1 is considered to be the cognitive foundation underlying thin slices ratings (Wood, 2014). System 1 enables a rapid impression formation of others’ states, traits and interpersonal relations based on cues from their nonverbal behavior without the consumption of cognitive resources (Ambady, 2010). The consensus of the thin slices raters (interrater agreement) in the present study can be considered an indicator of a common underlying cognitive system. Subtle aspects of a teacher’s (and the children’s) nonverbal behavior were interpreted and decoded similarly, requiring a common underlying cognitive system, which can explain the predominantly homogeneous first impressions of the thin slices raters. Put differently, without a functional and effective universal human “deciphering machine,” which is adapted to decode and interpret human nonverbal behavior, the consensus among the thin slices raters would arguably not have been possible.
From an evolutionary perspective, the accuracy of first impressions produces a survival advantage, for example, by improving the function of groups (Ambady and Skowronski, 2008; Kahneman, 2011). The ability to intuitively and instantly detect the social climate within a group might be evolutionarily advantageous, as it allows individuals to avoid groups with harmful or dangerous dynamics. Agreement on the item level among the thin slices raters was highest for the first item (The teacher creates a positive climate in the group). This high interrater agreement, concerning the social atmosphere might be explained by the evolutionary old System 1, yielding evidence for System 1 as the underlying cognitive foundation of thin slices ratings. In thin slices research, an ecological approach to interpersonal perception (Gibson, 2014) is often discussed, which suggests that humans are attuned to various relevant social affordances associated with reproductive success. The overall agreement among the raters on the item level was higher for EBS compared to ELS. Items capturing EBS are related to the group atmosphere, caring behavior, emotional stable behavior or interpersonal sensitivity. Social relations, interpersonal warmth and the feeling of belongingness to a group are universal human needs (Maslow, 1954) and consequently, human interpersonal perception is particularly attuned and sensitive to the detection of these needs. This results in a similar decoding and common interpretation of human behavior, producing higher agreement on the item level of the EBS domain compared to the ELS domain.
The thin slices videos in the present study contained verbal and nonverbal information. The use of pronouns can lead people to perceive other relationships as closer and higher in quality (Fitzsimons and Kay, 2004). Asking questions, calling on children or talking to children require the use of pronouns or names. The thin slices videos used in the present study displayed an interaction-based situation (and not a frontal or less communication-based situation) what could imply that the teachers might have used pronouns or names frequently. Six out of seven items of the rating instrument had an item mean (Table 1) that was clearly above the theoretical scale mean, suggesting that the thin slices raters had a rather favorable impression of the teachers. A possible frequent use of names or pronouns might be reflected in the rather positive impressions of the relationship between the teachers and the children. From this perspective, the verbal content of the thin slices videos, specifically the use of pronouns, might be important for first impression formation. However, this speculation requires further examination (e.g., manipulating the frequency of pronoun use).
Intuitive and tacit knowledge seems to be crucial for domain expertise. Experts in a certain domain seem to be capable of making rapid and accurate decisions in highly demanding situations based on intuition (Cianciolo et al., 2006; Dane and Pratt, 2007). Thin slices ratings seem to rely on intuitive processes of System 1 and can be affected by expertise in a certain social context (Ambady et al., 2000; Ambady, 2010). Begrich et al. (2020) found that experts, relying on implicit knowledge, could assess teaching quality more validly compared to laypersons. The thin slices raters in the present study were highly trained and may be considered experts. We speculate that untrained raters, presumably, might have evaluated interaction quality less accurately. However, the present study cannot answer this question. Investigating this question is an endeavor for future research by comparing the accuracy of trained and untrained thin slices raters assessing interaction quality in childcare centers.
While analyzing the data, we observed that the videos at the beginning were more reliable (interrater agreement) than the videos at the end. We studied this by calculating the ICCs for the first 20 videos (videos 1–20) and compared the results to the ICCs of the last 20 videos (videos 27–46). Further, we found that the peak of accuracy was at around video 20. The sessions lasted about 52–55 min, and we did not take a break. Video 20 occurred at about 22 min. Rater overload or fatigue in surveys can become a problem after 15 to 20 min (e.g., Revilla and Ochoa, 2017). Hence, our findings may be in line with the literature. Although System 1 of dual process theories does not seem to be prone to fatigue (Kahneman, 2011), this finding needs to be scrutinized in depth by applying the appropriate research design.
At least five things can be learned from the present paper. Based solely on first impressions, thin slices raters come to a similar impression of interactional quality in ECEC settings (i.e., reliability). Secondly, the reliability of the thin slices ratings may be considered similarly reliable compared to systematic raters watching considerably longer video footage. Thirdly, thin slices raters are able to differentiate between the two domains of the measurement instrument (construct validity). Fourthly, with respect to one of the two domains, thin slices raters and systematic raters agree to a high degree in their impression of interaction quality (convergent validity). And fifthly, even though facial expressions were barely visible due to facial masks, the thin slices technique still delivered sound results.
5.4 Limitations
All raters in the present study were extendedly trained and certified (TeachStone, La Paro et al., 2012). In various studies, completely untrained, naive or inexperienced raters demonstrated the accuracy of the thin slices technique in a pedagogical context (e.g., Begrich et al., 2017, 2020, 2021). The results of the present study are limited to trained raters and cannot be generalized to different (e.g., untrained) rater populations. Further, all raters were females, undergraduates or doctoral students and young adults. Hence, it is unclear whether raters from a more diverse biographical background, concerning the age or education, might have produced comparable results.
The cameras and the student assistances operating the cameras were visible to the teachers and the children, implying that they were aware of being filmed. Therefore, reactive effects on the teachers’ behavior cannot be ruled out. However, this might not influence the relation between the two rater groups (systematic raters vs. thin slices raters), as both underlie these potential effects.
Even though thin slices ratings are much more economical compared to conventional observer ratings (Murphy, 2005), classroom video footage is still needed, of course. Like conventional observers watching hours of video footage, the thin slices technique relies on video footage, too. Regardless of whether thin slices videos are edited from longer video footage or whether videos would have been recorded exclusively as thin slices videos, the production of classroom video footage remains work-intensive and costly. Moreover, the thin slices technique cannot replace conventional ratings. Thin slices ratings may complement conventional ratings or be applied in large-scale studies, for example, to formatively evaluate the quality of ongoing research.
The measurement instrument used in the present study was self-constructed. Although it was based on the rationale of the CLASS-T (La Paro et al., 2012), the measurement instrument was not systematically validated. Therefore, further research should address whether the thin slices technique still yields accurate results with another measurement instrument.
In the present study, 30-s audiovisual classroom footage served as thin slices. Therefore, the results are restricted to these specific types of video (30-s audiovisual content). No inference can be made based on the design of the present study about different types of video. Additionally, the number of rated videos might influence reliability, as reliability could potentially decrease after a certain number of videos has been rated, which occurred around video 20 in the present study (see General Discussion).
5.5 Future research and practical implications
The central aim of institutionalized education (either in ECEC or at school) is to influence children’s development positively. From this perspective, the most important criterion a measurement of interaction quality has to withstand is whether it can predict children’s development accurately. Therefore, the next important research step should address the predictive validity of thin slices ratings of interaction quality in ECEC.
The consequential validity of the present study is an important aspect to discuss. We want to caution against an improper use or false conclusions, such as individual teacher evaluations or career decisions based solely on thin slices ratings.
Large-scale studies in ECEC research, involving dozens of teachers, are a huge enterprise that devours tremendous amounts of money. For example, the thin slices technique could be utilized as a quick quality assessment during the conceptualization of large-scale studies, for testing the rating instrument, or for optimizing the study design. The economical thin slices technique has the potential to deliver quick and accurate results. This means that vast amounts of data from a multitude of ECEC settings can be collected with only a fraction of the resources. We claim that the thin slices technique could indeed become a promising, complementary alternative to the established measurement methods in ECEC research. In comparison to the established, conventional measurement methods, the thin slices technique is a much cheaper approach with a promising potential. This remarkable potential of the thin slices technique can open entirely new perspectives and opportunities for the ECEC quality research community. However, much research has to be done until the thin slices technique can be used in practice reliably, credibly and trustworthy.
6 Conclusion
The results of the present study indicate that thin slices ratings of interaction quality in ECEC centers seem to yield predominantly reliable results. Thin slices ratings were found to be comparably reliable as conventional observer ratings based on much longer videos. Evidence of construct validity was found as thin slices raters could distinguish between the two domains of the measurement instrument. Thin Slices ratings and ratings based on full-length videos overlapped substantially for the domain Emotional and Behavioral Support. Almost all teachers were wearing facial masks, meaning that vast parts of their faces were only reduced visible or not visible at all. Nevertheless, thin slices rates delivered psychometrically accurate results. In other words, the fact that teachers were wearing facial masks did not lead to inaccurate results, but to predominantly accurate ratings in terms of reliability and validity. Based on previous research (Begrich et al., 2017, 2020, 2021; Sokolovic et al., 2021), trained as well as untrained raters seem to be able to accurately assess interaction quality in ECEC and teaching quality at schools. Summarizing the results, the thin slices technique is a promising alternative to complement conventional measurement approaches. However, more research is needed to elaborate and improve the procedure to further increase the accuracy of the thin slices technique.
Data availability statement
The sensitive video data is not publicly available as the participants have not given their consent. Requests to access the datasets should be directed to the corresponding author.
Ethics statement
The studies involving humans were approved by Jeanette Ziehm Chairwoman Ethics Committee (DIPF | Leibniz Institute for Research and Information in Education). The Ethics Committee of the University of Bamberg approved the EarlyMath project in which videos were conducted. The studies were conducted in accordance with the local legislation and institutional requirements. The participants provided their written informed consent to participate in this study.
Author contributions
KV: Conceptualization, Data curation, Formal analysis, Writing – original draft. FB: Conceptualization, Methodology, Resources, Writing – review & editing. MK: Conceptualization, Methodology, Writing – review & editing. AL: Conceptualization, Methodology, Writing – review & editing. LB: Conceptualization, Methodology, Writing – review & editing. SK: Conceptualization, Methodology, Supervision, Writing – review & editing.
Funding
The author(s) declare financial support was received for the research, authorship, and/or publication of this article. The EarlyMath project was supported by the German Research Foundation [grant numbers DO 2304/1-1, LE 3245/1-1, LI 3487/1-1, RO 820/18-1, and WE 1478/13-1]. The Slice Up project was supported by the German Research Foundation [KU 1939/7-1, 667870, 425958473].
Conflict of interest
The authors declare that the research was conducted in the absence of any commercial or financial relationships that could be construed as a potential conflict of interest.
Publisher’s note
All claims expressed in this article are solely those of the authors and do not necessarily represent those of their affiliated organizations, or those of the publisher, the editors and the reviewers. Any product that may be evaluated in this article, or claim that may be made by its manufacturer, is not guaranteed or endorsed by the publisher.
References
Alamri, A. A. S. (2019). Exploring the Behavior of Model Fit Criteria in the Bayesian Approximate Measurement Invariance: A Simulation Study. Tampa, FL: University of South Florida.
Ambady, N. (2010). The perils of pondering: intuition and thin slice judgments. Psychol. Inq. 21, 271–278. doi: 10.1080/1047840X.2010.524882
Ambady, N., Bernieri, F. J., and Richeson, J. A. (2000). Toward a histology of social behavior: judgmental accuracy from thin slices of the behavioral stream. Adv. Exp. Soc. Psychol. 32:271. doi: 10.1016/S0065-2601(00)80006-4
Ambady, N., and Rosenthal, R. (1992). Thin slices of expressive behavior as predictors of interpersonal consequences: a meta-analysis. Psychol. Bull. 111, 256–274. doi: 10.1037/0033-2909.111.2.256
Ambady, N., and Rosenthal, R. (1993). Half a minute: predicting teacher evaluations from thin slices of nonverbal behavior and physical attractiveness. J. Pers. Soc. Psychol. 64, 431–441. doi: 10.1037/0022-3514.64.3.431
Anders, Y. (2013). Stichwort: Auswirkungen frühkindlicher institutioneller Betreuung und Bildung [keyword: effects of institutionalized early childcare and education]. Z. Erzieh. 16, 237–275. doi: 10.1007/s11618-013-0357-5
Arts, I., Fang, Q., van de Schoot, R., and Meitinger, K. (2021). Approximate measurement invariance of willingness to sacrifice for the environment across 30 countries: the importance of prior distributions and their visualization. Front. Psychol. 12:624032. doi: 10.3389/fpsyg.2021.624032
Asparouhov, T., and Muthén, B. (2021). Advances in Bayesian model fit evaluation for structural equation models. Struct. Equ. Model. Multidiscip. J. 28, 1–14. doi: 10.1080/10705511.2020.1764360
Babad, E., Avni-Babad, D., and Rosenthal, R. (2003). Teachers' brief nonverbal behaviors in defined instructional situations can predict students' evaluations. J. Educ. Psychol. 95, 553–562. doi: 10.1037/0022-0663.95.3.553
Babad, E., Avni-Babad, D., and Rosenthal, R. (2004). Prediction of students' evaluations from brief instances of professors' nonverbal behavior in defined instructional situations. Soc. Psychol. Educ. 7, 3–33. doi: 10.1023/B:SPOE.0000010672.97522.c5
Baron, F., Linberg, A., and Kuger, S. (2022). Assessing global and math-specific teacher-child interaction quality in early childcare settings: a systematic literature review of instruments used in Reseach. Eur. Early Child. Educ. Res. J. 31, 640–659. doi: 10.1080/1350293X.2022.2154817
Barros, S., and Leal, T. B. (2015). Parents’ and teachers’ perceptions of quality in Portuguese childcare classrooms. Eur. J. Psychol. Educ. 30, 209–226. doi: 10.1007/s10212-014-0235-4
Bäumer, T., and Roßbach, H.-G. (2016). "Measurement of preschool quality within the national educational panel study – results of a methodological study," in Methodological issues of longitudinal surveys, eds. H.-P. Blossfeld, J. Mauricevon, M. Bayer, and J. Skopek (Wiesbaden: Springer VS), 543–560.
Begrich, L., Fauth, B., and Kunter, M. (2020). Who sees the most? Differences in students’ and educational research experts’ first impressions of classroom instruction. Soc. Psychol. Educ. 23, 673–699. doi: 10.1007/s11218-020-09554-2
Begrich, L., Fauth, B., Kunter, M., and Klieme, E. (2017). Wie informativ ist der erste Eindruck? Das thin-slices-Verfahren zur videobasierten Erfassung des Unterrichts [how informative is the first impression. The thin slices technique as video-based assessment of instruction]. Z. Erzieh. 20, 23–47. doi: 10.1007/s11618-017-0730-x
Begrich, L., Kuger, S., Klieme, E., and Kunter, M. (2021). At a first glance – how reliable and valid is the thin slices technique to assess instructional quality? Learn. Instr. 74:101466. doi: 10.1016/j.learninstruc.2021.101466
Belsky, J., Vandell, D. L., Burchinal, M., Clarke-Stewart, K. A., McCartney, K., Owen, M. T., et al. (2007). Are there long-term effects of early child care? Child Dev. 78, 681–701. doi: 10.1111/j.1467-8624.2007.01021.x
Bichay-Awadalla, K., and Bulotsky-Shearer, R. J. (2022). Examining the factor structure of the classroom assessment scoring system toddler (CLASS-T) in early head start and subsidized child care classrooms. Early Educ. Dev. 33, 309–325. doi: 10.1080/10409289.2021.1887700
Bliese, P., Chen, G., Downes, P., Schepker, D., and Lang, J. (2022). Multilevel: Multilevel functions. R package version 2.7. Available at: https://cran.rproject.org/web/packages/multilevel/index.html
Bronfenbrenner, U., and Morris, P. A. (2007). “The bioecological model of human development” in Handbook of child psychology. eds. W. Damon and R. M. Lerner (New York, NY: John Wiley & Sons), 793–828.
Burchinal, M., Magnuson, K., Powell, D., and Hong, S. S. (2015). “Early childcare and education” in Handbook of child psychology and developmental science: Ecological settings and processes. eds. M. H. Bornstein, T. Leventhal, and R. M. Lerner (New York, NY: John Wiley & Sons, Inc), 223–267.
Campbell, D. T., and Fiske, D. W. (1959). Convergent and discriminant validation by the multitrait-multimethod matrix. Psychol. Bull. 56, 81–105. doi: 10.1037/h0046016
Cianciolo, A. T., Matthew, C., Sternberg, R. J., and Wagner, R. K. (2006). “Tacit knowledge, practical intelligence, and expertise” in The Cambridge handbook of expertise and expert performance. eds. K. A. Ericsson, N. Charness, P. J. Feltovich, and R. R. Hoffman (New York, NY: Cambridge University Press), 613–632.
Dane, E., and Pratt, M. G. (2007). Exploring intuition and its role in managerial decision making. Acad. Manag. Rev. 32, 33–54. doi: 10.5465/AMR.2007.23463682
De Souza, A. C. D., Alexandre, N. M. C., and Guirardello, E. D. B. (2017). Psychometric properties in instruments evaluation of reliability and validity. Epidemiol. Serv. Saude 26, 649–659. doi: 10.5123/S1679-49742017000300022
Dyer, N. G., Hanges, P. J., and Hall, R. J. (2005). Applying multilevel confirmatory factor analysis techniques to the study of leadership. Leadersh. Q. 149:167. doi: 10.1016/j.leaqua.2004.09.00
Egert, F., Fukkink, R. G., and Eckhardt, A. G. (2018). Impact of in-service professional development programs for early childhood teachers on quality ratings and child outcomes: a meta-analysis. Rev. Educ. Res. 88, 401–433. doi: 10.3102/0034654317751918
Ekman, P., and Friesen, W. V. (1969). Nonverbal leakage and clues to deception. Psychiatry 32, 88–106. doi: 10.1080/00332747.1969.11023575
European Commission (2021). Early childhood education and care initiatives. Available at: https://education.ec.europa.eu/education-levels/early-childhood-education-and-care/about-early-childhood-education-and-care
Feeley, (2002). Comment on halo effects in rating and evaluation research. Hum. Commun. Res. 28, 578–586. doi: 10.1111/j.1468-2958.2002.tb00825.x
Feißt, M., Hennigs, A., Heil, J., Moosbrugger, H., Kelava, A., Stolpner, I., et al. (2019). Refining scores based on patient reported outcomes - statistical and medical perspectives. BMC Med. Res. Methodol. 19:9. doi: 10.1186/s12874-019-0806-9
Field, A. P. (2009). Discovering statistics using SPSS. (and sex, drugs and rock 'n' roll). 3rd Edn. London: SAGE Publications.
Fitzsimons, G. M., and Kay, A. C. (2004). Language and interpersonal cognition: causal effects of variations in pronoun usage on perceptions of closeness. Personal. Soc. Psychol. Bull. 30, 1267–1280. doi: 10.1177/0146167204264335
Fleiss, J. L., and Cohen, J. (1973). The equivalence of weighted kappa and the intraclass correlation coefficient as measures of reliability. Educ. Psychol. Meas. 33, 613–619. doi: 10.1177/001316447303300309
Fowler, K. A., Lilienfeld, S. O., and Patrick, C. J. (2009). Detecting psychopathy from thin slices of behavior. Psychol. Assess. 21, 68–78. doi: 10.1037/a0014938
Gibson, J. J. (2014). The ecological approach to visual perception. classic Edn. New York, NY: Psychology press.
Harms, T., Cryer, D., Clifford, R. M., and Yazejian, N. (2017). Infant/toddler environment rating scale (ITERS-3). New York: Teachers College Press.
Holleran, S. E., Mehl, M. R., and Levitt, S. (2009). Eavesdropping on social life: the accuracy of stranger ratings of daily behavior from thin slices of natural conversations. J. Res. Pers. 43, 660–672. doi: 10.1016/j.jrp.2009.03.017
Jentsch, A., Casale, G., Schlesinger, L., Kaiser, G., König, J., and Blömeke, S. (2020). Variability of instructional quality between and within lessons: generalizability of generic and subject-specific characteristics in mathematics instruction. Unterrichtswissenschaft 48, 179–197. doi: 10.1007/s42010-019-00061-8
Klieme, E. (2006). Empirische Unterrichtsforschung: aktuelle Entwicklungen, theoretische Grundlagen und fachspezifische Befunde. Einführung in den Thementeil [empirical instructional research: current developments, theoretical foundations, and subject-specific results]. Zeitschrift für Pädagogik 52, 765–773. doi: 10.25656/01:4487
Koch, T., Schultze, M., Jeon, M., Nussbeck, F. W., Praetorius, A. K., and Eid, M. (2016). A cross-classified CFA-MTMM model for structurally different and nonindependent interchangeable methods. Multivar. Behav. Res. 51, 67–85. doi: 10.1080/00273171.2015.1101367
Koo, T. K., and Li, M. Y. (2016). A guideline of selecting and reporting Intraclass correlation coefficients for reliability research. J. Chiropr. Med. 15, 155–163. doi: 10.1016/j.jcm.2016.02.012
La Paro, K. M., Hamre, B. K., and Pianta, R. C. (2012). Classroom assessment scoring system (CLASS) manual, toddler. Baltimore: Paul H. Brookes Publishing Company.
Lehrl, S., Linberg, A., Dornheim, D., Baron, F., Besser, N., Klemm, J., et al. (forthcoming). “Early Mathematical Development and the Importance of Interaction Quality in Daycare Centers” in A Methodological Report on the Conception and Implementation of the EarlyMath Project. eds. B. Blevins-Knabe and A. Austin. Available at: osf.io/5xq2k (Accessed March 19, 2023).
Lenske, G., and Helmke, A. (2015). “Child respondents – do they really answer what scientific questionnaires ask for?” in Multidisciplinary research on teaching and learning. eds. A. Kauertz, H. Ludwig, A. Müller, J. Pretsch, and W. Schnotz (Basingstoke: Palgrave Macmillan), 146–166.
Linberg, A., Kluczniok, K., Burghardt, L., and Freund, J. D. (2017). Quality of toddler childcare – can it be assessed with questionnaires? Early Child Dev. Care 189, 1369–1383. doi: 10.1080/03004430.2017.1380636
Linberg, A., Lehrl, S., Dornheim, D., Weinert, S., and Roßbach, H.-G. (2020). Mathematical development and the impact of interaction quality in early childcare (EarlyMath). Available at: osf.io/5xq2k (Accessed March 19, 2023).
Lüdtke, O., Robitzsch, A., Trautwein, U., and Kunter, M. (2009). Assessing the impact of learning environments: how to use student ratings of classroom or school characteristics in multilevel modeling. Contemp. Educ. Psychol. 34, 120–131. doi: 10.1016/j.cedpsych.2008.12.001
Melhuish, E., Ereky-Stevens, K., Petrogiannis, K., Ariescu, A., Penderi, E., et al. (2015). CARE curriculum quality analysis and impact review of European early childhood education and care (ECEC). A review of research on the effects of early childhood education and care (ECEC) upon child development.
Moore, C. T. (2016). gtheory: Apply Generalizability Theory with R. R package version 0.1.2. Available at: https://cran.r-project.org/web/packages/gtheory/gtheory.pdf
Murphy, N. A. (2005). Using thin slices for behavioral coding. J. Nonverbal Behav. 29, 235–246. doi: 10.1007/s10919-005-7722-x
Murphy, N. A., and Hall, J. A. (2021). Capturing behavior in small doses: a review of comparative research in evaluating thin slices for Behavioral measurement. Front. Psychol. 12:667326. doi: 10.3389/fpsyg.2021.667326
Murphy, N. A., Hall, J. A., Schmid Mast, M., Ruben, M. A., Frauendorfer, D., Blanch-Hartigan, D., et al. (2015). Reliability and validity of nonverbal thin slices in social interactions. Person. Soc. Psychol. Bull. 41, 199–213. doi: 10.1177/0146167214559902
Muthén, B. O. (1994). Multilevel covariance structure analysis. Sociol. Methods Res., 22, 376–398. doi: 10.1177/0049124194022003006
Muthén, B. O. (2010). Bayesian analysis in Mplus: a brief introduction. Technical Report. Los Angeles, CA: Muthén & Muthén.
Muthén, B. O., and Asparouhov, T. (2012). Bayesian structural equation modeling: a more flexible representation of substantive theory. Psychol. Methods 17, 313–335. doi: 10.1037/a0026802
Muthén, L. K., and Muthén, B. O. (2017). Mplus User’s Guide. (8th ed.). Los Angeles, CA: Muthén & Muthén.
NAEYC. (2009). Developmentally appropriate practice in early childhood programs serving children from birth through age 8 a position statement of the National Association for the education of young children. Available at: https://www.naeyc.org/sites/default/files/globally-shared/downloads/PDFs/resources/position-statements/PSDAP.pdf
OECD (2011). Starting strong III. A quality toolbox for early childhood education and care, starting strong. Paris: OECD Publishing.
Perlman, M., Falenchuk, O., Fletcher, B., McMullen, E., Beyene, J., and Shah, P. S. (2016). A systematic review and meta-analysis of a measure of staff/child interaction quality (the classroom assessment scoring system) in early childhood education and care settings and child outcomes. PLoS One 11:e0167660. doi: 10.1371/journal.pone.0167660
Praetorius, A. K., Klieme, E., Herbert, B., and Pinger, P. (2018). Generic dimensions of teaching quality: the German framework of three basic dimensions. ZDM 50, 407–426. doi: 10.1007/s11858-018-0918-4
Praetorius, A. K., Pauli, C., Reusser, K., Rakoczy, K., and Klieme, E. (2014). One lesson is all you need? stability of instructional quality across lessons. Learn Instr. 31, 2–12. doi: 10.1016/j.learninstruc.2013.12.002
Pretsch, J., Flunger, B., Heckmann, N., and Schmitt, M. (2013). Done in 60 s? Inferring teachers’ subjective well-being from thin slices of nonverbal behavior. Soc. Psychol. Educ. 16, 421–434. doi: 10.1007/s11218-013-9223-9
Revelle, W., and Revelle, M. W. (2015). Package ‘psych’. The comprehensive R archive network, 337:338. Available at: https://cran.r-project.org/package=psych
Revilla, M., and Ochoa, C. (2017). Ideal and maximum length for a web survey. Int. J. Mark. Res. 62, 538–545. doi: 10.1177/1470785320943049
Sammons, P., Anders, Y., Sylva, K., Melhuish, E., Siraj-Blatchford, I., Taggart, B., et al. (2009). “Children’s cognitive attainment and Progress in English primary schools during key stage 2: investigating the potential continuing influences of pre-school education” in Frühpädagogische Förderung in Institutionen. eds. H.-G. Roßbach and H.-P. Blossfeld (Wiesbaden: Springer VS), 179–198.
Sokolovic, N., Brunsek, A., Rodrigues, M., Borairi, S., Jenkins, J. M., and Perlman, M. (2021). Assessing quality quickly: validation of the responsive interactions for learning - educator (RIFL-Ed.) measure. Early Educ. Dev. 33, 1061–1076. doi: 10.1080/10409289.2021.1922851
Stanovich, K. E., West, R. F., and Toplak, M. E. (2014). Rationality, intelligence, and the defining features of type 1 and type 2 processing. In J. Sherman, B. Gawronski, and Y. Trope (Eds.), Dual processes in social psychology. NY: Guildford Publications Inc.
Thorndike, E. L. (1920). A constant error in psychological rating. J. Appl. Psychol. 4, 25–29. doi: 10.1037/h0071663
Thorpe, K., Rankin, P., Beatton, T., Houen, S., Sandi, M., Siraj, I., et al. (2020). The when and what of measuring ECE quality: analysis of variation in the classroom assessment scoring system (CLASS) across the ECE day. Early Child. Res. Q. 35, 274–286. doi: 10.1016/j.ecresq.2020.05.003
Vandell, D. L., Burchinal, M., and Pierce, K. M. (2016). Early child care and adolescent functioning at the end of high school: results from the NICHD study of early child care and youth development. Dev. Psychol. 52, 1634–1645. doi: 10.1037/dev0000169
Webb, N. M., and Shavelson, R. J. (2005). “Generalizability theory: overview” in Encyclopedia of statistics in behavioral science. eds. B. S. Everitt and D. C. Howell (Chichester, NH: John Wiley & Sons, Ltd.), 717–719.
Keywords: thin slices technique, ECEC research, interaction quality, psychometric accuracy, first impressions, applied measurement
Citation: Vinokic K, Baron F, Kunter M, Linberg A, Begrich L and Kuger S (2024) Using the thin slices technique to assess interactional quality in early childhood education and care settings. Front. Educ. 9:1368503. doi: 10.3389/feduc.2024.1368503
Edited by:
Robbert Smit, St. Gallen University of Teacher Education, SwitzerlandReviewed by:
Romana Burgess, University of Bristol, United KingdomHeather Prime, York University, Canada
Elisha Babad, Hebrew University of Jerusalem, Israel
Copyright © 2024 Vinokic, Baron, Kunter, Linberg, Begrich and Kuger. This is an open-access article distributed under the terms of the Creative Commons Attribution License (CC BY). The use, distribution or reproduction in other forums is permitted, provided the original author(s) and the copyright owner(s) are credited and that the original publication in this journal is cited, in accordance with accepted academic practice. No use, distribution or reproduction is permitted which does not comply with these terms.
*Correspondence: Konstantin Vinokic, k.vinokic@dipf.de; vinokic@gmx.de