Impact of head-down-tilt body position on abdomen resistance for urinary bladder monitory applications
 Todd J. Freeborn
 Shelby Critcher1
  Gwendolyn L. Hooper
- 1Department of Electrical and Computer Engineering, The University of Alabama, Tuscaloosa, AL, United States
- 2Capstone College of Nursing, The University of Alabama, Tuscaloosa, AL, United States
Tissue electrical impedance (or bioimpedance) is a quantity related to the passive, frequency-dependent electrical properties of a biological tissue and is a promising modality for continuous monitoring of relative bladder volume and bladder activity. In this study, the impact of body position [specifically 6° head-down tilt (HDT)] intended to induce fluid redistribution and, therefore, result in a change in the electrical resistance of the abdomen is evaluated. The abdomen resistance (10 kHz–100 kHz) of nine healthy young adults was measured before and after 240 min in a 6° HDT position. Over this period, the resistance increase was not statistically significant even though the average bladder volume increased by 506 mL. It was expected that the abdomen resistance would decrease with an increase in bladder volume over this period. The masking of the expected resistance decrease is attributed to the shift in the fluid from the legs/abdomen to the neck/chest caused by the HDT body position over this period. Overall, this suggests that methods to differentiate bladder volume changes from other types of fluid shifts in the body are needed for resistance-based monitoring under free-living conditions.
1 Introduction
The urinary bladder is a hollow muscular organ located in the pelvic floor, whose primary function is to store and release urine. The bladder is capable of altering its size and shape based on the volume of urine produced by the kidneys. Alterations in bladder size occur when stretch receptors are activated triggering the urge to urinate. When bladder dysfunction takes place, the inability to control urination results in a condition known as urinary incontinence (UI). UI affects 38.5% of U.S. men aged 60 years and above (Cao et al., 2022) and more than 60% of community dwelling adult women (Patel et al., 2022). In their study of the effect of UI on quality of life (QoL) in adults, Veronese, et al. reported that UI was associated with worse QoL (Veronese et al., 2022). Similarly, Cheng et al. explored the relationship between UI, depression, and anxiety and determined patients with UI had significantly higher levels of depression and anxiety compared to those without UI (Cheng et al., 2020). Beyond the impacts on individuals QoL, especially in older adults, UI (together with overactive bladder syndrome) was estimated to incur an economic burden of $65.9 billion on the US healthcare system in 2007 (Coyne et al., 2014).
With such a significant impact on people and the healthcare system, technologies to monitor the bladder are an active area of research. These technologies aim to support generating accurate data regarding the bladder to inform personalized treatment of those with bladder dysfunction. Continuous monitoring of bladder volume and pressure has the potential to help patients self-manage their conditions (by providing external cues regarding bladder volume for planning/execution of voiding), provide detailed information about bladder activity for clinicians, and evaluate changes in activity over time or in response to treatment. In their review of bladder monitoring systems, Semproni et al. identified imaging (e.g., ultrasound, electrical impedance tomography, and magnetic resonance imaging), localized tissue bioimpedance, and near-infrared spectroscopy as modalities that have been investigated for clinical and wearable bladder monitoring (Semproni et al., 2022). Bioimpedance sensing was identified as a promising modality for continuous monitoring (Semproni et al., 2022). This modality quantifies the passive, frequency-dependent electrical properties of a biological tissue, which are dependent on tissue type, structure/geometry, and fluid status (Dean et al., 2008; Grimnes and Martinsen, 2015). This association with fluid (Fenech and Jaffrin, 2004; Jaffrin and Morel, 2008) motivates the investigation of bioimpedance-based techniques for bladder volume monitoring. The non-invasive and automated evaluation of bladder volume has the potential to support diagnosis of bladder dysfunction by complementing or replacing bladder diaries as a clinical instrument. Bladder diaries are used to collect patient history on fluid intake, voiding patterns, and urine leakage events to assist clinicians in the diagnosis and treatment of UI (Gynecology & the American Urogynecologic Society, 2015). While providing critical information to a clinician, this instrument has limitations including compliance (e.g., failure to complete) and additional patient burden (Mehta et al., 2023). These issues could be resolved through the development of an accurate, reliable, non-invasive, and unobtrusive device for bladder volume monitoring.
To design such a device, bioimpedance technology is an attractive solution due to its low-cost (in comparison to other imaging modalities), safety (excitation currents are non-ionizing and below perception thresholds), and high potential for integration into wearable systems. Examples of recent reports of wearable bioimpedance systems focused on knee health (Teague et al., 2020; Critcher et al., 2023), the cardiovascular system (Wang et al., 2020; Qiu et al., 2022), and even bladder monitoring (Reichmuth et al., 2020) highlight this potential. Noyori et al. reported in their review of bioimpedance for bladder monitoring that this modality has been investigated for this application as early as 1975 (Noyori et al., 2022). Previous studies on this topic have reported abdomen impedance decreases due to increases in bladder volume and, conversely, abdomen impedance increases due to decreases (voiding) of the bladder (Abbey and Close, 1983; Shin et al., 2017; Gaubert et al., 2020; Reichmuth et al., 2020). These alterations are attributed to the fluid increase or decrease in the abdominal region. For these studies, the body position was controlled such that fluid changes in the abdomen could be attributed to changes in bladder volume. However, body position and changes in body position can induce fluid redistribution, which are not bladder volume related. Previous studies have reported changes in segmental resistance (which is the real component of measured impedance, discussed in further detail in later sections) resulting from transitions from sit to stand, sit to supine, supine to sit, etc., (BERG et al., 1993; Zhu et al., 1998; Fenech and Jaffrin, 2004; Yadollahi et al., 2015). From these works, a common trend is that segmental leg resistance changes with body positions as a result of the change in the hydrostatic gravitation gradient. More specifically, lying in a supine or head-down tilt (HDT) position increases the segmental leg resistance due to the movement of fluid out of this body segment and into the torso. Although this fluid shift has been previously documented, there has been limited investigation of the effect it could have on bladder monitoring using abdomen tissue bioimpedance. Only Shin et al. detailed how tissue resistance was altered during continuous bladder volume monitoring as a result of body positioning, reporting differences in abdomen resistance between sitting, standing, and supine positions collected over a short 10-min period (Shin et al., 2017). They attributed these changes to alterations in the shape of the abdomen (Shin et al., 2017). Their research did not explore how fluid shifts within the body, which may occur as a result of longer periods in different body positions, may impact the abdomen resistance and subsequent interpretation of bladder volume.
This provides the motivation for this work to evaluate the following question: are changes in abdominal resistance (a component of the overall tissue impedance) of human participants in response to short-term (4 h) 6° HDT body positioning similar to reported changes of participants in short-term supine (0°) body positioning from the literature? We hypothesize that the headword fluid shift induced by the HDT position will increase the abdomen resistance of this region and mask the resistance decrease caused by a bladder volume increase over the observation period. The use of the HDT position to induce fluid shifts, even though it is not a typical body position during daily living, is to facilitate comparison with available studies with participants in a supine (0°) position. The following sections outline the methods for collecting the abdomen tissue resistance from study participants, the methods for analysis, analysis results, and the discussion of these results in the context of previous bladder volume studies and the implications for wearable systems.
2 Methods
To evaluate the study question, the abdomen resistance from 10 to 100 kHz was collected from 10 healthy, young adults before and after their placement in a 6° HDT body position for 4 h. While tissue impedance (Z) has both resistance (R) and reactance (X) components, tissue resistance is most often associated with tissue fluids (Fenech and Jaffrin, 2004; Jaffrin and Morel, 2008). For this reason, this study collected and reported only the abdomen resistance and not abdomen reactance. It is important to note that these data were collected during the execution of the research study first reported by Freeborn et al. (2023) investigating segmental (leg, arm, and torso) fluid shifts during HDT body positioning. The presentation and analysis of the abdomen resistance and bladder volumes here represent the first reporting of these data.
2.1 Study participants
The inclusion criteria for participation required that participants should be between the ages of 18 and 40 years, have a body mass index (BMI) between 19 and 29, and be recreationally active (defined here as participating in moderate activity for 30 min at least three times per week for at least the previous 6 months). The exclusion criteria included any health conditions that may limit their participation in the HDT protocol (e.g., musculoskeletal issues, chronic back pain, and head trauma), conditions that may be exacerbated by fluid shifts (e.g., high intracranial pressure, ocular disease, and family history of thrombosis), or other chronic health conditions (hepatitis, HIV, and diabetes). The average and range (given as the standard deviation) of the age (in years), weight (kg), height (m), and BMI (kg/m2) of the participants included in data analysis are provided in Table 1. Prior to their participation in the study, each participant provided their written informed consent. This research and its activities were approved by the University of Alabama’s Institutional Review Board (UA IRB-19-022-ME) prior to the study launch.
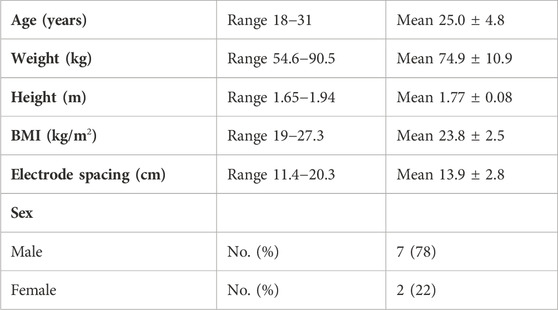
TABLE 1. Demographics of study participants (N = 9).
2.2 Participant preparation
Each participant fasted for 12 h prior to their arrival for data collection at the study facilities. After arrival, each participant was asked to void their bladder. Next, the skin surface of the abdomen was cleaned with isopropyl alcohol (70% solution) wipes. After cleaning and allowing the skin site to air dry, four adhesive Ag/AgCl electrodes (Kendall 133 electrodes) were placed on the abdomen. The specific sites of the placed electrodes are shown in Figure 1A, with I+ and I− electrodes placed at approximately three-quarters of the distance from the body midline to side and 6 cm below the navel. Then, V+ and V− electrodes were placed approximately 2.5 cm closer to the body midline from the I+ and I− electrodes, respectively. Using this approach, the distance between electrodes was different for each person but with the intent of capturing the same amount of abdomen region relative to their body size. The average electrode spacing distance for the study participants was 13.9 ± 2.8 cm. This location on the abdomen was selected because of its proximity to the urinary bladder in the human body, with a cross section of the anatomy of a human male shown in Figure 1B to visualize the bladder location. A sample of the approximate electrode locations relative to the bladder is also provided in the simplified cross section of Figure 1C. It should be noted that electrodes in Figure 1A are shown on the abdomen and segmental left/right legs. The leg electrodes are provided for later context regarding referenced segmental fluid shifts originally reported from this group of participants by Freeborn et al. (2023). After the placement of the Ag/AgCl electrodes, participants laid supine on a hospital bed (at 0° incline). Next, a Keysight E4990A precision impedance analyzer (Keysight Technologies, Santa Rosa, CA, United States) was interfaced to the on-body electrodes using 2 m cabling.
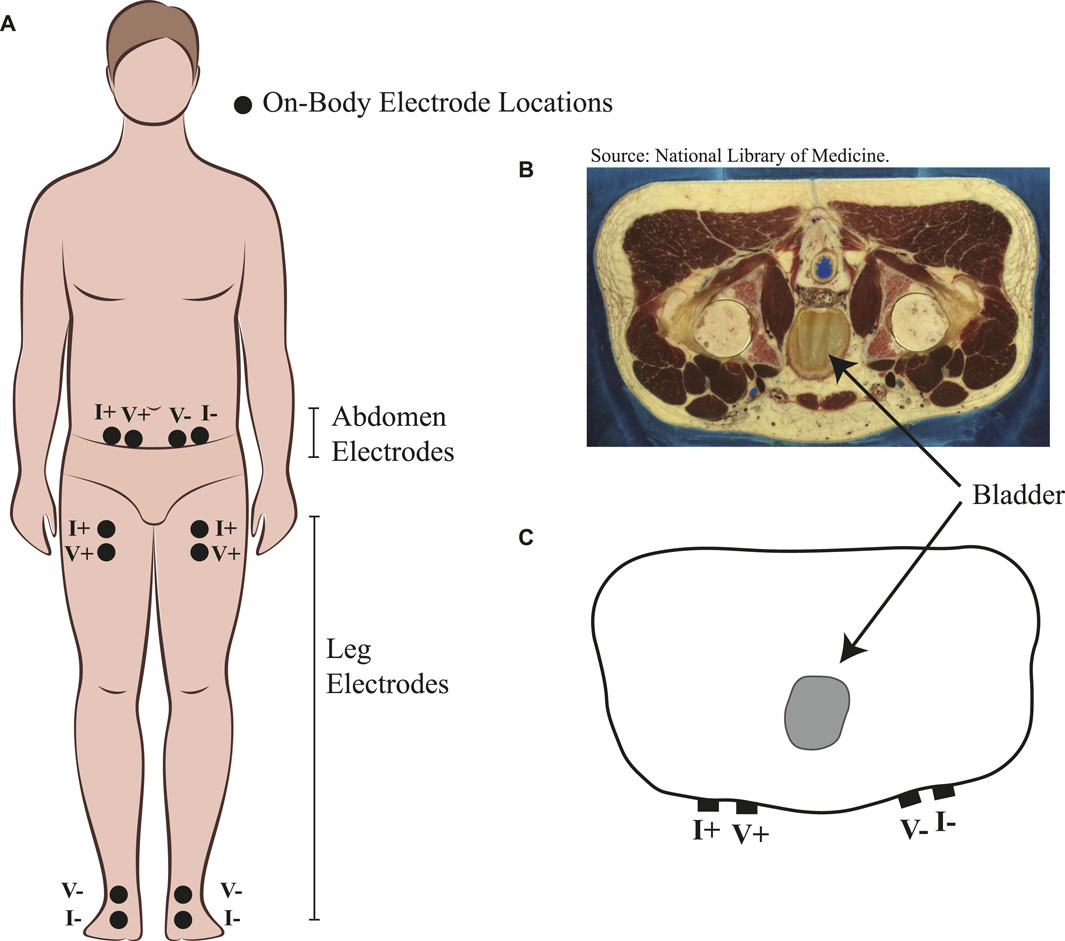
FIGURE 1. (A) Placement of Ag/AgCl electrodes on participants’ body for the measurement of abdomen resistance and segmental right/left leg resistance. (B) Abdomen cross section of an adult male from the Visible Human Project with reference to urinary bladder location and (C) simplified cross section highlighting electrode locations relative to urinary bladder location.
2.3 Measurement protocol
The abdomen resistance was collected using a Keysight E4990A impedance analyzer. This instrument has been previously investigated for the measurement of biological tissues and reported to have relative deviations less than 1% in the frequency band from 10 to 100 kHz for applications with high electrode/tissue interface impedance (Fu and Freeborn, 2019), which is representative of the measurements collected in this study. For this reason, measurements were collected from 10 to 100 kHz in this study with this instrument. Additionally, the open, short, load compensation procedure was applied prior to measurements from each study participant to minimize the errors introduced by cable residual impedance and parasitics in the experimental setup.
Impedance measurements were collected from a tetrapolar (e.g., four-lead) configuration of electrodes. In this configuration, a sinusoidal excitation at a fixed frequency is applied using two leads (I+, I−), and the excitation voltage across the target material or device is measured using two additional leads (V+, V−). These labels are used in Figure 1A to indicate how the instrument was connected to each participant. From the measured voltage and current, the overall impedance is calculated (Z = V/I) at each discrete frequency and reported in the resistance/reactance format: Z = R + jX. In this format, R is the resistance component of the impedance, X is the reactance component, and j is the representation of an imaginary number
For all measurements in this study, the instrument was set to not exceed a 1 mA current excitation, to sweep from 10 to 100 kHz, and to use the maximum measurement time (requiring 0.2 s per discrete frequency for measurements in the band from 1 to 100 kHz). After instrument setup, a baseline resistance was collected from each participant while they were in a 0° supine position (referred to in this work as the 0 min measurement). Next, the hospital bed was adjusted so that the participant experienced a 6° HDT position for a total period of 4 h. Participants were asked to limit their movements during this time but were allowed to reposition themselves (without standing or sitting up) as necessary for comfort. During this time, no participants voided their bladder and no liquid or food was ingested. After 4 h, the resistance was measured (referred to as the 240 min measurement). Then, the hospital bed was returned to 0° and the participants slowly transitioned from supine, to sitting, to standing as they were comfortable.
After transitioning to standing, which took approximately 20 min, participants were asked to completely void their bladder into a urine specimen collector. The volume from the specimen collector (rounded to the nearest 50 mL) was recorded. Participants’ urge to urinate at both 0 min and 240 min was also assessed. At these time points, they were asked to rate their feeling to urinate on a scale from 1 to 10, with 1 representing no urge to urinate and 10 representing an urge bordering on loss of bladder control.
2.4 Data post-processing
The collected multi-frequency (10 kHz–100 kHz) resistance data were processed in MATLAB (Veronese et al., 2022) to assess quality and limit datasets with artifacts (e.g., data that were not representative of the abdomen) from potential equipment errors or measurement conditions from affecting processing and interpretation. The data in Figure 2A represent data that align with the frequency-dependent tissue expectations, that is, a decrease in resistance with an increase in frequency, which, in this case, is shown as a decrease from approximately 72.5 Ω at 10 kHz to 62.2 Ω at 100 kHz for the 0 min data. The data in Figure 2F represent data with suspected artifacts in the 240 min measurements. This dataset does not show a consistent trend of a decrease in resistance with an increase in frequency. The visually jagged trend could be a result of muscle contractions/movement of the abdomen during measurements, which impacts the measurement or measurement conditions (e.g., quality of electrode contact with the body). Participants with artifacts in either their 0 min or 240 min datasets were removed from further analysis. Based on these data, participant 6 was excluded from further analysis. A total of nine participant datasets were included in the study analysis.
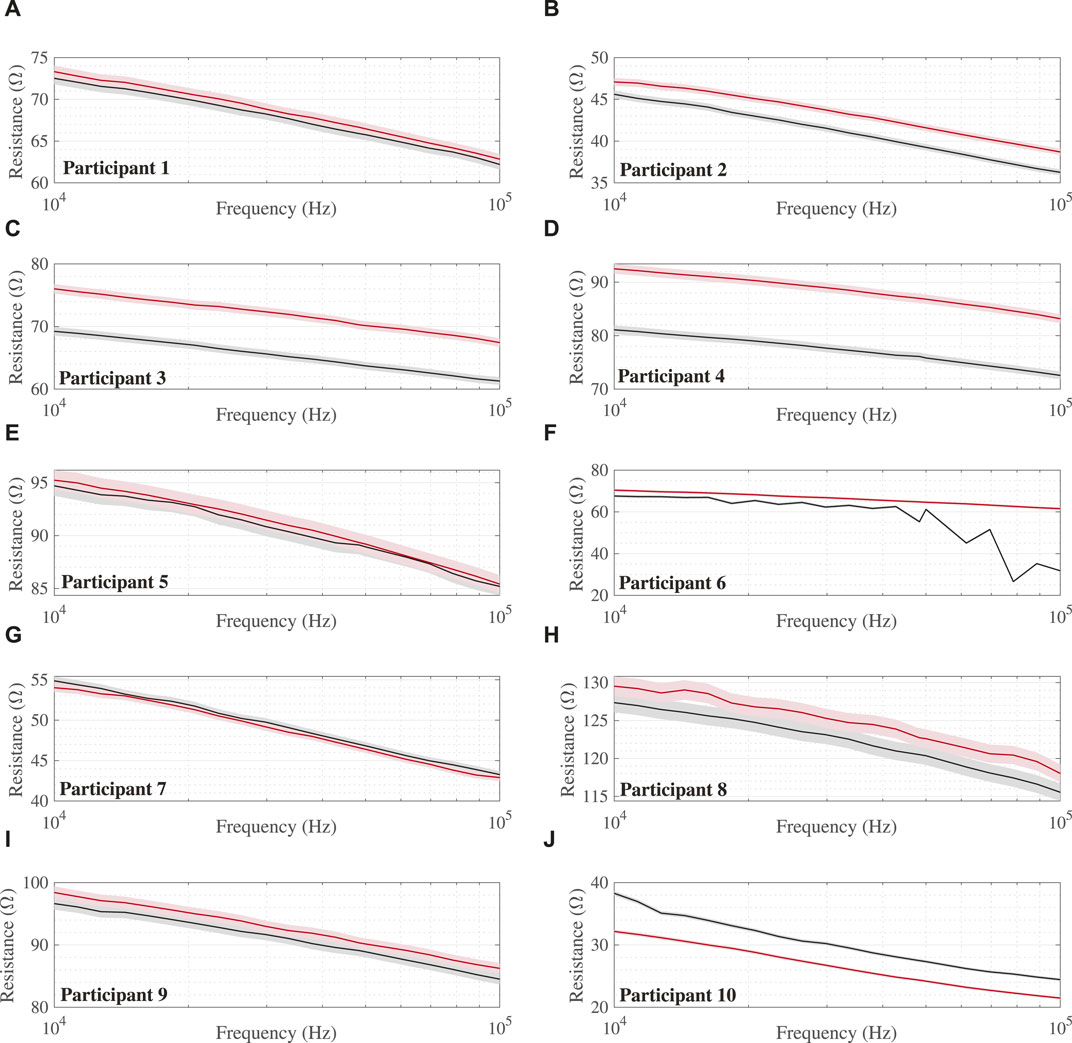
FIGURE 2. Multi-frequency (10 kHz–100 kHz) abdomen resistance from all 10 study participants (A–J) at 0 min (black lines) and 240 min (red lines) during the HDT protocol with shaded regions indicating 1% uncertainty intervals. Note: Participant 6 with data artifacts shown for reference but excluded from analysis.
3 Results
The multi-frequency (10 kHz–100 kHz) abdomen resistance data collected from all 10 study participants at 0 min (black lines) and 240 min (red) during the HDT protocol are given in Figure 2. The 1% uncertainty intervals, selected based on reports by Fu and Freeborn regarding deviations of this magnitude with this instrument in high-residual impedance configurations (Fu and Freeborn, 2019), are shown as shaded regions for all measurements. The baseline resistance of participants ranges from 38.3 Ω to 127.4 Ω (mean: 75.6 ± 28 Ω) at 10 kHz and 24.4 Ω to 115.5 Ω (mean: 65.0 ± 28.2 Ω) at 100 kHz. From a visual inspection of participant resistances, seven of nine cases show that the 240 min values are greater in value than those collected at 0 min.
The 10 kHz and 100 kHz resistances of the study participants are summarized using boxplots in Figures 3A, B, respectively. A Wilcoxon signed-rank test was conducted to determine the effect of time in the HDT position on the abdomen resistance. All statistical tests were completed using R version 4.3.1 and RStudio (Version 2023.06.2 + 561). The median 10 kHz resistance increase (3.49 Ω) between measurements at 0 min and 240 min was not statistically significant (p = 0.16). Furthermore, the median 100 kHz resistance increase (5.22 Ω) between measurements at 0 min and 240 min was not statistically significant (p = 0.13).
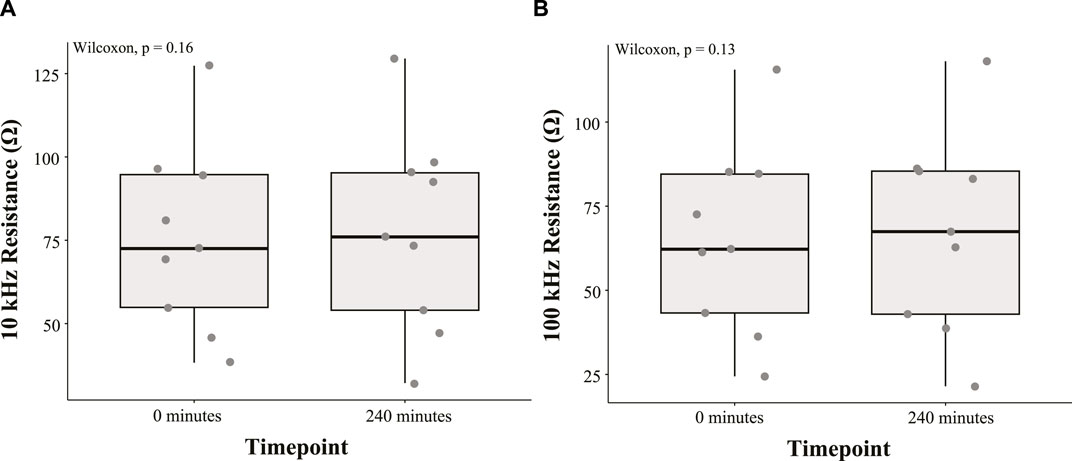
FIGURE 3. Boxplot summary of (A) 10 kHz and (B) 100 kHz abdomen resistance from nine study participants at 0 min and 240 min during the HDT position.
The volume of urine voided by the study participants after 240 min in the HDT position is given in Figure 4A. Measured volumes range from 200 mL to 900 mL with an average of 506 mL. With participants voiding their bladder immediately before starting the HDT protocol, this suggests each had an increase in bladder volume over the 240 min period. Additionally, participants’ self-reported urge to urinate at 0 and 240 min is given in Figure 4B, with median values of 1 and 5, respectively. A Wilcoxon signed-rank test was conducted to evaluate the statistical significance of this observed time effect. The increase in the median urge to urinate between measurements at 0 and 240 min was statistically significant (p = 0.014). These self-reports further support the increase in urine volume in the bladder over the protocol period.
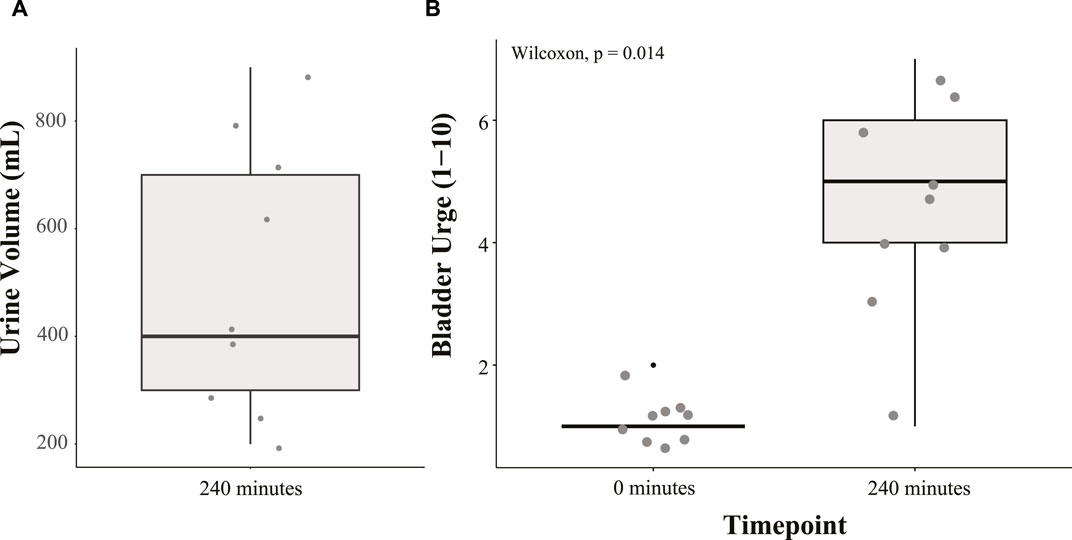
FIGURE 4. Boxplot summary of (A) urine volume voided by participants after 240 min in the HDT position and (B) desire to urinate (scale 1 to 10) at 0 min and 240 min in the HDT position.
4 Discussion
The average (and median) increase in abdomen resistance was 2.0 Ω (3.49 Ω) and 2.3 Ω (5.22 Ω) at 10 kHz and 100 kHz, respectively, after 4 h in the 6° HDT position, but these differences were not statistically significant (p < 0.05) based on the Wilcoxon signed-ranked tests. Over this time period, the bladder volume of these participants increased by an average of 506 mL (assuming they had an empty bladder after voiding prior to the protocol), which was expected to decrease the abdomen resistance in this region. This expectation is supported by previous studies reporting abdomen resistance from healthy adults in supine body positions.
• Abbey and Close reported statistically significant decreases with urinary bladder filling and increases with voiding from their study with 40 healthy adult participants. From visual review of data from individual participants in their study, changes up to approximately 3 Ω for the 75 kHz impedance were noted for bladder filling and voiding of volumes from 100 mL to 900 mL (Abbey and Close, 1983).
• Gaubert et al. reported increases of approximately 3.7 Ω and 2.7 Ω for the 5 kHz resistance after two healthy adult participants voided their bladders (after reaching an ultrasound assessed volume of 350 mL) (Gaubert et al., 2020).
• Reichmuth et al. reported an increase of approximately 4 Ω after a single adult voided their bladder (specific frequency not reported but instrumentation collected impedance from 1 kHz to 100 kHz) (Reichmuth et al., 2020).
A summary of these comparison studies and the results from this work are presented in Table 2 (where N.S. denotes not statistically significant). While using impedance technology has been reported in other studies, with a 2022 review provided by Noyori et al. (2022), the comparison studies referenced here had similar electrode configurations and body positions as this work. Overall, the data reported in the three comparison studies support that abdomen resistance (in the band from 1 kHz to 100 kHz measured in a tetrapolar configuration) decreases approximately 1 Ω–3 Ω as bladder volume increases in healthy adult participants (in supine body positions). An important assumption underlying our summary is that when values are reported as impedance without clear reference to either resistance or impedance magnitude, the reported values do represent resistance or are a close approximation of it. However, this highlights a limitation of this comparison and the need for future studies to clearly report impedance datasets as resistance/reactance, impedance/phase, or other specific combinations to improve direct comparisons of reported data across studies. From the presented summary though, we assume that resistance decreases up to 3 Ω would be observed in the HDT study participants if abdomen resistance was dominated by bladder volume increases. However, it is significant that this was not observed even with the observed increase in bladder volume (quantified by the post-study bladder voiding) of the study participants.
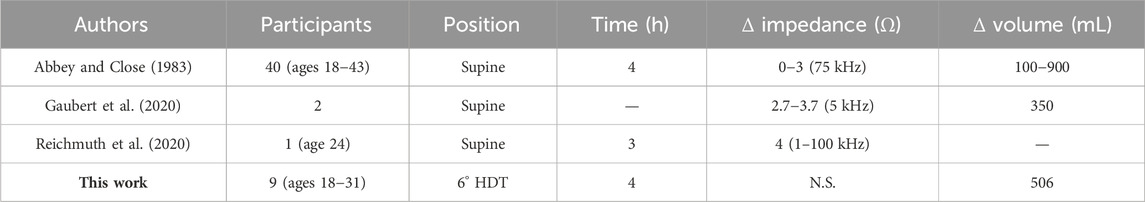
TABLE 2. Summary of studies reporting abdomen bioimpedance for bladder monitoring applications.
The lack of significant changes in the abdomen resistance, even with a bladder volume increase, could be attributed to a fluid decrease in the abdomen (but not the bladder) from the fluid shift toward the neck/chest induced by the gravitational gradient in this body position. As reported by Freeborn et al. in their investigation of segmental resistance changes in this body position, this group of participants had increases of approximately 11%–12% for the 10 kHz segmental leg resistance and 9% for the 100 kHz segmental resistance (Freeborn et al., 2023). For reference, the segmental leg resistances of the study participants were collected using the electrode configurations shown in Figure 1. The resistance increases support that the fluid was leaving the legs and moving into the torso. While the distribution of fluid in the torso was not evaluated in that study, the increase in abdomen resistance noted here for the majority of participants supports that fluids from the legs did not settle in the abdomen. If that occurred, it would be expected to decrease the resistance of this region between the placed measurement electrodes.
Therefore, the fluid shift caused by the study body position appears to be the dominant feature in the collected abdomen resistance of the participants studied, offsetting the changes in abdomen resistance resulting from the bladder filling. The significance of this is the impact that fluid shifts in the body could have on the interpretation of the abdomen resistance for bladder volume and activity monitoring. As an increase in abdomen resistance is typically interpreted as a decrease in bladder volume, if body position (and length of time in body position) is not factored into analysis/interpretation, incorrect volume estimates could be generated from a bioimpedance-based system.
Limitations of the current study that impact the conclusions that can be drawn from this observational data include the following:
• The electrodes were placed using relative spacing between pairs (I+/V+ and I−/V−) for each person with the intent of measuring relatively similar abdomen regions relative to body size. This approach may alter the contribution of the urinary bladder to the abdomen impedance based on the induced current distribution in the body. The two participants with resistance decreases in Figure 3 could be a result of this, with their abdomen resistance having higher sensitivity to bladder volume based on electrode spacing and bladder location within their body. However, it is not possible to evaluate this aspect using only the abdomen resistance available in this study and requires further future investigation.
• The use of only one electrode configuration prevented the evaluation of how different configurations may be impacted by the head-ward fluid shifts and identification of configurations that are least impacted by this. Li et al. reported differences in the voltage response measured at the skin surface in simulation and experimental studies using different excitation/measurement locations (Li et al., 2019). From their results, they reported an electrode pairing with excitation electrodes approximately 3 cm from the center of the abdomen and sensing electrodes at the leftmost and rightmost points on the abdomen having the greatest voltage changes comparing empty and full (600 mL) bladder cases (Li et al., 2019). The configuration identified by Li et al. may result in greater current density through the bladder which could limit sensitivities of measured impedance to non-bladder fluid shifts.
• The placement of participants in one body position (6° HDT) induced a head-ward fluid shift to observe effects of this redistribution, but it does not capture the range of body positions that persons are expected to transition between during their daily living. While these data support that fluid shifts in the body can mask expected impedance decreases from bladder volume increases, further study is needed to quantify how time in multiple different body positions may impact bladder monitoring using bioimpedance methods. This knowledge is needed to advance systems that can provide accurate reporting over all expected conditions.
• The study had a small sample (N = 9) of participants that were healthy young adults and predominantly men. With UI significantly impacting older adults, especially older women, future studies need to evaluate the bladder resistance of older adults with larger study sample sizes. This is necessary to determine if there are differences in abdomen resistance and normative values for older populations as a result of aging (and to incorporate that knowledge into a system designed specifically for older adults). There are also limited details available on how differences in body composition, specifically subcutaneous fat in the abdomen region for participants with higher BMI, will impact impedance measurements of this region and the estimation of bladder volume or activity.
While bioimpedance-based systems continue to have the potential to support bladder monitoring applications, it is clear that further focus is needed to advance knowledge relating to resistance data (and also reactance data, which have yet to be explored) to bladder volumes/activity and to develop robust wearable solutions for free-living monitoring. Future recommendations for such systems include functionality to 1) identify data artifacts from motion or contraction, 2) correct or remove data artifacts to limit misinterpretation, 3) identify body position and length of time in a body position to estimate additional fluid shifts, 4) differentiate between fluid shifts attributed to bladder volume changes and changes due to body position, and 5) compensate for electrode movement (both within and between days) to increase the usability of this system. Beyond this technical set of features, it will be important to design systems to meet the unique needs of the groups these systems aim to support. With the significant impact that UI has on older adult populations, it will be important to evaluate the specific needs of this population and how to design these systems to meet them and be easily usable.
Achieving these functionalities may require the use of additional sensing modalities to identify both tissue impedance and context of collected measurements. Future studies should explore sensing modalities that complement bioimpedance to capture movement (e.g., inertial measurement units) and muscle activity (e.g., surface electromyography). The additional sensing modalities are expected to increase the accuracy of fluid estimates by helping identify when motion-related artifacts are introduced to the resistance data, which can be used to either remove or correct degraded data. These future efforts are expected to help advance solutions to provide comprehensive bladder monitoring to support the personalized and continuous monitoring of people with bladder dysfunction.
5 Conclusion
There were no statistically significant differences in the abdomen resistance of the study participants after 4 h in the 6° HDT position even though an average bladder volume increase of 506 mL was observed. The expected resistance decreases from increases in bladder volume are believed to have been masked by the fluid shifts induced by the gravitational gradient in this position. This highlights that body position and fluid redistribution from it can significantly impact the interpretation of abdomen resistance for bladder monitoring applications. Therefore, future bioimpedance-based wearable systems for bladder volume/activity monitoring will require methods to differentiate bladder fluid changes from body position-based fluid redistribution for accurate and robust reporting.
Data availability statement
The raw data supporting the conclusion of this article will be made available by the authors, without undue reservation.
Ethics statement
The studies involving humans were approved by the University of Alabama Institutional Review Board. The studies were conducted in accordance with the local legislation and institutional requirements. The participants provided their written informed consent to participate in this study.
Author contributions
GH, SC, and TF all contributed to the conception and design of the study. TF performed data analysis, wrote the original manuscript draft, and reviewed and edited the manuscript. SC collected data and performed reviews and edits. All authors contributed to the article and approved the submitted version.
Funding
This research was supported by funding from the Alabama NASA EPSCoR FY19 Research Infrastructure Development, grant 80NSSC19M0051.
Acknowledgments
The authors would like to thank Ashley Favara, Amanda Cooper, and Chloe Hogue for their support during data collection with study participants. Further thanks go to Heather Cole for her logistical support in coordinating facilities for data collection.
Conflict of interest
The authors declare that the research was conducted in the absence of any commercial or financial relationships that could be construed as a potential conflict of interest.
Publisher’s note
All claims expressed in this article are solely those of the authors and do not necessarily represent those of their affiliated organizations, or those of the publisher, the editors, and the reviewers. Any product that may be evaluated in this article, or claim that may be made by its manufacturer, is not guaranteed or endorsed by the publisher.
References
Abbey, J. C., and Close, L. (1983). Electrical impedance measurement of urinary bladder fullness. J. Microw. Power 18, 305–309. doi:10.1080/16070658.1983.11689335
Berg, H. E., Tedner, B., and Tesch, P. A. (1993). Changes in lower limb muscle cross-sectional area and tissue fluid volume after transition from standing to supine. Acta Physiol. Scand. 148, 379–385. doi:10.1111/j.1748-1716.1993.tb09573.x
Cao, C., Zhang, C., Sriskandarajah, C., Xu, T., Gotto, G., Sutcliffe, S., et al. (2022). Trends and racial disparities in the prevalence of urinary incontinence among men in the USA, 2001–2020. Eur. Urol. Focus 8, 1758–1767. doi:10.1016/j.euf.2022.04.015
Cheng, S., Lin, D., Hu, T., Cao, L., Liao, H., Mou, X., et al. (2020). Association of urinary incontinence and depression or anxiety: a meta-analysis. J. Int. Med. Res. 48, 030006052093134. doi:10.1177/0300060520931348
Coyne, K. S., Wein, A., Nicholson, S., Kvasz, M., Chen, C.-I., and Milsom, I. (2014). Economic burden of urgency urinary incontinence in the United States: a systematic review. J. Manag. Care Pharm. 20, 130–140. doi:10.18553/jmcp.2014.20.2.130
Critcher, S., Parmelee, P., and Freeborn, T. J. (2023). Localized multi-site knee bioimpedance as a predictor for knee osteoarthritis associated pain within older adults during free-living. IEEE Open J. Eng. Med. Biol. 4, 1–10. doi:10.1109/OJEMB.2023.3256181
Dean, D., Ramanathan, T., Machado, D., and Sundararajan, R. (2008). Electrical impedance spectroscopy study of biological tissues. J. Electrost. 66, 165–177. doi:10.1016/j.elstat.2007.11.005
Fenech, M., and Jaffrin, M. (2004). Extracellular and intracellular volume variations during postural change measured by segmental and wrist-ankle bioimpedance spectroscopy. IEEE Trans. Biomed. Eng. 51, 166–175. doi:10.1109/TBME.2003.820338
Freeborn, T. J., Critcher, S., and Hooper, G. (2023). Segmental tissue resistance of healthy young adults during four hours of 6-degree head-down-tilt positioning. Sensors 23, 2793. doi:10.3390/s23052793
Fu, B., and Freeborn, T. J. (2019). Residual impedance effect on emulated bioimpedance measurements using keysight e4990a precision impedance analyzer. Measurement 134, 468–479. doi:10.1016/j.measurement.2018.10.080
Gaubert, V., Gidik, H., and Koncar, V. (2020). Proposal of a lab bench for the unobtrusive monitoring of the bladder fullness with bioimpedance measurements. Sensors 20, 3980. doi:10.3390/s20143980
Grimnes, S., and Martinsen, Ø. G. (2015). Bioimpedance and bioelectricity basics. third edn. Oxford: Academic Press. doi:10.1016/B978-0-12-411470-8.09001-2
Gynecology & the American Urogynecologic Society (2015). Practice bulletin no. 155: urinary incontinence in women. Obstetrics Gynecol. 126. doi:10.1097/AOG.0000000000001148
Jaffrin, M. Y., and Morel, H. (2008). Body fluid volumes measurements by impedance: a review of bioimpedance spectroscopy (bis) and bioimpedance analysis (bia) methods. Med. Eng. Phys. 30, 1257–1269. doi:10.1016/j.medengphy.2008.06.009
Li, Y., Peng, Y., Yang, X., Lu, S., Gao, J., Lin, C., et al. (2019). Analysis of measurement electrode location in bladder urine monitoring using electrical impedance. Biomed. Eng. Online 18, 34. doi:10.1186/s12938-019-0651-4
Mehta, S., Geng, B., Xu, X., and Harmanli, O. (2023). Current state of bladder diary: a survey and review of the literature. Int. Urogynecology J. 34, 809–823. doi:10.1007/s00192-022-05398-w
Noyori, S. S., Nakagami, G., and Sanada, H. (2022). Non-invasive urine volume estimation in the bladder by electrical impedance-based methods: a review. Med. Eng. Phys. 101, 103748. doi:10.1016/j.medengphy.2021.103748
Patel, U. J., Godecker, A. L., Giles, D. L., and Brown, H. W. (2022). Updated prevalence of urinary incontinence in women: 2015-2018 national population-based survey data. Female Pelvic Med. Reconstr. Surg. 28, 181–187. doi:10.1097/spv.0000000000001127
Qiu, C., Wu, F., Han, W., and Yuce, M. R. (2022). A wearable bioimpedance chest patch for real-time ambulatory respiratory monitoring. IEEE Trans. Biomed. Eng. 69, 2970–2981. doi:10.1109/TBME.2022.3158544
Reichmuth, M., Schurle, S., and Magno, M. (2020). “A non-invasive wearable bioimpedance system to wirelessly monitor bladder filling,” in 2020 Design, Automation & Test in Europe Conference & Exhibition, Grenoble, France, 09-13 March 2020, 338–341. doi:10.23919/DATE48585.2020.9116378
Semproni, F., Iacovacci, V., and Menciassi, A. (2022). Bladder monitoring systems: state of the art and future perspectives. IEEE Access 10, 125626–125651. doi:10.1109/ACCESS.2022.3221816
Shin, S.-c., Moon, J., Kye, S., Lee, K., Lee, Y. S., and Kang, H.-G. (2017). “Continuous bladder volume monitoring system for wearable applications,” in 2017 39th Annual International Conference of the IEEE Engineering in Medicine and Biology Society (EMBC), Jeju, Korea (South), 11-15 July 2017, 4435–4438. doi:10.1109/EMBC.2017.8037840
Teague, C. N., Heller, J. A., Nevius, B. N., Carek, A. M., Mabrouk, S., Garcia-Vicente, F., et al. (2020). A wearable, multimodal sensing system to monitor knee joint health. IEEE Sensors J. 20, 10323–10334. doi:10.1109/JSEN.2020.2994552
Veronese, N., Smith, L., Pizzol, D., Soysal, P., Maggi, S., Ilie, P.-C., et al. (2022). Urinary incontinence and quality of life: a longitudinal analysis from the English longitudinal study of ageing. Maturitas 160, 11–15. doi:10.1016/j.maturitas.2022.01.010
Wang, T.-W., Chu, H.-W., Chen, W.-X., Shih, Y.-T., Hsu, P.-C., Cheng, H.-M., et al. (2020). Single-channel impedance plethysmography neck patch device for unobtrusive wearable cardiovascular monitoring. IEEE Access 8, 184909–184919. doi:10.1109/ACCESS.2020.3029604
Yadollahi, A., Singh, B., and Bradley, T. D. (2015). Investigating the dynamics of supine fluid redistribution within multiple body segments between men and women. Ann. Biomed. Eng. 43, 2131–2142. doi:10.1007/s10439-015-1264-0
Keywords: resistance, body position, bioimpedance, bladder volume, abdomen
Citation: Freeborn TJ, Critcher S and Hooper GL (2024) Impact of head-down-tilt body position on abdomen resistance for urinary bladder monitory applications. Front. Electron. 5:1238967. doi: 10.3389/felec.2024.1238967
Received: 12 June 2023; Accepted: 26 February 2024;
Published: 08 March 2024.
Edited by:
Parikshit Sahatiya, Birla Institute of Technology and Science, IndiaReviewed by:
Nazanin Neshatvar, University College London, United KingdomPaul Annus, Tallinn University of Technology, Estonia
Copyright © 2024 Freeborn, Critcher and Hooper. This is an open-access article distributed under the terms of the Creative Commons Attribution License (CC BY). The use, distribution or reproduction in other forums is permitted, provided the original author(s) and the copyright owner(s) are credited and that the original publication in this journal is cited, in accordance with accepted academic practice. No use, distribution or reproduction is permitted which does not comply with these terms.
*Correspondence: Todd J. Freeborn, tjfreeborn1@eng.ua.edu