
- 1 Laboratory for Molecular Endocrinology – GPCRs, Western Australian Institute for Medical Research and Centre for Medical Research, University of Western Australia, Perth, WA, Australia
- 2 Drug Discovery Biology, Monash Institute of Pharmaceutical Sciences and Department of Pharmacology, Monash University, Parkville, VIC, Australia
- 3 Pediatric Endocrinology, Department of Pediatrics, Stanford University, Stanford, CA, USA
The bioluminescence resonance energy transfer (BRET) technique has become extremely valuable for the real-time monitoring of protein–protein interactions in live cells. This method is highly amenable to the detection of G protein-coupled receptor (GPCR) interactions with proteins critical for regulating their function, such as β-arrestins. Of particular interest to endocrinologists is the ability to monitor interactions involving endocrine receptors, such as orexin receptor 2 or vasopressin type II receptor. The BRET method utilizes heterologous co-expression of fusion proteins linking one protein of interest (GPCR) to a bioluminescent donor enzyme, a variant of Renilla luciferase, and a second protein of interest (β-arrestin) to an acceptor fluorophore. If in close proximity, energy resulting from oxidation of the coelenterazine substrate by the donor will transfer to the acceptor, which in turn fluoresces. Using novel luciferase constructs, we were able to monitor interactions not detectable using less sensitive BRET combinations in the same configuration. In particular, we were able to show receptor/β-arrestin interactions in an agonist-independent manner using Rluc8-tagged mutant receptors, in contrast to when using Rluc. Therefore, the enhanced BRET methodology has not only enabled live cell compound screening as we have recently published, it now provides a new level of sensitivity for monitoring specific transient, weak or hardly detectable protein–protein complexes, including agonist-independent GPCR/β-arrestin interactions. This has important implications for the use of BRET technologies in endocrine drug discovery programs as well as academic research.
Introduction
Bioluminescence resonance energy transfer (BRET) is gaining increasing recognition as an advantageous approach for detecting protein–protein interactions in living cells and real time (Xu et al., 2003; Pfleger and Eidne, 2006; Pfleger et al., 2006a; Kocan et al., 2008). In particular, it has been utilized to investigate G protein-coupled receptor (GPCR) interactions with both membrane and cytosolic proteins (Milligan, 2004; Milligan and Bouvier, 2005; Pfleger and Eidne, 2005; Pfleger et al., 2006a), including many critical for endocrine function. BRET is notably suitable for the detection of activation-dependent GPCR–protein interactions, especially involving scaffolding, regulatory and signaling proteins such as β-arrestins (Pfleger et al., 2006b; Kocan et al., 2008; Kocan and Pfleger, 2009).
The BRET method is based on heterologous co-expression of fusion proteins linking one protein of interest (e.g., GPCR) to a bioluminescent donor enzyme, a variant of Renilla luciferase (luminophore: Rluc, hRluc, Rluc2, or Rluc8), and a second protein of interest (e.g., β-arrestin) to an acceptor fluorophore, a variant of green fluorescent protein (Venus or GFP10). If the luminophore and fluorophore are less than 10 nm apart (Dacres et al., 2010), energy resulting from the rapid oxidation of a cell-permeable coelenterazine substrate by the luminophore will transfer to the fluorophore, which in turn fluoresces at a longer wavelength. BRET detection can be carried out using scanning spectrometry or dual-filter luminometry. Energy transfer implies that these molecules are in close proximity, and therefore, the proteins of interest (e.g., GPCR and β-arrestin) fused to the donor and acceptor interact directly or as part of a complex (Pfleger and Eidne, 2006; Pfleger et al., 2006a,b; Kocan et al., 2008). There are currently two main BRET systems, BRET1 and BRET2. The BRET1 system uses the luciferase substrate coelenterazine h (benzyl-coelenterazine), with light emission peaking at ∼480 nm. Light emission from the corresponding acceptor is then observed at longer wavelengths following energy transfer (e.g., peaking at ∼510 nm for enhanced green fluorescent protein (EGFP) or ∼530 nm for yellow fluorescent proteins such as Venus). In contrast, the BRET2 system uses the luciferase substrate DeepBlueC (also known as coelenterazine 400a, bisdeoxycoelenterazine, or di-dehydro coelenterazine), with consequent light emission peaking at about ∼400 nm. GFP10 or GFP2 is used as acceptor, with light emission peaking at ∼510 nm following energy transfer (Milligan and Bouvier, 2005; Pfleger and Eidne, 2006; Pfleger et al., 2006a; Kocan et al., 2008, 2009; Kocan and Pfleger, 2009). The BRET1 system exhibits a higher BRET signal, in comparison to BRET2, allowing weaker interactions to be detected. Whereas the advantage of BRET2 is the increased separation of donor and acceptor emission spectra, which provides greater signal resolution. There is also recent experimental evidence to suggest that BRET2 has a greater Förster distance (distance at which the resonance energy transfer efficiency is half-maximal) than BRET1, these distances being determined as 4.4 and 7.5 nm respectively (Dacres et al., 2010).
We have recently demonstrated advances in the BRET technology enabling its application for live cell compound screening as exemplified using the thyrotropin-releasing hormone receptor (TRHR) interaction with β-arrestin (Kocan et al., 2008). These advances revolve around the use of novel luminophores Rluc2 and Rluc8 developed by the Gambhir laboratory (Loening et al., 2006), the latter of which is increasingly being adopted as the preferred luciferase for BRET (De et al., 2007, 2009; Guo et al., 2008; Kocan et al., 2008, 2009; Kamal et al., 2009; See et al., 2011). In the current study, we have demonstrated how these novel luminophores have enabled detection of both agonist-induced GPCR/β-arrestin interactions utilizing orexin receptor 2 (OxR2), and agonist-independent GPCR/β-arrestin interactions using wild type vasopressin type II receptor (V2R) and its clinically relevant mutants with gain-of-function (V2R-R137C and V2R-R137L) or loss-of-function (V2R-R137H). Crucially, by comparing the use of different forms of luciferase fused to these vasopressin receptors, we show that the interactions observed using Rluc8 (Kocan et al., 2009) could not be detected using Rluc in the same configuration.
Materials and Methods
Materials
Orexin A (OxA) and Orexin B (OxB) were from the American Peptide Company (Sunnyvale, CA, USA) and arginine vasopressin (AVP) was from Sigma-Aldrich (Castle Hill, Australia). The β-arrestin 2/Venus construct was prepared from pC2-Venus kindly provided by Atsushi Miyawaki (RIKEN Brain Science Institute, Wako-City, Japan). A PCR product for the Venus coding sequence was substituted in-frame into pcDNA3-β-arrestin 2/Rluc replacing the Rluc cDNA as described previously (Kocan et al., 2008). The β-arrestin 2/GFP10 construct was prepared from the vector pcDNA3.1-GFP10 kindly provided by Michel Bouvier (Department of Biochemistry, University of Montreal, Canada). A PCR product for the GFP10 coding sequence was substituted in-frame into pcDNA3-β-arrestin 2/Venus replacing the Venus cDNA as described previously (Kocan et al., 2008). Rluc8 cDNAs were amplified from the construct pcDNA3.1-Rluc8. This was kindly provided by Andreas Loening and Sanjiv Gambhir (Stanford University, Stanford, CA, USA; Loening et al., 2006). OxR2/Rluc was sub-cloned in a similar manner to the previously described OxR2/EGFP (Pfleger et al., 2006b), generated from a construct kindly provided by M. Yanagisawa (Howard Hughes Medical Institute, TX, USA). The EGFP tag was substituted in frame by the Rluc tag. PCR products for hRluc, Rluc2, or Rluc8 coding regions were substituted in-frame into pcDNA3-OxR2/Rluc replacing the Rluc cDNA to generate OxR2/hRluc, OxR2/Rluc2, and OxR2/Rluc8. The V2R-wild type/Rluc8, V2R-R137C/Rluc8, V2R-R137L/Rluc8, and V2R-R137H/Rluc8 constructs have been described previously (Kocan et al., 2009). The V2R-wild type/Rluc, V2R-R137C/Rluc, V2R-R137L/Rluc, and V2R-R137H/Rluc constructs were generated from the corresponding Rluc8-tagged constructs using the pcDNA3-TRHR/Rluc construct described previously (Kocan et al., 2008).
Cell Culture and Transfection
HEK293FT and COS7 cells were maintained at 37°C, 5% CO2 in Complete Media (Dulbecco’s Modified Eagle’s Medium containing 0.3 mg/ml glutamine, 100 IU/ml penicillin and 100 μg/ml streptomycin; Gibco-BRL, Gaithersburg, MD, USA) supplemented with fetal calf serum (FCS; Gibco Life Technologies, Paisley, UK; 10% for HEK293FT and 5% for COS7 cells). Transient transfections were carried out 24 h after seeding using GeneJuice (Novagen) according to the manufacturer’s instructions.
Measurement of Total Inositol Phosphate Production
Cells were split into 24-well plates 24 h following transient transfection, in inositol-free Complete Medium (MP Biomedicals, Irvine, CA, USA) containing 1% dialyzed FCS. The dose–response data were generated using COS7 cells and the comparison of luminophores using HEK293FT cells. Six to eight hours later medium was replaced with inositol-free medium containing 1% dialyzed FCS and [3H]myo-inositol (Amersham Pharmacia Biotech, Uppsala, Sweden; 2 μCi/ml for dose–response curves and 1 μCi/ml for comparison of luminophores), followed by overnight incubation. Subsequently, cells were washed once with buffer A (1 mg/ml fatty acid-free BSA, 140 mM NaCl, 20 mM HEPES, 4 mM KCl, 8 mM D-glucose, 1 mM MgCl2 and 1 mM CaCl2), and again with buffer A plus 10 mM LiCl before incubating at 37°C for 50 min in buffer A containing 10 mM LiCl with or without agonist. After incubation, the assay buffer was removed and replaced with 10 mM formic acid for 1 h at 4°C. The acid was subsequently transferred to 5 ml tubes and the inositol phosphates bound to AG1-X8 anion-exchange resin (Bio-Rad Laboratories, Hercules, CA, USA). Following washes with water and 60 mM ammonium formate/5 mM sodium tetraborate, inositol phosphates were eluted with 1 M ammonium formate/0.1 M formic acid; 1 ml samples were mixed with 4 ml of Optiphase HiSafe 2 scintillant (Wallac, Turku, Finland) and radioactivity measured using a 1209 Rackbeta liquid scintillation counter (Wallac). Total inositol phosphates were obtained by solubilizing cells in plates and inositol phosphate counts obtained from resin expressed relative to total inositol phosphate counts. All treatments were performed in triplicate.
Spectral Analysis of Luminescent Proteins
HEK293FT cells were seeded in six-well plates at a density of 630,000 cells per well and transfected with OxR2 cDNA (0.4 μg for all OxR2 constructs) and β-arrestin 2 cDNA (0.6 μg for all β-arrestin 2 constructs). Twenty-four hours after transfection, cells were harvested without trypsin in HEPES-buffered phenol red-free complete medium containing 5% FCS and added to a poly-L-lysine-coated white 96-well plate (Nunc, Rochester, NY, USA). Subsequently, the plate was incubated at 37°C, 5% CO2. At 48 h after transfection, medium in the plate was replaced with medium containing luciferase substrate: 5 μM coelenterazine h (for BRET1) or 10 μM DeepBlueC (for BRET2). Emission spectral scans were performed using a Cary Eclipse spectrophotometer (Varian, Palo Alto, CA, USA).
Real-Time Kinetic Bret Assays Detecting Agonist-Induced and Agonist-Independent GPCR–Protein Interactions in Real Time and Live Cells
HEK293FT cells were seeded in six-well plates at a density of 630,000 cells per well and transfected with OxR2 cDNA (0.4 μg for all OxR2 constructs) and β-arrestin 2 cDNA (0.6 μg for all β-arrestin 2 constructs) or alternatively with V2R cDNA (0.1 μg for all V2R constructs) and β-arrestin 2 cDNA (0.3 μg for all β-arrestin 2 constructs). These cDNA amounts were established as the best cDNA ratio/amounts for BRET following systematic comparison of different amounts. At 24 h after transfection, cells were harvested in HEPES-buffered phenol red-free complete medium containing 5% FCS and added to a poly-L-lysine-coated white 96-well plate (Nunc) that was then incubated at 37°C, 5% CO2. Medium in the plate was replaced with PBS containing 5 μM coelenterazine h (for BRET1) or 10 μM DeepBlueC (for BRET2) and assays carried out immediately. BRET measurements were taken at 37°C using the VICTOR Light plate reader with Wallac 1420 software (PerkinElmer). Filtered light emissions were sequentially measured through both the donor wavelength window (370–450 nm for luciferase with DeepBlueC or 400–475 nm for luciferase with coelenterazine h) and acceptor wavelength window (500–525 nm for GFP10 or 520–540 nm for Venus). For agonist-induced interactions, the BRET signal was calculated by subtracting the ratio of emission through the acceptor wavelength window over emission through the donor wavelength window for a vehicle-treated cell sample from the same ratio for a second aliquot of the same cells treated with agonist, as described previously (Pfleger et al., 2006a,b; Kocan et al., 2008). Note that in this calculation, the vehicle-treated cell sample represents the background, eliminating the requirement for measuring a “donor-only” control sample (Pfleger et al., 2006a,b; Kocan et al., 2008). For agonist-independent interactions, the BRET ratio above wild type baseline was calculated as the ratio of emission through the acceptor wavelength window over emission through the donor wavelength window for each cell sample minus the same ratio for the vehicle-treated V2R-wild type cell sample. This calculation is similar to the ligand-induced BRET ratio described above, except that the background is determined using the vehicle-treated V2R-wild type cell sample to observe agonist-independent BRET signals compared with V2R-wild type as described previously (Kocan et al., 2009). The final pretreatment reading is presented at the zero time point (time of ligand or vehicle addition).
Results
Functional Validation of GPCR/Luminophore Fusion Proteins
Bioluminescence resonance energy transfer constructs are prepared by fusing the protein of interest with the BRET tag (luminophore or fluorophore). Newly cloned fusion proteins need to be validated to ensure that addition of the tag does not impair their proper function (Pfleger et al., 2006b; Kocan et al., 2008). Total inositol phosphate assays, routinely used to evaluate ligand-induced Gq/11-mediated signaling, demonstrated that addition of Rluc to OxR2 did not alter the potency or efficacy of G protein-coupling following activation by either OxA or OxB (Figure 1). The logEC50 (logM ± SEM) values upon OxA treatment were −8.6 ± 0.3 and −8.2 ± 0.6 for untagged and Rluc-tagged OxR2 respectively. Upon OxB treatment, these values were −8.6 ± 0.2 and −8.4 ± 0.1 respectively. Moreover, no significant difference in inositol phosphate production was observed when comparing constructs with the different luminescent tags: Rluc, hRluc, Rluc2, and Rluc8 (Figure 2). Furthermore, the demonstration of a ligand-induced receptor/β-arrestin interaction shown below provides additional confirmation of functionality. BRET-tagging of V2R constructs (wild type and the three mutants V2R-R137C, V2R-R137L, and V2R-R137H) was validated previously (Kocan et al., 2009).
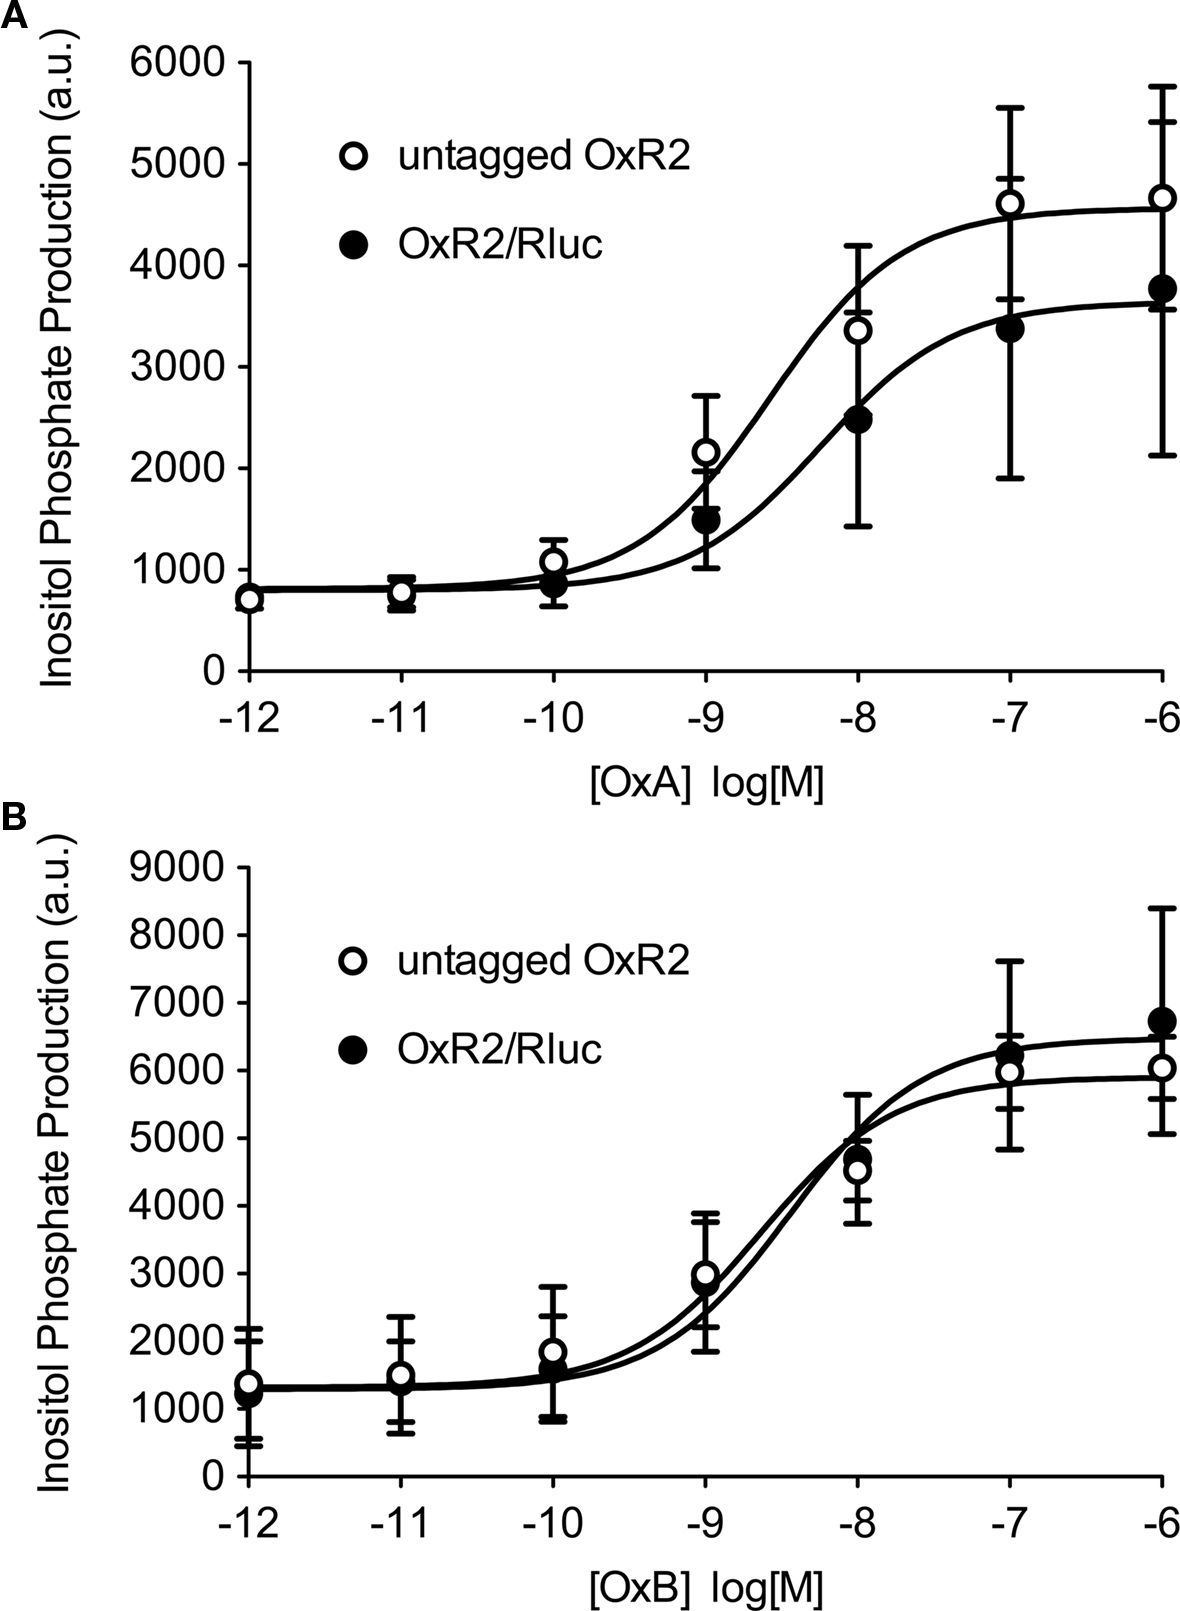
Figure 1. Functional validation of Rluc-tagged OxR2 compared with untagged OxR2. Total inositol phosphate production was measured after addition of increasing concentrations of Orexin A (OxA) (A) or Orexin B (OxB) (B). Data shown are mean ± SEM of three independent experiments.
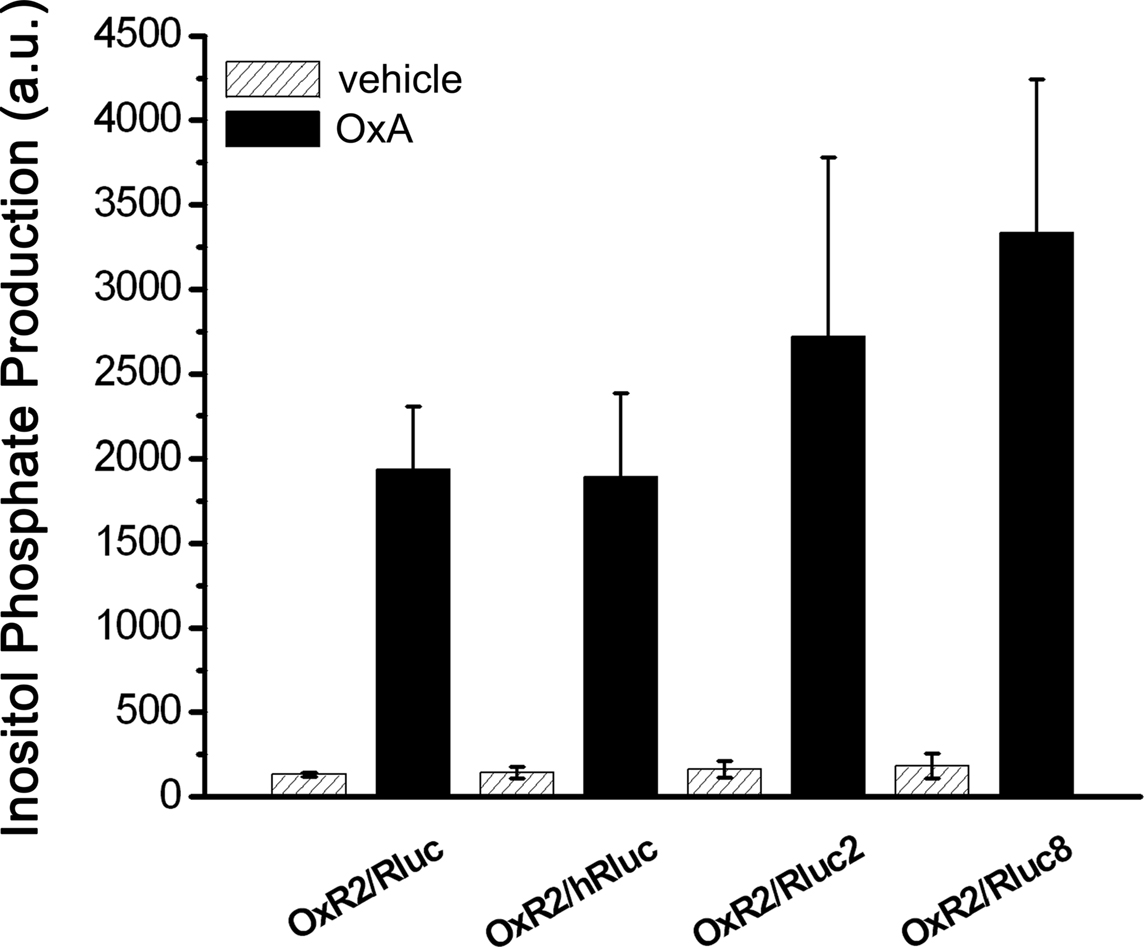
Figure 2. Functional validation of different luciferase-tagged OxR2 BRET fusion proteins. Total inositol phosphate production was measured after addition of vehicle or OxA in HEK293FT cells transfected with one of various OxR2/luminophore constructs. Data shown are mean ± SEM of three independent experiments each carried out in triplicate. Data generated with OxA-treated cells were analyzed by one-way ANOVA and differences between cells transfected with the various OxR2/luminophore constructs were not significant (P > 0.05).
Comparison of Luminescence Intensities of Original Rluc-/hRluc- and Novel Rluc2-/Rluc8-tagged OxR2 Constructs using Scanning Spectrometry
The emission spectra of four OxR2/luminophore fusion proteins were compared in order to demonstrate a difference in luminescence intensity of original (Rluc and hRluc) versus novel (Rluc2 and Rluc8) luminophores. Both BRET1 luciferase substrate coelenterazine h (Figure 3A) as well as BRET2 luciferase substrate DeepBlueC (Figure 3B) were tested. The emission maximum using coelenterazine h was detected at ∼480 nm for all constructs (Figure 3A). In contrast, the emission maxima could not be established for DeepBlueC using Rluc or hRluc, but a peak for both Rluc2 and Rluc8 was observed at ∼420 nm (Figure 3B). The comparison of luminescence intensities of different luciferase mutants with coelenterazine h (used as BRET1 substrate) as well as DeepBlueC (used as BRET2 substrate) revealed that Rluc8 always exhibited the highest intensity under the same conditions, followed by Rluc2. hRluc and Rluc always had significantly lower luminescence intensity irrespective of the coelenterazine analog employed. Using coelenterazine h, OxR2/Rluc8 maximal luminescence intensity was 1.8-fold higher in comparison to OxR2/Rluc2 however 3.5-fold higher in comparison to OxR2/hRluc and 6.4-fold higher when compared to OxR2/Rluc (Figure 3A). It was not possible to detect luminescence from oxidation of DeepBlueC by Rluc and hRluc under these conditions. In contrast, the novel OxR2/Rluc2 and OxR2/Rluc8 constructs emitted detectable luminescence, with 2.2-fold higher intensity for OxR2/Rluc8 than for OxR2/Rluc2 (Figure 3B).
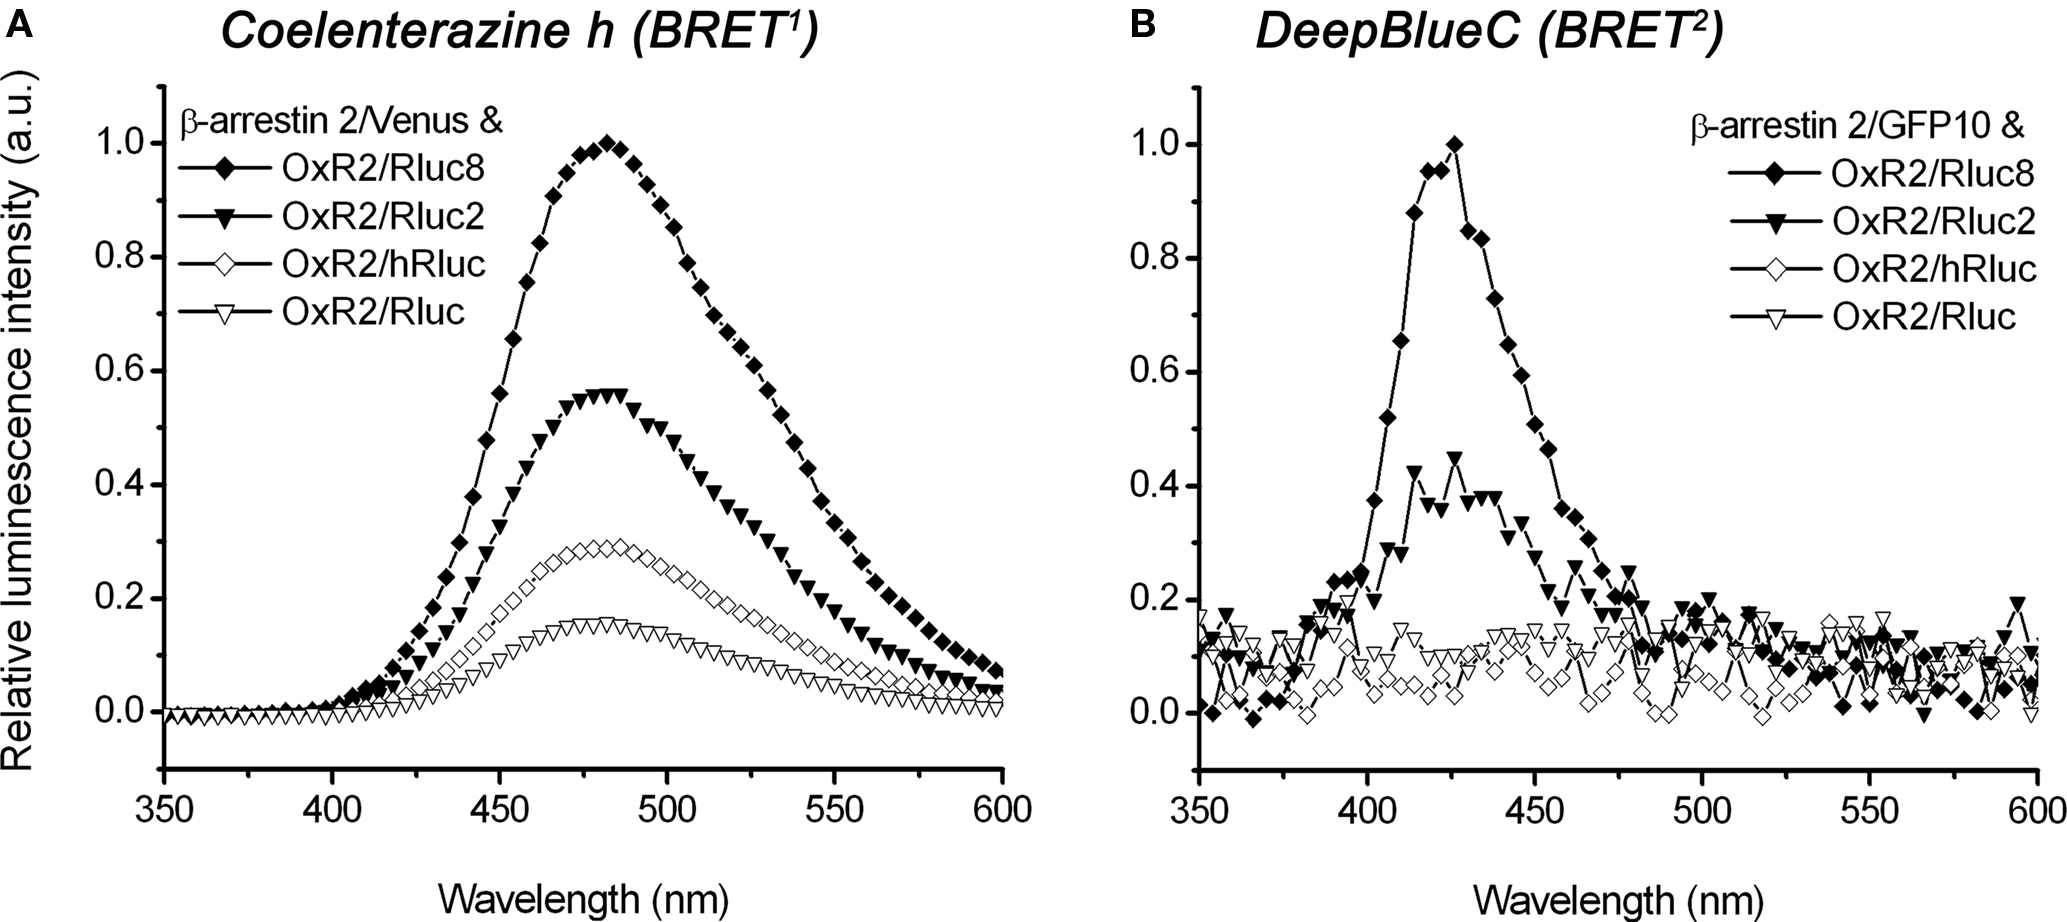
Figure 3. Spectral analysis comparing luminescence intensities of different luciferase-tagged OxR2 fusion proteins using coelenterazine h or DeepBlueC as luciferase substrate. HEK293FT cells were co-transfected with β-arrestin 2/Venus (A) or β-arrestin 2/GFP10 (B) and OxR2 tagged with various luciferase constructs. Emission spectra were recorded immediately after addition of coelenterazine h (A) or DeepBlueC (B). For the BRET1 system (A), the emission maximum of ∼480 nm corresponds to the luciferase oxidizing its substrate coelenterazine h. For the BRET2 system (B), the emission maximum of ∼420 nm corresponds to the luciferase oxidizing its substrate DeepBlueC.
Comparison of Luminophore-Tagged Fusion Proteins in Real-Time Kinetic Bret1 and Bret2 Assays Detecting agonist-Induced Interactions between OxR2 and β-Arrestin
We compared the performance of the original Rluc- and hRluc-tagged OxR2 constructs with the novel Rluc2 and Rluc8-tagged OxR2 constructs in real-time kinetic BRET1 and BRET2 assays using luminometry. BRET signals were detected before and after addition of agonist (1 μM OxA) or vehicle (PBS) from cells co-transfected with different OxR2/luminophore and β-arrestin 2/fluorophore combinations using coelenterazine h (BRET1) or DeepBlueC (BRET2). Rluc2 and Rluc8 exhibited luminescence intensities (Figure 4) and BRET signals (Figure 5) that were always higher than Rluc or hRluc, regardless of the substrate used. For BRET1, significantly higher luminescence intensities were detected with Rluc2 and Rluc8-tagged OxR2 constructs whereas luminescence intensities of hRluc and Rluc were reaching the limits of detection within an hour (Figure 4A). With regards to BRET2, with a standard luminometer it was not possible to detect a BRET2 signal for more than a few seconds with the originally used luminophores Rluc and hRluc due to the low luminescence intensity resulting from DeepBlueC oxidation. In contrast, the novel Rluc2 and Rluc8 exhibited greater and more sustained luminescence signals lasting over 1 h following DeepBlueC addition (Figure 4B). These differences in luminescence were reflected in the greater BRET signals with Rluc2 and Rluc8 fusion proteins in contrast to hRluc and Rluc under the same conditions (Figure 5). Indeed, in the case of BRET2 (with DeepBlueC as luminophore substrate), it was now possible to detect a kinetic BRET signal monitoring the ligand-induced OxR2/β-arrestin interaction with Rluc2 and Rluc8 in contrast to Rluc and hRluc (Figure 5B).
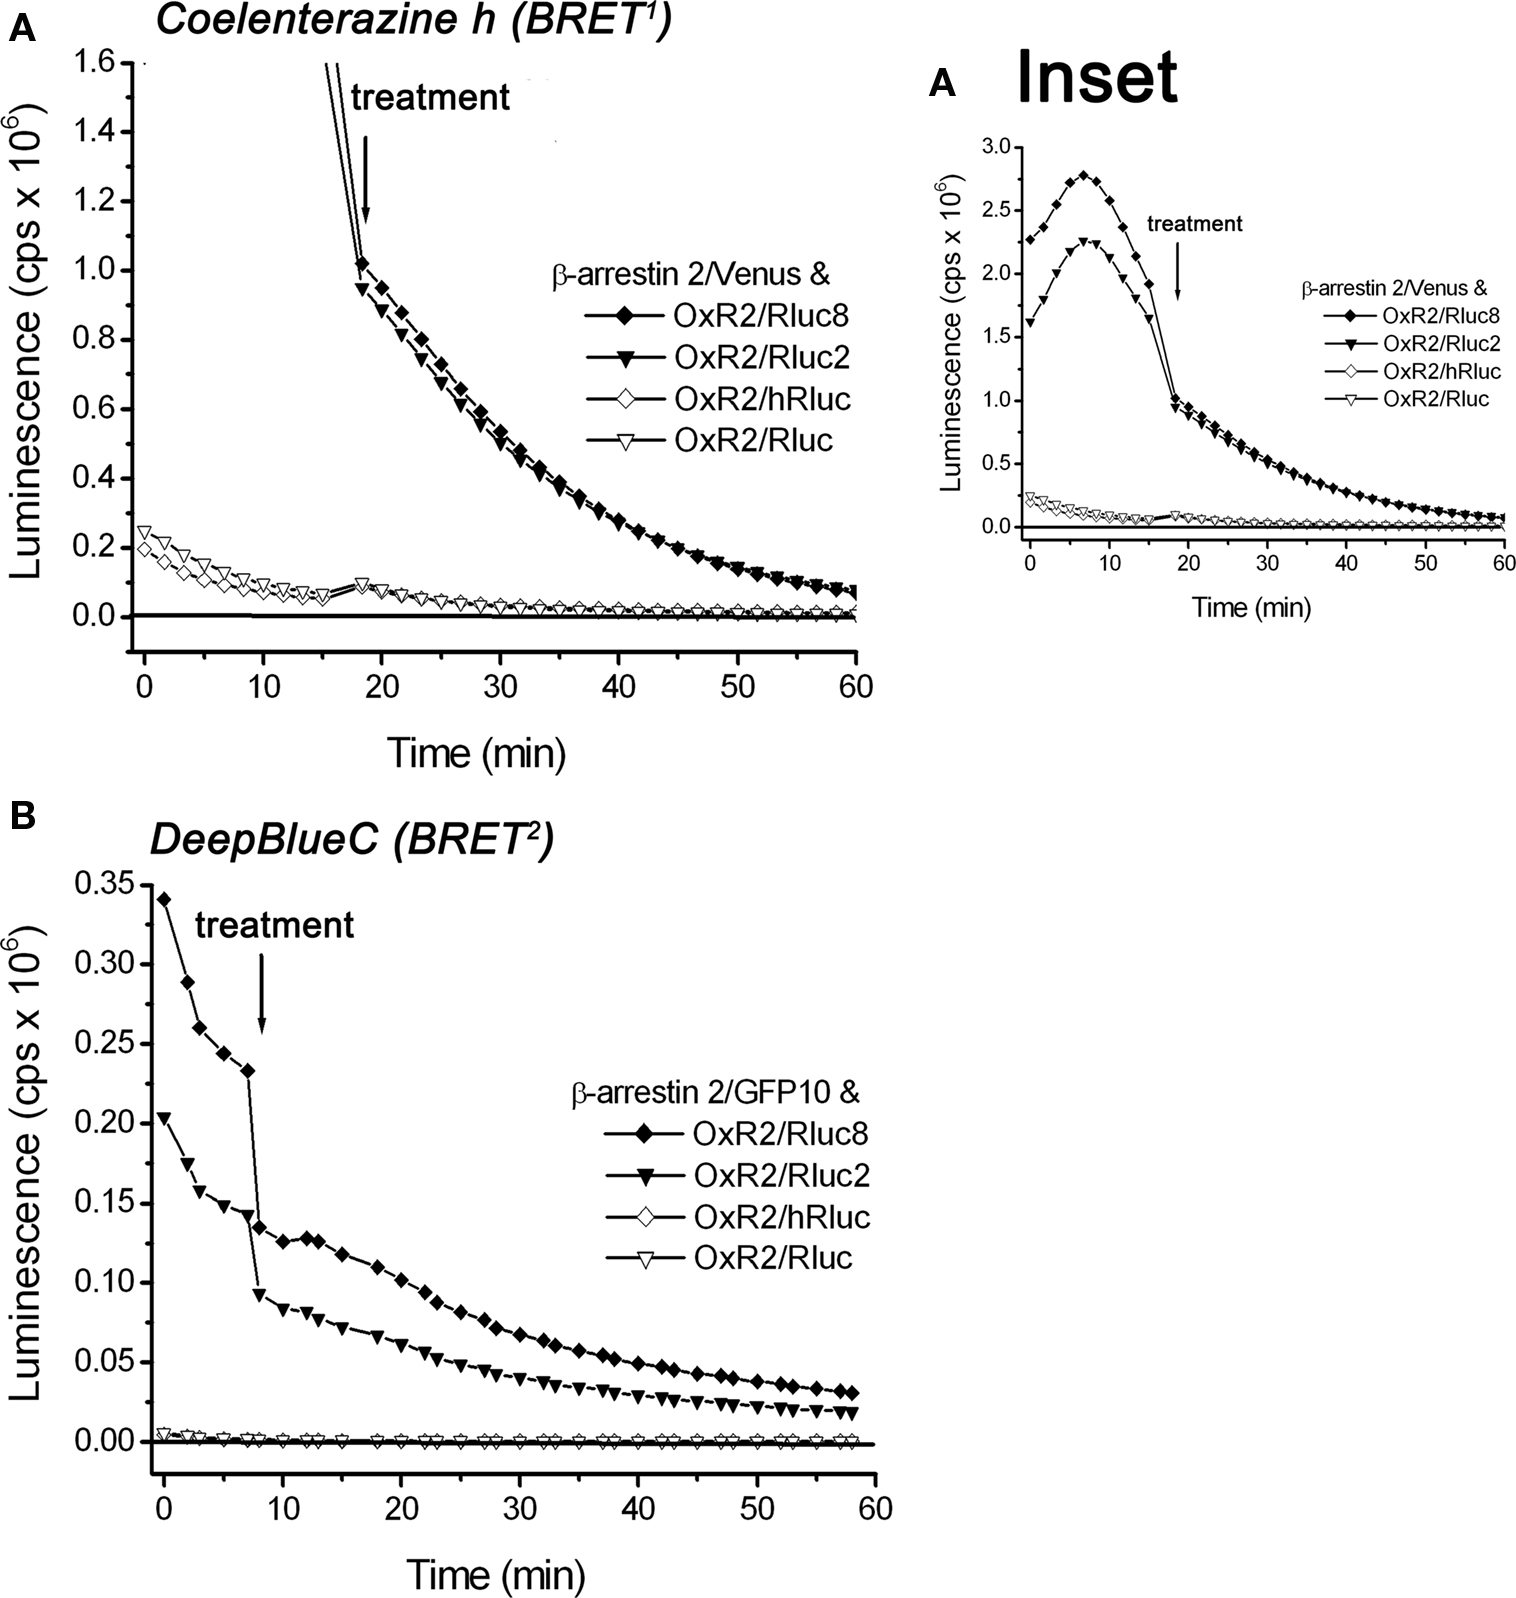
Figure 4. Comparison of luminescence intensities of different luciferase-tagged OxR2 fusion proteins over time oxidizing different luciferase substrates: coelenterazine h and DeepBlueC. HEK293FT cells were transiently co-transfected with OxR2 tagged with various luciferase constructs and β-arrestin 2/Venus (A) or β-arrestin 2/GFP10 (B). Luciferase substrates were added immediately prior to real-time measurement at 37°C. Cells were assayed before and after treatment with vehicle (data for which are shown in this figure) or OxA (data not shown). These data were collected as part of the BRET assay and were also used for calculation of the corresponding BRET ratio presented in Figure 5. Results shown are representative of three independent experiments.
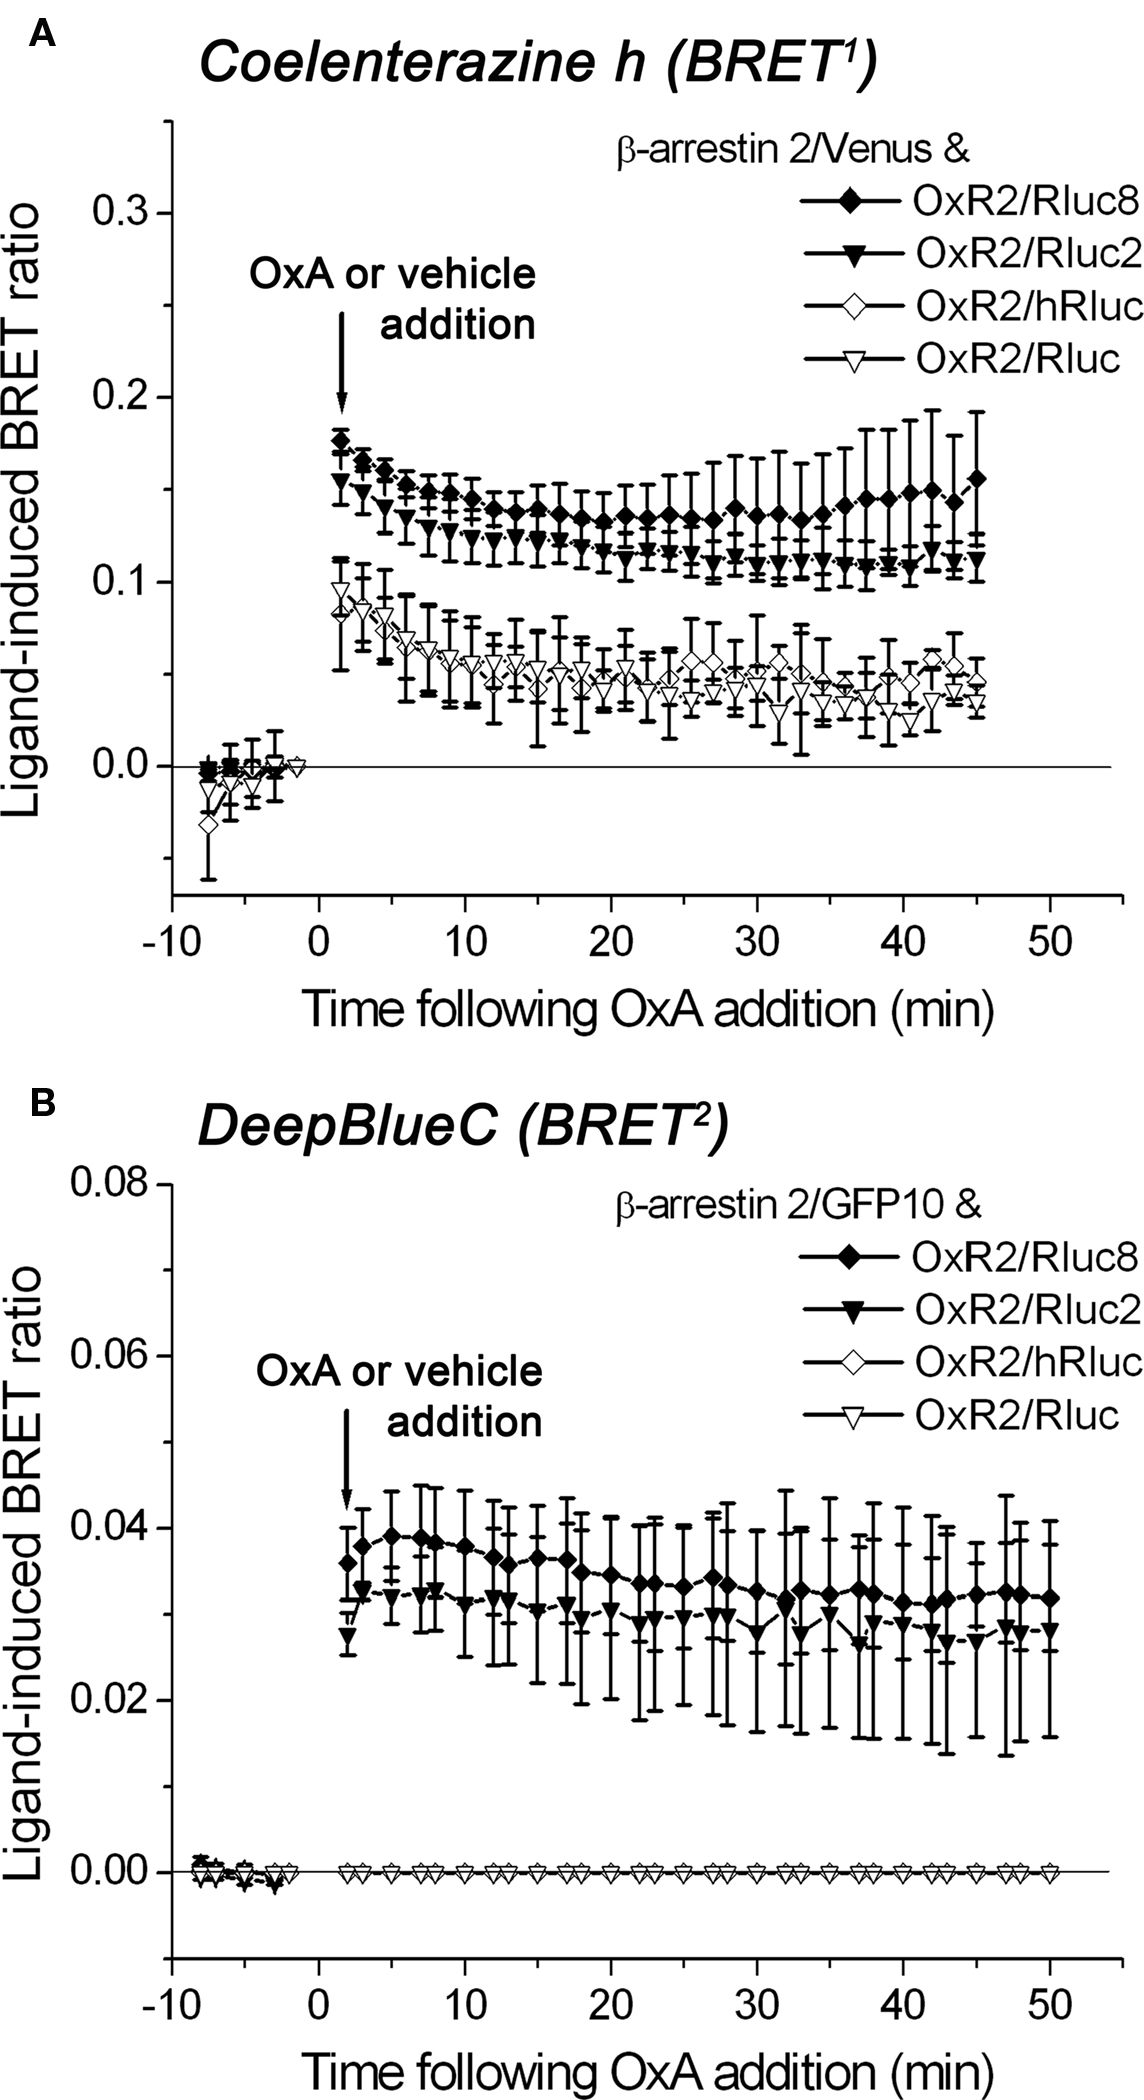
Figure 5. Detection of protein–protein interactions by real time BRET1 and BRET2 assays. Kinetic data comparing the BRET performance of different receptor/luminophore fusion proteins using the OxA-induced interaction between OxR2/luminophore and β-arrestin 2/Venus for BRET1 (A) or β-arrestin 2/GFP10 for BRET2 (B). Transiently co-transfected HEK293FT cells were assayed before and after treatment with OxA or vehicle. Luciferase substrates coelenterazine h for BRET1 (A) or DeepBlueC for BRET2 (B) were added immediately prior to real-time measurements at 37°C. The ligand-induced BRET ratios are calculated as described in Section “Materials and Methods.” Data shown are mean ± SEM of three independent experiments.
Detection of Agonist-Independent Interactions of V2R Mutants with β-Arrestins in Real-Time Kinetic Bret Assays using Dual-Filter Luminometry
In order to demonstrate the ability of Rluc8 to enable monitoring of agonist-independent protein–protein interactions compared to Rluc, V2R mutants exhibiting agonist-independent β-arrestin recruitment were employed (Kocan et al., 2009; Tenenbaum et al., 2009; Rochdi et al., 2010). BRET signals were detected from cells co-transfected with different V2R/Rluc8 or V2R/Rluc constructs and β-arrestin/Venus fusion proteins. Interactions of the wild type and mutant V2Rs (V2R-R137C, V2R-R137L, and V2R-R137H) with β-arrestin 2 were measured before and after stimulation of the cells with three different concentrations of agonist AVP (final concentrations 1, 0.1, and 0.01 μM) or vehicle (PBS). Firstly, comparing agonist-induced V2R/β-arrestin interactions with wild type V2R tagged with novel Rluc8 versus original Rluc, a substantially improved BRET signal was observed using the Rluc8 tag, allowing a concentration-dependent response to be clearly detected (Figures 6A,B). Subsequently, comparing V2R-R137C/Rluc8, V2R-R137L/Rluc8, and V2R-R137H/Rluc8 to V2R-wild type/Rluc8, all three mutants showed elevated BRET signals for untreated cells, indicating agonist-independent interactions of all of the V2R mutants with β-arrestin 2 (Figures 6A,C,E,G). In contrast, it was not possible to detect agonist-independent β-arrestin interactions with any of the three V2R mutants tagged with Rluc (Figures 6D,F,H).
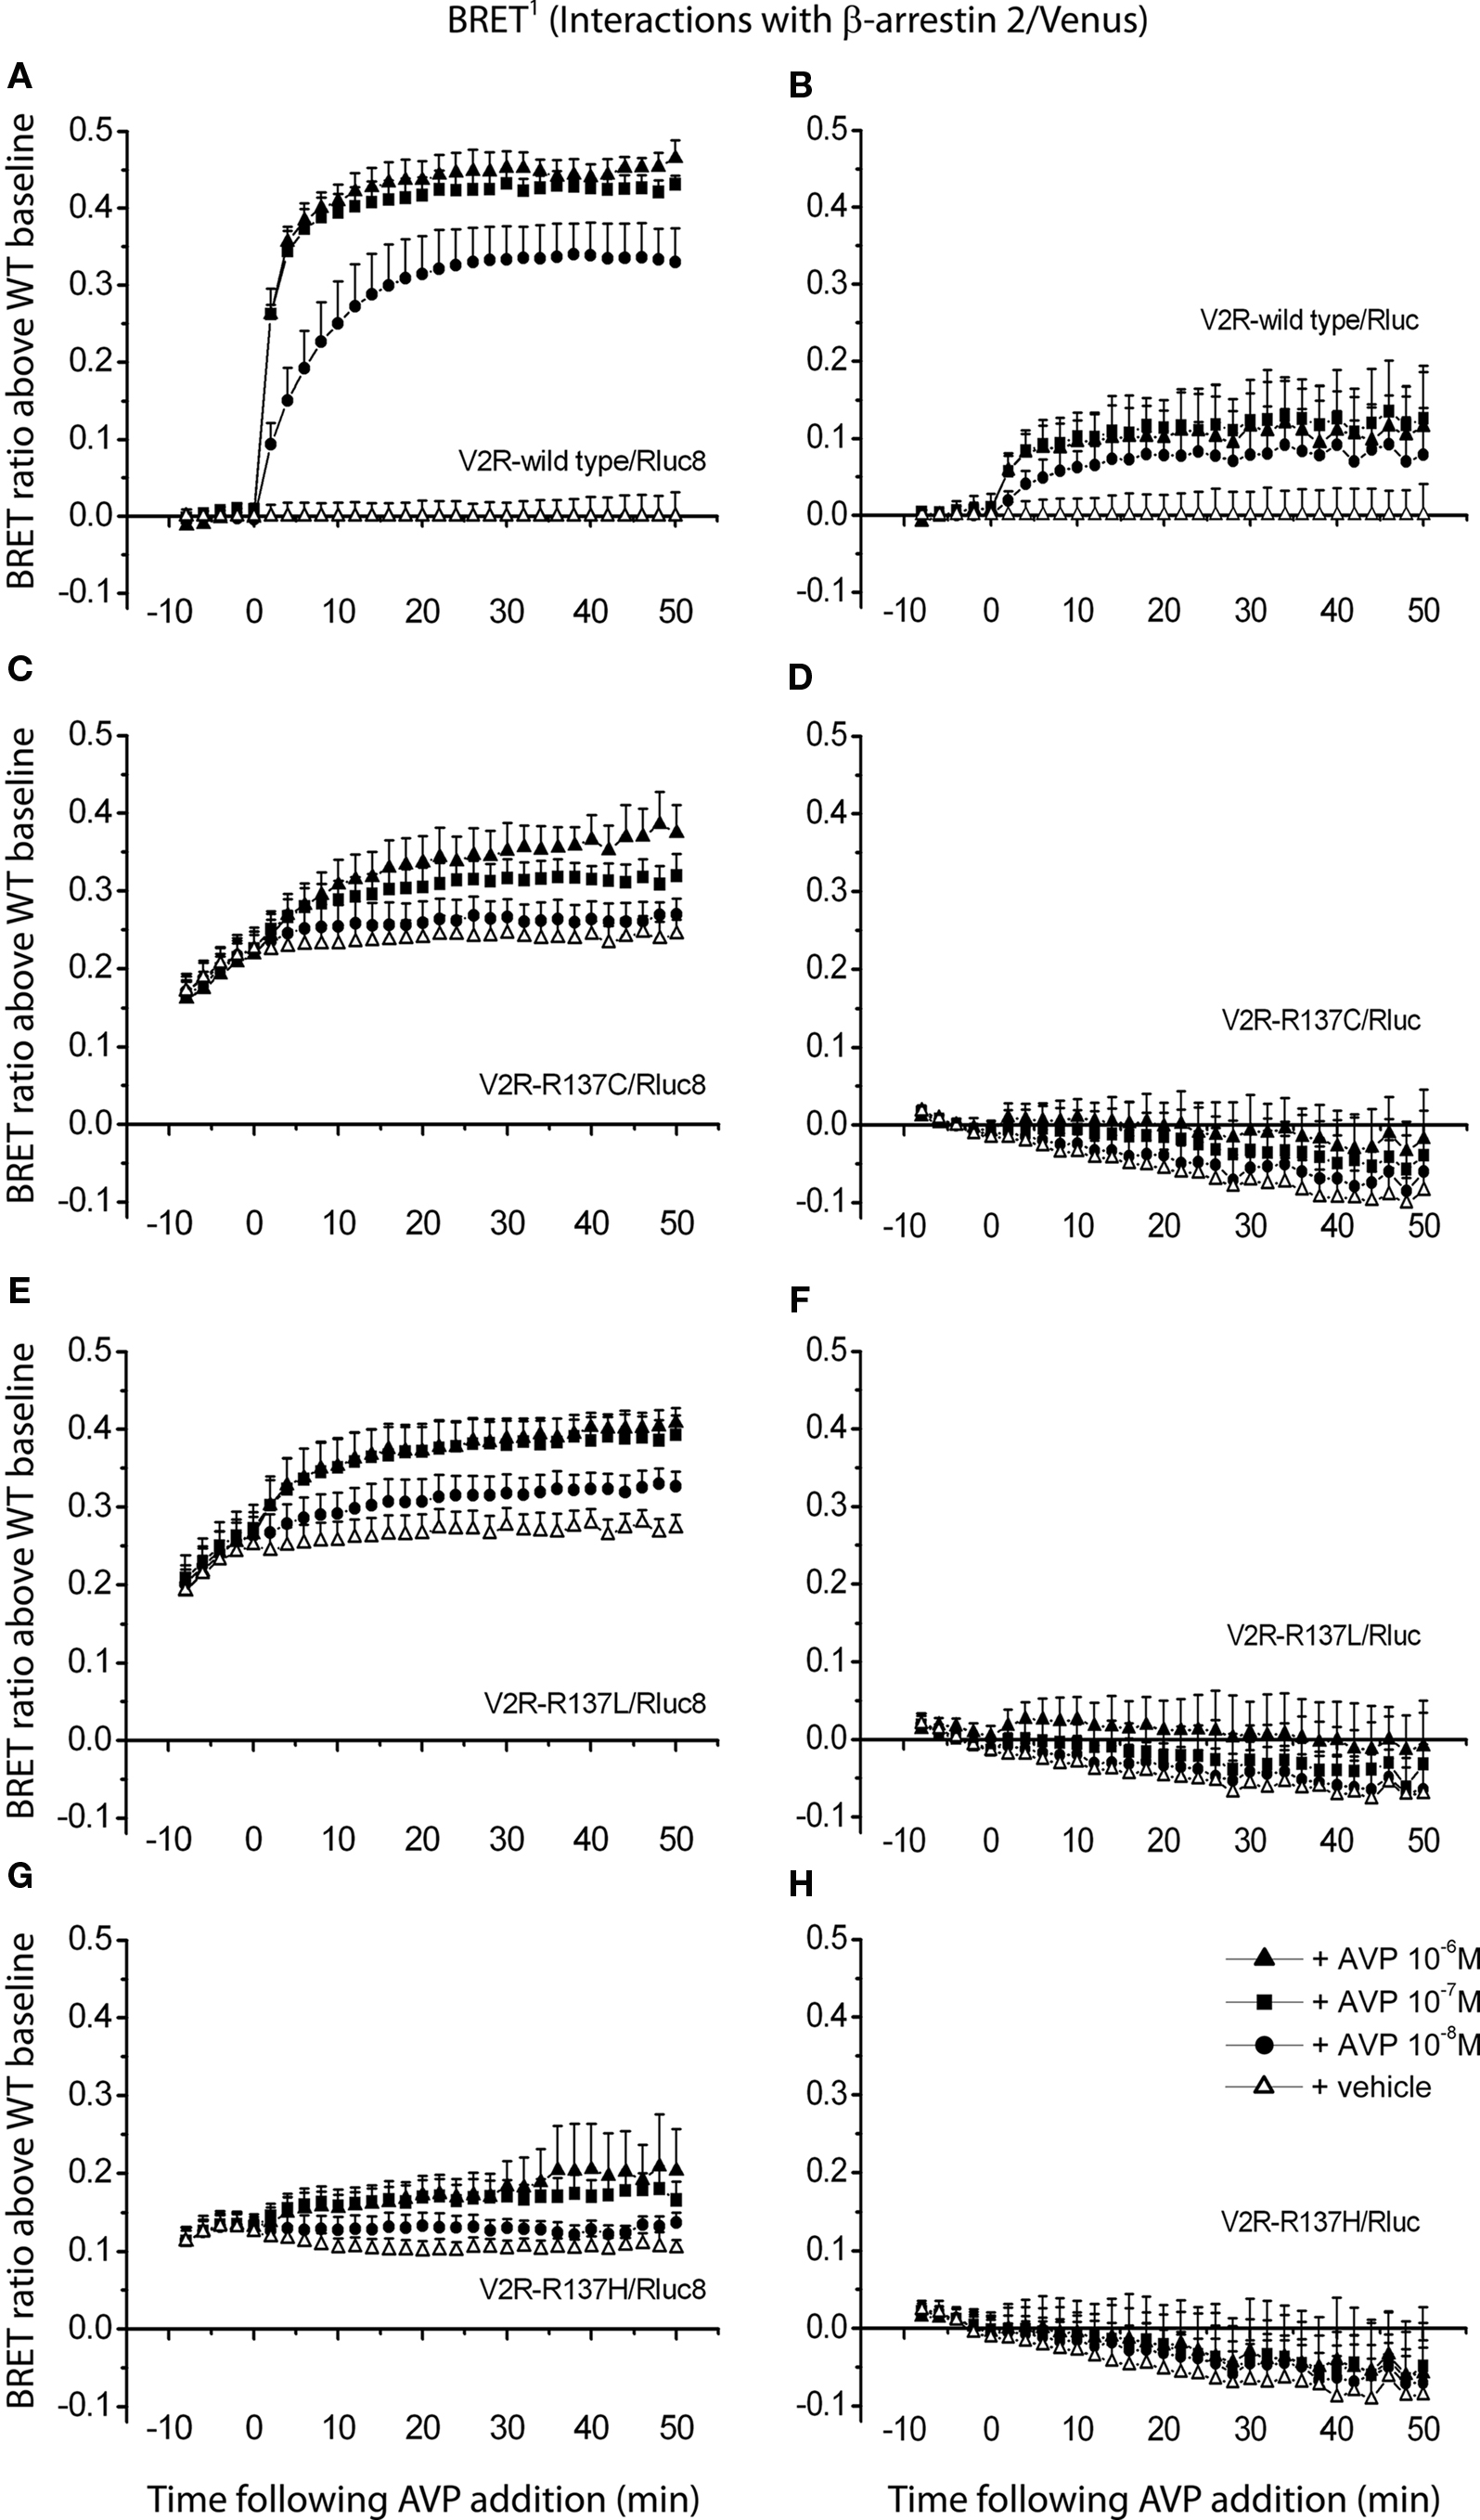
Figure 6. Detection of protein–protein interactions by real-time BRET1 assay. Kinetic data comparing V2R-wild type (A,B) and the three different mutants V2R-R137C (C,D), V2R-R137L (E,F), and V2R-R137H (G,H) tagged with Rluc8 (A,C,E,G) or Rluc (B,D,F,H) were generated by monitoring the interaction with β-arrestin 2/Venus. The luciferase substrate coelenterazine h was added immediately before real-time measurements at 37°C. The transiently co-transfected HEK293FT cells were assayed before and after treatment with AVP (final concentrations of 1, 0.1, and 0.01 μM) or vehicle. BRET ratio above wild type baseline was calculated as described in Section “Materials and Methods.” Data shown are mean ± SEM of four independent experiments. Parts of this figure (A,C,E,G) have been adapted from that published previously (Kocan et al., 2009) and are included for comparison with permission from the journal. Copyright 2009, The Endocrine Society.
The relative luminescence of the Rluc8- or Rluc-tagged V2R mutants compared with the corresponding luminophore-tagged wild type V2R is presented in Table 1. Note that the Rluc8-tagged mutant receptors express at similar or slightly lower levels to the corresponding wild type receptor. Consequently, the findings from the BRET assays with Rluc8 are not due to increased expression levels of the mutant receptors compared with the wild type V2R. Furthermore, Rluc-tagged V2R mutants were expressed at similar or slightly higher levels than the corresponding wild type V2R. Thus, the lack of agonist-independent BRET signal with Rluc for V2R mutants is not due to decreased expression levels of the mutant receptors compared with the wild type receptor (Table 1).
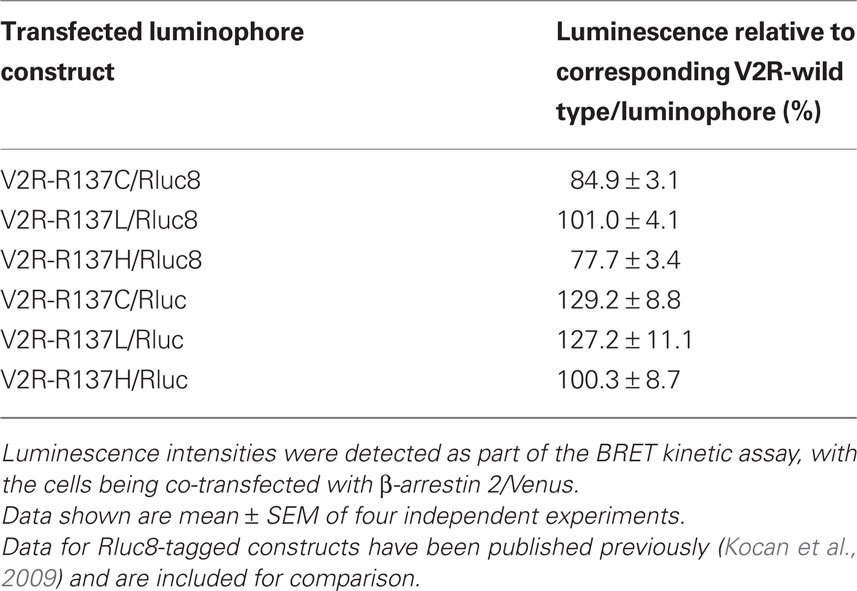
Table 1. Relative luminescence intensities of the three V2R mutants investigated compared with the luminescence intensity of the corresponding V2R-wild type construct (V2R-wild type/Rluc8 or V2R-wild type/Rluc).
Discussion
We have demonstrated clear improvements in our ability to detect agonist-induced β-arrestin interactions with the endocrine receptors OxR2 and V2R.
The orexin neuropeptide receptors 1 and 2 (OxR1 and OxR2) have been implicated in diverse physiological and pathological roles, including sleep/wake regulation, reward/addiction, and energy homeostasis (Tsujino and Sakurai, 2009). Using BRET1 and extended BRET (eBRET), we have previously demonstrated monitoring of OxR2 recruitment of β-arrestin using Rluc-tagged β-arrestin 1 and OxR2/EGFP (Pfleger et al., 2006b, 2007). Using the BRET2 methodology with Rluc or hRluc luminophores, it was not possible to detect OxR2/β-arrestin interactions. By employing the novel Rluc2 and Rluc8 BRET constructs, we have now been able to detect OxR2/β-arrestin interactions with the BRET2 system over prolonged periods with a very stable signal. Substantial improvements to the ability of the BRET1 system to monitor the same interaction were also observed. These results are in agreement with our previous data investigating TRHR/β-arrestin interactions (Kocan et al., 2008).
Vasopressin type II receptor is activated by AVP and regulates normal fluid homeostasis in the body by mediating excretion of free water. V2R mutants of arginine 137 in the DRY/H motif have significant clinical relevance, exhibiting diverse disease phenotypes. Gain-of-function mutants V2R-R137C and V2R-R137L cause nephrogenic syndrome of inappropriate antidiuresis (NSIAD), a genetic disease where the body is unable to excrete free water. Despite undetectable AVP levels, patients have inappropriately concentrated urine resulting in hyponatremia, hypo-osmolality, and natriuresis (Feldman et al., 2005). In contrast, mutation at the identical position, but changing arginine to histidine (V2R-R137H), causes nephrogenic diabetes insipidus (NDI), a genetic disease associated with a loss of the kidney’s ability to concentrate urine. V2R-R137H is a loss-of-function mutant exhibiting impaired trafficking, impaired signaling, and constitutive internalization (Barak et al., 2001; Bernier et al., 2004).
Our recent study was the first to show that the gain-of-function mutants V2R-R137C and V2R-R137L, in addition to constitutive signaling, exhibit agonist-independent β-arrestin interactions and internalization (Kocan et al., 2009). These findings have since been confirmed by other laboratories (Tenenbaum et al., 2009; Rochdi et al., 2010). Interestingly, the elegant study by Tenenbaum et al. (2009) observed agonist-independent interactions between the mutant V2Rs using YFP-tagged V2R constructs and Rluc-tagged β-arrestin 1 in COS-7 cells, but not Rluc-tagged V2R constructs and β-arrestin 1-YFP (the reverse configuration). Similar results were obtained with β-arrestin 2 and in HEK293 cells (Tenenbaum et al., 2009). This discrepancy of findings between the two BRET configurations was suggested to be due to differences in the distance or orientation of the donor and acceptor, which is indeed likely to be the case. However, the question remained as to why we were able to show agonist-independent β-arrestin interactions with the mutant V2Rs using Rluc8-tagged V2R constructs (Kocan et al., 2009), in contrast to the findings of Tenenbaum et al. (2009) using Rluc-tagged V2R constructs. As we had previously produced similar findings with both BRET1 and BRET2 using Venus and GFP10 as acceptor respectively (Kocan et al., 2009), we did not expect the choice of acceptor fluorophore to be the reason. Therefore, in the current study we have addressed the question by comparing the ability of the Rluc and Rluc8 luminophores to detect these agonist-independent interactions under the same experimental conditions.
We have found that, in contrast to mutant Rluc8-tagged V2Rs, mutant Rluc-tagged V2Rs did not generate agonist-independent BRET signals above wild type baseline indicative of constitutive interactions with β-arrestin 2/Venus. These findings are therefore consistent with those of Tenenbaum et al. (2009) and indicate that it is specifically the difference in luminophore that results in the difference in ability to detect the agonist-independent interaction with β-arrestin tagged with an acceptor fluorophore.
Our observations, in addition to reconciling these apparent differences between results from the two laboratories, clearly highlight the significant advance to the BRET technology resulting from the introduction of the novel luminophores developed by the Gambhir laboratory (Loening et al., 2006), particularly Rluc8. Considering the vast array of protein–protein interactions that occur in every cell of the body, and the importance these have to every physiological and pathological process, the potential of improved approaches to monitor these interactions is enormous. The number of publications describing the use of BRET to study protein–protein interactions is increasing exponentially, yet these have only scratched the surface. Up to now, a major limitation has been the sensitivity of the technology, particularly in terms of signal strength. However, as a consequence of demonstrably improved sensitivity, that limitation has now diminished significantly.
Conflict of Interest Statement:
The authors declare that the research was conducted in the absence of any commercial or financial relationships that could be construed as a potential conflict of interest.
Acknowledgments
We are grateful to A. Loening and S. Gambhir (Stanford University, Stanford, CA, USA), A. Miyawaki (RIKEN Brain Science Institute, Wako-City, Japan), M. Bouvier (University of Montreal, Montreal, Canada), and M. Yanagisawa (Howard Hughes Medical Institute, TX, USA) for providing cDNA constructs. This work was funded by the National Health and Medical Research Council (NHMRC) of Australia (Project Grant #404087) and a subsequent Priming Grant from the Raine Medical Research Foundation.
References
Barak, L. S., Oakley, R. H., Laporte, S. A., and Caron, M. G. (2001). Constitutive arrestin mediated desensitization of a human vasopressin receptor mutant associated with nephrogenic diabetes insipidus. Proc. Natl. Acad. Sci. U.S.A. 98, 93–98.
Bernier, V., Lagace, M., Lonergan, M., Arthus, M. F., Bichet, D. G., and Bouvier, M. (2004). Functional rescue of the constitutively internalized V2 vasopressin receptor mutant R137H by the pharmacological chaperone action of SR49059. Mol. Endocrinol. 18, 2074–2084.
Dacres, H., Wang, J., Dumancic, M. M., and Trowell, S. C. (2010). Experimental determination of the Forster distance for two commonly used bioluminescent resonance energy transfer pairs. Anal. Chem. 82, 432–435.
De, A., Loening, A. M., and Gambhir, S. S. (2007). An improved bioluminescence resonance energy transfer strategy for imaging intracellular events in single cells and living subjects. Cancer Res. 67, 7175–7183.
De, A., Ray, P., Loening, A. M., and Gambhir, S. S. (2009). BRET3: a red-shifted bioluminescence resonance energy transfer (BRET)-based integrated platform for imaging protein–protein interactions from single live cells and living animals. FASEB J. 23, 2702–2709.
Feldman, B. J., Rosenthal, S. M., Vargas, G. A., Fenwick, R. G., Huang, E. A., Matsuda-Abedini, M., Lustig, R. H., Mathias, R. S., Portale, A. A., Miller, W. L., and Gitelman, S. E. (2005). Nephrogenic syndrome of inappropriate antidiuresis. N. Engl. J. Med. 352, 1884–1890.
Guo, W., Urizar, E., Kralikova, M., Mobarec, J. C., Shi, L., Filizola, M., and Javitch, J. A. (2008). Dopamine D2 receptors form higher order oligomers at physiological expression levels. EMBO J. 27, 2293–2304.
Kamal, M., Marquez, M., Vauthier, V., Leloire, A., Froguel, P., Jockers, R., and Couturier, C. (2009). Improved donor/acceptor BRET couples for monitoring beta-arrestin recruitment to G protein-coupled receptors. Biotechnol. J. 4, 1337–1344.
Kocan, M., and Pfleger, K. D. G. (2009). Detection of GPCR/β-arrestin interactions in live cells using bioluminescence resonance energy transfer (BRET) technology. Methods Mol. Biol. 552, 305–317.
Kocan, M., See, H. B., Sampaio, N. G., Eidne, K. A., Feldman, B. J., and Pfleger, K. D. G. (2009). Agonist-independent interactions between beta-arrestins and mutant vasopressin type II receptors associated with nephrogenic syndrome of inappropriate antidiuresis. Mol. Endocrinol. 23, 559–571.
Kocan, M., See, H. B., Seeber, R. M., Eidne, K. A., and Pfleger, K. D. G. (2008). Demonstration of improvements to the bioluminescence resonance energy transfer (BRET) technology for the monitoring of G protein-coupled receptors in live cells. J. Biomol. Screen. 13, 888–898.
Loening, A. M., Fenn, T. D., Wu, A. M., and Gambhir, S. S. (2006). Consensus guided mutagenesis of Renilla luciferase yields enhanced stability and light output. Protein Eng. Des. Sel. 19, 391–400.
Milligan, G. (2004). Applications of bioluminescence- and fluorescence resonance energy transfer to drug discovery at G protein-coupled receptors. Eur. J. Pharm. Sci. 21, 397–405.
Milligan, G., and Bouvier, M. (2005). Methods to monitor the quaternary structure of G protein-coupled receptors. FEBS J. 272, 2914–2925.
Pfleger, K. D. G., and Eidne, K. A. (2005). Monitoring the formation of dynamic G-protein-coupled receptor-protein complexes in living cells. Biochem. J. 385, 625–637.
Pfleger, K. D. G., Dalrymple, M. B., Dromey, J. R., and Eidne, K. A. (2007). Monitoring interactions between G-protein-coupled receptors and β-arrestins. Biochem. Soc. Trans. 35, 764–766.
Pfleger, K. D. G., and Eidne, K. A. (2006). Illuminating insights into protein–protein interactions using bioluminescence resonance energy transfer (BRET). Nat. Methods 3, 165–174.
Pfleger, K. D. G., Seeber R. M., and Eidne, K. A. (2006a). Bioluminescence resonance energy transfer (BRET) for the real-time detection of protein–protein interactions. Nat. Protoc. 1, 337–345.
Pfleger, K. D. G., Dromey, J. R., Dalrymple, M. B., Lim, E. M., Thomas, W. G., and Eidne, K. A. (2006b). Extended bioluminescence resonance energy transfer (eBRET) for monitoring prolonged protein–protein interactions in live cells. Cell. Signal. 18, 1664–1670.
Rochdi, M. D., Vargas, G. A., Carpentier, E., Oligny-Longpré, G., Chen, S., Kovoor, A., Gitelman, S. E., Rosenthal, S. M., von Zastrow, M., and Bouvier, M. (2010). Functional characterization of vasopressin type 2 receptor substitutions (R137H/C/L) leading to nephrogenic diabetes insipidus and nephrogenic syndrome of inappropriate antidiuresis: implications for treatments. Mol. Pharmacol. 77, 836–845.
See, H. B., Seeber, R. M., Kocan, M., Eidne, K. A., and Pfleger K. D. G. (2011). Application of G protein-coupled receptor heteromer identification technology to monitor β-arrestin recruitment to G protein-coupled receptor heteromers. Assay Drug Dev. Technol. doi: 10.1089/adt.2010.0336. [Epub ahead of print].
Tenenbaum, J., Ayoub, M. A., Perkovska, S., Adra-Delenne, A. L., Mendre, C., Ranchin, B., Bricca, G., Geelen, G., Mouillac, B., Durroux, T., and Morin, D. (2009). The constitutively active V2 receptor mutants conferring NSIAD are weakly sensitive to agonist and antagonist regulation. PLoS ONE 4, e8383. doi: 10.1371/journal.pone.0008383
Tsujino, N., and Sakurai, T. (2009). Orexin/hypocretin: a neuropeptide at the interface of sleep, energy homeostasis, and reward system. Pharmacol. Rev. 61, 162–176.
Keywords: bioluminescence resonance energy transfer, luciferase, G protein-coupled receptor, arrestin, orexin, vasopressin
Citation: Kocan M, Dalrymple MB, Seeber RM, Feldman BJ and Pfleger KDG (2011) Enhanced BRET technology for the monitoring of agonist-induced and agonist-independent interactions between GPCRs and β-arrestins. Front. Endocrin. 1:12. doi: 10.3389/fendo.2010.00012
Received: 06 November 2010;
Accepted: 22 December 2010;
Published online: 14 January 2011.
Edited by:
Sandhya Srikant Visweswariah, Indian Institute of Science, IndiaReviewed by:
Nicholas D. Holliday, University of Nottingham, UKEric Reiter, Institut National de la Recherche Agronomique, France
Copyright: © 2011 Kocan, Dalrymple, Seeber, Feldman and Pfleger. This is an open-access article subject to an exclusive license agreement between the authors and the Frontiers Research Foundation, which permits unrestricted use, distribution, and reproduction in any medium, provided the original authors and source are credited.
*Correspondence: Kevin D. G. Pfleger, Western Australian Institute for Medical Research, Queen Elizabeth II Medical Centre, Ground Floor, B Block, Hospital Avenue, Nedlands, WA 6009, Australia. e-mail: kpfleger@waimr.uwa.edu.au