 Mohd Shazli Draman1
 Michael Stechman2David Scott-Coombes2
 Colin M. Dayan1Dafydd Aled Rees3Marian Ludgate1*
 Lei Zhang1*
- 1Thyroid Research Group, Cardiff University, Cardiff, UK
- 2Department of Endocrine Surgery, University Hospital of Wales, Cardiff, UK
- 3School of Medicine, Neuroscience and Mental Health Research Institute, Cardiff University, Cardiff, UK
Evidence from clinical and experimental data suggests that thyrotropin receptor (TSHR) signaling is involved in energy expenditure through its impact on white adipose tissue (WAT) and brown adipose tissue (BAT). TSHR expression increases during mesenchymal stem cell (MSC) differentiation into fat. We hypothesize that TSHR activation [TSHR*, elevated thyroid-stimulating hormone, thyroid-stimulating antibodies (TSAB), or activating mutation] influences MSC differentiation, which contributes to body composition changes seen in hypothyroidism or Graves’ disease (GD). The role of TSHR activation on adipogenesis was first investigated using ex vivo samples. Neck fat (all euthyroid at surgery) was obtained from GD (n = 11, TSAB positive), toxic multinodular goiter (TMNG, TSAB negative) (n = 6), and control patients with benign euthyroid disease (n = 11, TSAB negative). The effect of TSHR activation was then analyzed using human primary abdominal subcutaneous preadipocytes (n = 16). Cells were cultured in complete medium (CM) or adipogenic medium [ADM, containing thiazolidinedione (TZD), PPARγ agonist, which is able to induce BAT formation] with or without TSHR activation (gain-of-function mutant) for 3 weeks. Adipogenesis was evaluated using oil red O (ORO), counting adipogenic foci, qPCR measurement of terminal differentiation marker (LPL). BAT [PGC-1α, uncoupling protein 1 (UCP1), and ZIC1], pre-BAT (PRDM16), BRITE− (CITED1), or WAT (LEPTIN) markers were analyzed by semiquantitative PCR or qPCR. In ex vivo analysis, there were no differences in the expression of UCP1, PGC-1α, and ZIC1. BRITE marker CITED1 levels were highest in GD followed by TMNG and control (p for trend = 0.009). This was associated with higher WAT marker LEPTIN level in GD than the other two groups (p < 0.001). In primary cell culture, TSHR activation substantially enhanced adipogenesis with 1.4 ± 0.07 (ORO), 8.6 ± 1.8 (foci), and 5.5 ± 1.6 (LPL) fold increases compared with controls. Surprisingly, TSHR activation in CM also significantly increased pre-BAT marker PRDM16; furthermore, TZD-ADM induced adipogenesis showed substantially increased BAT markers, PGC-1α and UCP1. Our study revealed that TSHR activation plays an important role in the adipogenesis process and BRITE/pre-BAT formation, which leads to WAT or BAT phenotype. It may contribute to weight loss as heat during hyperthyroidism and later transforms into WAT posttreatment of GD when patients gain excess weight.
Introduction
Excess thyrotropin receptor (TSHR) activation occurs in two common conditions, Graves’ disease (GD) in which thyroid-stimulating antibodies (TSAB) mimic thyroid-stimulating hormone (TSH) causing hyperthyroidism and primary hypothyroidism when elevated circulating TSH compensates for low thyroid hormone (T4/T3) levels resulting from the failing gland (1). Both confer alterations in body composition, e.g., more than 90% of people with GD lose weight, mainly muscle mass and fat (2), while hypothyroidism increases fat and bone mineral density. The opposing differences of thyroid hormone levels have been traditionally suggested for these changes of body compositions, e.g., impact on white adipose tissue (WAT) or brown adipose tissue (BAT) metabolism (3, 4). BAT depots were thought to be absent from adult humans, but the availability of imaging using 18F-fluorodeoxyglucose positron emission tomography and computed tomography reveals their location in supraclavicular and neck regions (5–7).
Despite restoration of serum TSH concentrations to normal, many GD patients complain of substantial weight gain post treatment (8, 9) with potential negative impact on their future cardiovascular risk. Further studies in this area may therefore have considerable impact on determining the optimal treatment for patients with GD. There is still considerable controversy regarding the best treatment for Graves’ hyperthyroidism and radioiodine and/or thyroidectomy might be associated with more weight gain compared to those on antithyroid drugs and patients who undergo ablative therapy for thyroid cancer (10–12). This suggests that there are some factors associated with GD that influence post therapy weight gain. Furthermore, analysis has suggested that a diagnosis of GD (as opposed to other causes of thyroid over-activity) is an independent predictor of weight gain (10), raising the possibility that the persisting anti-TSH receptor antibodies in such patients might have long-term effects on peripheral adipose tissue composition (13). In humans, lipolysis was shown to be stimulated by TSH and TSAB, but this was confined to neonates suggesting an effect predominantly on BAT (14). Furthermore, the presence of functional extrathyroidal TSHR has been demonstrated in adipose tissue (15, 16) and bone (17), and fat-specific knockout of TSHR generated mice with larger adipocytes (18). More recent studies report a positive correlation between TSHR activation and obesity (19–21), and reports using animal models suggest a role for the TSHR in BAT and WAT function (22–24). For example, TSHR-deficient hyt/hyt mice became hypothermic in cold conditions, despite thyroxine administration, but transfection of TSHR into BAT of these mice improved core temperature (22). The above evidence led us to hypothesize that TSHR activation per se may contribute to changes in body composition separately from the effects of thyroid hormone levels, exerting a direct impact on adipose tissues metabolism (25).
Brown adipose tissue dissipates energy as heat (thermogenesis) in a process mediated by uncoupling protein 1 (UCP1), which uncouples oxidative phosphorylation from ATP production (26). WAT and BAT are derived from distinct lineages of mesenchymal stem cells (MSCs), Myf5+ for BAT (also muscle progenitors) but Myf5− for WAT (27). The two adipose types also differ morphologically with WAT having a single large fat vacuole and BAT having many smaller fat droplets and higher numbers of mitochondria (28). In addition to WAT and newly documented adult BAT (5), human beige (or BRITE for BRown in whITE) adipocytes have been recently identified, and like WAT are derived from Myf5− MSC (29). Although there are clearly defined BAT, BRITE, and WAT depots in mice, human fat depots tend to be heterogeneous with BRITE/pre-BAT adipocytes present in both WAT and inducible BAT depots with the potential to be transformed to either WAT or BAT (30, 31). Transcription factor PRDM16 plays an essential role in the transformation of BRITE/pre-BAT to BAT (32). Adipocytes are generated by lineage-specific differentiation of MSC found in fat (33); the expression of TSHR is increased in human fat depots undergoing adipogenesis (34). We hypothesize that TSHR activation could thus modulate fat formation. Our aim was to investigate the effect of TSHR activation on human adipose tissue from the neck, which is recognized as a BAT inducible region (5), by phenotyping ex vivo samples using markers for WAT, BRITE, and BAT. Furthermore, we analyzed preadipocytes obtained from subcutaneous adipose tissue, to address the role of TSHR activation in adipogenesis and modulation of fat phenotype.
Materials and Methods
All reagents were obtained from Sigma-Aldrich and tissue culture components from Cambrex unless otherwise stated.
Adipose Tissue Collection
Subcutaneous adipose tissue (n = 16) was collected from patients undergoing elective open abdominal surgery for non-metabolic conditions. For ex vivo analysis, subcutaneous neck fat samples were obtained from GD (n = 11), toxic multinodular goiter (TMNG) (n = 6) and euthyroid control patients with benign thyroid nodules (n = 11) undergoing thyroid surgery. Five patients have undetectable TSH measurements (GD = 4 and TMNG = 1) with normal free T4 (one at upper limit normal level) or T3 levels. The suppressed TSH is expected in treated hyperthyroid patients as this will take months to recover despite being euthyroid. It should be stressed that all patients were clinically euthyroid during surgical procedure and patients’ information has been summarized in Table 1. All GD patients have positive TSHR antibodies measured by thyroid-binding inhibiting immunoglobulin assays and TSAB luciferase reporter assay (35).
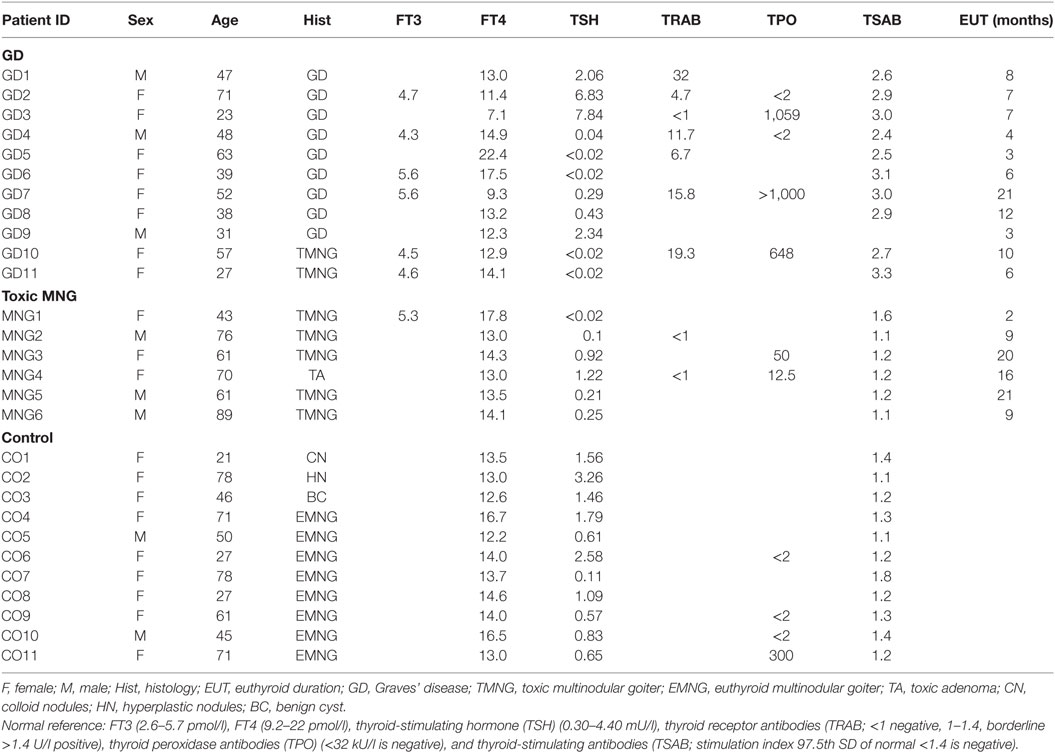
Table 1. Patients demographic.
Generation of TSHR*-Expressing Cells
Preadipocyte/fibroblasts were obtained by collagenase digest, as previously described (36). Cells were used at low passage number (<5); hence, not all samples were analyzed in all experiments. Activating mutant TSHR (L629F) was introduced into the preadipocyte populations using retroviral vectors, previously produced in our laboratory (37). Geneticin selection resulted in mixed populations stably expressing the various TSHR, which exhibit increased basal levels of cAMP compared with the equivalent non-modified cell population, all as previously described (16).
Preadipocyte/Fibroblast Culture In Vitro Adipogenesis
Preadipocytes were cultured in DMEM/F12 10% FCS (complete medium, CM). Adipogenesis was induced in confluent cells by replacing with differentiation medium [adipogenic medium (ADM)] containing 10% FCS, biotin (33μM), panthothenate (17μM), T3 (1nM), dexa-methasone (100nM), thiazolidinedione (TZD) (1μM), and insulin (500nM) for 22 days, adipogenesis was assessed by microscopic examination to detect the characteristic morphological changes (cell rounding, accumulation of lipid droplets), acquisition of lipid filled droplets [oil red O (ORO) staining], and transcript measurement of adipogenic markers (PPARγ, LPL) by qPCR as described previously (16). In addition, foci of differentiation (groups of cells with lipid droplets) were counted in 10 different fields for each experimental condition (36).
PCR Analysis of Markers for WAT, BRITE, or BAT
Transcript copy numbers for various genes, including markers for WAT [LEPTIN (38)], BRITE [CITED1 (39)], pre-BAT (PRDM16), and BAT [PGC-1α, UCP1, and ZIC1 (30, 31)] together with TSHR were measured.
Total RNA from cells or ex vivo fat tissues was extracted and reverse transcribed using standard protocols (16) for standard or qPCR analysis; primers (cross exon boundaries to avoid amplification of genomic DNA) were designed using primer 3 software (Table S1 in Supplementary Material). qPCR was conducted using SYBR Green incorporation measured on a Stratagene MX 3000. Comparison with plasmid standard curves for each gene permitted calculation of absolute values for each sample (transcripts per microgram input RNA). In addition, for qPCR, transcripts of a housekeeping gene, APRT, were measured so that values could be expressed relative to this (transcripts/1,000 APRT). APRT was also used in the comparative Ct method to assess transcript levels of PRDM16. It should be noted that none of the treatments used resulted in a variation in the APRT Ct value of more than one cycle. In qPCR experiments, all measurements were made in triplicate; the standard curve was also run in at least duplicate.
If multiple products (e.g., primer dimer) were detected by qPCR (dissociation curve), a classic PCR with densitometry technique was used. Standard PCR was performed to detect CITED1 and LEPTIN using Phusion High-Fidelity PCR master mix (Thermo Scientific) as per the manufacturer’s instructions. The PCR products were resolved on 2% agarose gels for 35 min, and densitometry values were obtained and corrected to housekeeping gene (GAPDH).
Statistical Analysis
Parametric data were analyzed using Student’s t-test and one-way ANOVA for multiple group comparisons where appropriate. Similarly, Mann–Whitney U test and Kruskal–Wallis H test was used for non-parametric data. All analysis was done using two-tailed tests. Parametric data were presented as mean ± SD and median ± interquartile range for non-parametric data. In all cases, p < 0.05 was considered significant.
Results
TSHR Activation Favor BRITE and WAT Formation in Ex Vivo Analysis
To examine the role of TSHR activation on adipose tissues, we analyzed markers of WAT, BRITE, and BAT using ex vivo samples of subcutaneous neck fat. Analyzed samples were obtained when patients were euthyroid, but the persisting TSAB result in GD fat samples experiencing ongoing TSHR activation while TMNG and control samples do not.
Expression levels of TSHR did not differ in control, TMNG, or GD groups (Figure 1A); we then analyzed the potential effect of TSAB/TSHR* on fat phenotype. Higher transcript levels of LEPTIN (WAT marker) were detected in GD samples compared to TMNG and control (p < 0.001) (Figure 1C), which indicates that adipogenesis in the WAT compartment is ongoing in GD. BAT markers PGC-1α, UCP1, and ZIC1 were detected, even though there was no difference in expression levels between the three groups (Figure 1B). However, a well-defined BRITE marker, CITED1, showed highest transcript levels in GD samples, followed by TMNG and control (p value, test for trend = 0.0009) (Figure 1D).
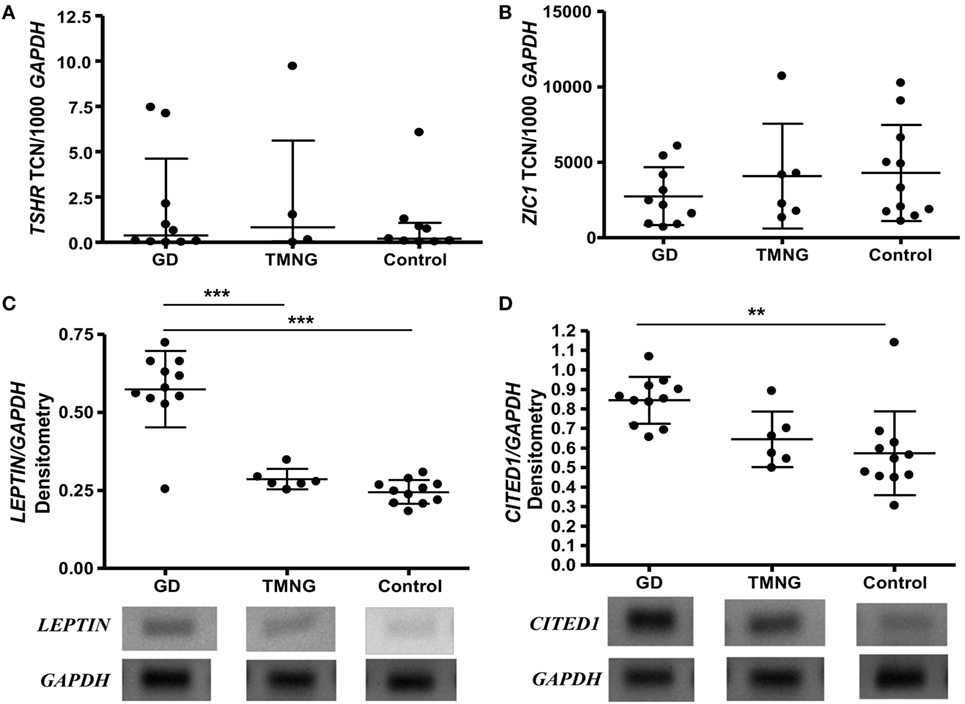
Figure 1. Ex vivo analysis of deep neck fat. Samples were snap frozen, and total RNA was isolated. Gene transcripts were measured by qPCR, (A) thyrotropin receptor (TSHR); (B) ZIC1 (brown adipose tissue marker), shown as transcript copy number (TCN) per 1,000 copies of housekeeper gene APRT (adenosine phosphoribosyl transferase); standard PCR was used to analyze (C) LEPTIN (white adipose tissue marker), (D) CITED1 (BRITE marker), densitometry were measured and corrected to housekeeping gene (GAPDH). Representative photos were shown (gels with all samples had been included in Figure S1 in Supplementary Material). Post-ANOVA test for linear trend of CITED1 was performed (p = 0.009). Results expressed as mean ± SD of all samples studied (each performed in duplicate) (**p ≤ 0.01; ***p < 0.001).
These data suggest that TSHR activation is associated with WAT and BRITE fat generation; subsequently, we tried to understand the role of TSHR activation on adipogenesis using primary cell cultures.
TSHR Activation Enhances Subcutaneous Adipogenesis Induced In Vitro
We first investigated the effects of TSHR signaling on adipogenesis using subcutaneous preadipocytes stably expressing or not activating mutant TSHR (L629F, TSHR*). TSHR activation did not induce spontaneous adipogenesis in subcutaneous precursors even when the cells were examined for morphological signs up to 3 weeks after reaching confluence. In contrast, after 22 days incubation in an adipogenic cocktail, we observed substantial enhancement of this lineage-specific differentiation by TSHR activation, whether assessed morphologically, by semiquantitative ORO staining or qPCR measurement of transcripts for LPL (marker of terminal differentiation) as shown in Figure 2.
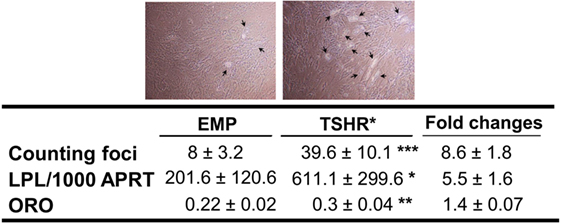
Figure 2. Adipogenesis in subcutaneous preadipocytes was assessed by foci counting (n = 11, representative photos were shown with arrows indicating differentiating adipocytes), LPL transcripts measured by qPCR (n = 9) and oil red O (ORO, n = 4). Result presented as fold increase in TSHR* populations relative to empty vector controls. The table reports raw data for qPCR results expressed as transcript copy number per 1,000 copies of housekeeper gene APRT (adenosine phosphoribosyl transferase), together with foci numbers and ORO optical density values (mean ± SEM). Histograms = mean ± SEM of all samples studied (each performed in duplicate) (*p < 0.05; **p ≤ 0.01; ***p < 0.005).
We concluded that TSHR activation enhances in vitro-induced adipogenesis. The adipogenic cocktail (ADM) used in this study contains PPARγ agonist TZD, which is known to stimulate BAT formation (40). Consequently, we conducted experiments to understand the impact of TSHR activation on BAT formation both in basal and induced adipogenesis conditions.
TSHR Activation Enhanced BAT Formation of Subcutaneous Precursors
We selected several markers including pre-BAT PRDM16, BAT PGC-1α (transcriptional regulator of BAT formation), and UCP1 (terminal BAT marker) (29).
These were measured in subcutaneous preadipocytes on day 0 in CM and following in vitro-induced adipogenesis in TZD-ADM for 22 days.
On day 0 (basal condition), the cells experiencing TSHR activation displayed substantially higher transcript levels of the pre-BAT marker, PRDM16, when compared with the control population as shown in Figure 3A. However, TSHR activation had no significant effect on expression levels of PGC-1α and UCP1 (Figures 3B,C).
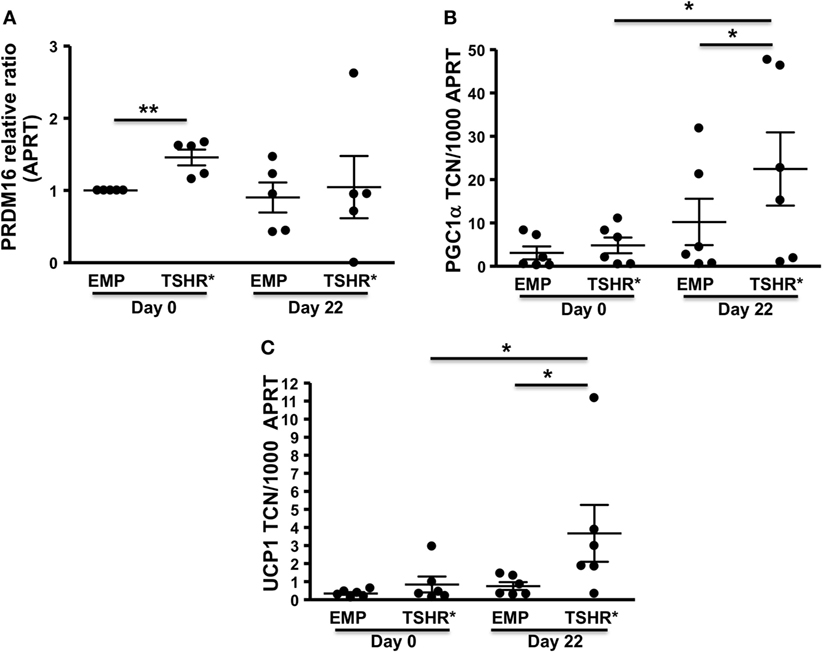
Figure 3. Preadipocytes/fibroblasts from subcutaneous fat (n = 6) expressing activating thyrotropin receptor (TSHR) mutant L629F (TSHR*) and equivalent empty vector controls were cultured until confluent (day 0) before changing to differentiation medium for 22 days. Total RNA was isolated before or after adipogenesis. PRDM16 (relative expression ratio) (A), PGC-1α (B), and uncoupling protein 1 (UCP1) (C) transcripts were measured by qPCR. Results are expressed as comparative qPCR (relative ratio to APRT) of PRDM16 or absolute qPCR (PGC-1α and UCP1) of transcript copy number (TCN) per 1,000 copies of housekeeper gene APRT (adenosine phosphoribosyl transferase). Histograms = mean ± SEM of all samples studied (each performed in duplicate). Two-tailed t-test or Mann–Whitney test used for statistic analysis (*p < 0.03; **p = 0.01).
By contrast, at day 22 following TZD-ADM induced adipogenesis, TSHR activation significantly increased transcript levels of PGC-1α and UCP1 when compared with control cells in ADM conditions but lacking TSHR activation (Figures 3B,C).
Discussion
Our study suggests that TSHR activation enhances adipogenesis and could contribute to the modulation of fat phenotype.
The ex vivo data demonstrate that in samples of fat from TSAB positive GD patients, transcript levels of markers for WAT (LEPTIN) and BRITE (CITED1) were significantly higher than in corresponding samples from people with TMNG or controls (all TSAB negative). Since all patients were euthyroid at the time of surgery, it is reasonable to conclude that the TSAB have a role in the observed effect and the presence of TSHR transcripts in all samples confirms that this would be plausible.
Having access to samples of neck adipose tissue is fortuitous since Cypess and colleagues reported a gradient from the surface to the midline of WAT via BRITE to BAT in this region using biomarkers, e.g., LEPTIN (WAT), gradient UCP1 expression (BRITE to BAT) or ZIC (41, 42). Studies in mice suggest a bidirectional interconversion of BRITE and white adipocytes (43), with BRITE adipocytes being induced by cold temperature into brown fat and conversely returning into white fat at higher temperatures. Similarly, Lee et al. found that BRITE fat can be transformed into brown or white by adrenergic stimulation and high-calorie diet, respectively (44). High thyroid hormone levels are known to induce brown fat activity in BAT and BRITE fat (3, 4, 45). Of note, the samples from the GD and TMNG patients would have previously encountered a period of thyroid hormone excess, during the hyperthyroid phase of their condition but only in GD would there have been simultaneous TSHR activation.
We hypothesize that in GD, TSHR activation increases adipogenesis and, combined with excess thyroid hormone, favors formation of BAT. This could also explain the heat intolerance of GD patients, which is usually attributed to excess thyroid hormone increasing metabolic rate. The concept is further supported by studies in the hyt/hyt mouse, which lacks a functional TSHR and deals poorly with low temperature, a characteristic which can be overcome by transfecting WT TSHR into the animals (22). Proof could be provided by comparing expression of WAT, BRITE, and BAT markers in adipose tissue from TSAB-positive GD patients when hyperthyroid and then when euthyroidism is restored; however, patient safety during surgery precludes this.
Our in vitro studies confirmed that TSHR activation increases adipogenesis in subcutaneous fat, in contrast to orbital fat, in which we have previously reported that TSHR activation inhibits induced adipogenesis (16). These effects are the opposite of the situation in hyperthyroid GD in which the majority of fat stores are depleted, with the exception of orbital fat which expands in some patients. Our studies have demonstrated that orbital adipogenesis is under differing regulatory mechanisms compared with non-orbital fat precursors (46, 47).
We also investigated whether TSHR activation had any effect on fat phenotype in vitro, we recognize that there may be some overlap in markers for WAT, BAT, pre-BAT, and BRITE but have selected the best characterized for each (48). We found that subcutaneous precursors, experiencing TSHR activation, had significantly higher transcript levels of the pre-BAT marker, PRDM16 in basal conditions. There were no other indicators of spontaneous adipogenesis in these cells. In ADM, TSHR activation significantly increased differentiation and also significantly increased expression levels of BAT markers PGC-1 and UCP1. Our findings are similar to those of Cypess et al. who induced adipogenesis in the presence of Db-cAMP and obtained significant enhancement of PGC-1α and UCP1 compared with control cells in ADM alone (41). In our in vitro model, cells experiencing TSHR activation (mutant TSHR) display a twofold to fourfold increase in basal cAMP when compared to empty vector control cells (16).
The in vitro findings support our hypothesis that TSHR activation enhances adipogenesis and favors BAT formation in the hyperthyroid state. Our ex vivo findings imply that enhanced adipogenesis persists but the fat phenotype is WAT with some features of BRITE rather than BAT. Could this contribute to the weight gain experienced in GD following treatment? If increased adipogenesis produces BAT, energy can be dissipated as heat (as in GD) and weight will be shed. Once the BAT phenotype is lost (posttreatment of GD), then the increased adipogenesis would lead to WAT accumulation and weight will be gained.
Current therapy is based on inhibiting thyroid hormone production medically, surgically, or using radioiodine ablation. Future strategies aimed at neutralizing TSAB, for example, using TSHR antagonist could be more effective in solving weight problem.
Ethics Statement
The South East Wales Research Ethics committee approved this study; all fat samples were collected with informed consent, and written consent was obtained.
Author Contributions
LZ and MD performed majority of the experiments; LZ, ML, and MD wrote the manuscript. DR and CD obtained ethical approval and reviewed the manuscript. MS, DS-C, and MD obtained fat samples from patients. LZ and ML coordinated the project, data analysis, and writing of the manuscript.
Conflict of Interest Statement
The authors declare that the research was conducted in the absence of any commercial or financial relationships that could be construed as a potential conflict of interest.
Funding
The authors are grateful to the National Eye Research Centre that partly supported this project.
Supplementary Material
The Supplementary Material for this article can be found online at http://journal.frontiersin.org/article/10.3389/fendo.2017.00083/full#supplementary-material.
Abbreviations
TSHR, thyrotropin receptor; MSC, mesenchymal stem cell; TSAB, thyroid-stimulating antibodies; CM, complete medium; ADM, adipogenic medium; WAT, white adipose tissue; BAT, brown adipose tissue.
References
1. Paschke R, Ludgate M. The thyrotropin receptor in thyroid diseases. N Engl J Med (1997) 337:1675–81. doi: 10.1056/NEJM199712043372307
2. Seppel T, Kosel A, Schlaghecke R. Bioelectrical impedance assessment of body composition in thyroid disease. Eur J Endocrinol (1997) 136:493–8. doi:10.1530/eje.0.1360493
3. Lahesmaa M, Orava J, Schalin-Jantti C, Soinio M, Hannukainen JC, Noponen T, et al. Hyperthyroidism increases brown fat metabolism in humans. J Clin Endocrinol Metab (2014) 99:E28–35. doi:10.1210/jc.2013-2312
4. Obregon MJ. Adipose tissues and thyroid hormones. Front Physiol (2014) 5:479. doi:10.3389/fphys.2014.00479
5. Cypess AM, Lehman S, Williams G, Tal I, Rodman D, Goldfine AB, et al. Identification and importance of brown adipose tissue in adult humans. N Engl J Med (2009) 360:1509–17. doi:10.1056/NEJMoa0810780
6. van Marken Lichtenbelt WD, Vanhommerig JW, Smulders NM, Drossaerts JM, Kemerink GJ, Bouvy ND, et al. Cold-activated brown adipose tissue in healthy men. N Engl J Med (2009) 360:1500–8. doi:10.1056/NEJMoa0808718
7. Virtanen KA, Lidell ME, Orava J, Heglind M, Westergren R, Niemi T, et al. Functional brown adipose tissue in healthy adults. N Engl J Med (2009) 360:1518–25. doi:10.1056/NEJMoa0808949
8. Tigas S, Idiculla J, Beckett G, Toft A. Is excessive weight gain after ablative treatment of hyperthyroidism due to inadequate thyroid hormone therapy? Thyroid (2000) 10:1107–11. doi:10.1089/thy.2000.10.1107
9. Jansson S, Berg G, Lindstedt G, Michanek A, Nystrom E. Overweight – a common problem among women treated for hyperthyroidism. Postgrad Med J (1993) 69:107–11. doi:10.1136/pgmj.69.808.107
10. Dale J, Daykin J, Holder R, Sheppard MC, Franklyn JA. Weight gain following treatment of hyperthyroidism. Clin Endocrinol (2001) 55:233–9. doi:10.1046/j.1365-2265.2001.01329.x
11. Pears J, Jung RT, Gunn A. Long-term weight changes in treated hyperthyroid and hypothyroid patients. Scott Med J (1990) 35:180–2. doi:10.1177/003693309003500609
12. Weinreb JT, Yang Y, Braunstein GD. Do patients gain weight after thyroidectomy for thyroid cancer? Thyroid (2011) 21:1339–42. doi:10.1089/thy.2010.0393
13. Laurberg P, Wallin G, Tallstedt L, Abraham-Nordling M, Lundell G, Torring O. TSH-receptor autoimmunity in Graves’ disease after therapy with anti-thyroid drugs, surgery, or radioiodine: a 5-year prospective randomized study. Eur J Endocrinol (2008) 158:69–75. doi:10.1530/EJE-07-0450
14. Marcus C, Ehren H, Bolme P, Arner P. Regulation of lipolysis during the neonatal period. Importance of thyrotropin. J Clin Invest (1988) 82:1793–7. doi:10.1172/JCI113793
15. Crisp MS, Lane C, Halliwell M, Wynford-Thomas D, Ludgate M. Thyrotropin receptor transcripts in human adipose tissue. J Clin Endocrinol Metab (1997) 82:2003–5.
16. Zhang L, Baker G, Janus D, Paddon CA, Fuhrer D, Ludgate M. Biological effects of thyrotropin receptor activation on human orbital preadipocytes. Invest Ophthalmol Vis Sci (2006) 47:5197–203. doi:10.1167/iovs.06-0596
17. Abe E, Marians RC, Yu W, Wu XB, Ando T, Li Y, et al. TSH is a negative regulator of skeletal remodeling. Cell (2003) 115:151–62. doi:10.1016/S0092-8674(03)00771-2
18. Elgadi A, Zemack H, Marcus C, Norgren S. Tissue-specific knockout of TSHR in white adipose tissue increases adipocyte size and decreases TSH-induced lipolysis. Biochem Biophys Res Commun (2010) 393:526–30. doi:10.1016/j.bbrc.2010.02.042
19. Lu S, Guan Q, Liu Y, Wang H, Xu W, Li X, et al. Role of extrathyroidal TSHR expression in adipocyte differentiation and its association with obesity. Lipids Health Dis (2012) 11:17. doi:10.1186/1476-511X-11-17
20. Ma S, Jing F, Xu C, Zhou L, Song Y, Yu C, et al. Thyrotropin and obesity: increased adipose triglyceride content through glycerol-3-phosphate acyltransferase 3. Sci Rep (2015) 5:7633. doi:10.1038/srep07633
21. Muscogiuri G, Sorice GP, Mezza T, Prioletta A, Lassandro AP, Pirronti T, et al. High-normal TSH values in obesity: is it insulin resistance or adipose tissue’s guilt? Obesity (Silver Spring) (2013) 21:101–6. doi:10.1002/oby.20240
22. Endo T, Kobayashi T. Thyroid-stimulating hormone receptor in brown adipose tissue is involved in the regulation of thermogenesis. Am J Physiol Endocrinol Metab (2008) 295:E514–8. doi:10.1152/ajpendo.90433.2008
23. Endo T, Kobayashi T. Expression of functional TSH receptor in white adipose tissues of TSH receptor mutant mice induces lipolysis in vivo. Am J Physiol Endocrinol Metab (2012) 302:E1569–75. doi:10.1152/ajpendo.00572.2011
24. Martinez-deMena R, Anedda A, Cadenas S, Obregon MJ. TSH effects on thermogenesis in rat brown adipocytes. Mol Cell Endocrinol (2015) 404:151–8. doi:10.1016/j.mce.2015.01.028
25. de Lloyd A, Bursell J, Gregory JW, Rees DA, Ludgate M. TSH receptor activation and body composition. J Endocrinol (2010) 204:13–20. doi:10.1677/JOE-09-0262
26. Chondronikola M, Volpi E, Borsheim E, Porter C, Annamalai P, Enerback S, et al. Brown adipose tissue improves whole-body glucose homeostasis and insulin sensitivity in humans. Diabetes (2014) 63:4089–99. doi:10.2337/db14-0746
27. Seale P, Bjork B, Yang W, Kajimura S, Chin S, Kuang S, et al. PRDM16 controls a brown fat/skeletal muscle switch. Nature (2008) 454:961–7. doi:10.1038/nature07182
28. Stephens M, Ludgate M, Rees DA. Brown fat and obesity: the next big thing? Clin Endocrinol (2011) 74:661–70. doi:10.1111/j.1365-2265.2011.04018.x
29. Wu J, Cohen P, Spiegelman BM. Adaptive thermogenesis in adipocytes: is beige the new brown? Genes Dev (2013) 27:234–50. doi:10.1101/gad.211649.112
30. Wu J, Bostrom P, Sparks LM, Ye L, Choi JH, Giang AH, et al. Beige adipocytes are a distinct type of thermogenic fat cell in mouse and human. Cell (2012) 150:366–76. doi:10.1016/j.cell.2012.05.016
31. Jespersen NZ, Larsen TJ, Peijs L, Daugaard S, Homoe P, Loft A, et al. A classical brown adipose tissue mRNA signature partly overlaps with brite in the supraclavicular region of adult humans. Cell Metab (2013) 17:798–805. doi:10.1016/j.cmet.2013.04.011
32. Cohen P, Levy JD, Zhang Y, Frontini A, Kolodin DP, Svensson KJ, et al. Ablation of PRDM16 and beige adipose causes metabolic dysfunction and a subcutaneous to visceral fat switch. Cell (2014) 156:304–16. doi:10.1016/j.cell.2013.12.021
33. Zuk PA, Zhu M, Ashjian P, De Ugarte DA, Huang JI, Mizuno H, et al. Human adipose tissue is a source of multipotent stem cells. Mol Biol Cell (2002) 13:4279–95. doi:10.1091/mbc.E02-02-0105
34. Starkey KJ, Janezic A, Jones G, Jordan N, Baker G, Ludgate M. Adipose thyrotrophin receptor expression is elevated in Graves’ and thyroid eye diseases ex vivo and indicates adipogenesis in progress in vivo. J Mol Endocrinol (2003) 30:369–80. doi:10.1677/jme.0.0300369
35. Evans C, Morgenthaler NG, Lee S, Llewellyn DH, Clifton-Bligh R, John R, et al. Development of a luminescent bioassay for thyroid stimulating antibodies. J Clin Endocrinol Metab (1999) 84:374–7. doi:10.1210/jcem.84.1.5532
36. Rice SP, Zhang L, Grennan-Jones F, Agarwal N, Lewis MD, Rees DA, et al. Dehydroepiandrosterone (DHEA) treatment in vitro inhibits adipogenesis in human omental but not subcutaneous adipose tissue. Mol Cell Endocrinol (2010) 320:51–7. doi:10.1016/j.mce.2010.02.017
37. Fuhrer D, Lewis MD, Alkhafaji F, Starkey K, Paschke R, Wynford-Thomas D, et al. Biological activity of activating thyroid-stimulating hormone receptor mutants depends on the cellular context. Endocrinology (2003) 144:4018–30. doi:10.1210/en.2003-0438
38. Ussar S, Lee KY, Dankel SN, Boucher J, Haering MF, Kleinridders A, et al. ASC-1, PAT2, and P2RX5 are cell surface markers for white, beige, and brown adipocytes. Sci Transl Med (2014) 6:247ra103. doi:10.1126/scitranslmed.3008490
39. Sharp LZ, Shinoda K, Ohno H, Scheel DW, Tomoda E, Ruiz L, et al. Human BAT possesses molecular signatures that resemble beige/brite cells. PLoS One (2012) 7:e49452. doi:10.1371/journal.pone.0049452
40. Ohno H, Shinoda K, Spiegelman BM, Kajimura S. PPARgamma agonists induce a white-to-brown fat conversion through stabilization of PRDM16 protein. Cell Metab (2012) 15:395–404. doi:10.1016/j.cmet.2012.01.019
41. Cypess AM, White AP, Vernochet C, Schulz TJ, Xue R, Sass CA, et al. Anatomical localization, gene expression profiling and functional characterization of adult human neck brown fat. Nat Med (2013) 19:635–9. doi:10.1038/nm.3112
42. Nedergaard J, Cannon B. How brown is brown fat? It depends where you look. Nat Med (2013) 19:540–1. doi:10.1038/nm.3187
43. Rosenwald M, Perdikari A, Rulicke T, Wolfrum C. Bi-directional interconversion of brite and white adipocytes. Nat Cell Biol (2013) 15:659–67. doi:10.1038/ncb2740
44. Lee YH, Petkova AP, Mottillo EP, Granneman JG. In vivo identification of bipotential adipocyte progenitors recruited by beta3-adrenoceptor activation and high-fat feeding. Cell Metab (2012) 15:480–91. doi:10.1016/j.cmet.2012.03.009
45. Lee JY, Takahashi N, Yasubuchi M, Kim YI, Hashizaki H, Kim MJ, et al. Triiodothyronine induces UCP-1 expression and mitochondrial biogenesis in human adipocytes. Am J Physiol Cell Physiol (2012) 302:C463–72. doi:10.1152/ajpcell.00010.2011
46. Zhang L, Grennan-Jones F, Lane C, Rees DA, Dayan CM, Ludgate M. Adipose tissue depot-specific differences in the regulation of hyaluronan production of relevance to Graves’ orbitopathy. J Clin Endocrinol Metab (2012) 97:653–62. doi:10.1210/jc.2011-1299
47. Zhang L, Ji QH, Ruge F, Lane C, Morris D, Tee AR, et al. Reversal of pathological features of Graves’ orbitopathy by activation of forkhead transcription factors, FOXOs. J Clin Endocrinol Metab (2016) 101:114–22. doi:10.1210/jc.2015-2932
Keywords: adipogenesis, thyrotropin receptor, body composition, white adipose tissue, BRITE adipocytes, brown adipose tissue
Citation: Draman MS, Stechman M, Scott-Coombes D, Dayan CM, Rees DA, Ludgate M and Zhang L (2017) The Role of Thyrotropin Receptor Activation in Adipogenesis and Modulation of Fat Phenotype. Front. Endocrinol. 8:83. doi: 10.3389/fendo.2017.00083
Received: 13 January 2017; Accepted: 31 March 2017;
Published: 19 April 2017
Edited by:
Susanne Neumann, National Institutes of Health, USAReviewed by:
Ann Marie Zavacki, Brigham and Women’s Hospital, USAPieter de Lange, Università degli Studi della Campania “Luigi Vanvitelli” Caserta, Italy
Copyright: © 2017 Draman, Stechman, Scott-Coombes, Dayan, Rees, Ludgate and Zhang. This is an open-access article distributed under the terms of the Creative Commons Attribution License (CC BY). The use, distribution or reproduction in other forums is permitted, provided the original author(s) or licensor are credited and that the original publication in this journal is cited, in accordance with accepted academic practice. No use, distribution or reproduction is permitted which does not comply with these terms.
*Correspondence: Marian Ludgate, bHVkZ2F0ZUBjYXJkaWZmLmFjLnVr;
Lei Zhang, emhhbmdMMTRAY2FyZGlmZi5hYy51aw==