 Andrea M. Brennan
 Andre Tchernof2,3,4
 Robert Ross
- 1School of Kinesiology and Health Studies, Queen's University, Kingston, ON, Canada
- 2Endocrinology and Nephrology, University Hospital of Quebec, Quebec, QC, Canada
- 3School of Nutrition, Laval University, Quebec, QC, Canada
- 4Quebec Heart and Lung Institute, Quebec, QC, Canada
- 5Division of Cardiovascular Medicine, Beth Israel Deaconess Medical Center, Boston, MA, United States
Objectives: Total, visceral, and abdominal subcutaneous adipose tissue (AT) depots have distinct associations with cardiometabolic health; however, the metabolite profiles that characterize each AT depot and its reduction following exercise are poorly understood. Our objectives were to (1) assess the independent associations between identified metabolites and total, visceral and abdominal subcutaneous AT; and (2) examine whether changes in metabolite concentrations and AT mass following aerobic exercise are associated.
Methods: A secondary analysis was performed in 103 middle-aged abdominally obese men and women {[mean (SD)], 52.4 (8.0) years} randomized into one of four groups varying in exercise amount and intensity for 6 months duration: high amount high intensity, high amount low intensity, low amount low intensity, and control. One hundred and forty seven metabolites were profiled by liquid chromatography-tandem mass spectrometry. AT mass was measured by magnetic resonance imaging (MRI).
Results: Individual metabolite associations with AT depots confirmed several established cross-sectional relationships between the obesity phenotype and metabolic pathways. Collapsed across exercise groups, reduction in visceral AT predicted increases in pyroglutamic acid (B = −0.41) and TCA cycle intermediates [succinic (B = −0.41) and fumaric acid (B = −0.20)], independent of change in total AT. Changes in UDP-GlcNAc (B = 0.43), pyroglutamic acid (B = −0.35), histidine (B = 0.20), citric acid/isocitric acid (B = −0.20), and creatine (B = 0.27) were significantly associated with changes in total AT (false discovery rate = 0.1).
Conclusions: Our findings point to potential biomarkers of depot-specific AT reduction that may play a direct role in mediating cardiometabolic improvements.
Introduction
Excess accumulation of adiposity, in particular abdominal adipose tissue (AT), is associated with morbidity and mortality, independent of age and sex (1). To explain underlying metabolic alterations in response to AT accumulation that may result in subsequent health decline, current observations focus on a small number of measured biomarkers including lipoproteins, insulin, and glucose (2). Metabolomics, the assessment of large numbers of small-molecule metabolites, affords the opportunity to gain a broader understanding of the activity of metabolic pathways affected by excess adiposity (3). The substrates and products of metabolism under conditions of excess adiposity may serve as biomarkers for AT dysfunction or directly mediate AT pathology as initiators or regulatory signals of disease processes.
Total, visceral and abdominal subcutaneous AT depots have distinct associations with cardiometabolic health (4); however, the metabolite profile that characterizes each AT depot and mediates risk for disease is not understood. Magnetic resonance imaging (MRI), combined with metabolomics technologies, allows for exploitation of biomarkers and/or molecular mechanisms that both characterize the phenotype associated with specific AT depot accumulation and explain the impact of AT reduction on circulating metabolites and corresponding improvement in cardiometabolic risk. Current cross-sectional observations relating specific AT depots and the metabolome are limited and inconsistent. Boulet et al. observed positive associations between the branched chain amino acids (BCAAs), alanine, tyrosine, and glutamate with both subcutaneous and visceral AT (5), while Schlecht et al. did not identify any significant associations between visceral and abdominal subcutaneous AT and 20 serum metabolites measured (6). To our knowledge, no prior observations exist to describe corresponding changes of metabolites and AT depots following exposure to physiologic perturbations including exercise.
We previously conducted and published primary findings from a randomized controlled trial examining the separate effects of exercise amount and/or intensity on abdominal obesity and glucose tolerance (7, 8). In this secondary analysis, using MRI-derived AT depot data in addition to plasma metabolite profiles collected before and after the exercise intervention we aim to (1) assess the independent associations between identified metabolites and total, visceral, and abdominal subcutaneous AT; and (2) examine whether metabolite concentrations and AT mass change concurrently following chronic aerobic exercise. Our observations may help to identify novel biomarkers of both excess total and regional AT and efficacy of treatment.
Materials and Methods
Participants
Details of the study design and methods have been published previously (7) as are the findings from the primary analysis (8). Briefly, we conducted a 24 weeks, single center, randomized controlled trial with a parallel group design between September 2009 and May 2013. Three hundred abdominally obese adults were randomized into one of four treatments: control (no exercise), low amount low intensity (LALI; 180 and 300 kcal/session for women and men, respectively, at 50% VO2peak), high amount low intensity (HALI; 360 and 600 kcal/session, respectively, at 50% VO2peak), and high amount high intensity (HAHI; 360 and 600 kcal/session, respectively, at 75% VO2peak). Exercise sessions were supervised and performed 5 days/week for the duration of the trial. All participants provided informed consent prior to participation and the protocols used in the original investigation and this secondary analysis were approved by the Queen's University Health Sciences Research Ethics Board.
Participants from the original trial were excluded if they did not have both pre- and post- MRI data (n = 171) and if there were issues with the MRI protocol (image quality and positioning pre- and/or post-treatment) (n = 23) which resulted in a study sample of 103 participants: Control, n = 20; LALI, n = 24; HALI, n = 30; HAHI, n = 29. Participant characteristics in Table 1 do not replicate prior analyses derived from the primary trial.
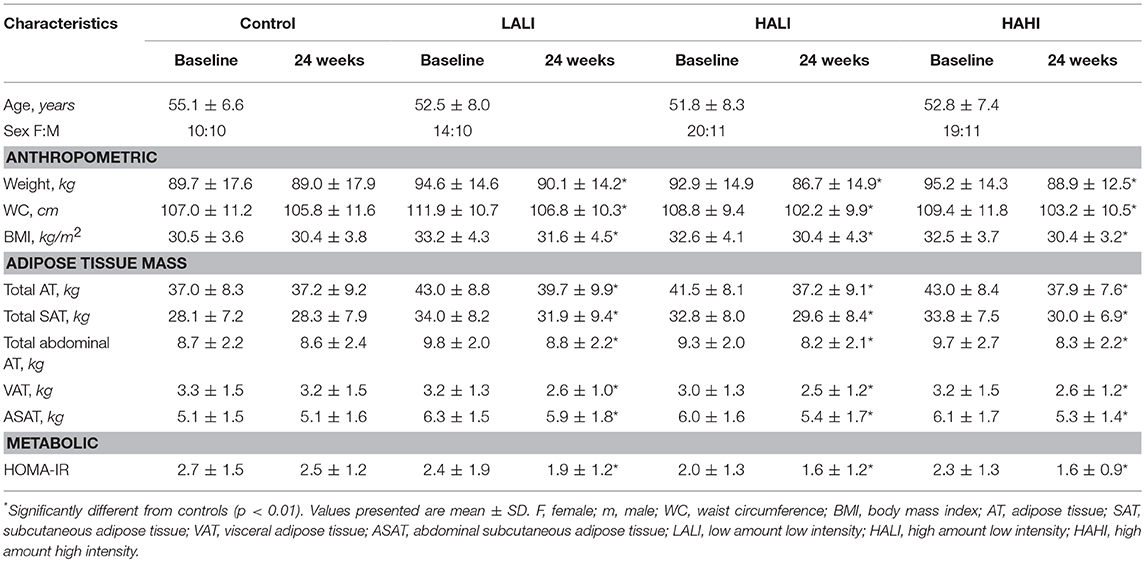
Table 1. Participant characteristics at baseline and 24 weeks.
Assessment of Body Composition
Whole body AT was measured by MRI at baseline and following treatment by a 1.5 Tesla magnet at Kingston General Hospital using a protocol previously described (9, 10). Briefly, participants entered the magnet in a prone position, feet first and the L4-L5 intervertebral space was landmarked using a sagittal scout image. 10 mm thick images, 40 mm apart were taken from L4-L5 to the lower extremities (feet). The participants were then required to exit the magnet and re-enter head first with their arms extended. The L4-L5 inter-vertebral space was relocated and 10 mm thick images 40 mm apart were taken from L4-L5 to the upper extremities (hands). Specialized image analysis software (sliceOmatic version 5.0, TomoVision, Montreal, QC) was used to quantify the tissue depots. Total AT was derived using all images (~41 images per participant). Abdominal subcutaneous and visceral AT were determined using 5 consecutive images beginning one image below L4-L5, L4-L5 and three images above.
Due to scheduling issues, MRI scans for 22 participants were obtained more than 2 weeks after the last exercise session or the end of the 6 months monitoring period (Control, n = 6; LALI, n = 4; HALI, n = 8; HAHI, n = 4). For these cases, total weight derived from the MRI analysis was compared to the anthropometric weight taken at week 24. The average weight difference for these cases was 1.8 kg (±1.8). Exclusion of these participants from the analysis revealed no significant difference in our overall findings, thus, they were included in our final sample.
Plasma Sampling and Metabolite Profiling
Fasting plasma samples were acquired via the antecubital vein at baseline prior to an OGTT and again at least 48 h after the last exercise session at 24 weeks. The plasma was immediately separated by centrifugation (10 min at 4,250 rpm) and stored at −80°C.
Targeted metabolomic profiling of plasma samples using LC-MS/MS in positive and negative electrospray ionization modes was performed and is described elsewhere (11). Briefly, in positive mode, normal phase hydrophilic interaction chromatography (HILIC) using a 2.1 × 150 mm 3 μm Atlantis column (Waters) was coupled to a 4,000 QTrap triple quadrupole mass spectrometer (Applied Biosystems/Sciex) equipped with an electrospray ionization source for targeted detection of 139 metabolites using a dynamic multiple reaction monitoring (dMRM) mechanism. In negative mode, HILIC chromatography using a 2.1 × 100mm 3.5 μm Xbridge Amide column (Waters) was coupled to an Agilent 6,490 triple quadrupole mass spectrometer equipped with an electrospray ionization source for targeted detection of 70 metabolites using dMRM. Metabolite peaks were integrated using Sciex MultiQuant software (positive mode) or Agilent Masshunter Quantitative software (negative mode). All metabolite peaks were manually reviewed for peak quality in a blinded manner.
Statistical Analysis
All metabolites were log-transformed to approximate a normal distribution and to reduce heteroscedasticity and analyses were adjusted for age and sex. Principal component analysis (PCA) was used to reduce dimensionality of the metabolite data set at baseline. Nineteen main principal factors were derived after orthogonal Varimax rotation (Table 2). Factors were retained if they had an eigenvalue >1 and individual metabolites with a factor load >|0.4| for a given PCA-derived factor were included. Scores were calculated for each participant based on standardized scoring coefficients. Cross-sectional associations between PCA factor scores and AT depots (total, abdominal, abdominal subcutaneous, visceral AT) were assessed with multiple linear regression. In addition, multiple linear regression was used to determine cross-sectional associations between individual metabolites and AT depots.
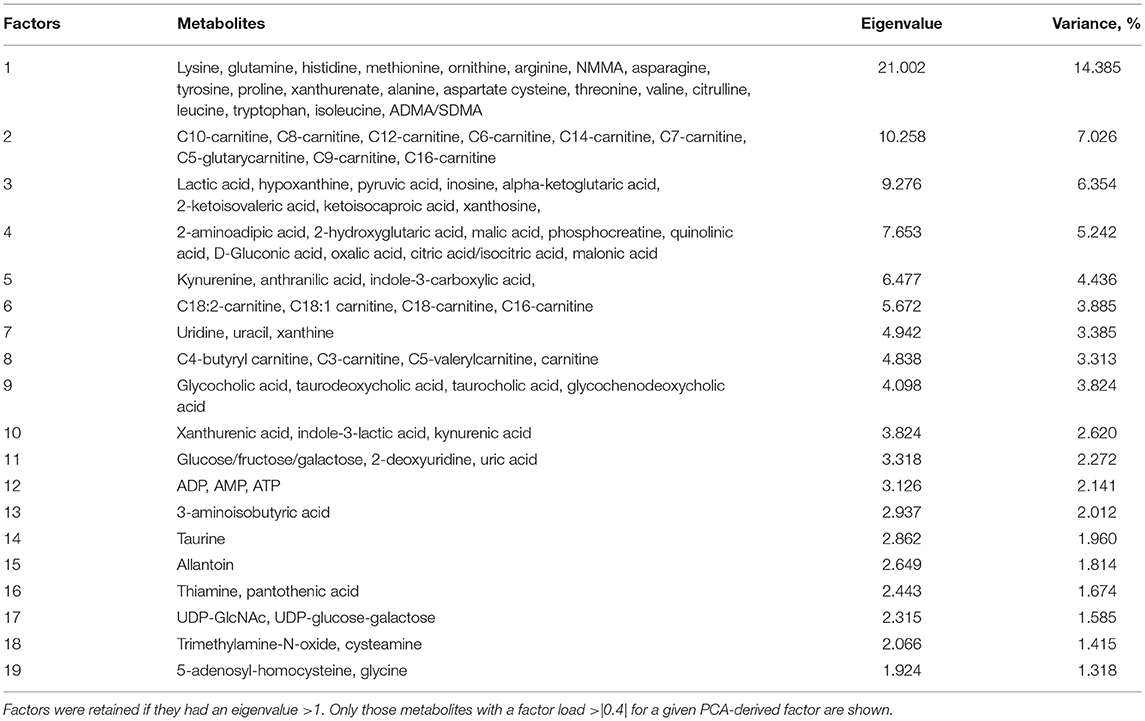
Table 2. Principal Component Analysis Factors.
To determine the association between changes in measures of adiposity and change in metabolite concentrations, partial least squares regression (PLS) was first used to reduce the number of metabolites based on their predictive performance for the outcome (AT depot). The Variable of Importance in the Projection Statistic (VIP) was calculated and used to determine the relative contribution of each metabolite. Metabolites with VIP scores ≥1 were extracted for further interrogation. Multiple linear regression was used to determine associations between the changes in metabolites extracted by PLS and AT reduction, adjusted for baseline metabolite concentration. Analyses were then adjusted for total AT. In all of the above analyses, p-values were FDR-adjusted (q-value = 10%) for multiple testing using the Benjamini-Hochberg method.
Selected metabolites whose change was associated with change in the AT depots at p < 0.05 were further interrogated through multiple linear regression to determine combined and independent associations with measures of glucose and insulin metabolism (HOMA-IR, 2 h glucose, insulin AUC). Statistical significance was evaluated at p < 0.05. All analyses were performed using SPSS Statistics (Version 24).
Results
Participant characteristics before and after treatment are summarized in Table 1. Significant reductions in all AT depots, HOMA-IR, and insulin AUC were observed in each exercise group compared to controls; however, there were no differences between exercise groups (p < 0.05). Thus, subsequent analyses are collapsed across exercise group.
PCA was used to group highly correlated metabolites into fewer factors (Table 2). Total, abdominal, and abdominal subcutaneous AT were positively associated with Factor 3 (purine and BCAA metabolites), Factor 5 (tryptophan metabolites), and Factor 15 (allantoin) (p < 0.05). Visceral AT was positively associated with Factor 5 (p < 0.05). Individual metabolite associations with AT depots confirmed several established cross-sectional relationships between the obesity phenotype and metabolic pathways as illustrated in Table 3 (all FDR < 0.10). After adjusting for total AT, kynurenic acid (B = 0.18, p = 2.9 × 10⁻⁵), tyrosine (B = 0.09, p = 0.049), valine (B = 0.10, p = 0.033), and homogentisic acid (B = 0.10, p = 0.018) were significantly associated with abdominal AT. Similarly, visceral AT was significantly associated with phenylalanine (B = 0.20, p = 0.003), kynurenic acid (B = 0.19, p = 0.003), homogentisic acid (B = 0.14, p = 0.015), and the BCAAs (B = 0.13–0.20, p = 0.003–0.041) after adjusting for total AT.
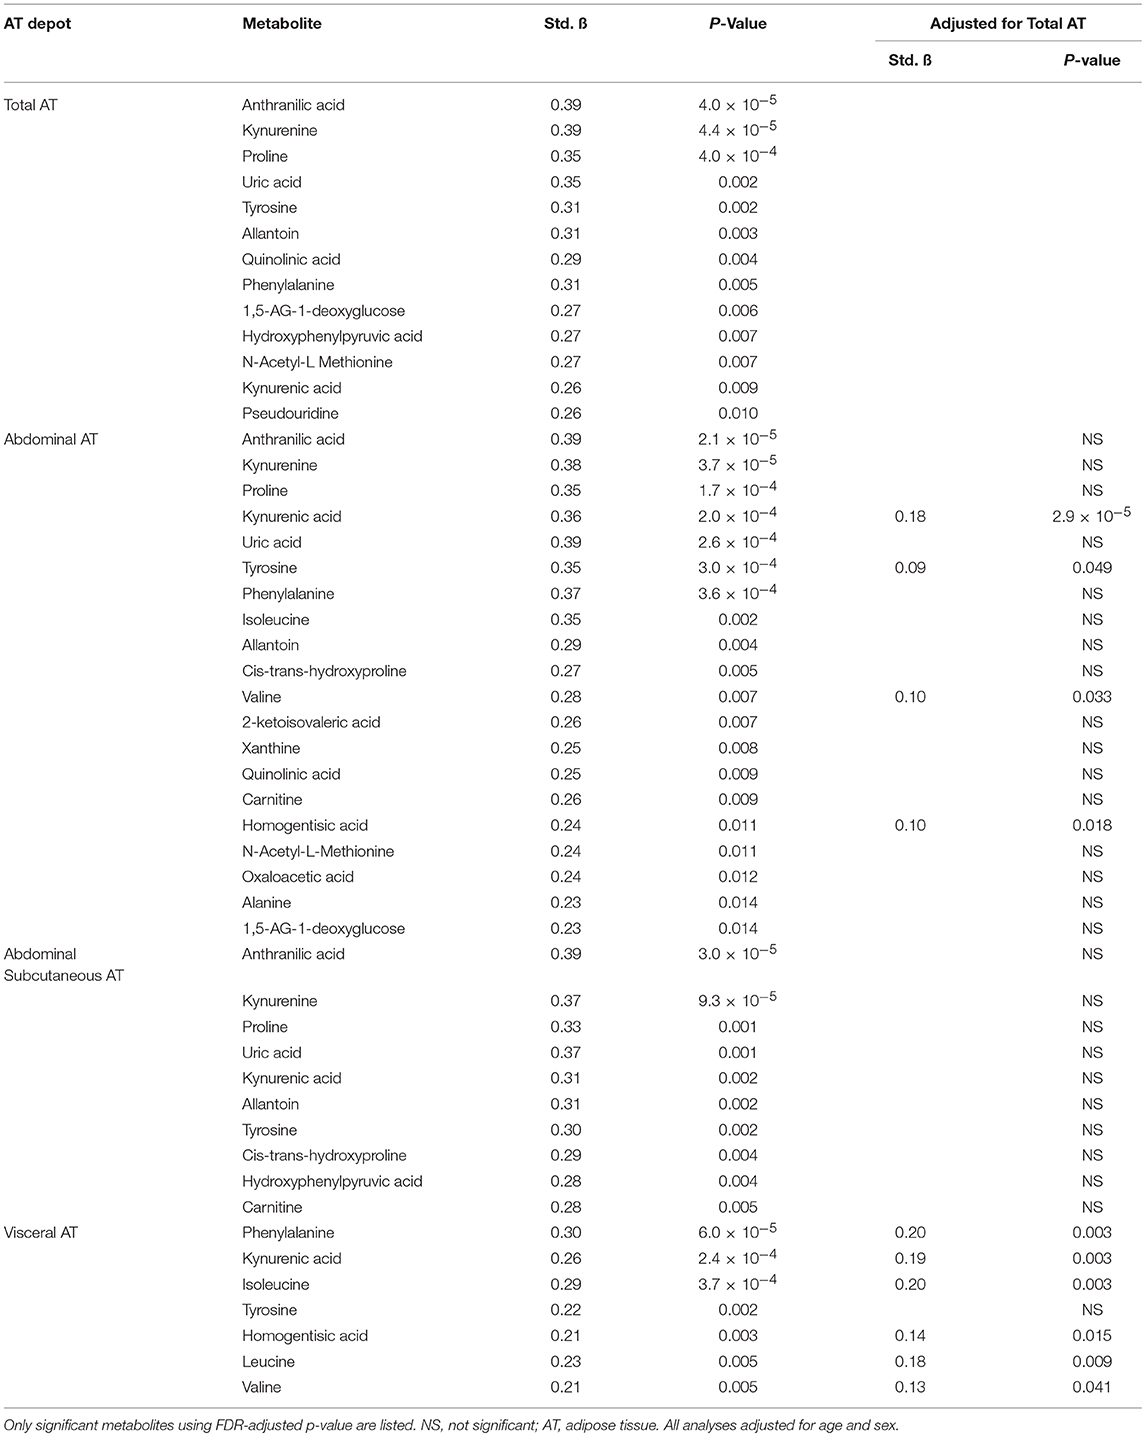
Table 3. Cross-sectional associations between metabolites and AT depots.
Associations between changes in AT depots and changes in metabolites are illustrated in Figure 1. PLS analyses reduced the number of examined metabolites to 49, 47, 48, and 45 for total, abdominal, abdominal subcutaneous, and visceral AT, respectively based on VIP scores ≥1. After FDR-adjustment, changes in UDP-GlcNAc (B = 0.43), pyroglutamic acid (B = −0.35), histidine (B = 0.20), citric acid/isocitric acid (B = −0.20), and creatine (B = 0.27) were significantly associated with changes in total AT. Changes in UDP-GlcNAc (B = 0.38) and pyroglutamic acid (B = −0.39) were significantly associated with change in abdominal AT. Only change in UDP-GlcNAc (B = 0.35) was significantly associated with change in abdominal subcutaneous AT. Change in pyroglutamic acid (B = −0.44), succinic acid (B = −0.42), fumaric acid (B = −0.29), and UDP-GlcNAc (B = 0.28) were significantly associated with visceral AT changes. Pyroglutamic acid (B = −0.39) remained significantly associated with change in abdominal AT after adjusting for change in total AT (p < 0.05). Pyroglutamic acid (B = −0.41), succinic acid (B = −0.41), and fumaric acid (B = −0.20), remained significantly associated with visceral AT after adjusting for total AT (p < 0.05).
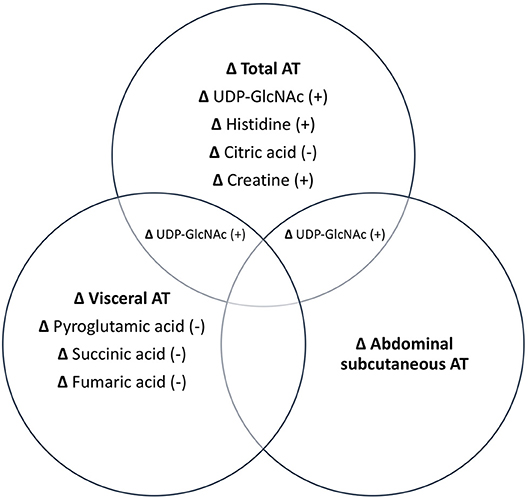
Figure 1. Independent and combined associations between changes in metabolites and changes in AT depots. All metabolites listed are significant at p < 0.05. +, positive association; –, negative association.
Metabolites whose changes were significantly associated with changes in AT depots were interrogated further to determine combined and independent associations with changes in glucose and insulin metabolism (HOMA-IR, 2 h glucose and insulin AUC), shown in Table 4. Univariate associations revealed that change in C5-glutarylcarnitine (B = 0.22) and inosine (B = −0.32) were significantly associated with change in 2 h glucose; change in creatine (B = 0.24) and UDP-GlcNAc (B = 0.25) were significantly associated with change in insulin AUC; and change in C8-carnitine, UDP-GlcNAc (B = 0.26), glutamate (B = 0.20), and succinic acid (B = −0.25) were significantly associated with change in HOMA-IR (B = −0.30) (all p < 0.05). After adjusting for its related AT depot change, C5-glutarylcarnitine and inosine remained significantly associated with change in 2 h glucose (p < 0.05); change in creatine remained significantly associated with change in insulin AUC; and change in C8-carnitine, remained significantly associated with change in HOMA-IR. UDP-GlcNAc, glutamate, and succinic acid were no longer associated with measures of insulin and glucose metabolism after adjusting for adiposity (p > 0.05).
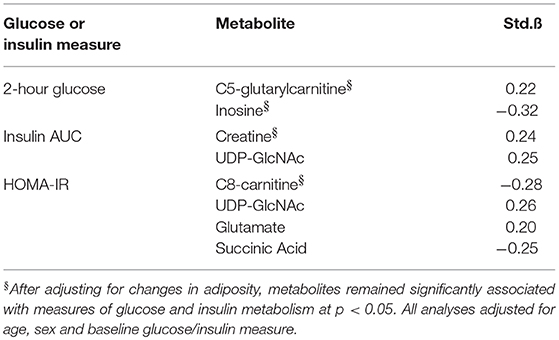
Table 4. Independent associations between changes in metabolites, adiposity measures, and measures of glucose and insulin metabolism.
Discussion
To our knowledge, this is the first study to systematically explore the impact of depot-specific AT reduction following aerobic exercise on the plasma metabolome. Our primary finding was that reduction in visceral AT independently predicted increases in pyroglutamic acid and TCA cycle intermediates (succinic and fumaric acid) in men and women with abdominal obesity. Though preliminary, our observations point to novel biomarkers of total and regional AT reduction following exercise that may also mediate changes in cardiometabolic health. Given that routine measurement of visceral AT by MRI is not feasible in clinical practice, the discovery of blood-based biomarkers that can act as surrogate measures of visceral AT may improve excess visceral AT mass diagnosis in addition to improvements following treatment.
The combination of metabolomics and MRI affords the opportunity to extend the work of others to examine subtle variations in the metabolite network that are influenced by fluctuation in total and regional adiposity. We observed that visceral AT reduction was associated with increases in the TCA cycle intermediates, succinic acid and fumaric acid, independent of changes in total adiposity. While literature examining plasma TCA cycle intermediates and AT depots is scarce, findings from biopsy samples of adipocytes demonstrate lower mitochondrial citrate synthase and oxygen consumption rates in visceral adipocytes from obese compared to non-obese subjects (12). Combined with our findings, it is possible that visceral AT reduction following exercise helps to mediate the metabolic efficiency of the mitochondrial TCA cycle and is reflected by higher levels of TCA cycle intermediates in the plasma, though this finding is preliminary and requires confirmation with mechanistic studies (12). We also observed increases in pyroglutamic acid corresponding to reduced visceral AT. While its role is poorly understood, pyroglutamic acid is partly produced enzymatically from glutamate and may act as a glutamate reservoir (13). Boulet et al. previously observed increased glutamate concentrations with excess visceral AT (5). Thus, combined with our findings, it is possible that increased production of pyroglutamic acid via reductions in visceral adiposity attenuates circulating glutamate levels. We did not observe any significant metabolite changes that were independently associated with abdominal subcutaneous AT reduction, rather metabolite associations with this depot instead reflected changes in total adiposity.
Several cross-sectional observations exist that characterize the metabolic profile of individuals with obesity compared to their lean counterparts (14). Increased circulating levels of BCAAs, tryptophan (15, 16), tyrosine (15–18) and nucleotide metabolites (18) are consistently shown to be increased in those with obesity (15, 17–22). Few observations exist that evaluate AT depot-specific metabolite profiles, especially after adjusting for total adiposity. Boulet et al. identified glutamate as the strongest independent predictor of visceral AT, while valine was independently associated with subcutaneous AT after adjustment for total AT (5). Here, we confirm prior metabolite associations with total adiposity and extend those observations by uncovering significant relations between higher visceral AT mass and corresponding circulating concentrations of BCAAs, independent of total AT.
It is well-established that excess adiposity, in particular visceral AT, is associated with cardiometabolic derangements (1); however, the underlying molecular mechanisms that explain the distinct contribution of each AT depot to risk are unclear. We observed that changes in UDP-GlcNAc (decrease), glutamate (decrease), and succinic acid (increase) predicted improvement in measures of glucose and insulin homeostasis, but not after adjusting for AT reduction. This suggests that part of the association between metabolic changes and cardiometabolic risk can be explained by changes in adiposity. In particular, we previously reported significant associations between UDP-GlcNAc and HOMA-IR (11). UDP-GlcNAc is a nucleotide sugar that is sensitive to changes in energy balance (23). It is a product of the hexosamine biosynthetic pathway (HBP) and a substrate for the O-linked N-acetylglucosamine transferase enzyme (OGT) that catalyzes protein modification through the addition of O-GlcNAc. Under conditions of chronic positive energy balance, the activity of the HBP and corresponding production of UDP-GlcNAc increases, along with OGT-catalyzed O-GlcNAcylation. Excessive O-GlcNAcylation directly interferes with insulin signaling pathways, resulting in reduced insulin sensitivity (23). Thus, combined with our present observations, part of the associated improvement in insulin resistance with UDP-GlcNAc reduction may be explained by changes in total AT.
A limitation of our study is that on average, few metabolites significantly changed with exercise compared to controls (11); thus, we cannot attribute the AT-metabolite associations to exercise-induced AT reduction, per se. It is unknown whether alternative perturbations including diet would elicit similar responses and it is possible that plasma metabolite changes would reflect the separate and combined influences of dietary and adiposity changes. Our findings are still relevant for addressing important gaps in the current literature regarding metabolic consequences of total and regional adiposity changes, regardless of the source of AT change. Additionally, our sample was relatively homogeneous which may have attenuated the strength of the observed relationships and limits the generalizability of our findings. However, we recently observed substantial interindividual variability in AT changes with exercise (24), therefore the range of AT loss varies across individuals.
In summary, our findings point to potential biomarkers of depot-specific AT accumulation and reduction that may play a direct role in mediating cardiometabolic improvements. These observations prompt future work for mechanistic studies to elucidate cause-and-effect relationships.
Ethics Statement
This study was carried out in accordance with the recommendations of Health Sciences Research Ethics Board at Queen's University with written informed consent from all subjects. All subjects gave written informed consent in accordance with the Declaration of Helsinki. The protocol was approved by the Queen's University Health Sciences Research Ethics Board.
Author Contributions
AB and RR conceived and designed the study. TC and AB analyzed the MRI images. RG contributed to metabolomics analysis of plasma samples. AB completed all statistical analyses. AB and RR drafted the manuscript. All authors edited and revised the manuscript with critical feedback given.
Funding
This study was supported by Canadian Institutes of Health Research (grant OHN-63277). CIHR had no involvement in the conception, design, collection, analysis, or interpretation of the data contained within this manuscript.
Conflict of Interest Statement
The authors declare that the research was conducted in the absence of any commercial or financial relationships that could be construed as a potential conflict of interest.
References
1. Despres JP, Lemieux I. Abdominal obesity and metabolic syndrome. Nature (2006) 444:881–7. doi: 10.1038/nature05488
2. Kissebah AH, Vydelingum N, Murray R, Evans DJ, Kalkhoff RK, Adams PW. Relation of body fat distribution to metabolic complications of obesity. J Clin Endocrinol Metab. (1982) 54:254–60. doi: 10.1210/jcem-54-2-254
3. Lewis GD, Asnani A, Gerszten RE. Application of metabolomics to cardiovascular biomarker and pathway discovery. J Am Coll Cardiol. (2008) 52:117–23. doi: 10.1016/j.jacc.2008.03.043
4. Kissebah AH, Krakower GR. Regional adiposity and morbidity. Physiol Rev. (1994) 74:761–812. doi: 10.1152/physrev.1994.74.4.761
5. Boulet MM, Chevrier G, Grenier-Larouche T, Pelletier M, Nadeau M, Scarpa J, et al. Alterations of plasma metabolite profiles related to adipose tissue distribution and cardiometabolic risk. Am J Physiol Endocrinol Metab. (2015) 309:E736–46. doi: 10.1152/ajpendo.00231.2015
6. Schlecht I, Gronwald W, Behrens G, Baumeister SE, Hertel J, Hochrein J, et al. Visceral adipose tissue but not subcutaneous adipose tissue is associated with urine and serum metabolites. PloS ONE (2017) 12:e0175133. doi: 10.1371/journal.pone.0175133
7. Ross R, Hudson R, Day AG, Lam M. Dose-response effects of exercise on abdominal obesity and risk factors for cardiovascular disease in adults: study rationale, design and methods. Contemp Clin Trials (2013) 34:155–60. doi: 10.1016/j.cct.2012.10.010
8. Ross R, Hudson R, Stotz PJ, Lam M. Effects of exercise amount and intensity on abdominal obesity and glucose tolerance in obese adults: a randomized trial. Ann Intern Med. (2015) 162:325–34. doi: 10.7326/M14-1189
9. Mitsiopoulos N, Baumgartner RN, Heymsfield SB, Lyons W, Gallagher D, Ross R. Cadaver validation of skeletal muscle measurement by magnetic resonance imaging and computerized tomography. J Appl Physiol. (1998) 85:115–22. doi: 10.1152/jappl.1998.85.1.115
10. Ross R, Rissanen J, Pedwell H, Clifford J, Shragge P. Influence of diet and exercise on skeletal muscle and visceral adipose tissue in men. J Appl Physiol. (1996) 81:2445–55. doi: 10.1152/jappl.1996.81.6.2445
11. Brennan AM, Benson M, Morningstar J, Herzig M, Robbins J, Gerszten RE, et al. Plasma metabolite profiles in response to chronic exercise. Med Sci Sports Exerc. (2018) 50:1480–6. doi: 10.1249/MSS.0000000000001594
12. Yin X, Lanza IR, Swain JM, Sarr MG, Nair KS Jensen MD. Adipocyte mitochondrial function is reduced in human obesity independent of fat cell size. J Clin Endocrinol Metab. (2014) 99:E209–16. doi: 10.1210/jc.2013-3042
13. Kumar A, Bachhawat AK. Pyroglutamic acid: throwing light on a lightly studied metabolite. Curr Sci. (2012) 102:288–97.
14. Park S, Sadanala KC, Kim EK. A metabolomic approach to understanding the metabolic link between obesity and diabetes. Mol. Cells (2015) 38:587–96. doi: 10.14348/molcells.2015.0126
15. Kim JY, Park JY, Kim OY, Ham BM, Kim HJ, Kwon DY, et al. Metabolic profiling of plasma in overweight/obese and lean men using ultra performance liquid chromatography and Q-TOF mass spectrometry (UPLC– Q-TOF MS). J Proteome Res. (2010) 9:4368–75. doi: 10.1021/pr100101p
16. Wang TJ, Larson MG, Vasan RS, Cheng S, Rhee EP, McCabe E, et al. Metabolite profiles and the risk of developing diabetes. Nat Med. (2011) 17:448–53. doi: 10.1038/nm.2307
17. Moore SC, Matthews CE, Sampson JN, Stolzenberg-Solomon RZ, Zheng W, Cai Q, et al. Human metabolic correlates of body mass index. Metabolomics (2014) 10:259–69. doi: 10.1007/s11306-013-0574-1
18. Villarreal-Pérez JZ, Villarreal-Martínez JZ, Lavalle-González FJ, del Rosario Torres-Sepúlveda M, Ruiz-Herrera C, Cerda-Flores RM, et al. Plasma and urine metabolic profiles are reflective of altered beta-oxidation in non-diabetic obese subjects and patients with type 2 diabetes mellitus. Diabetol Metab Syndr. (2014) 6:129. doi: 10.1186/1758-5996-6-129
19. Fiehn O, Garvey WT, Newman JW, Lok KH, Hoppel CL, Adams SH. Plasma metabolomic profiles reflective of glucose homeostasis in non-diabetic and type 2 diabetic obese African-American women. PloS ONE (2010) 5:e15234. doi: 10.1371/journal.pone.0015234
20. Gogna N, Krishna M, Oommen AM, Dorai K. Investigating correlations in the altered metabolic profiles of obese and diabetic subjects in a South Indian Asian population using an NMR-based metabolomic approach. Mol Biosyst. (2015) 11:595–606. doi: 10.1039/C4MB00507D
21. Suhre K, Meisinger C, Döring A, Altmaier E, Belcredi P, Gieger C, et al. Metabolic footprint of diabetes: a multiplatform metabolomics study in an epidemiological setting. PloS ONE (2010) 5:e13953. doi: 10.1371/journal.pone.0013953
22. Oberbach A, Blüher M, Wirth H, Till H, Kovacs P, Kullnick Y, et al. Combined proteomic and metabolomic profiling of serum reveals association of the complement system with obesity and identifies novel markers of body fat mass changes. J Proteome Res. (2011) 10:4769–88. doi: 10.1021/pr2005555
23. Myslicki JP, Belke DD, Shearer J. Role of O-GlcNAcylation in nutritional sensing, insulin resistance and in mediating the benefits of exercise. Appl Physiol Nutr Metab. (2014) 39:1205–13. doi: 10.1139/apnm-2014-0122
Keywords: adipose tissue, metabolomics, aerobic exercise, body composition, metabolism
Citation: Brennan AM, Tchernof A, Gerszten RE, Cowan TE and Ross R (2018) Depot-Specific Adipose Tissue Metabolite Profiles and Corresponding Changes Following Aerobic Exercise. Front. Endocrinol. 9:759. doi: 10.3389/fendo.2018.00759
Received: 01 October 2018; Accepted: 29 November 2018;
Published: 11 December 2018.
Edited by:
Tuomas Kilpeläinen, University of Copenhagen, DenmarkReviewed by:
Andrea Armani, IRCCS San Raffaele Pisana, ItalyKerry Loomes, The University of Auckland, New Zealand
Copyright © 2018 Brennan, Tchernof, Gerszten, Cowan and Ross. This is an open-access article distributed under the terms of the Creative Commons Attribution License (CC BY). The use, distribution or reproduction in other forums is permitted, provided the original author(s) and the copyright owner(s) are credited and that the original publication in this journal is cited, in accordance with accepted academic practice. No use, distribution or reproduction is permitted which does not comply with these terms.
*Correspondence: Robert Ross, rossr@queensu.ca