 Yangbo Sun
 Minxian Sun
 Buyun Liu1
 Yang Du
 Guifeng Xu
 Linda G. Snetselaar
 Wei Bao
- 1Department of Epidemiology, College of Public Health, University of Iowa, Iowa City, IA, United States
- 2Department of Endocrinology, Wuhan Central Hospital Affiliated to Tongji Medical College, Huazhong University of Science and Technology, Wuhan, China
- 3Obesity Research and Education Initiative, University of Iowa, Iowa City, IA, United States
- 4Fraternal Order of Eagles Diabetes Research Center, University of Iowa, Iowa City, IA, United States
Introduction: Several studies have suggested that vitamin B12 deficiency is more common in obese individuals. We evaluated the cross-sectional associations of serum vitamin B12 concentrations with obesity in a nationally representative sample of adults in the United States.
Methods: We included 9,075 participants aged ≥20 years in the National Health and Nutrition Examination Survey 2011–2014. Serum vitamin B12 concentrations were measured by electrochemiluminescence immunoassay. Obesity was defined as BMI ≥30 kg/m2. We used logistic regression with sample weights to estimate the odds ratios (ORs) and 95% confidence intervals (CIs).
Results: Serum vitamin B12 concentrations were lower among obese adults compared with non-obese adults. After adjustment for age, gender, race/ethnicity, socioeconomic status, dietary and lifestyle factors, use of medications that could affect the serum vitamin B12 levels, dietary supplement use and fasting time, the multivariable-adjusted ORs (95% CIs) of obesity were 1.00 (reference), 0.95 (0.79, 1.14), 0.86 (0.74, 0.99), and 0.71 (0.60, 0.84) (p for trend <0.001) for increasing quartiles of serum vitamin B12 concentrations.
Conclusions: In a large nationally representative sample of U.S. adults, higher serum vitamin B12 levels were inversely associated with obesity. Further investigation is needed to understand the underlying mechanisms.
Introduction
Obesity has become one of the most costly chronic disorders worldwide, and it largely explains the dramatic increase in the incidence and prevalence of type 2 diabetes and cardiovascular diseases over the past 20 years (1, 2). It is estimated that obesity affects 500 million adults worldwide (3). Data from the National Health and Nutrition Examination Survey 2015–2016 show that roughly 2 out of 5 U.S. adults are obese (4). Clearly, obesity is a disorder of the energy homeostasis system, and dietary compositions can theoretically affect energy balance by altering overall energy intake, energy expenditure, or both (5).
Vitamin B12 is essential for one-carbon metabolism. It is involved in cellular energy production and epigenetic modulation processes, including DNA methylation, synthesis, and repair (6). Vitamin B12 is concentrated in animal tissues, hence, vitamin B12 is found only in foods of animal origin. Foods that are high in vitamin B12 include liver, beef, lamb, chicken, eggs and dairy foods (7). Vitamin B12 deficiency is mainly due to limited dietary intake of animal foods or malabsorption of the vitamin (8). Several studies have suggested that vitamin B12 deficiency is more common in obese individuals, such as obese children and adolescents (9), obese women with polycystic ovary syndrome (10), and obese pregnant women (11–13). However, findings from previous studies on the association between serum vitamin B12 concentrations and obesity have been inconsistent (11–18). In this study, we evaluated the associations of serum vitamin B12 concentrations with obesity in a large, nationally representative sample of U.S. adults.
Materials and Methods
Study Population
The study population consisted of participants from the 2011–2012 and 2013–2014 cycles of the National Health and Nutrition Examination Survey (NHANES). Briefly, the NHANES is a large-scale, ongoing, nationally representative health survey of the non-institutionalized US population. It is conducted by the National Center for Health Statistics (NCHS) of the Centers for Disease Control and Prevention (CDC). NHANES survey data are released every 2 years; each cycle consists of ~10,000 participants (19). The data are comprised of population-based, cross-sectional surveys about diet, nutritional status, general health, disease history, and health behaviors (19). The surveys use multi-stage, probability clusters to develop a population sample that is nationally representative of the U.S. based on age, sex, and race/ethnicity. NHANES data along with documents on the survey methods and other information are publicly available on the NHANES online website. The study protocol was approved by the NCHS Research Ethics Review Board (#2011–17). All subjects gave written informed consent.
For this analysis, we initially identified 10,066 participants aged 20 years or older, with complete information on serum vitamin B12 levels and obesity status. We then excluded 876 women who had history of cancer or malignancy, 108 women who were currently pregnant and 7 women who had missing information on smoking status, resulting in 9,075 participants being finally included in our analysis.
Exposure Measurement
Serum vitamin B12 was measured in adults 20 years and older using the fully automated electrochemiluminescence immunoassay on the Roche Elecsys 170 System (Roche Diagnostics, Indianapolis, IN). Vials were stored under appropriate frozen (−20°C) conditions until they were shipped to National Center for Environmental Health for testing. The lower limit of detection (LLOD) for vitamin B12 was 30 pg/mL (i.e., 22.14 pmol/L). The coefficient of variation for this assay was lower than 4%.
Outcome Measurement
For all surveys, weight and height were measured in a mobile examination center using standardized techniques and equipment by trained health technicians according to the NHANES Anthropometry Procedures Manual (20). Body mass index (BMI) was calculated as weight in kilograms divided by the square of height in meters, and rounded to 1 decimal place. Obesity was defined as BMI ≥30 kg/m2.
Covariate Assessment
Information on age, gender, race/ethnicity, education, annual household income, family history of diabetes, smoking status, physical activity, and use of medications was collected during the interview (21). Race/ethnicity was categorized as non-Hispanic white, non-Hispanic black, Hispanic (Mexican and non-Mexican Hispanic), and other race/ethnicity. Education was grouped as less than high school, high school, and college or higher. Family income-to-poverty ratios were categorized as ≤1.30, 1.31–3.50, and >3.50 (22). Individuals who smoked <100 cigarettes in their lifetime were defined as never smokers; those who had smoked more than 100 cigarettes but did not smoke at the time of survey were considered former smokers; those who had smoked more than 100 cigarettes and smoked cigarettes at the time of survey were current smokers (23). NHANES examinations took place in the mobile examination center (MEC). During the MEC exam, a 24-h dietary recall is administered by trained dietary interviewers. Each MEC dietary interview room contains a standard set of measuring guides to help the respondent report the volume and dimensions of the food items consumed and estimate portion sizes. Beginning in 2002, all participants were asked to complete a second 24-h dietary recall (Day 2) interview, collected by telephone ~3–10 days after the MEC exam. Upon completion of the in-person interview, participants are given measuring cups, spoons, a ruler, and a food model booklet, which contain two-dimensional drawings of the various measuring guides available in the MEC, to use for reporting food amounts during the telephone interview. Dietary intake was assessed through two 24-h dietary recalls. Total energy intake, and alcohol intake, were calculated using a food composition database (24, 25). Alcohol intake was categorized as non-drink (0 g/day), moderate drinking (0.1–27.9 g/day for men and 0.1–13.9 g/day for women), and heavy drinking (≥28 g/day for men and ≥14 g/day for women) (26). Physical activity was assessed using the Global Physical Activity Questionnaire. We classified physical activity into three groups (<600, ≥600–1,199, and ≥1,200 metabolic equivalent [MET]-min/week) (27). Use of medication that could have an effect on serum vitamin B12 was defined as use of any of the following: metformin, histamine-2 blockers (H2-blockers) or proton inhibitors (PPIs) (28–30). Dietary supplement use was defined as use of any vitamins, minerals or other dietary supplements in the past month. Fasting time (in hours) was calculated from when the examinee last ate or drank anything other than water to the time of the venipuncture.
Statistical Analysis
All statistical analyses accounted for the complex, multistage, stratified, cluster-sampling design of NHANES by using sample weights, strata, and primary sampling units embedded in the NHANES data. Comparisons of characteristics across serum vitamin B12 levels were performed using analysis of variance for continuous variables and chi-square test for categorical variables.
We used multivariable logistic regression to estimate odds ratios (ORs) and 95% confidence intervals (CIs) of obesity risk according to quartiles of serum vitamin B12 concentrations. In multivariable models, we adjusted for age, gender, race/ethnicity, education, family income to poverty ratio, smoking status, alcohol intake, physical activity, dietary vitamin B12 intake, total energy intake, use of metformin, H2-blockers and PPIs, dietary supplement use, and fasting time.
We evaluated if the associations varied with gender (male and female), and race/ethnicity (white, and non-white [non-Hispanic black, Hispanic and others]). We conducted interaction tests via multiplicative interaction terms in the multivariable models. We also conducted sensitivity analyses (1) excluding participants with abnormal serum vitamin B12 levels (<200 pg/ml) (31); (2) excluding participants with fasting time <8 h. All analyses were performed using survey procedures in SAS 9.4 (SAS Institute, Cary, NC).
Results
We included 9,075 participants in this study with an average age of 45.9 years [standard error (SE) = 0.45]. The weighted prevalence of overweight was 33.5% (SE = 0.76), and the weighted prevalence of obesity was 36.6% (SE = 0.86). Individuals with higher serum vitamin B12 levels were more likely to be non-white, non-smoking, to have less alcohol intake, to have higher dietary vitamin B12 intake, to have dietary supplements, and to have a shorter fasting time (Table 1).
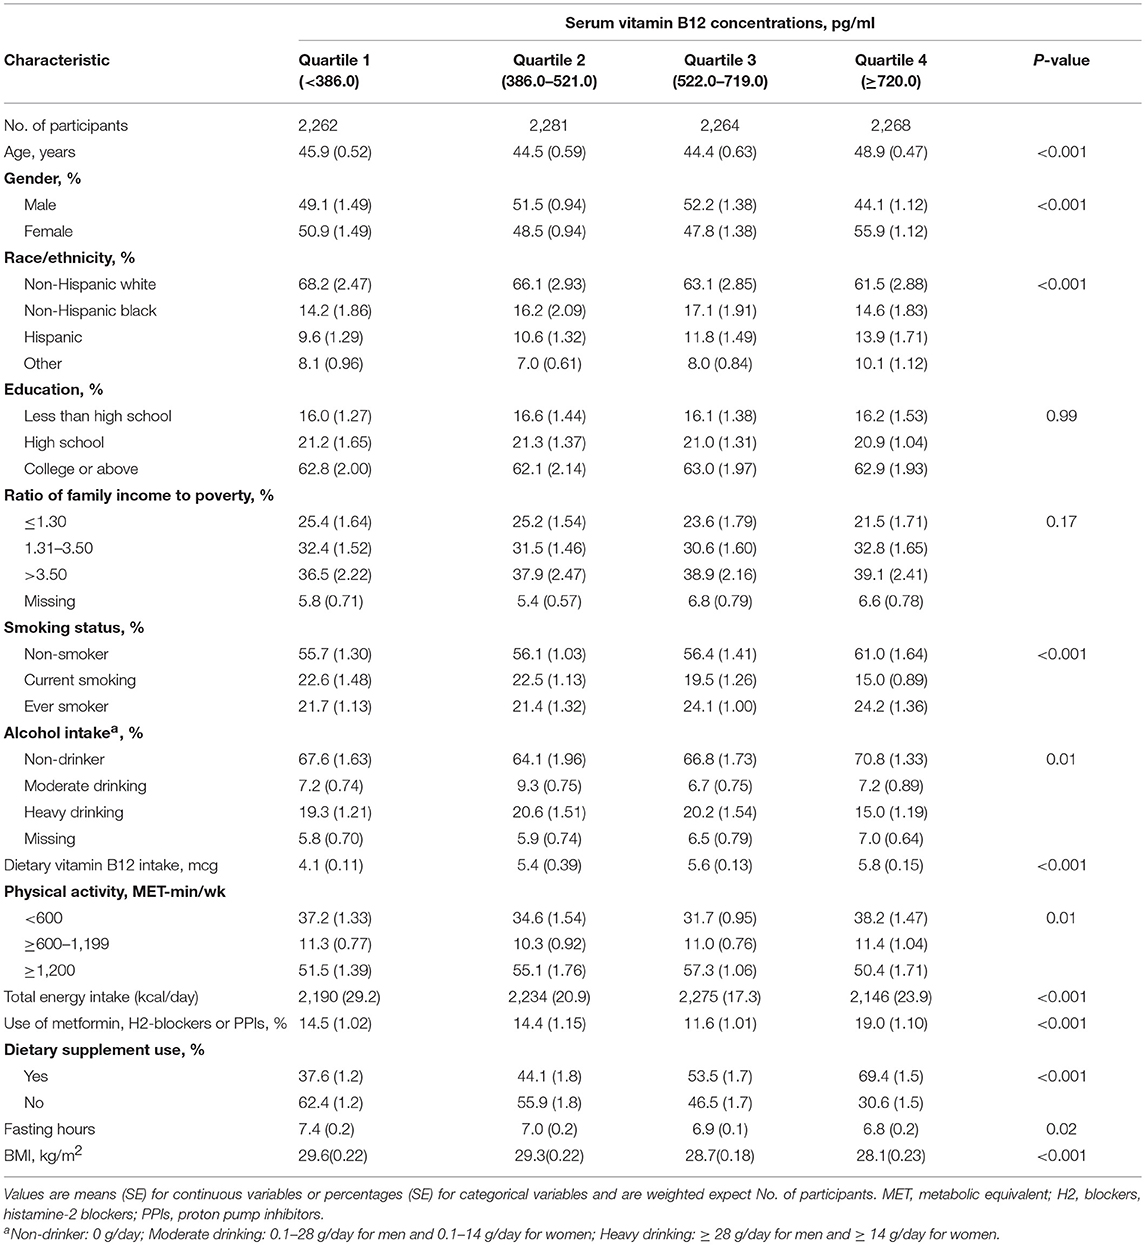
Table 1. Characteristics of the study population (n = 9,075), according to quartiles of serum vitamin B12 concentrations.
Serum vitamin B12 concentrations were lower among obese adults compared with non-obese adults. After adjustment for age, gender, race/ethnicity, socioeconomic status, dietary and lifestyle factors, use of medications that could affect the serum vitamin B12 levels, dietary supplements use and fasting time, the multivariable-adjusted ORs (95% CIs) of obesity were 1.00 (reference), 0.95 (0.79, 1.14), 0.86 (0.74, 0.99), and 0.71 (0.60, 0.84) (p for trend <0.001) for increasing quartiles of serum vitamin B12 concentrations (Table 2).

Table 2. Associations of serum vitamin B12 concentrations with obesity in 9,075 US adults.
These associations remained the same in sensitivity analysis restricting to participants with normal serum vitamin B12 levels (Table 3). Individuals with the highest serum vitamin B12 levels were less likely to be obese, with the multivariable-adjusted OR (95% CI) as 0.71 (0.60, 0.84), compared with individuals with the lowest serum vitamin B12 level. These associations appeared more profound in sensitivity analysis restricting to participants with fasting time more than 8 h (Table 4). Individuals with the highest serum vitamin B12 levels were less likely to be obese, with the multivariable-adjusted OR (95% CI) of obesity as 0.65 (0.51, 0.83), compared with individuals with the lowest serum vitamin B12 level. The association of serum vitamin B12 levels with obesity did not vary according to gender or race/ethnicity (p ≥ 0.12).
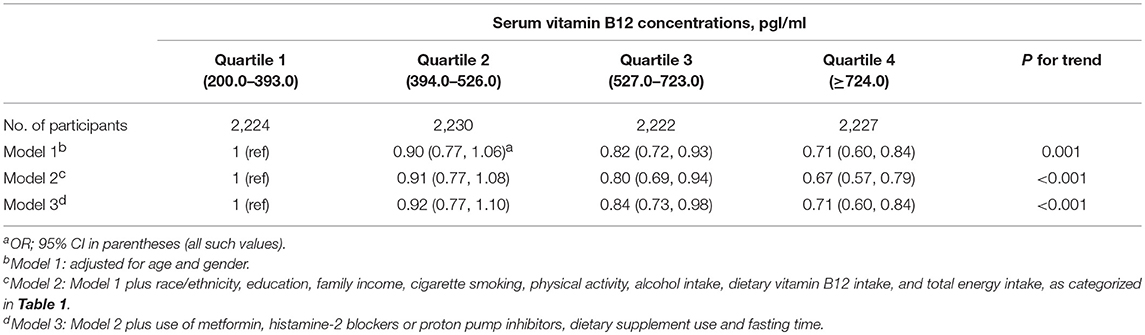
Table 3. Sensitivity analysis for the association of serum vitamin B12 concentrations with obesity in 8,903 US adults with normal vitamin B12 concentrations.
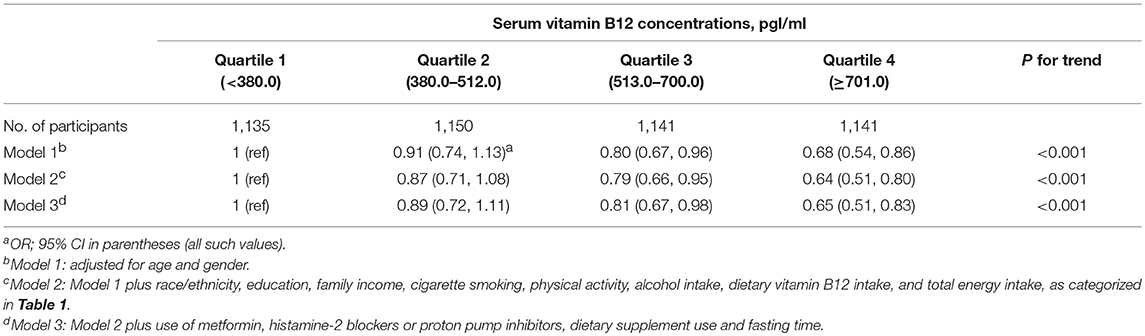
Table 4. Sensitivity analysis for the association of serum vitamin B12 concentrations with obesity in 4,567 US adults fasting more than 8 h.
Discussion
Based on nationally representative data, we found an inverse and significant association between serum vitamin B12 levels and obesity in a dose-response manner. Compared with individuals with higher vitamin B12 concentrations, those with lower vitamin B12 concentrations were more likely to be obese. These associations were independent of demographic, socioeconomic, lifestyle factors, use of medications that could have an effect on serum vitamin B12 levels, dietary supplement use and fasting time.
To our knowledge, this is the largest study to date regarding the association of serum vitamin B12 levels with obesity in the general population. Previous studies on the association of serum vitamin B12 levels with obesity in adults have yielded inconsistent findings (11–18). Our results are consistent with some previous studies where serum vitamin B12 levels were inversely associated with obesity (9, 11–13, 15, 16, 32, 33). However, some of the results from those previous studies could not be generalized to other populations because they were restricted to a specific population such as pregnant women (11–13, 32). In addition, our results were consistent with several studies among children and adolescents (16, 33).
There are several possible explanations for these associations. One possible explanation is that low serum vitamin B12 levels would trap folate as 5-methyltetrahydrofolate, prevent the generation of methionine from homocysteine, and therefore reduce protein synthesis and lean tissue deposition (10). It could also be due to the adipocyte dysfunction linked to low vitamin B12 levels through cellular inflammation (13, 34). Another possibility is that obesity could lower serum vitamin B12 levels through decreased dietary intake or absorption, increased catabolism, and sequestration in adipose tissue (12), or changes in the gut microbiota profiles which could affect the metabolism of vitamin B12 (35, 36). Interestingly, a recent study in Danish population showed that lower serum vitamin B12 concentrations were significantly associated higher BMI, but a genetic risk score related to vitamin B12 concentrations associated variants was not associated with BMI (15). The causal relation between vitamin B12 status and obesity warrants further investigation.
The major strength of this population-based study is the use of a nationally representative sample, which facilitates generalization of the findings to the general population in the United States. Other strengths include a large sample size, and a broad range of serum vitamin B12 levels. In addition, with the detailed data collected in the NHANES, we were able to control potential confounding effects from a variety of demographic, socioeconomic, lifestyle factors, use of medications that could have an effect on serum vitamin B12 levels, dietary supplement use and fasting time. Furthermore, the measurement of serum vitamin B12 is not subject to recall bias and thus could provide more reliable results for association studies than dietary estimates. This study has some limitations. First, this study was a cross-sectional survey, thus it could not presume causality. It is difficult to determine if obesity status alters vitamin B12 levels or preexisting low levels of serum vitamin B12 causes obesity, though the inverse association of serum vitamin B12 levels with obesity support the role of B vitamins in adipogenesis. Second, although we have adjusted for demographic, socioeconomic, lifestyle factors and some medications, residual confounding by unmeasured factors is still possible. Third, although we have excluded cancer from the analysis, information of other diseases that may affect vitamin B12 absorbing and body weight, such as atrophic gastritis or pernicious anemia, was not available in NHANES.
Conclusions
In a nationwide population-based study in the U.S., we showed that individuals with higher serum vitamin B12 levels were less likely to be obese. Further investigation is needed to determine the causality and the underlying mechanisms.
Ethics Statement
All subjects gave written informed consent. The study protocol was approved by the NCHS Research Ethics Review Board.
Author Contributions
YS and MS contributed to the design and analysis of the study and wrote the manuscript. WB conceived the idea, interpreted the results, and reviewed and edited the manuscript. BL, YD, SR, GX, and LS interpreted the results and reviewed and edited the manuscript. YS, MS, and WB are the guarantors of this work and, as such, had full access to all the data in the study and take responsibility for the integrity of the data and the accuracy of the data analysis.
Funding
This work was partly supported by research grants from the National Institutes of Health (R21 HD091458 and P30 ES005605) and the University of Iowa Fraternal Order of Eagles Diabetes Research Center.
Conflict of Interest Statement
The authors declare that the research was conducted in the absence of any commercial or financial relationships that could be construed as a potential conflict of interest.
Acknowledgments
We acknowledge the NHANES participants and staff for providing the data. This work has been presented as a poster presentation at the American Society for Nutrition (ASN) Scientific Sessions & Annual Meeting 2018 (37).
References
1. Eckel RH, Kahn SE, Ferrannini E, Goldfine AB, Nathan DM, Schwartz MW, et al. Obesity and type 2 diabetes: what can be unified and what needs to be individualized? J Clin Endocr Metab. (2011) 96:1654–63. doi: 10.1210/jc.2011-0585
2. Poirier P, Giles TD, Bray GA, Hong YL, Stern JS, Pi-Sunyer FX, et al. Obesity and cardiovascular disease: pathophysiology, evaluation, and effect of weight loss—An update of the 1997 American Heart Association Scientific Statement on obesity and heart disease from the Obesity Committee of the Council on Nutrition, Physical Activity, and Metabolism. Circulation. (2006) 113:898–918. doi: 10.1161/CIRCULATIONAHA.106.171016
3. Kumar KA, Lalitha A, Reddy U, Chandak GR, Sengupta S, Raghunath M. Chronic maternal vitamin B12 restriction induced changes in body composition & glucose metabolism in the Wistar rat offspring are partly correctable by rehabilitation. PLoS ONE. (2014) 9:e112991. doi: 10.1371/journal.pone.0112991
4. Hales CM, Carroll MD, Fryar CD, Ogden CL. Prevalence of obesity among adults and youth: United States, 2015–2016. NCHS Data Brief. (2017) 2017:1–8.
5. Schwartz MW, Seeley RJ, Zeltser LM, Drewnowski A, Ravussin E, Redman LM, et al. Obesity pathogenesis: an endocrine society scientific statement. Endocr Rev. (2017) 38:267–96. doi: 10.1210/er.2017-00111
6. Choi SW, Friso S. Epigenetics: a new bridge between nutrition and health. Adv Nutr. (2010) 1:8–16. doi: 10.3945/an.110.1004
7. Heyssel RM, Bozian RC, Darby WJ, Bell MC. Vitamin B12 turnover in man. The assimilation of vitamin B12 from natural foodstuff by man and estimates of minimal daily dietary requirements. Am J Clin Nutr. (1966) 18:176–84. doi: 10.1093/ajcn/18.3.176
8. O'Leary F, Samman S. Vitamin B12 in health and disease. Nutrients. (2010) 2:299–316. doi: 10.3390/nu2030299
9. Pinhas-Hamiel O, Doron-Panush N, Reichman B, Nitzan-Kaluski D, Shalitin S, Geva-Lerner L. Obese children and adolescents: a risk group for low vitamin B12 concentration. Arch Pediatr Adolesc Med. (2006) 160:933–6. doi: 10.1001/archpedi.160.9.933
10. Kaya C, Cengiz SD, Satiroglu H. Obesity and insulin resistance associated with lower plasma vitamin B12 in PCOS. Reprod Biomed Online. (2009) 19:721–6. doi: 10.1016/j.rbmo.2009.06.005
11. Knight BA, Shields BM, Brook A, Hill A, Bhat DS, Hattersley AT, et al. Lower circulating B12 is associated with higher obesity and insulin resistance during pregnancy in a non-diabetic white british population. PLoS ONE. (2015) 10:e0135268. doi: 10.1371/journal.pone.0135268
12. Krishnaveni GV, Hill JC, Veena SR, Bhat DS, Wills AK, Karat CL, et al. Low plasma vitamin B12 in pregnancy is associated with gestational ‘diabesity’ and later diabetes. Diabetologia. (2009) 52:2350–8. doi: 10.1007/s00125-009-1499-0
13. Sukumar N, Venkataraman H, Wilson S, Goljan I, Selvamoni S, Patel V, et al. Vitamin B12 status among pregnant women in the UK and its association with obesity and gestational diabetes. Nutrients. (2016) 8:E768. doi: 10.3390/nu8120768
14. Baltaci D, Kutlucan A, Turker Y, Yilmaz A, Karacam S, Deler H, et al. Association of vitamin B12 with obesity, overweight, insulin resistance and metabolic syndrome, and body fat composition; primary care-based study. Med Glas. (2013) 10:203–10.
15. Allin KH, Friedrich N, Pietzner M, Grarup N, Thuesen BH, Linneberg A, et al. Genetic determinants of serum vitamin B12 and their relation to body mass index. Eur J Epidemiol. (2017) 32:125–34. doi: 10.1007/s10654-016-0215-x
16. Abu-Samak M, Khuzaie R, Abu-Hasheesh M, Jaradeh M, Fawzi M. Relationship of vitamin B12 deficiency with overweight in Male Jordanian Youth. J Appl Sci. (2008) 8:3060–3. doi: 10.3923/jas.2008.3060.3063
17. Reitman A, Friedrich I, Ben-Amotz A, Levy Y. Low plasma antioxidants and normal plasma B vitamins and homocysteine in patients with severe obesity. Isr Med Assoc J. (2002) 4:590–3.
18. Tungtrongchitr R, Pongpaew P, Tongboonchoo C, Vudhivai N, Changbumrung S, Tungtrongchitr A, et al. Serum homocysteine, B12 and folic acid concentration in Thai overweight and obese subjects. Int J Vitam Nutr Res. (2003) 73:8–14. doi: 10.1024/0300-9831.73.1.8
19. Ahluwalia N, Dwyer J, Terry A, Moshfegh A, Johnson C. Update on NHANES dietary data: focus on collection, release, analytical considerations, and uses to inform public policy. Adv Nutr. (2016) 7:121–34. doi: 10.3945/an.115.009258
20. Centers for Disease Control and Prevention. National Health and Nutrition Examination Survey (NHANES) Anthropometry Procedures Manual (2013).
21. Centers for Disease Control and Prevention. NHANES III Reference Manuals and Reports. Hyatsville, MD: Centers for Disease Control and Prevention (1996).
22. Johnson CL, Paulose-Ram R, Ogden CL, Carroll MD, Kruszon-Moran D, Dohrmann SM, et al. National health and nutrition examination survey: analytic guidelines, 1999–2010. Vital Health Stat. (2013) 2:1–24.
23. Centers for Disease Control and Prevention and National Center for Health Statistics. Adult Tobacco Use Information_Glossary (2015).
24. Guenther PM, Casavale KO, Reedy J, Kirkpatrick SI, Hiza HA, Kuczynski KJ, et al. Update of the healthy eating index: HEI-2010. J Acad Nutr Diet. (2013) 113:569–80. doi: 10.1016/j.jand.2012.12.016
25. Guenther PM, Kirkpatrick SI, Reedy J, Krebs-Smith SM, Buckman DW, Dodd KW, et al. The healthy eating index-2010 is a valid and reliable measure of diet quality according to the 2010 dietary guidelines for Americans. J Nutr. (2014) 144:399–407. doi: 10.3945/jn.113.183079
26. US Government Printing Office. U.S. Department of Agriculture and U.S. Department of Health and Human Services, 2015–2020 Dietary Guidelines for Americans. Washington, DC: US Government Printing Office (2015).
28. Force RW, Nahata MC. Effect of histamine H2-receptor antagonists on vitamin B12 absorption. Ann Pharmacother. (1992) 26:1283–6. doi: 10.1177/106002809202601018
29. Reinstatler L, Qi YP, Williamson RS, Garn JV, Oakley GP Jr. Association of biochemical B12 deficiency with metformin therapy and vitamin B12 supplements: the National Health and Nutrition Examination Survey, 1999–2006. Diabetes Care. (2012) 35:327–33. doi: 10.2337/dc11-1582
30. Heidelbaugh JJ. Proton pump inhibitors and risk of vitamin and mineral deficiency: evidence and clinical implications. Ther Adv Drug Saf. (2013) 4:125–33. doi: 10.1177/2042098613482484
31. Pfeiffer CM, Sternberg MR, Schleicher RL, Haynes BM, Rybak ME, Pirkle JL. The CDC's Second National Report on Biochemical Indicators of Diet and Nutrition in the U.S. Population is a valuable tool for researchers and policy makers. J Nutr. (2013) 143:938S−47S. doi: 10.3945/jn.112.172858
32. Baltaci D, Kutlucan A, Ozturk S, Karabulut I, Yildirim HA, Celer A, et al. Evaluation of vitamin B12 level in middle-aged obese women with metabolic and nonmetabolic syndrome: case-control study. Turk J Med Sci. (2012) 42:802–9.
33. Gunanti IR, Marks GC, Al-Mamun A, Long KZ. Low serum vitamin B-12 and folate concentrations and low thiamin and riboflavin intakes are inversely associated with greater adiposity in Mexican American children. J Nutr. (2014) 144:2027–33. doi: 10.3945/jn.114.201202
34. Kumar KA, Lalitha A, Pavithra D, Padmavathi IJ, Ganeshan M, Rao KR, et al. Maternal dietary folate and/or vitamin B12 restrictions alter body composition (adiposity) and lipid metabolism in Wistar rat offspring. J Nutr Biochem. (2013) 24:25–31. doi: 10.1016/j.jnutbio.2012.01.004
35. Castaner O, Goday A, Park YM, Lee SH, Magkos F, Shiow STE, et al. The gut microbiome profile in obesity: a systematic review. Int J Endocrinol. (2018) 2018:4095789. doi: 10.1155/2018/4095789
36. Woodard GA, Encarnacion B, Downey JR, Peraza J, Chong K, Hernandez-Boussard T, et al. Probiotics improve outcomes after Roux-en-Y gastric bypass surgery: a prospective randomized trial. J Gastrointest Surg. (2009) 13:1198–204. doi: 10.1007/s11605-009-0891-x
37. Sun Y, Sun M, Liu B, Du Y, Rong S, Snetselaar LG, et al. Association between serum vitamin B12 concentration and obesity in a nationally representative sample of US adults: NHANES 2011–2014. In: The American Society for Nutrition (ASN) Scientific Sessions & Annual Meeting 2018. Boston, MA (2018).
Keywords: vitamin B12, nutrition, micronutrient, obesity, adults
Citation: Sun Y, Sun M, Liu B, Du Y, Rong S, Xu G, Snetselaar LG and Bao W (2019) Inverse Association Between Serum Vitamin B12 Concentration and Obesity Among Adults in the United States. Front. Endocrinol. 10:414. doi: 10.3389/fendo.2019.00414
Received: 21 November 2018; Accepted: 07 June 2019;
Published: 27 June 2019.
Edited by:
Tim S. Nawrot, University of Hasselt, BelgiumReviewed by:
Scott B. Teasdale, University of New South Wales, AustraliaValeria Guglielmi, University of Rome Tor Vergata, Italy
Copyright © 2019 Sun, Sun, Liu, Du, Rong, Xu, Snetselaar and Bao. This is an open-access article distributed under the terms of the Creative Commons Attribution License (CC BY). The use, distribution or reproduction in other forums is permitted, provided the original author(s) and the copyright owner(s) are credited and that the original publication in this journal is cited, in accordance with accepted academic practice. No use, distribution or reproduction is permitted which does not comply with these terms.
*Correspondence: Wei Bao, wei-bao@uiowa.edu
†These authors have contributed equally to this work