 Yiling Zhang1,2†
 Weiwei Duan
- 1Department of Bioinformatics, School of Biomedical Engineering and Informatics, Nanjing Medical University, Nanjing, China
- 2Jiangsu Key Lab of Cancer Biomarkers, Prevention and Treatment, Collaborative Innovation Center for Personalized Cancer Medicine, Nanjing Medical University, Nanjing, China
- 3Department of Biostatistics, Center for Global Health, School of Public Health, Nanjing Medical University, Nanjing, China
Objective: To investigate the association of dynamic weight change in adulthood with leukocyte telomere length among U.S. adults.
Methods: This study included 3,886 subjects aged 36-75 years from the National Health and Nutrition Examination Survey (NHANES) 1999-2002 cycle. Survey-weighted multivariable linear regression with adjustments for potential confounders was utilized.
Results: 3,386 individuals were finally included. People with stable obesity had a 0.130 kbp (95% CI: 0.061-0.198, P=1.97E-04) shorter leukocyte telomere length than those with stable normal weight (reference group) during the 10-year period, corresponding to approximately 8.7 years of aging. Weight gain from non-obesity to obesity shortened the leukocyte telomere length by 0.094 kbp (95% CI: 0.012-0.177, P=0.026), while normal weight to overweight or remaining overweight shortened the leukocyte telomere length by 0.074 kbp (95% CI: 0.014-0.134, P=0.016). The leukocyte telomere length has 0.003 kbp attrition on average for every 1 kg increase in weight from a mean age of 41 years to 51 years. Further stratified analysis showed that the associations generally varied across sex and race/ethnicity.
Conclusions: This study found that weight changes during a 10-year period was associated with leukocyte telomere length and supports the theory that weight gain promotes aging across adulthood.
Introduction
Telomeres are highly regulated complexes consisting of G-rich sequences and protective telomere-binding proteins, shorten with cell division in somatic cells (1, 2). It protects the end of chromosome against deterioration and fusion, playing a pivotal role in nuclear genome stabilization. Dysfunctional telomeres could elicit DNA damage checkpoint responses that trigger telomere-initiated senescence (3). The length of human telomeres generally shortens as people get older during adulthood (4, 5). For decades, a large number of experimental and observational studies have revealed that telomere length (TL) is associated with age-related diseases (6, 7), and even cancer risks (8–10). Inflammation, oxidative stress, hypoxia and unhealthy habits can cause DNA damage and telomerase dysfunction, leading to telomere attrition (11). TL in leukocytes has been well documented as a proxy for relative TL in other tissues due to the high correlations between them, and this parameter is easily measured in blood samples (2, 12). Therefore, leukocyte telomere length (LTL) could be considered as an underlying biomarker of age-related disorders.
Obesity has become an emerging epidemic over the last 50 years. In 2016, more than 1.9 billion adults were overweight (BMI ≥ 25 kg/m2) and of these, over 650 million were people with obesity (BMI ≥30 kg/m2), a number that has nearly tripled since 1975 (13). Obesity has been linked with increased risks of many chronic noninfectious diseases, such as type 2 diabetes (14), certain types of cancers (15, 16) and premature disability (17). High systemic inflammation and oxidative stress are observed in obesity (18). Thus, it has been proposed that obesity may accelerate telomere shortening. Previous epidemiologic studies did not yield completely consistent results regarding the association between obesity and LTL; that is, some confirmed this association (19, 20), while others did not (21–23). However, all of these studies measured body weight at a single time point, ignoring the changing trend in body weight over time. Weight gain across adulthood has been recognized as a risk factor for cardiovascular disease, diabetes, cancer and mortality (24–27). Thus, it is necessary to assess the long-term effect of weight change over a certain life period on LTL. To our knowledge, only two observational studies (28, 29) directly addressed the relation between weight change and LTL, but these studies were limited to samples that were obtained from women and were not representative of the entire nation.
This study aimed to investigate the relation between weight change across a 10-year period of adulthood (from a mean age of 41 years to 51 years) and LTL in a large sample that was nationally representative of the U.S. population. The patterns of weight change between two-time points were measured by BMI or absolute weight change. In addition, the analyses were stratified by sex and race/ethnicity to identify different effects within the corresponding subpopulation.
Materials and Methods
Study Population
We utilized the data from the National Health and Nutrition Examination Surveys (NHANES) 1999-2000 and 2001-2002 cycles. NHANES is a cross-sectional study designed to evaluate the health and nutritional status of U.S. adults and children and determine the prevalence of major diseases and risk factors. Data were collected by interviews, physical examination and laboratory testing, conducted by the U.S. National Center for Health Statistics (NCHS), a part of the Centers for Disease Control and Prevention (CDC). The detailed study design and data collection of NHANES are available at the online official website (30).
A total of 21,004 subjects from NHANES 1999-2002 cycle were enrolled in the present study. We incorporated 6,004 participants aged 36-75 years and sequentially excluded pregnant women (n=56), self-reported cancer patients (n=540), participants with energy intake less than 500 kcal or larger than 5,000 kcal (n=127), underweight participants (n=125) (BMI<18.5 kg/m2 at baseline or 10 years ago), individuals with missing data for BMI at baseline or self-reported weight at 10 years prior to the survey (n=599), or LTL (n=671). Finally, a total of 3,886 subjects were eligible for further analyses.
Assessment of Weight Change
The baseline height and weight of the subjects were measured during physical examination. Respondents were asked to recall their weight at 10 years before the survey. BMIs at both time points were calculated as the corresponding weight (kg) divided by the square of baseline height (m2). BMI was further categorized into normal weight (<25.0), overweight (25.0-29.9), and obesity (≥30.0) (31). Five BMI change patterns were determined by BMIs at 10 years prior to the survey (BMI10prior) and at baseline (BMIbaseline) (Figure S1):
a. Stable normal weight (BMI<25.0 at both times);
b. Normal weight to overweight or stable overweight (BMI10prior<30.0 to BMIbaseline from 25.0-29.9);
c. Weight loss (BMI10prior≥30.0 to BMIbaseline<30.0 or BMI10prior in 25.0-29.9 to BMIbaseline <25.0);
d. Non-obesity to obesity (BMI10prior<30.0 to BMIbaseline≥30.0);
e. Stable obesity (BMI≥30.0 at both time points).
We also generated new weight change patterns by classifying absolute weight change into five groups (27, 32): < -2.5 kg (weight loss), -2.5-2.5 kg (stable weight, reference group), 2.5-10.0 kg (mild weight gain), 10.0-20.0 kg (moderate weight gain) and ≥20.0 kg (severe weight gain).
Telomere Length Measurement
All participants aged 20 years and older who had blood collected for DNA purification were eligible for baseline LTL measurements. LTL assay was performed and measured by quantitative polymerase chain reaction (qPCR) at the University of California, San Francisco. LTL was measured relative to standard reference DNA (T/S ratio), which was evaluated with samples from the human diploid fibroblast cell line IMR90. Each blood sample obtained from participants in NHANESs was assayed 3 times on 3 different days in duplicate wells that were blinded to the investigators. Sample plates were assayed in 3 groups, with no two plates grouped together more than once. Eight control DNA samples set in each assay plate were used to normalize between-run variability. If more than 4 control DNA values fell 2.5 standard deviations from the mean for all assay runs, they were excluded from further analysis (< 6% of runs). Any potential outliers in every sample were excluded. The mean and standard deviation of the T/S ratio were calculated for each sample. T/S ratio was furtherly converted to kilobase pairs (kbp) through the following formula: (3274 + 2413*(T/S))/1000, provided by NHANES analytic notes (33).
Covariates
We categorize the collected data on three types of covariates in this study: demographic variables, lifestyle variables and medical comorbidities. The demographic variables included baseline age, sex, race/ethnicity, educational level, and family income-to-poverty ratio (PIR). Race/ethnicity was grouped into non-Hispanic white, non-Hispanic black, Mexican American and others, while educational level was classified as less than high school, high school or equivalent and college or above. Family PIR was calculated by dividing family income according to the poverty guidelines (34) and further divided into 3 categories (0-1.0, 1.1-3.0 and >3.0), representing low, medium, and high income, respectively. Lifestyle factors included energy intake, leisure-time physical activity, alcohol use (drinker, nondrinker) and smoking status (never, former, current smoker). Active physical activity was defined as at least 150 minutes of moderate activity, 75 minutes of vigorous activity or an equivalent combination of moderate and vigorous activity throughout the week. A drinker was defined as any participant who had at least 12 drinks of any type of alcoholic beverage in any one year. The medical comorbidities included self-reported health (excellent, good, poor), family history of diabetes (yes, no), family history of angina (yes, no), cardiovascular disease (yes, no), self-reported diabetes (yes, no) and self-reported hypertension (yes, no). If a participant was previously told that he/she had congestive heart failure, coronary heart disease, angina/angina pectoris, heart attack, or stroke, he/she was considered to have cardiovascular disease.
Statistical Analyses
All the statistical analyses in this study took the complex survey design and sampling weights into consideration to form estimates that were representative of the U.S. civilian noninstitutionalized population. Data for population characteristics are presented as the mean and standard error (SE) for numerical variables, while the frequency (n) and proportion (%) for categorical variables are presented. Rao-Scott χ2 test or weight-adjusted analysis of variance was employed to compare categorical or numerical baseline characteristics by weight change patterns, respectively. Missing values of the covariates were imputed using multivariate imputation by chained equations (MICE) to maintain statistical power. The number of imputations was set to 5, and the results of analyses on five imputed datasets were further combined. We calculated the Pearson correlation coefficient between BMIs at two-time points.
We first examined the associations between BMI categories at each time point and LTL. The normal BMI group was selected as the reference level. Afterward, analyses were mainly focused on the relation among five weight change patterns and LTL, in which maintaining a normal BMI pattern was regarded as the reference level. Survey-weighted linear regression was employed to infer the effects (coefficients) and 95% confidence interval for LTL in relation to BMI categories at two-time points and weight change patterns. Three models were built progressively to adjust for the possible confounding effects of different combinations of covariates. Model 1 included the following covariates: baseline age, sex and race/ethnicity (non-Hispanic white, non-Hispanic black, Mexican American, and others). Model 2 further included educational level (less than high school, high school or equivalent and college or above), family PIR (0-1.0, 1.1-3.0 and >3.0), physical activity (active, inactive), energy intake, alcohol use (yes, no) and smoking status (never, former, current and smoker). Model 3 included self-reported health (excellent, good, poor), family history of diabetes (yes, no), family history of angina (yes, no), cardiovascular disease (yes, no), diabetes (yes, no) and hypertension (yes, no), in addition to the covariates in Model 2. We also evaluated the effect of absolute weight change on LTL during the time interval. In this analysis, baseline height and weight at 10 years before the survey were added as possible confounders to the three models. Furthermore, we investigated the associations between weight changes and LTL stratified by sex and race/ethnicity. A sensitivity analysis was performed to test the robustness of the results by removing subjects with missing values instead of performing imputations.
All analyses were performed in R (version 3.6.3) with packages survey, mice and mitools. All hypothesis tests were two-sided, and P <0.05 was considered statistically significant.
Results
In total, 3,386 individuals were finally included in the subsequent analyses. A detailed flowchart is provided in Figure 1. The rates of missing covariates were less than 5.0%, except for PIR, which was 9.0%. The general characteristics of the total population are summarized in Table 1. The mean age (interquartile ranges) of individuals at the two-time points (i.e., baseline and 10 years before baseline) were 51 (42–59) and 41 (32–49) years, respectively. The average BMI increased from 26.3 to 28.8 during the 10 years before baseline. A high correlation (r = 0.68) was observed between BMI at the two-time points. Most people (46.1%) had normal BMIs in their early 40s and only 17.4% of the population was people with obesity. However, 10 years later, an increasing number of people were classified as overweight (37.2%) or obese (34.4%) (Table S1). During the 10-year period before the survey, 25.0% of the participants remained in the stable normal weight group, while 34.4% developed or maintained obesity. The proportions or means of each covariate were significantly different among the five weight change patterns. People who maintained obesity during the 10 years had the shortest LTL (5.67 kbp). LTL decreased steadily with age at a mean rate of 0.015 kbp (95% CI: 0.013-0.017), 0.016 kbp (95% CI: 0.013-0.018) and 0.014 kbp (95% CI: 0.011-0.018) per year for the general population, men and women, respectively (Figure S2).
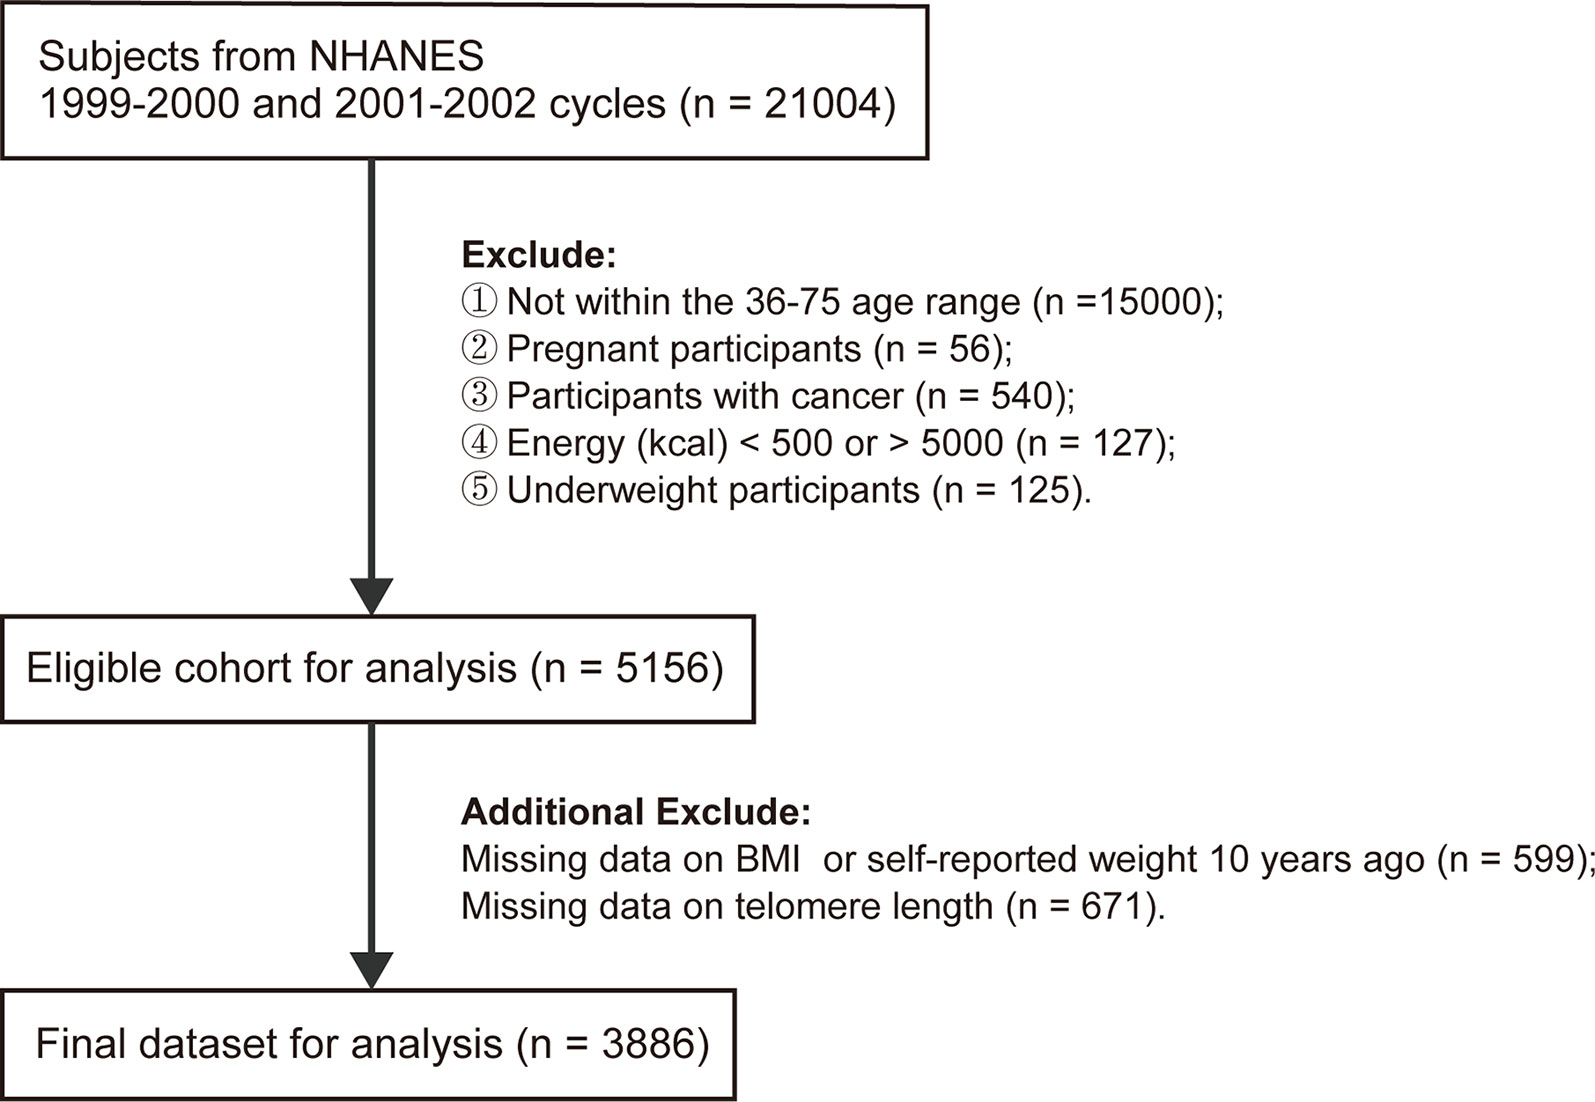
Figure 1 Flowchart of eligible subjects included in this study.
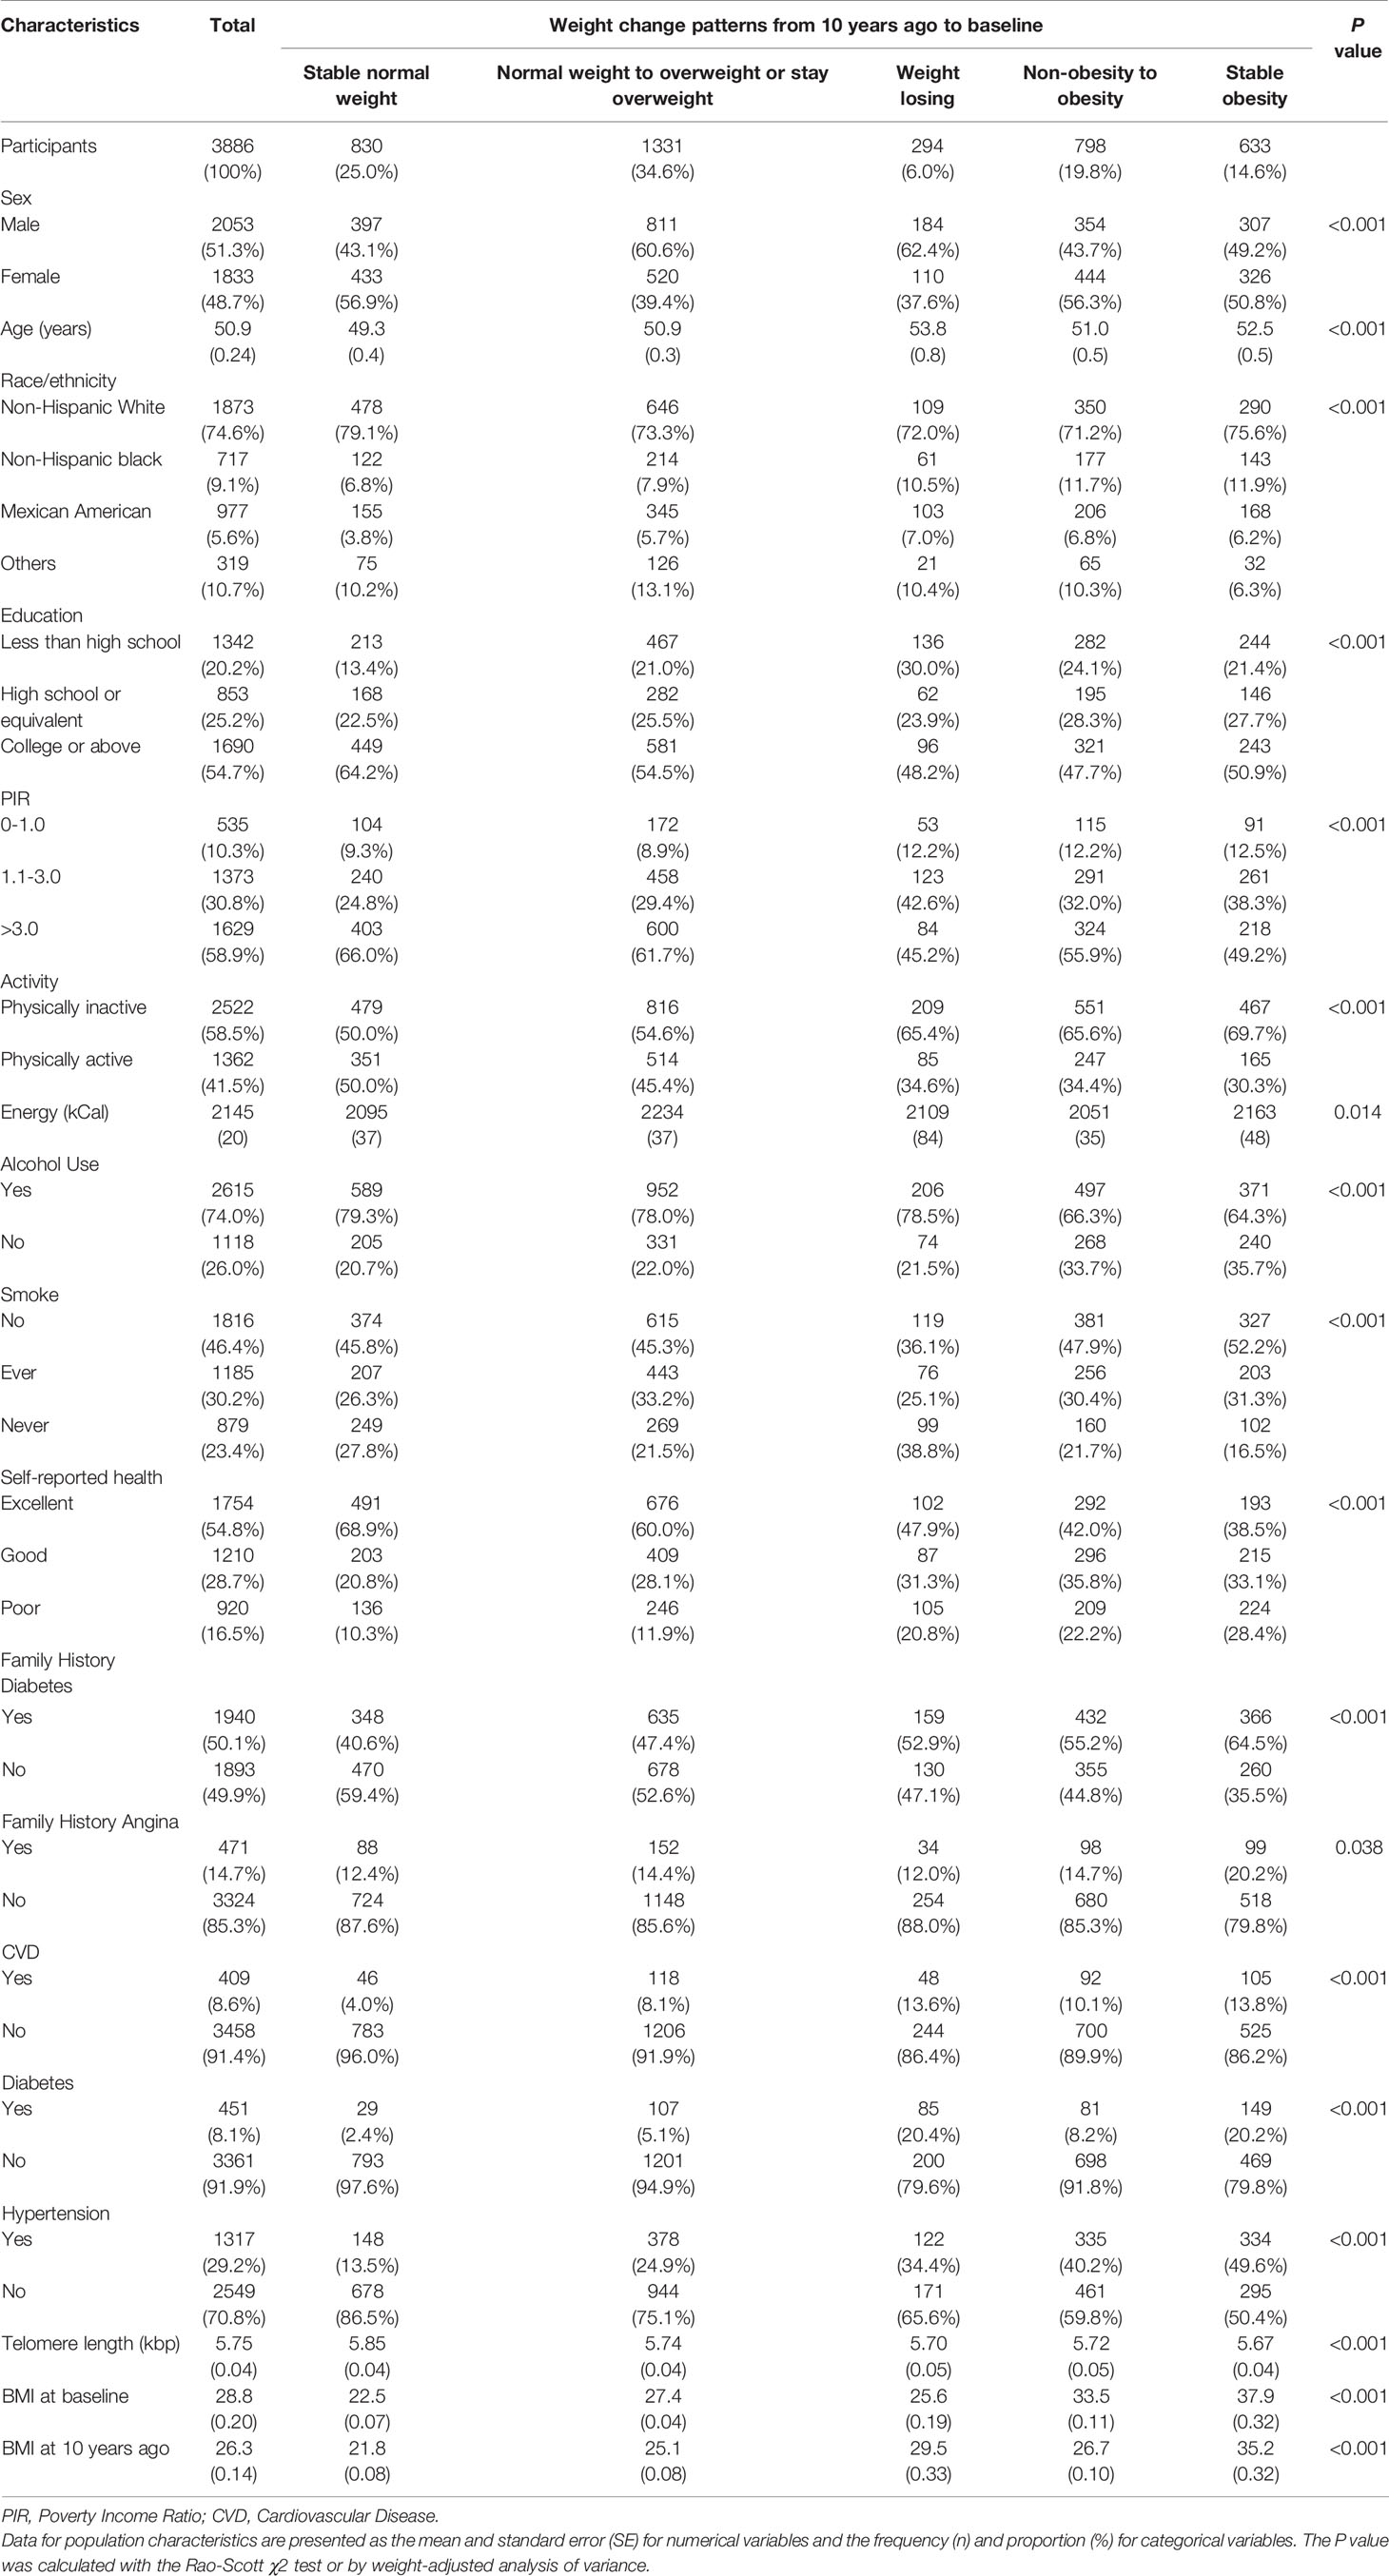
Table 1 Baseline characteristics of study participants in the NHANES 1999-2002 cycle.
Figure S3 shows the linear relation between LTL and weight status at each time point. Compared with LTL of the participants with normal weights at 10 years before baseline, on average, the LTL of people with overweight and obesity, respectively were 0.073 kbp (95% CI: 0.039-0.107, P=3.11E-05) and 0.110 kbp (95% CI: 0.063-0.156, P=3.40E-06) shorter in the fully adjusted Model (e.g., Model 3), which was consistent with the results in Models 1, 2. A similar trend in the association was observed between LTL and baseline BMI categories.
The relation between weight change patterns during the 10-year period before baseline and LTL in the three models is presented in Figure 2. Model 3 showed that people with stable obesity had a 0.130 kbp (95% CI: 0.061-0.198, P=1.97E-04) shorter LTL than those with stable normal weight (reference group). Weight gain from non-obesity to obesity shortened the LTL by 0.094 kbp (95% CI: 0.012-0.177, P=0.026), while moving from normal weight to overweight or maintaining overweight shortened the LTL by 0.074 kbp (95% CI: 0.014-0.134, P=0.016). In addition, the LTL of weight loss (i.e., from obesity to non-obesity or from overweight to normal weight) was not significantly different from that of stable normal weight (coefficient: -0.064; 95% CI: -0.164–0.035; P=0.204). Figure S4 shows that stable obesity during the period was related to a shorter LTL in both male and female populations. All of the other weight change patterns shortened the LTL compared with stable normal weight in males but did not yield a statistically significant effect on LTL in females. Compared with those with a stable normal weight, non-Hispanic white individuals, with weight change patterns except for weight loss, had significantly shorter LTLs, whereas only non-Hispanic black individuals with stable obesity had a shortened LTL, by 0.150 kbp (95% CI: 0.032-0.267, P=0.012) (Figure S5). Moreover, among Mexican Americans, there were no differences in LTLs observed among the five weight change patterns.
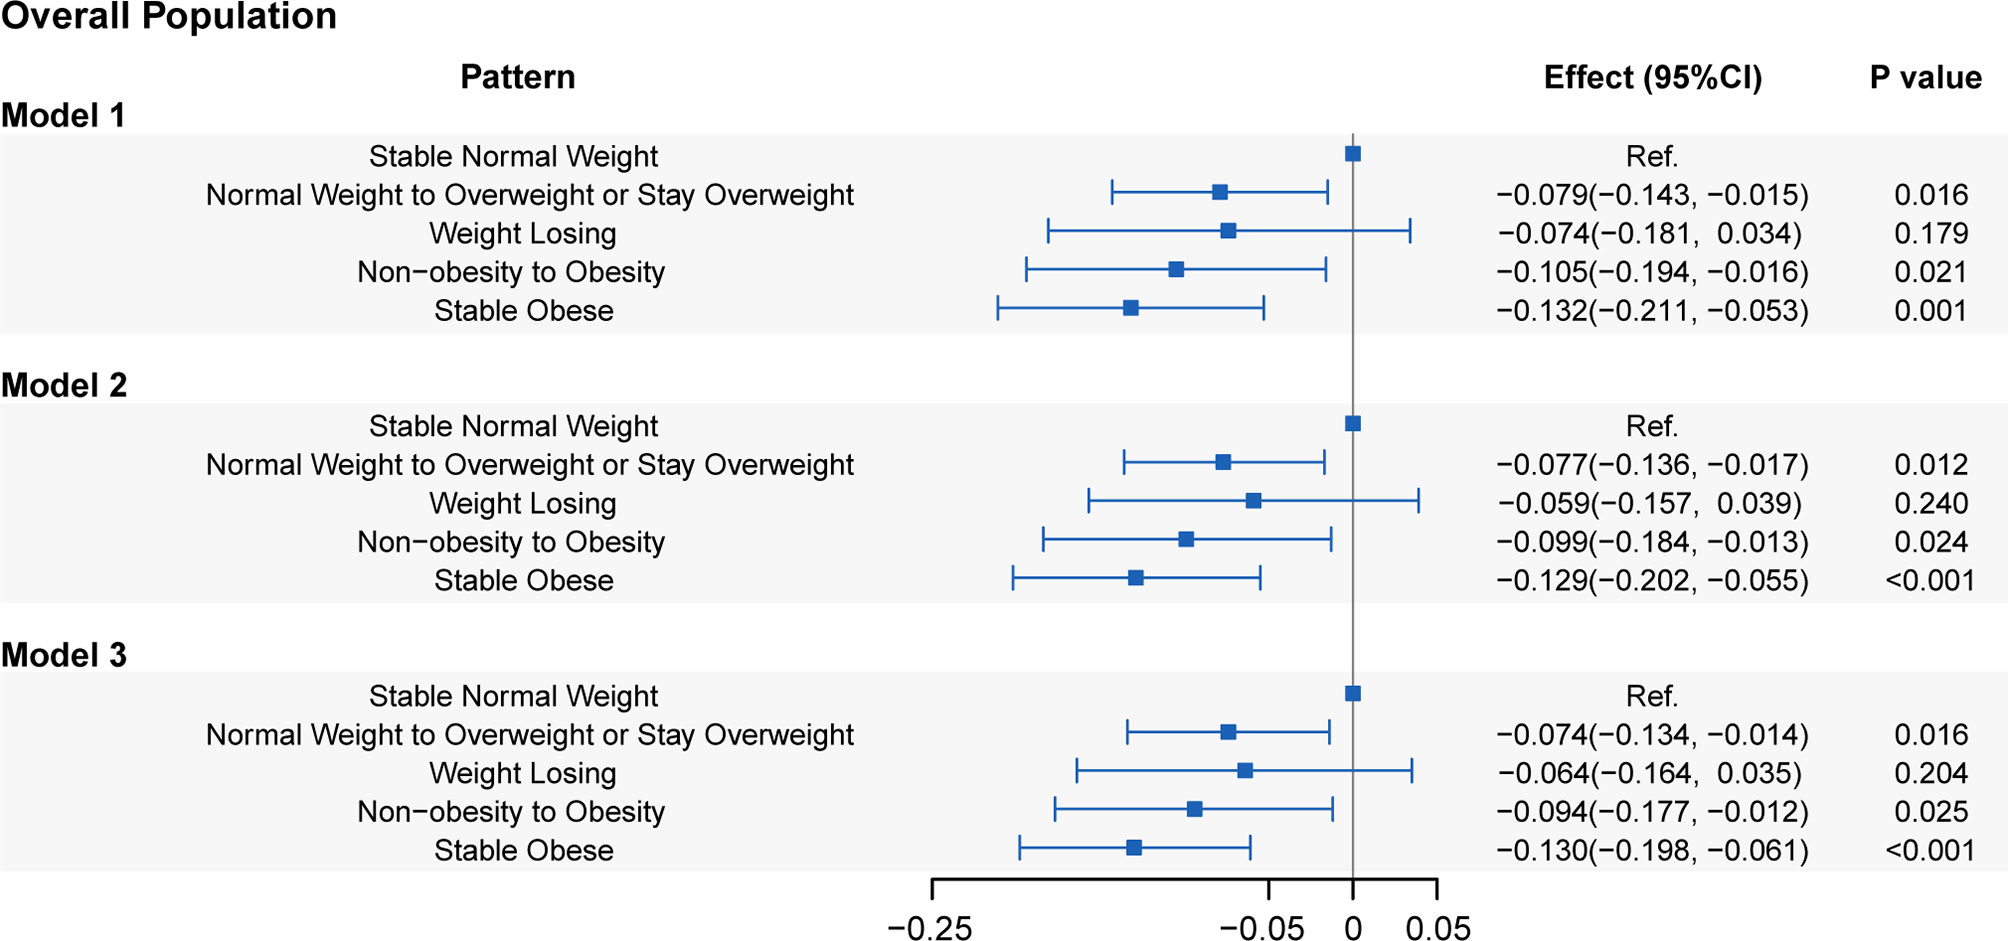
Figure 2 Associations of leucocyte telomere length with five weight change patterns. Model 1: adjusted for age, sex, and race/ethnicity. Model 2: adjusted for covariates in Model 1 plus educational level, family PIR, physical activity, energy intake, alcohol use, and smoking status. Model 3: adjusted for covariates in Model 2 plus self-reported health, family history of diabetes, family history of angina, cardiovascular disease, diabetes, and hypertension.
In the evaluation of the associations between the absolute weight change at the two-time points and LTL, a linear attenuation of the LTL with weight change was observed (coefficient: -0.003 kbp/kg; 95% CI: -0.006–0.001; P=0.014). When further classified, weight gain ≥ 20.0 kg across the 10-year period shortened the LTL by 0.105 kbp (95% CI: 0.006-0.204, P=0.038) in Model 3 compared with a weight change within 2.5 kg (Figure 3). Additionally, there was no significant difference in the LTL of weight gain of either 10.0-20.0 kg or 2.5-10 kg compared to the LTL of weight change within 2.5 kg (P=0.953 and P=0.994, respectively). Weight loss > 2.5 kg presented a sign of having a longer LTL (0.051 kbp, 95% CI: -0.048-0.150) than weight change within 2.5 kg, but the difference was not statistically significant (P=0.351).
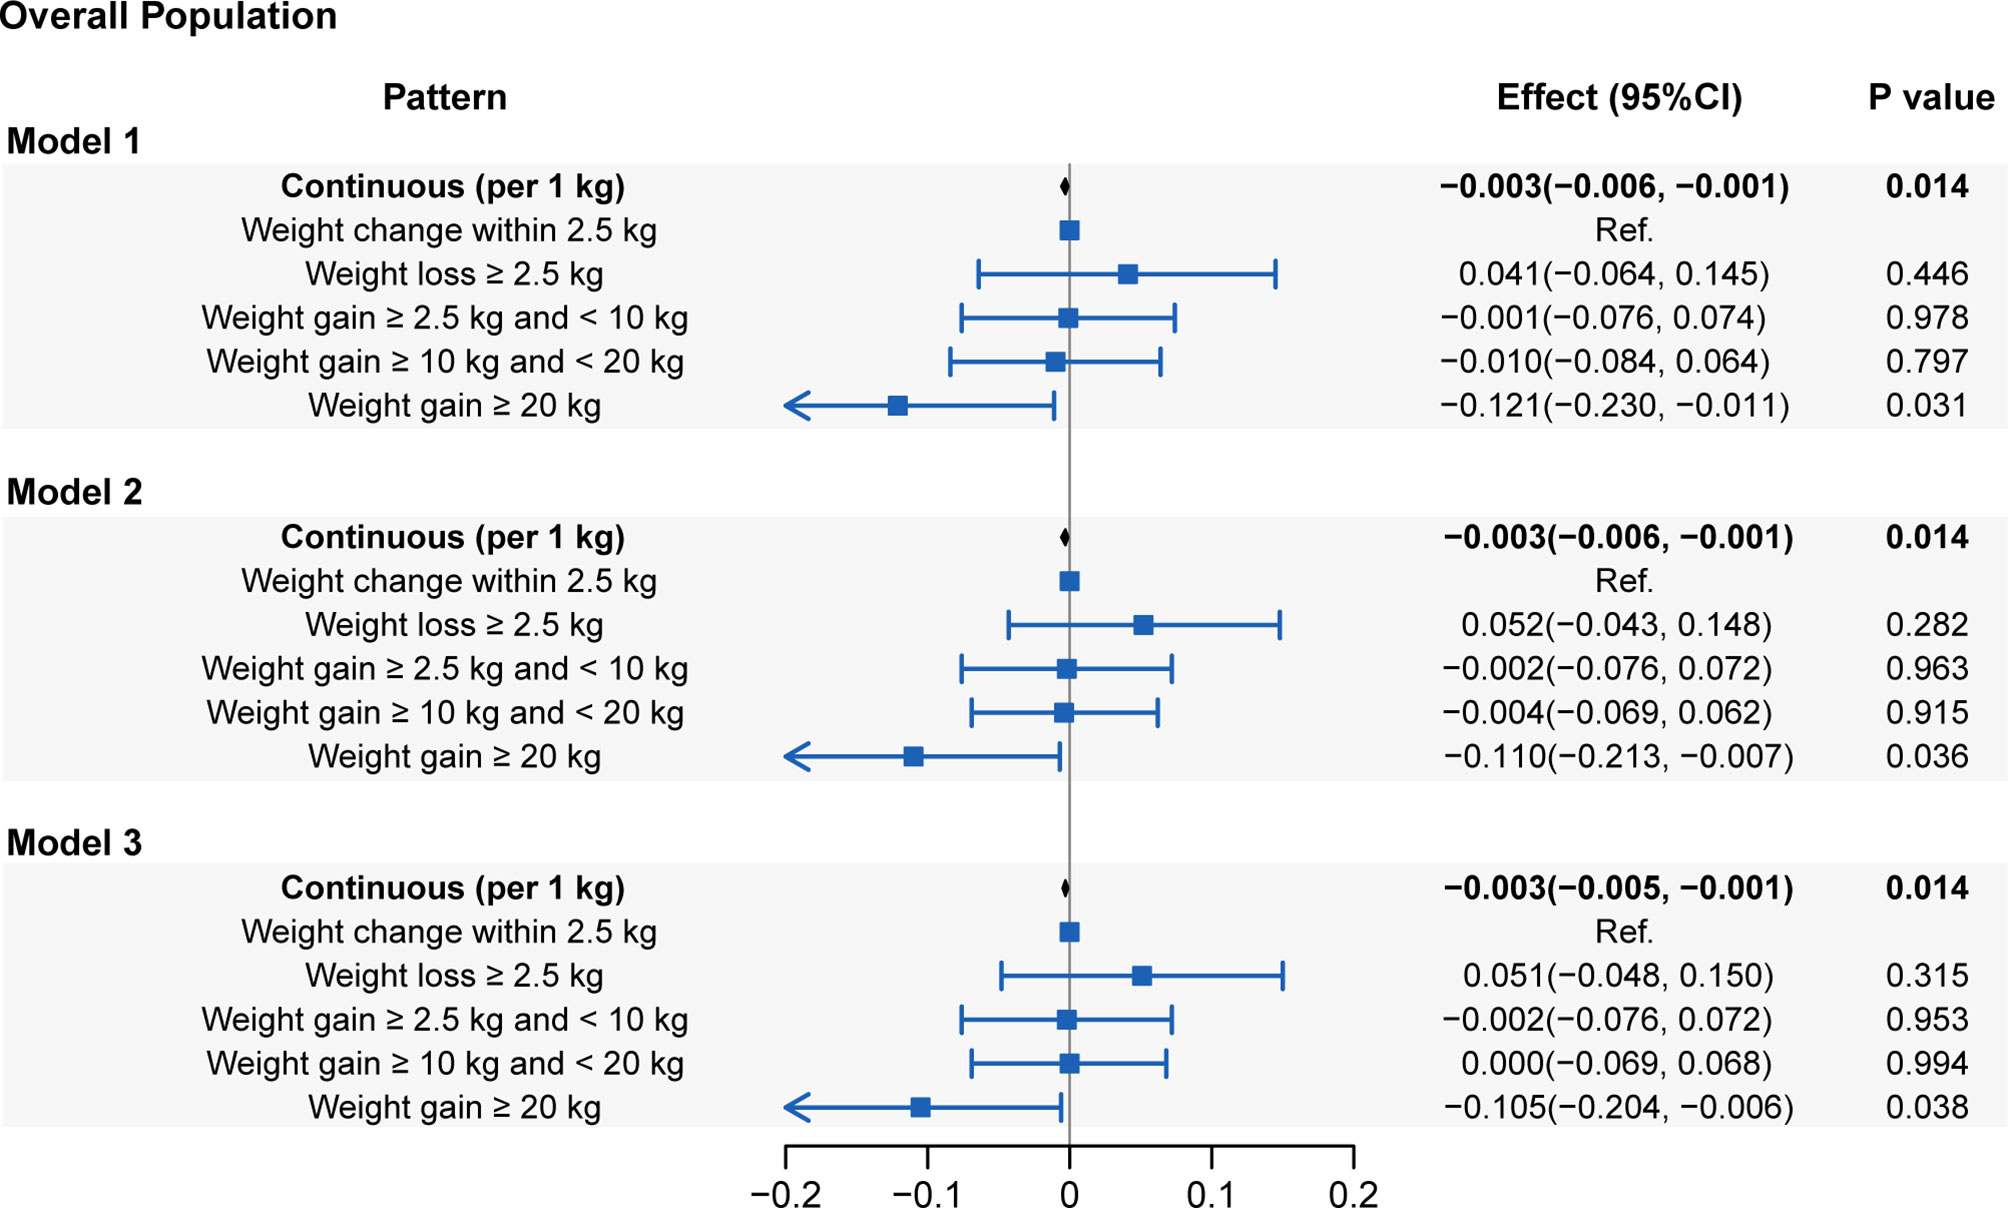
Figure 3 Associations of leucocyte telomere length with absolute weight change (presenting as continuous and categorical forms). Model 1: adjusted for age, sex and race/ethnicity. Model 2: adjusted for covariates in Model 1 plus educational level, family PIR, physical activity, energy intake, alcohol use and smoking status. Model 3: adjusted for covariates in Model 2 plus self-reported health, family history of diabetes, family history of angina, cardiovascular disease, diabetes and hypertension.
The results of and were generally consistent with those of in each analysis. Further sensitivity analysis using complete cases attenuated the associations, but the most significant results remained.
Discussion
In this large cross-sectional study of nationally representative U.S. adults, we showed the elevated long-term impact of weight status on LTL in adulthood, with the ages ranging from 36 to 75 years. People with stable normal weight during the 10 years before baseline (mean age, 51 years) had the longest LTL among the five weight change patterns, while the LTL of people with stable obesity was shortest. Further stratified analysis indicated that all associations had sex differences, but people who maintain obesity show a consistent effect. Variations across races/ethnicity were also observed. When using the absolute weight change, we found that the LTL linearly decreased with weight gain. The findings suggested the importance of keeping a normal weight to maintain a long LTL, a biomarker of aging-related disorders.
Our study suggested that the difference in LTL between individuals with a stable normal weight and those with stable obesity corresponds to approximately 8.7 years of aging, while weight gain from non-obesity to obesity corresponds to approximately 6.3 years of aging. The distinction in LTL between weight loss and having a stable normal weight was not statistically significant, suggesting that weight loss could also be beneficial for telomere protection. The result of modeling with absolute weight change indicated that an additional 1 kg of weight seemed to accelerate as much as 0.2 years of aging. Stratified analysis showed sex and race/ethnicity variations in the strength of associations. Specifically, males with overweight or obesity of the two-time points had significantly shorter LTLs than those with stable normal weight, whereas only maintaining obesity shortened the LTL in females. Among non-Hispanic whites, the influence of weight change on LTL was more remarkable than that among the other races/ethnicities. The generally identical results derived from the three models with different covariate adjustments demonstrate the robustness of our conclusions. Regarding the possible limitation of reduced sample size, the sensitivity analysis with complete cases attenuated the associations, but the most significant associations remained.
The current mainstream mechanism explaining chronic inflammation-induced telomere dysfunction is oxidative stress, an imbalance between the production of reactive oxygen species(ROS) and cellular antioxidant defenses (35). Increasing obesity may result in oxidative stress (36), and oxidative damage anywhere in the telomere can cause stochastic and irregular telomere shortening events in human fibroblasts (37). Another study demonstrated that 7,8-dihydro-8-oxoguanine (8-oxoG) is the most predominant lesion caused by oxidative stress, while the chronic formation of 8-OxoG is found to triggers telomere losses (38). A recent review of evidence from humans, mouse models and cell culture studies showed that oxidative stress is correlated with accelerated telomere shortening and dysfunction (39). The observed correlation between obesity and LTL might also be explained by the fat mass and obesity associated (FTO) gene-involved pathways, as is shown in the review (40). Genome-wide association studies have identified FTO as an obesity-associated gene (41, 42). FTO rs8050136 was found to correlate with the expression of retinoblastoma-like 2 protein (Rbl2) gene (43), which inhibits Dnmt3a,3b expression, thus influencing telomere regulation process (44).
There are a few studies investigating the relation between weight changes and LTL. Kim et al. (28) explored the association between weight gain and TL (relative T/S ratio) among 608 women aged ≥ 40 years enrolled in the NIEHS Sister Study, where weight gain was defined as the difference between current and past weight (i.e., self-reported average weight at ages 30 to 39) and further classified into five patterns. They showed that overweight (BMI ≥ 25 kg/m2) or obesity (BMI ≥30 kg/m2) at both time points had the smallest T/S ratio and a maintained normal BMI had the longest TL, which was consistent with our results. However, this study included only women and an insufficient number of samples (only 3 available participants) to address the influence of weight loss on TL. Cui et al. (29) defined weight change patterns based on recalled weight and measured weight at enrollment, reporting its inverse association with TL in a study of 1,295 women aged 55 to 70 years. Specifically, they classified BMI changes into five groups and showed that women who maintained a normal weight or reduced their weight to normal since the age of 50 had a longer TL than those with stable obesity or those who became obese. Compared with their study, our study included a nationally representative sample comprising both males and females with a wide age range and presents sex and race/ethnicity differences in the associations. In addition, we present the stability of our results by considering the different combinations of covariates and sensitivity analysis.
Several limitations in this study should be addressed. Firstly, we employed BMI as the only measurement of adiposity because the data collected from NHANES lacked other adiposity-related markers, such as body fat and waist circumference, at 10 years before baseline; therefore, our conclusions, derived from BMI, are incomplete. Secondly, data on many covariates (e.g., physical activity) were collected only at baseline, thus ignoring changes over the 10-year interval, which makes it difficult to control for time-varying confounders. Moreover, it is difficult to make causal inferences in this cross-sectional study and self-reported weight data we used in this study inevitably carries the risk of recall bias.
The development of telomere biology has opened up a new path toward understanding the mechanisms related to aging, obesity and oxidative stress at the molecular level. Our study explored the association between weight change patterns and LTL based on a large sample size, which further supports the theory that gaining weight promotes aging. LTL can be used as a biomarker for obesity treatment, warning people to intervene as soon as possible to reduce the risk of obesity-related diseases and maintain a normal weight.
Data Availability Statement
Publicly available datasets were analyzed in this study. This data can be found here: https://wwwn.cdc.gov/nchs/nhanes/Default.aspx.
Ethics Statement
The studies involving human participants were reviewed and approved by the NCHS Research Ethics Review Board (#98-12). The patients/participants provided their written informed consent to participate in this study.
Author Contributions
YZ and WD conceptualized the study. YZ, ZX, YY, SC, and WD analyzed and interpreted the data, and drafted the article. SL provided valuable suggestions for study design and data analysis. WD supervised the study. All authors contributed to the article and approved the submitted version.
Funding
This research was supported by grants from National Natural Science Foundation of China (Grant No. 81903409), General Project of Science and Technology Development Fund of Nanjing Medical University (NMUB2018020), Development Program of Medical Big Data Analysis Software of Nanjing Medical University (Grant No. 2019KF0106).
Conflict of Interest
The authors declare that the research was conducted in the absence of any commercial or financial relationships that could be construed as a potential conflict of interest.
Publisher’s Note
All claims expressed in this article are solely those of the authors and do not necessarily represent those of their affiliated organizations, or those of the publisher, the editors and the reviewers. Any product that may be evaluated in this article, or claim that may be made by its manufacturer, is not guaranteed or endorsed by the publisher.
Supplementary Material
The Supplementary Material for this article can be found online at: https://www.frontiersin.org/articles/10.3389/fendo.2021.650988/full#supplementary-material
References
1. Blackburn EH. Switching and Signaling at the Telomere. Cell (2001) 106:661–73. doi: 10.1016/s0092-8674(01)00492-5
2. Demanelis K, Jasmine F, Chen LS, Chernoff M, Tong L, Delgado D, et al. Determinants of Telomere Length Across Human Tissues. Science (80-) (2020) 369:eaaz6876. doi: 10.1126/SCIENCE.AAZ6876
3. Fagagna F d’Adda di, Reaper PM, Clay-Farrace L, Fiegler H, Carr P, von Zglinicki T, et al. A DNA Damage Checkpoint Response in Telomere-Initiated Senescence. Nature (2003) 426:194–8. doi: 10.1038/nature02118
4. Cherif H, Tarry JL, Ozanne SE, Hales CN, Harley CB, Futcher AB, et al. Ageing and Telomeres: A Study Into Organ- and Gender-Specific Telomere Shortening. Nature (2007) 345:114–23. doi: 10.1038/345458a0
5. Aubert G, Lansdorp PM. Telomeres and Aging. Physiol Rev (2008) 88:557–79. doi: 10.1152/physrev.00026.2007
6. Zhan Y, Song C, Karlsson R, Tillander A, Reynolds CA, Pedersen NL, et al. Telomere Length Shortening and Alzheimer Disease-A Mendelian Randomization Study. JAMA Neurol (2015) 72:1202–3. doi: 10.1001/jamaneurol.2015.1513
7. Xu C, Wang Z, Su X, Da M, Yang Z, Duan W, et al. Association Between Leucocyte Telomere Length and Cardiovascular Disease in a Large General Population in the United States. Sci Rep (2020) 10:80. doi: 10.1038/s41598-019-57050-1
8. Weischer M, Nordestgaard BG, Cawthon RM, Freiberg JJ, Tybjærg-Hansen A, Bojesen SE. Short Telomere Length, Cancer Survival, and Cancer Risk in 47102 Individuals. J Natl Cancer Inst (2013) 105:459–68. doi: 10.1093/jnci/djt016
9. Li C, Stoma S, Lotta LA, Warner S, Albrecht E, Allione A, et al. Genome-Wide Association Analysis in Humans Links Nucleotide Metabolism to Leukocyte Telomere Length. Am J Hum Genet (2020) 106:389–404. doi: 10.1016/j.ajhg.2020.02.006
10. Li J, An C, Zheng H, Lei T, Zhang N, Zheng Y, et al. Leukocyte Telomere Length and Risk of Papillary Thyroid Carcinoma. J Clin Endocrinol Metab (2019) 104:2712–8. doi: 10.1210/jc.2018-02471
11. Welendorf C, Nicoletti CF, Pinhel MA de S, Noronha NY, de Paula BMF, Nonino CB. Obesity, Weight Loss, and Its Influence on Telomere Length: New Insights for Personalized Nutrition. Nutrition (2019) 66:115–21. doi: 10.1016/j.nut.2019.05.002
12. Youngren K, Jeanclos E, Aviv H, Kimura M, Stock J, Hanna M, et al. Synchrony in Telomere Length of the Human Fetus. Hum Genet (1998) 102:640–3. doi: 10.1007/s004390050755
13. WHO. Global Health Observatory (GHO) Data: Overweight and Obesity. Available at: https://www.who.int/gho/ncd/risk_factors/overweight_obesity/obesity_adults/en/.
14. Kahn SE, Hull RL, Utzschneider KM. Mechanisms Linking Obesity to Insulin Resistance and Type 2 Diabetes. Nature (2006) 444:840–6. doi: 10.1038/nature05482
15. Calle EE, Kaaks R. Overweight, Obesity and Cancer: Epidemiological Evidence and Proposed Mechanisms. Nat Rev Cancer (2004) 4:579–91. doi: 10.1038/nrc1408
16. Iyengar NM, Gucalp A, Dannenberg AJ, Hudis CA. Obesity and Cancer Mechanisms: Tumor Microenvironment and Inflammation. J Clin Oncol (2016) 34:4270–6. doi: 10.1200/JCO.2016.67.4283
17. Blüher M. Obesity: Global Epidemiology and Pathogenesis. Nat Rev Endocrinol (2019) 15:288–98. doi: 10.1038/s41574-019-0176-8
18. Fernández-Sánchez A, Madrigal-Santillán E, Bautista M, Esquivel-Soto J, Morales-González Á, Esquivel-Chirino C, et al. Inflammation, Oxidative Stress, and Obesity. Int J Mol Sci (2011) 12:3117–32. doi: 10.3390/ijms12053117
19. Valdes AM, Andrew T, Gardner JP, Kimura M, Oelsner E, Cherkas LF, et al. Obesity, Cigarette Smoking, and Telomere Length in Women. Lancet (2005) 366:662–4. doi: 10.1016/S0140-6736(05)66630-5
20. Nordfjäll K, Eliasson M, Stegmayr B, Melander O, Nilsson P, Roos G. Telomere Length Is Associated With Obesity Parameters But With a Gender Difference. Obesity (2008) 16:2682–9. doi: 10.1038/oby.2008.413
21. Diaz VA, Mainous AG, Player MS, Everett CJ. Telomere Length and Adiposity in a Racially Diverse Sample. Int J Obes (2010) 34:261–5. doi: 10.1038/ijo.2009.198
22. Al-Attas OS, Al-Daghri NM, Alokail MS, Alfadda A, Bamakhramah A, Sabico S, et al. Adiposity and Insulin Resistance Correlate With Telomere Length in Middle-Aged Arabs: The Influence of Circulating Adiponectin. Eur J Endocrinol (2010) 163:601–7. doi: 10.1530/EJE-10-0241
23. Bekaert S, De Meyer T, Rietzschel ER, De Buyzere ML, De Bacquer D, Langlois M, et al. Telomere Length and Cardiovascular Risk Factors in a Middle-Aged Population Free of Overt Cardiovascular Disease. Aging Cell (2007) 6:639–47. doi: 10.1111/j.1474-9726.2007.00321.x
24. Norman JE, Bild D, Lewis CE, Liu K, West DS. The Impact of Weight Change on Cardiovascular Disease Risk Factors in Young Black and White Adults: The CARDIA Study. Int J Obes Relat Metab Disord (2003) 27:369–76. doi: 10.1038/sj.ijo.0802243
25. Wannamethee SG, Shaper AG, Walker M. Overweight and Obesity and Weight Change in Middle Aged Men: Impact on Cardiovascular Disease and Diabetes. J Epidemiol Community Health (2005) 59:134–9. doi: 10.1136/jech.2003.015651
26. Teras LR, Patel AV, Wang M, Yaun S-S, Anderson K, Brathwaite R, et al. Sustained Weight Loss and Risk of Breast Cancer in Women 50 Years and Older: A Pooled Analysis of Prospective Data. J Natl Cancer Inst (2020) 112:929–37. doi: 10.1093/jnci/djz226
27. Chen C, Ye Y, Zhang Y, Pan XF, Pan A. Weight Change Across Adulthood in Relation to All Cause and Cause Specific Mortality: Prospective Cohort Study. BMJ Br Med J (2019) 367:l5584. doi: 10.1136/bmj.l5584
28. Kim S, Parks CG, DeRoo LA, Chen H, Taylor JA, Cawthon RM, et al. Obesity and Weight Gain in Adulthood and Telomere Length. Cancer Epidemiol Biomarkers Prev (2009) 18:816–20. doi: 10.1158/1055-9965.EPI-08-0935
29. Cui Y, Gao Y-T, Cai Q, Qu S, Cai H, Li H-L, et al. Associations of Leukocyte Telomere Length With Body Anthropometric Indices and Weight Change in Chinese Women. Obesity (2013) 21:2582–8. doi: 10.1002/oby.20321
30. CDC. National Center for Health Statistics. Available at: https://wwwn.cdc.gov/nchs/nhanes/Default.aspx.
31. CDC. About Adult BMI. Available at: https://www.cdc.gov/healthyweight/assessing/bmi/adult_bmi/index.html.
32. Zheng Y, Manson JE, Yuan C, Liang MH, Grodstein F, Stampfer MJ, et al. Associations of Weight Gain From Early to Middle Adulthood With Major Health Outcomes Later in Life. JAMA (2017) 318:255–69. doi: 10.1001/jama.2017.7092
33. National Health and Nutrition Examination Survey 1999-2000 Data Documentation, Codebook, and Frequencies. Available at: https://wwwn.cdc.gov/Nchs/Nhanes/1999-2000/TELO_A.htm.
34. United States Census Bureau. Poverty Income Ratio. Available at: http://www.census.gov/hhes/www/poverty/about/overview/measure.html.
35. Coluzzi E, Colamartino M, Cozzi R, Leone S, Meneghini C, O’Callaghan N, et al. Oxidative Stress Induces Persistent Telomeric DNA Damage Responsible for Nuclear Morphology Change in Mammalian Cells. PloS One (2014) 9:e110963. doi: 10.1371/journal.pone.0110963
36. Furukawa S, Fujita T, Shimabukuro M, Iwaki M, Yamada Y, Nakajima Y, et al. Increased Oxidative Stress in Obesity and its Impact on Metabolic Syndrome. J Clin Invest (2004) 114:1752–61. doi: 10.1172/JCI21625
37. von Zglinicki T, Pilger R, Sitte N. Accumulation of Single-Strand Breaks is the Major Cause of Telomere Shortening in Human Fibroblasts. Free Radic Biol Med (2000) 28:64–74. doi: 10.1016/s0891-5849(99)00207-5
38. Fouquerel E, Barnes RP, Uttam S, Watkins SC, Bruchez MP, Opresko PL. Targeted and Persistent 8-Oxoguanine Base Damage at Telomeres Promotes Telomere Loss and Crisis. Mol Cell (2019) 75:117–30.e6. doi: 10.1016/j.molcel.2019.04.024
39. Barnes RP, Fouquerel E, Opresko PL. The Impact of Oxidative DNA Damage and Stress on Telomere Homeostasis. Mech Ageing Dev (2019) 177:37–45. doi: 10.1016/j.mad.2018.03.013
40. Zhou Y, Hambly BD, Mclachlan CS. FTO Associations With Obesity and Telomere Length. J BioMed Sci (2017) 24:65. doi: 10.1186/s12929-017-0372-6
41. Dina C, Meyre D, Gallina S, Durand E, Körner A, Jacobson P, et al. Variation in FTO Contributes to Childhood Obesity and Severe Adult Obesity. Nat Genet (2007) 39:724–6. doi: 10.1038/ng2048
42. Frayling TM, Timpson NJ, Weedon MN, Zeggini E, Freathy RM, Lindgren CM, et al. A Common Variant in the FTO Gene Is Associated With Body Mass Index and Predisposes to Childhood and Adult Obesity. Science (2007) 316:889–94. doi: 10.1126/science.1141634
43. Jowett JBM, Curran JE, Johnson MP, Carless MA, Göring HHH, Dyer TD, et al. Genetic Variation at the FTO Locus Influences RBL2 Gene Expression. Diabetes (2010) 59:726–32. doi: 10.2337/db09-1277
Keywords: aging, telomere length, weight change, obesity, NHANES
Citation: Zhang Y, Xu Z, Yang Y, Cao S, Lyu S and Duan W (2021) Association Between Weight Change and Leukocyte Telomere Length in U.S. Adults. Front. Endocrinol. 12:650988. doi: 10.3389/fendo.2021.650988
Received: 08 January 2021; Accepted: 02 July 2021;
Published: 28 July 2021.
Edited by:
Marc R. Blackman, Washington DC VA Medical Center, United StatesReviewed by:
A. Gaye, National Institutes of Health (NIH), United StatesPu Zhening, Wuxi People’s Hospital, China
Copyright © 2021 Zhang, Xu, Yang, Cao, Lyu and Duan. This is an open-access article distributed under the terms of the Creative Commons Attribution License (CC BY). The use, distribution or reproduction in other forums is permitted, provided the original author(s) and the copyright owner(s) are credited and that the original publication in this journal is cited, in accordance with accepted academic practice. No use, distribution or reproduction is permitted which does not comply with these terms.
*Correspondence: Weiwei Duan, passion@njmu.edu.cn
†These authors have contributed equally to this work