 Caitlin S. Mitchell1
 Shirmila D. Premaratna2
 Garth Bennett3Maria Lambrou3Lauren A. Stahl3Markandeya Jois4
 Elizabeth Barber5
 Christopher P. Antoniadis1Stephen C. Woods6
 David Cameron-Smith7Richard S. Weisinger3
 Denovan P. Begg1*
- 1School of Psychology, UNSW Sydney, Sydney, NSW, Australia
- 2Department of Animal, Plant and Soil Sciences, School of Life Sciences, La Trobe University, Melbourne, VIC, Australia
- 3School of Psychological Science, La Trobe University, Melbourne, VIC, Australia
- 4Department of Physiology, Anatomy and Microbiology, School of Life Sciences, La Trobe University, Melbourne, VIC, Australia
- 5Department of Nutrition, Dietetics and Food, Faculty of Medicine, Nursing and Health Sciences, Monash University, Melbourne, VIC, Australia
- 6Department of Psychiatry and Behavioral Neuroscience, University of Cincinnati, Cincinnati, OH, United States
- 7Singapore Institute for Clinical Sciences, Agency for Science, Technology and Research, Singapore, Singapore
Obesity is a growing health problem worldwide. The renin-angiotensin system (RAS) is present in adipose tissue, and evidence suggests that it is involved in both diet-induced obesity and the inflammation associated with obesity. The present experiments determined the effect of (1) different angiotensin-converting enzyme (ACE) inhibitors (captopril, perindopril, enalapril) and angiotensin receptor blockers (ARBs: telmisartan, losartan) on adiposity of mice fed a high-fat diet for 28 days (2); acute treatment with the ACE-inhibitor captopril on gene expression of inflammatory markers in mice fed a high-fat diet (HFD); and (3) short-term (2 days) and chronic (28 days) treatment of ACE-inhibition on energy expenditure (EE) and energy balance in mice fed HFD ad libitum (AL), as well as receiving HFD limited to the amount of calories eaten by controls (pair-fed (PF) group). Body weight, food intake, adiposity and plasma leptin were lower in ACE inhibitor or ARB-treated groups over 28 days compared with HFD untreated mice. Short-term treatment with captopril led to increased EE relative to the level in the PF group. After 28 days, EE was lower in both captopril-treated and PF mice compared with AL, but the effect was greater in the captopril-treated group. Adiponectin was elevated in captopril-treated mice, but not in PF mice, after both 2 and 28 days. Additionally, acute RAS blockade in HFD-fed mice reduced mRNA expression for MCP-1, IL-6, TLR4, and leptin in adipose tissue relative to values in untreated groups. These data demonstrate that ACE inhibition and angiotensin receptor blockade reduce food intake to produce weight loss and suggest that the anti-inflammatory effects of ACE inhibition may be independent of weight loss.
Introduction
The renin-angiotensin system (RAS) and its principal active component, angiotensin (ANG) II, have an important role in maintaining energy balance. Interest in the interactions of the RAS with energy balance arose from the identification of some components of the classical RAS within adipose tissue (1–3), and more recent in vitro data have identified a fully functional RAS within adipose tissue (4–7). Animals lacking components of the RAS have significant disruptions to energy homeostasis (8). For example, mice lacking genes for renin, angiotensinogen (AGT), angiotensin-converting enzyme (ACE), or angiotensin receptors (AT1) each have reduced body weight and resistance to high-fat diet (HFD)-induced weight gain (9–13). Analogously, compounds that inhibit RAS activity also reduce body weight. For example, ACE inhibition decreases body weight in rats (14–20), mice (21) and humans (22), while AT1 receptor antagonists reduce body weight, or limit weight gain, in rats (23–26), mice (27, 28) and humans (29).
Obesity is associated with increased inflammation in adipose tissue, with monocyte chemoattractant protein 1 (MCP-1), IL-6, toll-like receptor 4 (TLR4), and TNFα elevated in adipose tissue of obese relative to lean individuals (30). Obesity is also accompanied by changes in the circulating abundances of key adipokines involved in appetite regulation, including suppressed adiponectin and increased leptin concentrations (31). Adipose tissue is also important in the regulation of systemic RAS with increasing evidence that ANG II is an important contributing factor intersecting to heighten the inflammatory risks posed by obesity and cardio-metabolic disease (32–34). Although chronic treatment with an ACE inhibitor significantly reduces expression of inflammatory markers within adipose tissue (35), and has been shown clinically to alter adiponectin and leptin concentrations in hypertensive individuals (34), it is not clear whether these changes are mediated by ACE inhibition directly, or are secondary effect to the loss of body weight.
There are numerous ACE inhibitors and angiotensin receptor blockers (ARB), which have subtle differences in their mechanisms of action. For instance, enalapril (ENL) and perindopril (PER) are pro-drugs, which require liver metabolism for conversion into an active compound (36). ENL and PER are also longer acting that other ACE inhibitors, such as captopril (CAP) (37). Similarly, the ARB telmisartan (TEL) has a longer half-life and a higher affinity for the AT1 receptor compared to losartan (LOR) (38). Moreover, some ACE inhibitors cross the blood-brain barrier and act centrally, where they can inhibit ACE in the brain to affect central regulation of blood pressure (39). CAP and PER have modest, short-acting effects within the brain while ENL cannot access the central nervous system (39, 40). Interestingly, the pharmacokinetic and pharmacodynamic differences between these drugs do not alter their clinical efficacy, as all drugs act to either inhibit ACE or block the actions of ANG II at the receptor (36, 41).
The aim of the current experiments was to investigate the effects of RAS blockade on treatment of diet-induced obesity (DIO), energy expenditure (EE) and indicators of inflammation. Experiment 1 determined the specificity of the DIO-inhibition via RAS antagonism by comparing different ACE inhibitors and ARB. Having established that different forms of RAS blockade produce similar effects on body weight, body composition, and circulating levels of adiposity signals, Experiment 2 then examined the effects of acute administration of the ACE inhibitor, CAP, on mRNA expression of inflammatory markers in adipose tissue to determine if the previously observed decrease in inflammatory gene expression caused by chronic ACE inhibition (35) occurs prior to weight loss. Whilst, experiment 3 was conducted to assess the effects of short (2 days) vs. longer (28 days)-term ACE inhibition by CAP on EE, with the hypothesis that CAP would increase both adiponectin and metabolic rate at both durations.
Materials and Methods
Animals
Male C57BL/6J mice (n = 180; Monash Animal Services, Clayton, VIC, Australia and Animal Resource Centre, Canning Vale, WA, Australia) were housed in the La Trobe University central animal facility and given at least one week to acclimate prior to experimentation. Animals were single-housed and maintained on a 12:12-h reverse light/dark cycle with temperature maintained at 22 ± 3°C. Mice 6 to 8 weeks of age were provided a pelleted HFD (21% fat w/w; Speciality Feeds, Australia) with ad libitum water except where specified. There was a small variation among studies on some measures due to availability of mice at the time of purchase, but none that altered any conclusion. All animal procedures were approved by the Animal Ethics Committee of La Trobe University (approval nos. AEC09-16-P and AEC10-04-P) or the UNSW Animal Care and Ethics Committee (approval no. 15/8B).
Design
Experiment 1
Mice 8 weeks of age were randomly assigned to one of six conditions (n=12/group) assessing different ACE inhibitors (CAP, ENL, PER) and ARB (TEL, LOS). The HFD was available ad libitum and contained CAP (100 mg/kg with an average dose of 13.3 mg/kg/d), ENL (33 mg/kg with an average dose of 4.4 mg/kg/d), TEL (66 mg/kg with an average dose of 8.8 mg/kg/d), PER (8 mg/kg with an average dose of 1.1 mg/kg/d), LOS (83 mg/kg with an average dose of 11.1 mg/kg/d) (Sigma-Aldrich, St. Louis, MO) or nothing-added [control (CON)]. Doses were chosen based on recommended prescribed intakes for human hypertension (42), relative to our established dose of CAP (21). Various ACE inhibitors and ARB were used in this study to confirm that observed metabolic and behavioral effects are not specific to any one drug. Food intake, water intake and body weight were measured at baseline and every 7 days for 28 days. At the conclusion of the experiment, mice were fasted for 2 h and anesthetized (Ketamine 60 mg/kg and Xylazine 8 mg/kg; IP; 0.2 mL), and body composition was determined using DEXA (pDEXA Sabre, Norland Medical Systems). Blood was collected by cardiac puncture with a 25-gauge needle attached to an EDTA-treated syringe. Blood samples were centrifuged for 12 min at 14,100 rcf and stored at −20°C.
Experiment 2
Mice 8 weeks of age were fed HFD for 6 weeks ad libitum. They were then fasted overnight (12 h) and randomly assigned to Fasted, CON or CAP groups (n=6/group). The Fasted group did not have food or fluid returned, the CON group had food and water returned for 3 h and the CAP group had food and water containing CAP (0.05 mg/mL) returned for 3 h (mean intake 2.11 ± 0.24 mg/kg). After 3 h mice in all groups were sacrificed by the method described for Experiment 1 with the omission of the DEXA scan. Body weight and food and fluid intake were measured. Epididymal fat was harvested, snap-frozen in liquid nitrogen and stored at −80°C.
Experiment 3
On Day 1, mice 6 weeks of age were placed in a Labmaster indirect calorimetry system for acclimation. On Days 2 and 3 in the calorimeter they were randomly assigned to a control group with ad libitum food (AL; n = 12), a CAP-treated group (0.05 mg/mL drinking water) with ad libitum food (CAP; n=12), or a group pair-fed to the CAP group (PF; n=12). The final day (Day 3) was used for analyses. An additional cohort of mice was moved to the calorimetry apparatus after 25 days of AL (n=12), CAP (n=12) or PF (n = 12) treatment; i.e., there were 25 days of body weight and ingestive behavior measures on HFD prior to the calorimetric analyses in this cohort. Upon removal from calorimetry apparatus, mice were sacrificed in the manner described in Experiment 1.
Plasma Hormone Measurements
Plasma adiponectin and leptin concentrations were measured using ELISA kits (EZML-82K Mouse Leptin ELISA and EZML-60K Mouse Adiponectin ELISA, Linco Research, St Charles, MO). Absorbance was read at 450 nm and 590 nm for all assays using a microplate spectrophotometer (Molecular Devices Spectra Max 250, GMI, Ramsey, MN).
mRNA Expression
Total RNA was extracted from ~100 mg of adipose tissue using Tri-reagent (PE Applied Biosystems, CA, USA). MCP-1, IL-6, TLR4, leptin, and adiponectin (GeneWorks Pty Ltd, Hindmarsh, SA, Australia; see Supplementary Table S1) mRNA expression were quantified after reverse transcription using quantitative real-time PCR on a fluorometric thermal cycler (7500 Fast Real-Time PCR System, PE Applied Biosystems) and Power SYBR® Green PCR Master Mix (PE Applied Biosystems). All results were normalized to levels of 28S ribosomal RNA. The oligonucleotide sequences have been provided previously (35).
Indirect Calorimetry and General Locomotor Activity (GLA)
Mice were placed in the calorimetry cages for 3 days; the first 2 days were considered the acclimation phase, and data were analyzed only for the final 24 h. The system used was a custom-built, four-cage, open-circuit calorimeter (LabMaster; TSE Systems GmbH, Bad Homburg, Germany). GLA was also continuously monitored as movement counts. Dependent variables were total EE during the light and dark phases, respiratory quotient (RQ) and GLA.
Statistical Analysis
Data were analyzed by a one, two-way analysis of variance (ANOVA) or two-way repeated measures ANOVA, followed by post hoc least significant difference tests following significant interaction effects (Statistica 7, StatSoft, Tulsa, OK). Statistical significance was accepted at P < 0.05, two-tailed. Results are reported as mean ± SEM.
Results
Experiment 1
Food and Water Intake
Over 28 days of HFD feeding, groups treated with an ACE inhibitor or an ARB had lower food intake than untreated CON [F(15, 195)=4.331, p<0.001], see Figure 1A. Cumulative food intake was lower than CON in CAP (p<0.01), LOS (p<0.05) and TEL (p<0.01) during Week 1, ENL (p<0.05) by Week 2 and PER by Week 3 of treatment (p<0.01), and all group intakes remained significantly lower than CON at Week 4. Food intake in the CAP group was significantly lower than that of all other groups by Week 3 (ps<0.05). Total water intake differed among groups [F(5, 49)=31.635, p<0.001]; intakes were lowest in CON (p<0.05 vs. all groups) and greatest in CAP (p<0.01 vs. all groups). LOS animals had lower water intake than all groups other than CON (ps<0.01), see Figure 1B. It is important to note that, when considering data from earlier publications, we have now made a dozen or more independent replications of the same basic experiment and had comparable results in all of them (20, 21, 35, 43).
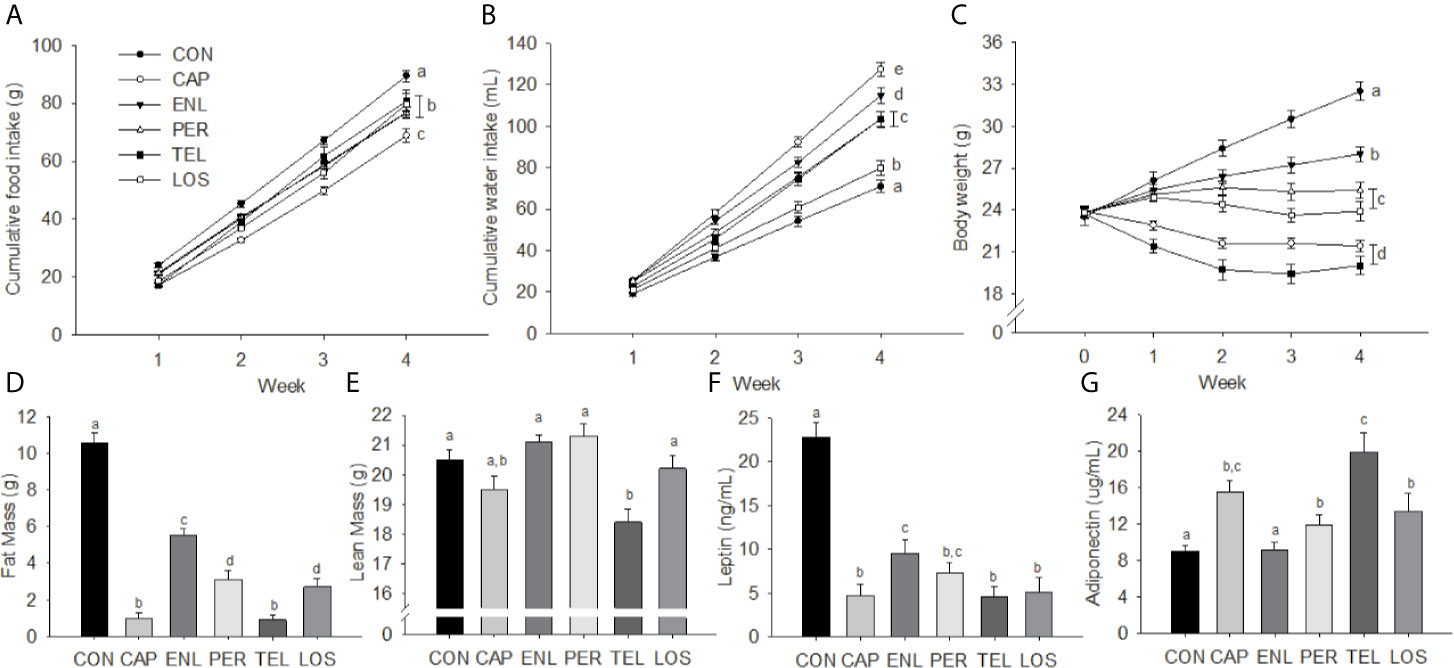
Figure 1 Inhibition of the RAS decreases food intake, body weight, body fat and plasma leptin. Food intake (A), water intake (B), body weight (C), fat mass (D), lean mass (E), leptin (F) and adiponectin (G) in mice treated with angiotensin-converting enzyme (ACE) inhibitors (Captopril [CAP], enalapril [ENL], perindopril [PER]) or angiotensin receptor antagonists (ARBs: telmisartan [TEL], losartan [LOS]). Data are represented as mean ± SEM with significant differences indicated at the p<0.05 by differing superscript letters.
Body Weight and Body Composition
Starting weights did not differ among the groups whereas after 4 weeks of treatment there was a significant effect of group [F(20, 260)=39.134, p<0.001]. Weight gain in CON over 28 days was 9.01 ± 0.76 g. Weight gains in ENL (4.17 ± 0.43 g), PER (1.61 ± 0.57 g) and LOS (0.15 ± 0.92 g) animals were each lower relative to CON. Both CAP (−2.48 ± 0.50 g) and TEL (−3.77 ± 0.77 g) lost weight over the course of the experiment. Weekly body weights are depicted in Figure 1C.
There were significant main effects for both fat mass [F(5, 65)=79.442, p<0.001] and lean mass [F(5, 65)=9.602, p<0.001]. Fat mass was greater in CON animals compared with all other groups (ps<0.001). ENL mice had 53% of the fat mass of CON animals and the CON group maintained a significantly greater fat mass than all other treatment groups (ps<0.001). CAP and TEL animals had lower fat mass than the remaining groups (ps<0.01), see Figure 1D. Lean-mass was lower only in TEL animals compared with all other groups other than CAP (ps<0.01), see Figure 1E. Fat and lean mass were calculated as percentage of body weight for all treatment groups (Table 1).
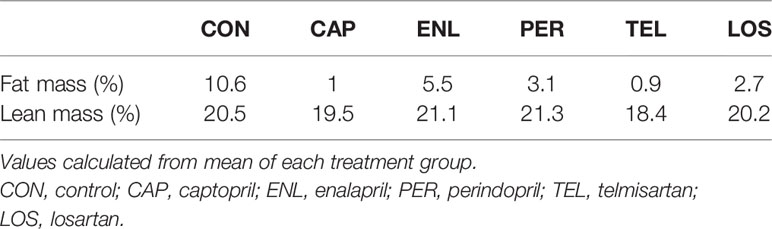
Table 1 Fat mass and lean mass calculated as a percentage of body weight.
Plasma Hormones
Plasma leptin was elevated in CON animals [F(5, 28)=24.475, p<0.001] relative to all other groups (ps<0.001) and ENL-treated mice had higher leptin relative to CAP, TEL and LOS mice (ps<0.05), see Figure 1F. There was a significant treatment effect on adiponectin [F(5, 28)=8.017, p<0.001], see Figure 1G, with TEL having higher adiponectin relative to all groups other than CAP (ps<0.05), and CAP, PER and LOS treatment having increased adiponectin relative to CON (ps<0.05).
Experiment 2
Ingestive Behaviors and Body Weight
There were no differences in body weight, food or fluid intakes among treatment groups at 3 h post-treatment, see Table 2.
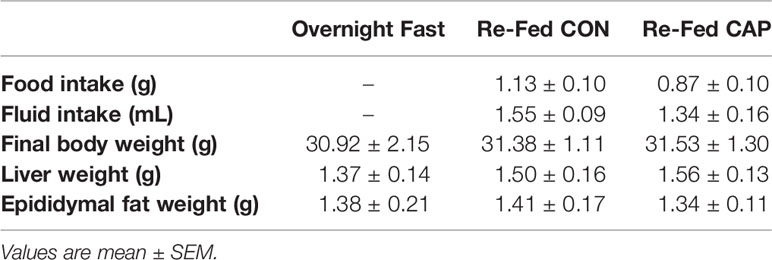
Table 2 Food intake, fluid intake, final body weight, liver and epididymal fat weights.
Adipose Tissue mRNA
As depicted in Figure 2, at 3 h post-treatment the expressions of mRNA for MCP-1, IL-6, and TLR4 were lower in the adipose tissue of CAP-treated mice compared with those of CON and FASTED animals (p<0.05); CAP-treated mice also had lower leptin mRNA expression compared to CON (p<0.05). CAP and CON mice had lower adiponectin mRNA expression relative to FASTED animals (p<0.05). The mean cycle threshold (CT) values were not significantly different between treatment groups (see Supplementary Table S2).
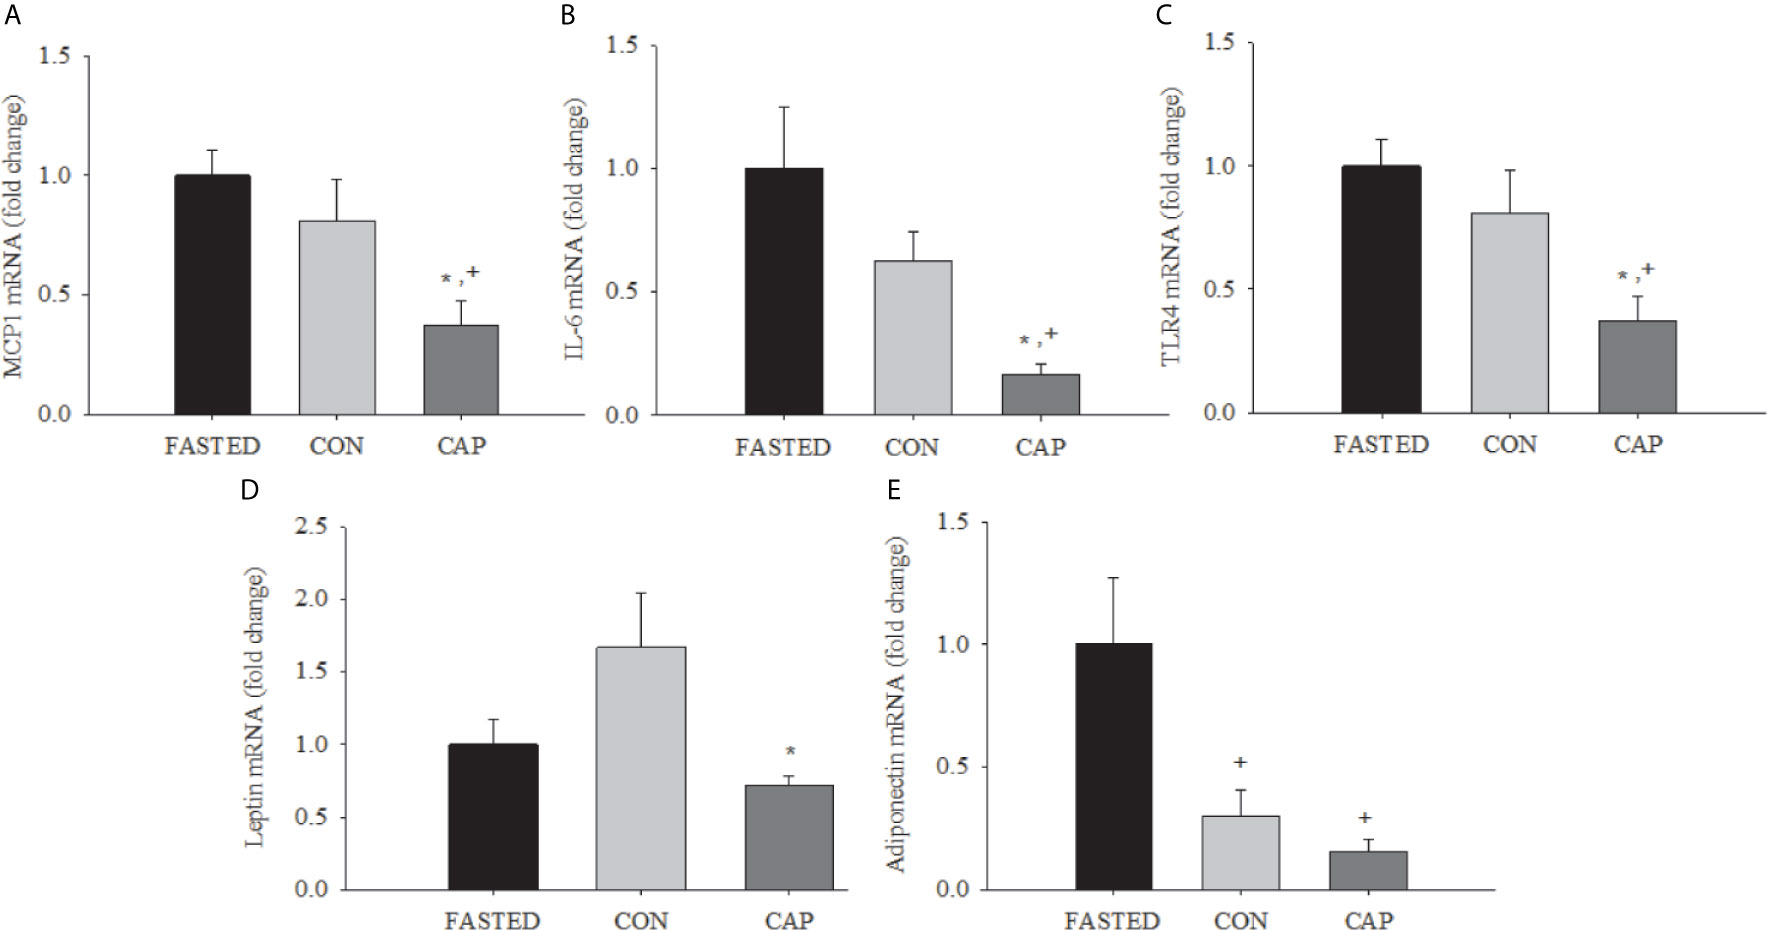
Figure 2 Acute captopril treatment decreases adipose tissue mRNA expression of inflammatory mediators and adipokines. MCP-1 (A), IL-6 (B), (C) TLR4, leptin (D), and adiponectin (E) in epididymal adipose tissue (* p<0.05 vs. Fasting, + p< 0.05 vs. CON). Results are normalized to the expression of 28s ribosomal RNA.
Experiment 3
Food and Fluid Intake (2-Day Treatment)
There was a significant interaction effect (treatment group x day) on cumulative food intake [F(4, 64) = 3.02, p<0.05]. As depicted in Figure 3A, food intake was lower in CAP (p<0.01) and PF (p<0.01) compared with levels in AL animals on Day 2 of treatment. There was also a significant interaction for cumulative water intake [F(4, 62) = 3.25, p<0.05]; water intake was increased in CAP relative to AL (p<0.05) and PF (p<0.01) groups by Day 2 of treatment, see Figure 3C. There was no difference in fluid intake between the AL and PF groups.
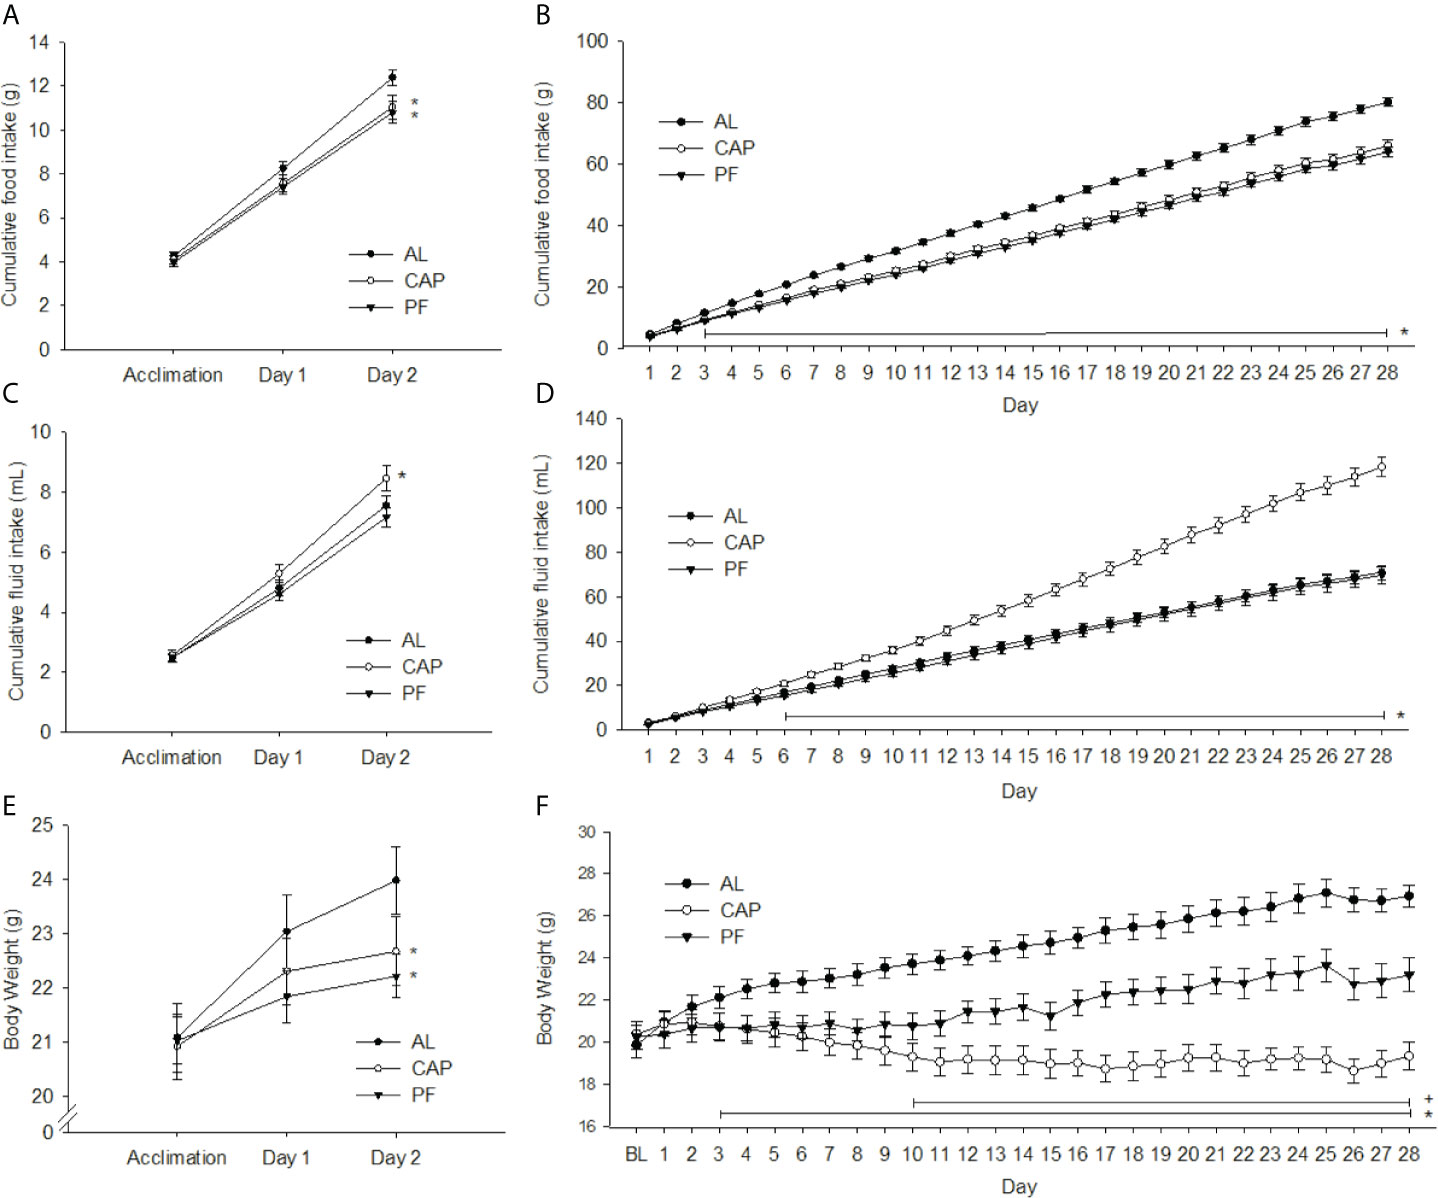
Figure 3 2 or 28 days of captopril treatment decreases food intake and body weight of mice relative to ad libitum-fed and pair-fed controls. Food intake (A, B), water intake (C, D) and body weights (E, F) of ad libitum-fed (AL) controls, captopril (CAP) treated, and pair-fed (PF) animals, treated for 2 or 28 d, respectively. Data are represented as mean ± SEM with significant differences indicated at the p<0.05 level * vs. AL, + vs. PF. The two adjacent asterisks are referring to distinct significant differences shown in two different treatment groups.
Food and Fluid Intake (28-Day Treatment)
Over the 28-day treatment period cumulative food intake differed significantly among treatment groups [F(54, 891)=16.09, p<0.001]. Differences were observed between AL and the CAP/PF groups from Day 3 (p<0.05) through Day 28 (p<0.001), see Figure 3B. Cumulative water intake was greater in CAP animals than in AL/PF groups from Day 6 [F(54, 891)=53.47, p<0.001], and no differences were observed between AL and PF groups, see Figure 3D.
Body Weight, Body Composition and Tissue Weights (2-Day Treatment)
There was a significant interaction effect (treatment group x day) on body weight [F(4, 66)=5.67, p<0.001], see Figure 3E. Body weights of both CAP (p<0.05) and PF (p<0.01) mice were significantly lower compared with those of AL mice on Day 2 of treatment, with no significant difference between CAP and PF animals. The DEXA analyses revealed no differences in total fat or lean mass, see Table 2. Dissected liver weights were lower in CAP (p<0.05) and PF (p<0.05) compared with AL mice [F(2, 33)=3.29, p<0.05], whereas there was no difference in epididymal adipose tissue weight.
Body Weight, Body Composition and Tissue Weights (28-Day Treatment)
There was a significant interaction effect over the treatment period (treatment group x day) on body weight [F(56, 924)=23.91, p<0.001]. Body weights of both CAP (p<0.05) and PF (p<0.05) groups were lower compared with weights of AL from Day 3 of treatment and remained lower for the duration of the experiment. CAP-treated mice weighed significantly less than PF mice after 10 days of treatment (p<0.05) and this continued through to completion of the experiment at 28 days, see Figure 3F. Fat mass was lower in CAP (p<0.001) and PF (p<0.01) mice compared with that in AL [F(2, 33)=31.25, p<.001], CAP was also lower than PF (p<0.01). Total lean mass was lower in CAP relative to both PF (p<0.05) and AL (p<0.001) mice [F(2, 33)=8.24, p<0.001], see Table 3.
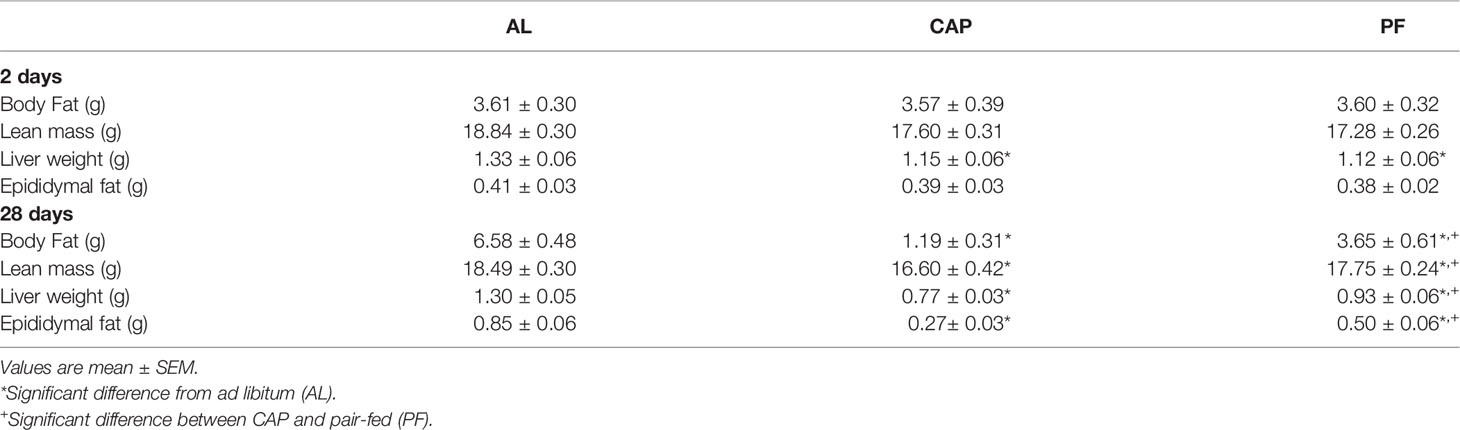
Table 3 Body composition, liver and epididymal fat weights after 2 days or 28 days of captopril (CAP) treatment.
Liver weights were significantly lower in CAP mice compared with PF (p<0.05) and AL (p<0.001) mice, and liver mass was also lower in PF compared with AL mice (p<0.01) [F(2, 33)=13.1, p<0.001]. Epididymal fat mass differed among all groups [F(2, 33)=32.364, p<0.001]; with CAP less than PF (p<0.01) and AL (p<0.001), and PF less than AL (p<0.001), see Table 3.
Energy Expenditure (EE), Respiratory Quotient (RQ) and General Locomotor Activity (GLA) (2 Days)
There was no significant interaction of treatment group x light cycle on EE. There was, however, a significant main effect of treatment group overall [F(2, 30)=3.52, p<0.05]. Post hoc analyses revealed that PF mice had significantly lower EE than both CAP and AL groups (p<0.05), see Figure 4A. There was a significant increase in EE during the dark cycle regardless of group [F(1, 30)=408.53, p<0.001]. RQ and GLA did not provide significant interactions of treatment group x light cycle. The only differences observed were increases in RQ [F(1, 30)=16.37, p<0.001] and GLA [F(1, 30)=150.89, p<0.001] during the dark cycle, and this occurred regardless of group, see Figures 4B, C.

Figure 4 Energy expenditure, respiratory quotient, locomotor activity, and plasma adipokines of mice treated with captopril for 2 or 28 days with both ad libitum- and pair-fed controls. Energy expenditure (A, D), respiratory quotient (B, E), activity (C, F), plasma adiponectin (G, I) and leptin (H, J) of ad libitum-fed (AL) controls, captopril (CAP)-treated, and pair-fed (PF) animals, treated for 2 or 28 days, respectively. Data are represented as mean ± SEM with significant differences indicated at the p<0.05 level * vs. AL, + between CAP and PF, § between light phase.
Energy Expenditure (EE), Respiratory Quotient (RQ) and General Locomotor Activity (GLA) (28 Days)
There was a significant main effect of treatment group on EE [F(2, 33)=21.63, p<0.001]. Both CAP (p<0.001) and PF (p<0.05) animals had significantly lower EE than AL, and CAP animals had lower EE than PF animals after 28 days of treatment (p<0.001), see Figure 4D. There was a significant increase in EE in the dark cycle regardless of group [F(1, 33)=89.991, p<0.001]. No significant interaction effect of treatment group x light cycle on EE was observed.
There was a significant interaction effect of treatment group x light cycle on RQ [F(2, 33)=4.31, p<0.05]. Increases in RQ were observed from light to dark in CAP (p<0.001) and AL (p<0.05) mice, but not in PF, see Figure 4E. The only differences observed in GLA were during the dark cycle and occurred regardless of treatment group, see Figure 4F.
Plasma Hormones (2-Day Treatment)
Plasma adiponectin was significantly different among treatment groups [F(2, 19)=4.21, p<0.05]. CAP had higher adiponectin than both PF (p<0.05) and AL (p<0.05). Plasma leptin did not differ among groups, see Figures 4G, H.
Plasma Hormones (28-Day Treatment)
Plasma adiponectin differed among treatment groups [F(2, 33)=18.75, p<0.001]. CAP had higher adiponectin than both PF (p<0.001) and AL (p<0.001), with no difference between PF and AL mice, see Figure 4I. Plasma leptin was also significantly different among groups [F(2, 21)=12.66, p<0.001]. CAP (p<0.001) and PF (p<0.05) mice had lower leptin levels compared with AL, and CAP animals also had lower plasma leptin than PF animals (p<0.01), see Figure 4J.
Discussion
In Experiment 1, mice given ad libitum access to a HFD supplemented with an ACE-inhibitor or with an ARB had substantially lower body weight, food intake and adiposity compared with HFD-fed, untreated mice. This suggests that the observed effects are primarily related to reducing peripheral angiotensin signaling, rather than to the previously hypothesized increase in central RAS activity (8, 44). Although the outcomes of previous reports of ACE inhibitors and ARBs on weight loss are not consistent, most rodent research has found either weight loss or inhibition of weight gain (see (45) for a review). The ACEs and ARBs in Experiment 1 were added to the food pellets at levels that assumed that a 30 g mouse eats approximately 4 g of food/d. The actual doses chosen were then calculated based on recommended human doses adjusted for differences in the metabolic rate of mice. While the prevention of the RAS activity in all groups would be expected to be similar, differential outcomes among groups may be due to differences in the pharmacokinetics and pharmacodynamics of the compounds in the mouse (46). However, and importantly, all of these compounds produced a reduction in weight gain and adiposity, such that the minor differences observed are most likely related to dose effects. Further, there were no instances of mortality or illness in any group, implying that they were well-tolerated. As expected, ACE inhibitors increased water intake. The mechanism for this has been discussed previously (47) and appears to be due to increased conversion of ANG I to ANG II within the brain. Interestingly, the ARBs LOS and TEL also caused increased water intake. The increase was evident by Week 3 of treatment and may be a function of the increase in plasma renin associated with AT1 blockade (48).
We used only mice fed a HFD, but previous studies investigated the effects of RAS inhibition in low fat-fed (or normal diet) animals; ACE-inhibition lowered body mass gain, food intake and fat mass compared with untreated controls (15, 17, 23). Therefore, given that the present experiments aimed to investigate the role of RAS blockade in the prevention of HFD-induced impairments, we used untreated HFD-fed mice as the appropriate control.
In HFD-fed mice, acute treatment with CAP in the drinking water for 3 h significantly lowered mRNA expression of the inflammatory mediators, MCP-1, IL-6, TLR4, and leptin compared with controls, despite not effecting food intake over this time. We have previously found that gene expression related to inflammation, including MCP-1, IL-6, and TLR4, is reduced by chronic administration of an ACE inhibitor (35). In DIO rodents, treatment with an ARB reduces white adipose tissue mRNA expression of TNF-alpha (23, 49), MCP-1 and IFN-gamma (50). Anti-inflammatory effects have also been observed following RAS blockade in agouti and leptin receptor deficient obese mouse models (51, 52). However, because the low-grade inflammatory state, that is mediated by adipokine secretion from adipocytes and adipose-resident macrophages, decreases with reduction in adipose depot mass, the data previously presented were confounded by the weight loss that had occurred in the ACE inhibitor-treated animals relative to the obesity observed in the control animals. Treatment of adipocytes in culture with an ARB decreased mRNA expression of adipokines related to inflammation, including RBP4, resistin, and visfatin (53), as well as pro-inflammatory cytokines IL-6 and TNF-alpha (50, 54, 55). The data in Experiment 2 indicate that acute RAS blockade in vivo significantly reduces gene expression of markers of inflammation prior to reductions in food intake or body weight.
The mechanism by which ACE inhibition suppresses inflammation remains unclear. As obesity develops, adipocytes begin to secrete low levels of TNFα, and TNFα in turn stimulates pre-adipocytes to produce MCP-1 (56). MCP-1 is a chemoattractant which facilitates recruitment of macrophages into adipose tissue (55, 57), and IL-6 production by macrophages is increased in adipose tissue in obesity (58). In addition, it has been suggested that IL-6 is involved in insulin resistance and its complications (58). TLR4 is a cell-surface receptor that produces innate immune responses to pathogens by inducing signaling cascades of kinase and transcription factor activation (59). These cascades lead to the production of pro-inflammatory cytokines and chemokines, including IL-6, eicosanoids and reactive oxygen species (ROS), all of which are effectors of immunity (60). Further, TLR4 is expressed in many insulin target tissues including liver, adipose tissue, skeletal muscle, vasculature, pancreatic β cells and brain (61). Thus, activation of TLR4 can inhibit insulin action directly via activation of pro-inflammatory kinases and ROS, and indirectly via activation of cytokine signaling cascades and systemic release of pro-inflammatory and insulin desensitizing factors (61). Overall, the present data suggest that ACE inhibition suppresses DIO-induced inflammation in adipose tissue independent of body weight, implying that the RAS itself may mediate parts of the inflammatory response to DIO.
Experiment 3 demonstrates that short-term (2 days) inhibition of ACE with captopril leads to a rapid reduction of food intake in mice fed a HFD. However, despite the reduction in energy intake, CAP-treated animals maintained EE at the level of AL animals, with EE of both CAP and AL groups being significantly greater than that of PF animals. The mechanism by which CAP reduced body weight gain despite the mice having similar food intake and lower EE is not clear and awaits future research; it is possible that a different dose of CAP might have led to a different outcome, but the dose we used (100 mg/kg of diet), and assuming a mouse consumes around 4 g of food/d which equates to 0.4 mg/day, translates to 13.3 mg/kg/day. This is in the center of the range suggested to be appropriate for mice (52).
An early increase in plasma adiponectin was also observed. Adiponectin has previously been reported to stimulate EE and thermogenesis after entering the CNS (62), and this may explain the ability of ACE inhibitor-treated animals to maintain EE despite a reduction in energy intake. Alternatively, given that ACE inhibition reduces peripheral ACE higher levels of circulating ANG I which is converted to ANG II at the circumventricular organs occurs, consequently elevating central levels of ANG II (47). Increased water intake following ACE inhibition is mediated by this elevated central activity of ANG II. Further, increased central ANG II signaling influences sympathetic activity, such that the temporary increase of EE observed in ACE inhibitor-treated mice may be partly mediated through increased sympathetic outflow to brown adipose tissue (44).
In mice consuming HFD, longer-term treatment with an ACE inhibitor (28 days) markedly lowered body weight compared to both AL and PF animals, and this difference was reflected in lower adiposity, liver weight and epididymal fat weight. After 28 days, EE in PF animals was lower than that of AL mice, and was even lower in the ACE inhibitor-treated group. Similarly to what occurred after the acute (2 days) ACE inhibition, adiponectin was significantly increased in ACE inhibitor-treated animals after 28 days compared with levels in the AL and PF groups. Leptin levels were consistent with the body weight and fat data, with AL animals having the highest levels followed by PF and then ACE inhibitor-treated mice. Thus, it would appear that once energy stores have been depleted, ACE inhibitor-treatment no longer has the ability to maintain EE at the level seen in AL or even PF mice. Interestingly, by 28 days, and despite the food intakes being equal for the PF and ACE inhibitor-treated animals, body weight of the ACE inhibitor-treated animals was 15% lower than that of the PF animals. The lower body weight was reflected in the lower EE, but the latter was insufficient to restore body weight to the level of the PF animal.
As reported previously (21), plasma adiponectin was increased and plasma leptin was lower following chronic treatment with an ACE inhibitor in mice fed a HFD than in untreated controls. The current study narrowed the time course of the changes in these hormones; i.e., adiponectin was elevated after just 2 days of ACE inhibition, and the increase persisted over 28 days. Since mRNA expression of adiponectin was not changed after 3 h of ACE inhibitor-treatment, greater than 3 h of ACE inhibition (but less than 2 days) appears necessary to change adiponectin regulation. Adiponectin is reduced in obesity (63) and increased with caloric restriction (64). The increased body weight of PF animals over the course of the 28 days indicates that the PF animals were receiving sufficient calories to maintain a positive energy balance, which would likely have limited any increase of adiponectin.
Leptin primarily acts as an adiposity signal, circulating in direct proportion to fat stores. Leptin is also associated with the low-grade inflammatory state in obesity (65). An increased inflammatory response occurs with the hyperleptinemia (66), and leptin is capable of controlling TNFα production and activation of macrophages (67). However, our data indicate that inflammatory markers in ACE inhibitor-treated animals are lower prior to a reduction in leptin expression, suggesting that leptin is not the principal factor in inflammation in obesity and its reduction by ACE inhibition.
Collectively, these studies improve our understanding of the time-course of prevention of diet-induced obesity by antagonism of the RAS. Indeed, within the first days of treatment with ACE inhibitor-treatment there is a decrease in food intake; however, EE is maintained, and actually elevated when compared with levels in animals consuming the same reduced amount of food but without ACE inhibition. However, after 28 days of treatment EE was significantly decreased in ACE inhibitor-treated animals relative to both AL and PF animals. This, along with increased adiponectin, produces a similar phenotype as a starvation response and is not observed in PF animals, indicating that the weight loss mediated by ACE inhibition is not a function of lowered energy intake alone.
Data Availability Statement
The raw data supporting the conclusions of this article will be made available by the authors, without undue reservation.
Ethics Statement
The animal study was reviewed and approved by Animal Ethics Committee of La Trobe University (Approval Nos. AEC09-16-P and AEC10-04-P) or the UNSW Animal Care and Ethics Committee (Approval No. 15/8B).
Author Contributions
DB, RW, DC-S, and MJ designed the experiments. SP, EB, ML, GB, LS, and DB collected and analyzed the data. CM, DC-S, SW, and DB wrote the manuscript. All authors reviewed and edited the manuscript. All authors contributed to the article and approved the submitted version.
Funding
This work was supported by the Australian Research Council (DE160100088 and DP170100063), the National Health and Medical Research Council APP1156622, and a Ramaciotti Foundation Establishment Grant.
Conflict of Interest
The authors declare that the research was conducted in the absence of any commercial or financial relationships that could be construed as a potential conflict of interest.
Supplementary Material
The Supplementary Material for this article can be found online at: https://www.frontiersin.org/articles/10.3389/fendo.2021.682726/full#supplementary-material
References
1. Crandall DL, Herzlinger HE, Saunders BD, Armellino DC, Kral JG. Distribution of Angiotensin II Receptors in Rat and Human Adipocytes. J Lipid Res (1994) 35(8):1378–85. doi: 10.1016/S0022-2275(20)40079-3
2. Crandall DL, Herzlinger HE, Saunders BD, Zolotor RC, Feliciano L, Cervoni P. Identification and Characterization of Angiotensin II Receptors in Rat Epididymal Adipocyte Membranes. Metabolism (1993) 42(4):511–5. doi: 10.1016/0026-0495(93)90111-Z
3. Karlsson C, Lindell K, Ottosson M, Sjostrom L, Carlsson B, Carlsson LM. Human Adipose Tissue Expresses Angiotensinogen and Enzymes Required for Its Conversion to Angiotensin II. J Clin Endocrinol Metab (1998) 83(11):3925–9. doi: 10.1210/jc.83.11.3925
4. Ailhaud G, Fukamizu A, Massiera F, Negrel R, Saint-Marc P, Teboul M. Angiotensinogen, Angiotensin II and Adipose Tissue Development. Int J Obes Relat Metab Disord (2000) 24 Suppl 4:S33–5. doi: 10.1038/sj.ijo.0801501
5. Engeli S, Schling P, Gorzelniak K, Boschmann M, Janke J, Ailhaud G, et al. The Adipose-Tissue Renin-Angiotensin-Aldosterone System: Role in the Metabolic Syndrome? Int J Biochem Cell Biol (2003) 35(6):807–25. doi: 10.1016/S1357-2725(02)00311-4
6. Goossens GH, Blaak EE, van Baak MA. Possible Involvement of the Adipose Tissue Renin-Angiotensin System in the Pathophysiology of Obesity and Obesity-Related Disorders. Obes Rev (2003) 4(1):43–55. doi: 10.1046/j.1467-789X.2003.00091.x
7. Schling P, Mallow H, Trindl A, Loffler G. Evidence for a Local Renin Angiotensin System in Primary Cultured Human Preadipocytes. Int J Obes Relat Metab Disord (1999) 23(4):336–41. doi: 10.1038/sj.ijo.0800821
8. Weisinger RS, Begg DP, Chen N, Jois M, Mathai ML, Sinclair AJ. The Problem of Obesity: Is There a Role for Antagonists of the Renin-Angiotensin System? Asia Pac J Clin Nutr (2007) 16 S1:359–67.
9. Takahashi N, Li F, Hua K, Deng J, Wang CH, Bowers RR, et al. Increased Energy Expenditure, Dietary Fat Wasting, and Resistance to Diet-Induced Obesity in Mice Lacking Renin. Cell Metab (2007) 6(6):506–12. doi: 10.1016/j.cmet.2007.10.011
10. Massiera F, Seydoux J, Geloen A, Quignard-Boulange A, Turban S, Saint-Marc P, et al. Angiotensinogen-Deficient Mice Exhibit Impairment of Diet-Induced Weight Gain With Alteration in Adipose Tissue Development and Increased Locomotor Activity. Endocrinology (2001) 142(12):5220–5. doi: 10.1210/endo.142.12.8556
11. Jayasooriya AP, Mathai ML, Walker LL, Begg DP, Denton DA, Cameron-Smith D, et al. Mice Lacking Angiotensin-Converting Enzyme Have Increased Energy Expenditure, With Reduced Fat Mass and Improved Glucose Clearance. Proc Natl Acad Sci USA (2008) 105(18):6531–6. doi: 10.1073/pnas.0802690105
12. Kouyama R, Suganami T, Nishida J, Tanaka M, Toyoda T, Kiso M, et al. Attenuation of Diet-Induced Weight Gain and Adiposity Through Increased Energy Expenditure in Mice Lacking Angiotensin II Type 1a Receptor. Endocrinology (2005) 146(8):3481–9. doi: 10.1210/en.2005-0003
13. Yvan-Charvet L, Even P, Bloch-Faure M, Guerre-Millo M, Moustaid-Moussa N, Ferre P, et al. Deletion of the Angiotensin Type 2 Receptor (AT2R) Reduces Adipose Cell Size and Protects From Diet-Induced Obesity and Insulin Resistance. Diabetes (2005) 54(4):991–9. doi: 10.2337/diabetes.54.4.991
14. Carter CS, Cesari M, Ambrosius WT, Hu N, Diz D, Oden S, et al. Angiotensin-Converting Enzyme Inhibition, Body Composition, and Physical Performance in Aged Rats. J Gerontol A Biol Sci Med Sci (2004) 59(5):416–23. doi: 10.1093/gerona/59.5.B416
15. Santos EL, de Picoli Souza K, Guimaraes PB, Reis FC, Silva SM, Costa-Neto CM, et al. Effect of Angiotensin Converting Enzyme Inhibitor Enalapril on Body Weight and Composition in Young Rats. Int Immunopharmacol (2008) 8(2):247–53. doi: 10.1016/j.intimp.2007.07.021
16. Weisinger HS, Begg DP, Egan GF, Jayasooriya AP, Lie F, Mathai ML, et al. Angiotensin Converting Enzyme Inhibition From Birth Reduces Body Weight and Body Fat in Sprague-Dawley Rats. Physiol Behav (2008) 93(4-5):820–5. doi: 10.1016/j.physbeh.2007.11.046
17. de Kloet AD, Krause EG, Kim DH, Sakai RR, Seeley RJ, Woods SC. The Effect of Angiotensin-Converting Enzyme (ACE) Inhibition Using Captopril on Energy Balance and Glucose Homeostasis. Endocrinology (2009) 150(9):4114–23. doi: 10.1210/en.2009-0065
18. Jayasooriya AP, Begg DP, Chen N, Mathai ML, Sinclair AJ, Wilkinson-Berka J, et al. Omega-3 Polyunsaturated Fatty Acid Supplementation Reduces Hypertension in TGR(mRen-2)27 Rats. Prostaglandins Leukot Essent Fatty Acids (2008) 78(1):67–72. doi: 10.1016/j.plefa.2007.11.001
19. Kawamura T, Yoshida K, Sugawara A, Nagasaka M, Mori N, Takeuchi K, et al. Impact of Exercise and Angiotensin Converting Enzyme Inhibition on Tumor Necrosis Factor-Alpha and Leptin in Fructose-Fed Hypertensive Rats. Hypertens Res (2002) 25(6):919–26. doi: 10.1291/hypres.25.919
20. Mul JD, Seeley RJ, Woods SC, Begg DP. Angiotensin-Converting Enzyme Inhibition Reduces Food Intake and Weight Gain and Improves Glucose Tolerance in Melanocortin-4 Receptor Deficient Female Rats. Physiol Behav (2013) 121:43–8. doi: 10.1016/j.physbeh.2013.01.013
21. Weisinger RS, Stanley TK, Begg DP, Weisinger HS, Spark KJ, Jois M. Angiotensin Converting Enzyme Inhibition Lowers Body Weight and Improves Glucose Tolerance in C57BL/6J Mice Maintained on a High Fat Diet. Physiol Behav (2009) 98(1-2):192–7. doi: 10.1016/j.physbeh.2009.05.009
22. De Blasi A, Cortellaro M, Costantini C. Enalapril in Essential Hypertension: A Comparative Study With Propranolol. Enalapril in Hypertension Study Group (Uk). Br J Clin Pharmacol (1984) 18(1):51–6. doi: 10.1111/j.1365-2125.1984.tb05021.x
23. Zorad S, Dou JT, Benicky J, Hutanu D, Tybitanclova K, Zhou J, et al. Long-Term Angiotensin II AT1 Receptor Inhibition Produces Adipose Tissue Hypotrophy Accompanied by Increased Expression of Adiponectin and Ppargamma. Eur J Pharmacol (2006) 552(1-3):112–22. doi: 10.1016/j.ejphar.2006.08.062
24. Benson SC, Pershadsingh HA, Ho CI, Chittiboyina A, Desai P, Pravenec M, et al. Identification of Telmisartan as a Unique Angiotensin II Receptor Antagonist With Selective PPARgamma-modulating Activity. Hypertension (2004) 43(5):993–1002. doi: 10.1161/01.HYP.0000123072.34629.57
25. Sugimoto K, Qi NR, Kazdova L, Pravenec M, Ogihara T, Kurtz TW. Telmisartan But Not Valsartan Increases Caloric Expenditure and Protects Against Weight Gain and Hepatic Steatosis. Hypertension (2006) 47(5):1003–9. doi: 10.1161/01.HYP.0000215181.60228.f7
26. Katz SA, Opsahl JA, Wernsing SE, Forbis LM, Smith J, Heller LJ. Myocardial Renin Is Neither Necessary Nor Sufficient to Initiate or Maintain Ventricular Hypertrophy. Am J Physiol Regul Integr Comp Physiol (2000) 278(3):R578–86. doi: 10.1152/ajpregu.2000.278.3.R578
27. Araki K, Masaki T, Katsuragi I, Tanaka K, Kakuma T, Yoshimatsu H. Telmisartan Prevents Obesity and Increases the Expression of Uncoupling Protein 1 in Diet-Induced Obese Mice. Hypertension (2006) 48(1):51–7. doi: 10.1161/01.HYP.0000225402.69580.1d
28. Iwai M, Chen R, Imura Y, Horiuchi M. Tak-536, a New AT1 Receptor Blocker, Improves Glucose Intolerance and Adipocyte Differentiation. Am J Hypertens (2007) 20(5):579–86. doi: 10.1016/j.amjhyper.2006.12.010
29. Shimabukuro M, Tanaka H, Shimabukuro T. Effects of Telmisartan on Fat Distribution in Individuals With the Metabolic Syndrome. J Hypertens (2007) 25(4):841–8. doi: 10.1097/HJH.0b013e3280287a83
30. Fried SK, Bunkin DA, Greenberg AS. Omental and Subcutaneous Adipose Tissues of Obese Subjects Release interleukin-6: Depot Difference and Regulation by Glucocorticoid. J Clin Endocrinol Metab (1998) 83:847–50. doi: 10.1210/jc.83.3.847
31. Frühbeck G, Catalán V, Rodríguez A, Gómez-Ambrosi J. Adiponectin-Leptin Ratio: A Promising Index to Estimate Adipose Tissue Dysfunction. Relation Obesity-Associated Cardiometabolic Risk. Adipocyte (2018) 7(1):57–62. doi: 10.1080/21623945.2017.1402151
32. Dai Q, Xu M, Yao M, Sun B. Angiotensin AT1 Receptor Antagonists Exert Anti-Inflammatory Effects in Spontaneously Hypertensive Rats. Br J Pharmacol (2007) 152:1042–8. doi: 10.1038/sj.bjp.0707454
33. Lv J, Jia R, Yang D, Zhu J, Ding G. Candesartan Attenuates Angiotensin II-induced Mesangial Cell Apoptosis Via TLR4/MyD88 Pathway. Biochem Biophys Res Commun (2009) 380:81–6. doi: 10.1016/j.bbrc.2009.01.035
34. Ranjbar R, Shafiee M, Hesari A, Ferns GA, Ghasemi F, Avan A. The Potential Therapeutic Use of Renin-Angiotensin System Inhibitors in the Treatment of Inflammatory Diseases. J Cell Physiol (2019) 234(3):2277–95. doi: 10.1002/jcp.27205
35. Premaratna SD, Manickam E, Begg DP, Rayment DJ, Hafandi A, Jois M, et al. Angiotensin-Converting Enzyme Inhibition Reverses Diet-Induced Obesity, Insulin Resistance and Inflammation in C57BL/6J Mice. Int J Obes (Lond) (2012) 36(2):233–43. doi: 10.1038/ijo.2011.95
36. White CM. Pharmacologic, Pharmacokinetic, and Therapeutic Differences Among ACE Inhibitors. Pharmacotherapy (1998) 18(3):588–99. doi: 10.1002/j.1875-9114.1998.tb03121.x
37. Cheng TO. All ACE Inhibitors Are Not Alike. Arch Internal Med (1991) 151(8):1670–. doi: 10.1001/archinte.1991.00400080150035
38. Bakris G, Burgess E, Weir M, Davidai G, Koval S. Telmisartan Is More Effective Than Losartan in Reducing Proteinuria in Patients With Diabetic Nephropathy. Kidney Int (2008) 74(3):364–9. doi: 10.1038/ki.2008.204
39. Cushman DW, Wang FL, Fung WC, Harvey CM, DeForrest JM. Differentiation of Angiotensin-Converting Enzyme (ACE) Inhibitors by Their Selective Inhibition of ACE in Physiologically Important Target Organs. Am J Hypertens (1989) 2(4):294–306. doi: 10.1093/ajh/2.4.294
40. Yamada K, Uchida S, Takahashi S, Takayama M, Nagata Y, Suzuki N, et al. Effect of a Centrally Active Angiotensin-Converting Enzyme Inhibitor, Perindopril, on Cognitive Performance in a Mouse Model of Alzheimer’s Disease. Brain Res (2010) 1352:176–86. doi: 10.1016/j.brainres.2010.07.006
41. Ohtsubo T, Shibata R, Kai H, Okamoto R, Kumagai E, Kawano H, et al. Angiotensin-Converting Enzyme Inhibitors Versus Angiotensin Receptor Blockers in Hypertensive Patients With Myocardial Infarction or Heart Failure: A Systematic Review and Meta-Analysis. Hypertens Res (2019) 42(5):641–9. doi: 10.1038/s41440-018-0167-5
43. Weisinger HS, Begg DP, Egan GF, Jayasooriya AP, Lie F, Mathai ML, et al. Angiotensin Converting Enzyme Inhibition From Birth Reduces Body Weight and Body Fat in Sprague–Dawley Rats. Physiol Behav (2008) 93(4):820–5. doi: 10.1016/j.physbeh.2007.11.046
44. de Kloet AD, Krause EG, Scott KA, Foster MT, Herman JP, Sakai RR, et al. Central Angiotensin II has Catabolic Action at White and Brown Adipose Tissue. Am J Physiol Endocrinol Metab (2011) 301(6):E1081–91. doi: 10.1152/ajpendo.00307.2011
45. Weisinger RS, Begg DP, Jois M. Antagonists of the Renin-Angiotensin System and the Prevention of Obesity. Curr Opin Investig Drugs (2009) 10(10):1069–77.
46. Hansson L, Lindholm LH, Ekbom T, Dahlof B, Lanke J, Schersten B, et al. Randomised Trial of Old and New Antihypertensive Drugs in Elderly Patients: Cardiovascular Mortality and Morbidity the Swedish Trial in Old Patients With Hypertension-2 Study. Lancet (1999) 354(9192):1751–0036. doi: 10.1016/S0140-6736(99)10327-1
47. Thunhorst RL, Fitts DA, Simpson JB. Angiotensin-Converting Enzyme in Subfornical Organ Mediates Captopril-Induced Drinking. Behav Neurosci (1989) 103(6):1302–10. doi: 10.1037/0735-7044.103.6.1302
48. Rowland NE, Fregly MJ. Effect of Nonpeptide Angiotensin AT-1 and AT-2 Antagonists on Isoproterenol-Induced Renin Release. Pharmacology biochemistry Behav (1993) 44(3):623–6. doi: 10.1016/0091-3057(93)90177-U
49. Fujisaka S, Usui I, Kanatani Y, Ikutani M, Takasaki I, Tsuneyama K, et al. Telmisartan Improves Insulin Resistance and Modulates Adipose Tissue Macrophage Polarization in High-Fat-Fed Mice. Endocrinology (2011) 152(5):1789–99. doi: 10.1210/en.2010-1312
50. Cole BK, Keller SR, Wu R, Carter JD, Nadler JL, Nunemaker CS. Valsartan Protects Pancreatic Islets and Adipose Tissue From the Inflammatory and Metabolic Consequences of a High-Fat Diet in Mice. Hypertension (2010) 55(3):715–21. doi: 10.1161/HYPERTENSIONAHA.109.148049
51. Kurata A, Nishizawa H, Kihara S, Maeda N, Sonoda M, Okada T, et al. Blockade of Angiotensin II Type-1 Receptor Reduces Oxidative Stress in Adipose Tissue and Ameliorates Adipocytokine Dysregulation. Kidney Int (2006) 70(10):1717–24. doi: 10.1038/sj.ki.5001810
52. Kubota M, Shimizu M, Sakai H, Yasuda Y, Ohno T, Kochi T, et al. Renin-Angiotensin System Inhibitors Suppress Azoxymethane-Induced Colonic Preneoplastic Lesions in C57BL/KsJ-db/db Obese Mice. Biochem Biophys Res Commun (2011) 410(1):108–13. doi: 10.1016/j.bbrc.2011.05.115
53. Hung WW, Hsieh TJ, Lin T, Chou PC, Hsiao PJ, Lin KD, et al. Blockade of the Renin-Angiotensin System Ameliorates Apelin Production in 3T3-L1 Adipocytes. Cardiovasc Drugs Ther / sponsored by Int Soc Cardiovasc Pharmacotherapy (2011) 25(1):3–12. doi: 10.1007/s10557-010-6274-4
54. Hasan AU, Ohmori K, Hashimoto T, Kamitori K, Yamaguchi F, Ishihara Y, et al. Valsartan Ameliorates the Constitutive Adipokine Expression Pattern in Mature Adipocytes: A Role for Inverse Agonism of the Angiotensin II Type 1 Receptor in Obesity. Hypertens Res (2014) 37(7):621–8. doi: 10.1038/hr.2014.51
55. Skurk T, Alberti-Huber C, Herder C, Hauner H. Relationship Between Adipocyte Size and Adipokine Expression and Secretion. J Clin Endocrinol Metab (2007) 92:1023–33. doi: 10.1210/jc.2006-1055
56. Xu H, Barnes GT, Yang Q, Tan G, Yang D, Chou CJ, et al. Chronic Inflammation in Fat Plays a Crucial Role in the Development of Obesity-Related Insulin Resistance. J Clin Invest (2003) 112(12):1821–30. doi: 10.1172/JCI200319451
57. Christiansen T, Richelsen B, Bruun JM. Monocyte Chemoattractant Protein-1 is Produced in Isolated Adipocytes, Associated With Adiposity and Reduced After Weight Loss in Morbid Obese Subjects. Int J Obes (Lond) (2005) 29:146–50. doi: 10.1038/sj.ijo.0802839
58. Bastard JP, Maachi M, Tran Van Nhieu J, JArdel C, Brucekert E, Grimaldi A, et al. Adipose Tissue IL-6 Content Correlates With Resistance to Insulin Activation of Glucose Uptake Both In Vivo and In Vitro. J Clin Endocrinol Metab (2002) 87:2084–9. doi: 10.1210/jcem.87.5.8450
59. Shah PK. Innate Immune Pathway Links Obesity to Insulin Resistance. Circ Res (2007) 100:1531–3. doi: 10.1161/CIRCRESAHA.107.101104
60. Michelsen KS, Doherty TM, Shah PK, Arditi M. TLR Signaling: An Emerging Bridge From Innate Immunity to Atherogenesis. J Immunol (2004) 173:5901–7. doi: 10.4049/jimmunol.173.10.5901
61. Shi H, Kokoeva MV, Inouye K, Tzameli I, Yin J, Flier JS. TLR4 Links Innate Immunity and Fatty Acid-Induced Insulin Resistance. J Clin Invest (2006) 116:3015–25. doi: 10.1172/JCI28898
62. Qi Y, Takahashi N, Hileman SM, Patel HR, Berg AH, Pajvani UB, et al. Adiponectin Acts in the Brain to Decrease Body Weight. Nat Med (2004) 10(5):524–9. doi: 10.1038/nm1029
63. Weyer C. Hypoadiponectinemia in Obesity and Type 2 Diabetes: Close Association With Insulin Resistance and Hyperinsulinemia. J Clin Endocrinol Metab (2001) 86:1930–5. doi: 10.1210/jcem.86.5.7463
64. Varady KA, Allister CA, Roohk DJ, Hellerstein MK. Improvements in Body Fat Distribution and Circulating Adiponectin by Alternate-Day Fasting Versus Calorie Restriction. J Nutr Biochem (2010) 21(3):188–95. doi: 10.1016/j.jnutbio.2008.11.001
65. Ahima RS, Flier JS. Leptin. Annu Rev Physiol (2000) 62:413–37. doi: 10.1146/annurev.physiol.62.1.413
66. van Dielen FM, van’t Veer C, Schols AM, Soeters PB, Buurman WA, Greve JW. Increased Leptin Concentrations Correlate With Increased Concentrations of Inflammatory Markers in Morbidly Obese Individuals. Int J Obes (2001) 25:1759–66. doi: 10.1038/sj.ijo.0801825
Keywords: renin-angiotensin system antagonists, obesity, adipose tissue, inflammatory mediators, body weight, energy expenditure, gene expression
Citation: Mitchell CS, Premaratna SD, Bennett G, Lambrou M, Stahl LA, Jois M, Barber E, Antoniadis CP, Woods SC, Cameron-Smith D, Weisinger RS and Begg DP (2021) Inhibition of the Renin-Angiotensin System Reduces Gene Expression of Inflammatory Mediators in Adipose Tissue Independent of Energy Balance. Front. Endocrinol. 12:682726. doi: 10.3389/fendo.2021.682726
Received: 22 March 2021; Accepted: 12 May 2021;
Published: 02 June 2021.
Edited by:
Rajesh Katare, University of Otago, New ZealandReviewed by:
Armando Tovar, Instituto Nacional de Ciencias Médicas y Nutrición Salvador Zubirán (INCMNSZ), MexicoThomas Alexander Lutz, University of Zurich, Switzerland
Copyright © 2021 Mitchell, Premaratna, Bennett, Lambrou, Stahl, Jois, Barber, Antoniadis, Woods, Cameron-Smith, Weisinger and Begg. This is an open-access article distributed under the terms of the Creative Commons Attribution License (CC BY). The use, distribution or reproduction in other forums is permitted, provided the original author(s) and the copyright owner(s) are credited and that the original publication in this journal is cited, in accordance with accepted academic practice. No use, distribution or reproduction is permitted which does not comply with these terms.
*Correspondence: Denovan P. Begg, d.begg@unsw.edu.au