 Boshen Yang
 Yuankang Zhu
 Xia Lu1*
 Chengxing Shen
- 1Department of Cardiology, Shanghai Jiao Tong University Affiliated Sixth People’s Hospital, Shanghai, China
- 2Department of Gerontology, Xinhua Hospital affiliated to Shanghai Jiaotong University School of Medicine, Shanghai, China
Background: Patients with heart failure (HF) with diabetes may face a poorer prognosis and higher mortality than patients with either disease alone, especially for those in intensive care unit. So far, there is no precise mortality risk prediction indicator for this kind of patient.
Method: Two high-quality critically ill databases, the Medical Information Mart for Intensive Care IV (MIMIC-IV) database and the Telehealth Intensive Care Unit (eICU) Collaborative Research Database (eICU-CRD) Collaborative Research Database, were used for study participants’ screening as well as internal and external validation. Nine machine learning models were compared, and the best one was selected to define indicators associated with hospital mortality for patients with HF with diabetes. Existing attributes most related to hospital mortality were identified using a visualization method developed for machine learning, namely, Shapley Additive Explanations (SHAP) method. A new composite indicator ASL was established using logistics regression for patients with HF with diabetes based on major existing indicators. Then, the new index was compared with existing indicators to confirm its discrimination ability and clinical value using the receiver operating characteristic (ROC) curve, decision curve, and calibration curve.
Results: The random forest model outperformed among nine models with the area under the ROC curve (AUC) = 0.92 after hyper-parameter optimization. By using this model, the top 20 attributes associated with hospital mortality in these patients were identified among all the attributes based on SHAP method. Acute Physiology Score (APS) III, Sepsis-related Organ Failure Assessment (SOFA), and Max lactate were selected as major attributes related to mortality risk, and a new composite indicator was developed by combining these three indicators, which was named as ASL. Both in the initial and external cohort, the new indicator, ASL, had greater risk discrimination ability with AUC higher than 0.80 in both low- and high-risk groups compared with existing attributes. The decision curve and calibration curve indicated that this indicator also had a respectable clinical value compared with APS III and SOFA. In addition, this indicator had a good risk stratification ability when the patients were divided into three risk levels.
Conclusion: A new composite indicator for predicting mortality risk in patients with HF with diabetes admitted to intensive care unit was developed on the basis of attributes identified by the random forest model. Compared with existing attributes such as APS III and SOFA, the new indicator had better discrimination ability and clinical value, which had potential value in reducing the mortality risk of these patients.
Introduction
Heart failure (HF) is the end-stage manifestation of cardiovascular disease and the leading cause of death, which affects more than 40 million people worldwide (1–3). With the development of the global population growth and the acceleration of population aging, the absolute number of patients with heart failure has been increasing (4, 5). Meanwhile, the proportion of patients with HF with hypertension, atrial fibrillation, and diabetes increased significantly (6–8). Existing studies have found that diabetes could increase the risk of HF and lead to a poor prognosis for patients with HF, especially for those in intensive care unit (ICU) (4, 6, 9). Mechanistic hypotheses related to hyperglycemia, oxidative stress, or inflammation have been explored (10). Some researchers further found that the increased risk of events associated with diabetes was partially explained by structural and functional abnormalities of heart (11). However, the exact pathophysiological mechanisms have not been fully elucidated, and the specific treatment measures for patients with HF with diabetes still need to be further developed. Some clinically widely used severity score indicators, such as Simplified Acute Physiology Score II (SAPS-II) and Acute Physiology and Chronic Health Evaluation II (APACHE-II), were not specifically evolved for patients with HF (12, 13). Therefore, these indicators did not show any outstanding performance to predict mortality risk for these patients, especially for those high-risk patients with HF with diabetes.
In recent years, artificial intelligence (AI) has increasingly penetrated into the medical field (14). Through appropriate “learning”, computers can replace the human brain to deal with a large number of complex tasks. AI is capable of helping process image information, support diagnosis, recognize patterns of disease, and so on, so that clinicians could provide patients with better healthcare (14). Notably, unsupervised learning enables the discovery of latent structures or patient subgroups in specific cohorts, especially in ICU-related tasks (15). Some clinical decision support studies have demonstrated the ability of sophisticated machine learning models in solving certain ICU-related tasks and gained satisfying performance (16–19).
This is the first study that focused on predicting mortality risk for a specific group of high-risk populations, namely, patients with HF with diabetes in ICU. In Medical Information Mart for Intensive Care IV (MIMIC-IV) population, we used clustering algorithm to classify candidates into high-risk or low-risk groups, and then, nine machine learning models were employed to identify the major indicators for all-cause in-hospital mortality in these populations and two subgroups. Taking this as the cornerstone, a new composite indicator, ASL, was established and externally validated in the eICU cohort. Our study showed that ASL had a better performance in forecasting mortality risk in patients with HF with diabetes.
Method
Data Sources
This study used two high-quality large public databases. First is the MIMIC-IV database, which consisted of more than 53,000 patients in ICU between 2008 and 2019 at Beth Israel Deaconess Medical Center (20). The database contained the basic demographic information, vital signs, and biochemical indexes of each patient during ICU. Nurses recorded these data every other hour to ensure authenticity and reliability. Users were required to apply for and pass the test to obtain database permissions. Informed consent was not required for this database for all patient information was processed anonymously. Second is the eICU Collaborative Research Database, a multi-center emergency database, which included ICU records of more than 200,000 patients from 208 hospitals across the United States (21).
Study Population and Study Design
This study focused on critically ill patients with HF complicated with diabetes. The inclusion criteria of the study population were as followed: (1) 18 years old or older, (2) had experience in ICU, and (3) diagnosis of HF and diabetes. Those who had no ICU experience or stayed in ICU for less than 24 h were excluded. For patients with multiple admissions or ICU history, only the first ICU experience at the first admission was included. This study was a large multi-center cohort study, and the study flowchart is shown in Figure 1.
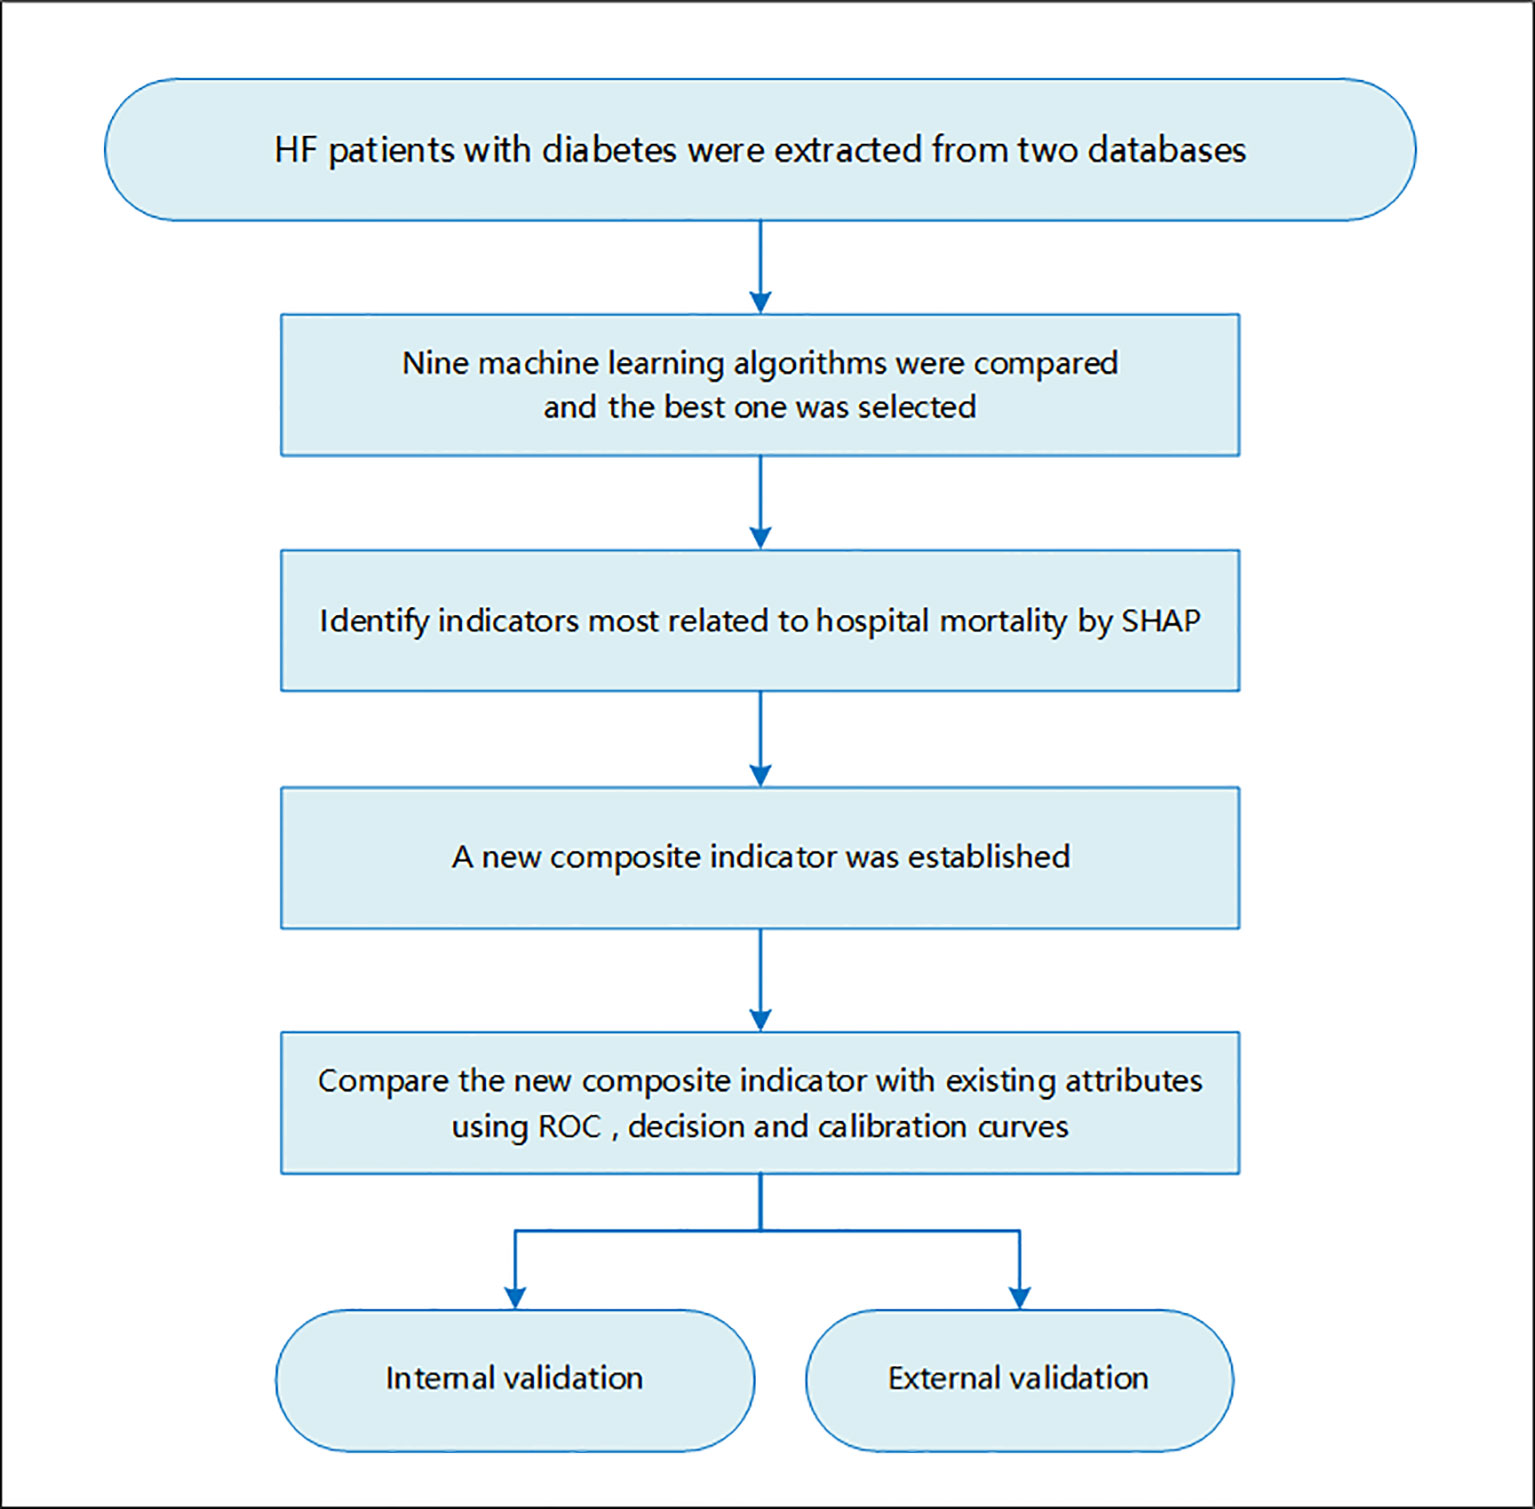
Figure 1 Flowchart of this study.
Data Extraction and Preprocessing
SQL language and International Classification of Diseases and Ninth Revision (ICD-9) codes were used to extract data from the two databases. We enrolled patients admitted to ICU with a diagnosis of HF and diabetes on hospital admission. The patient’s basic demographic information, such as sex, age, and laboratory indicators like blood glucose, creatinine, and urea, were extracted one by one. Scores related to the severity of the disease, such as Sepsis-related Organ Failure Assessment (SOFA) Score, Systemic Inflammatory Response Syndrome (SIRS) criteria, Acute Physiology Score (APS) III, and some common comorbidities or drugs were also included in the final cohort. Data with missing values of more than 30% were deleted, and other vacant values were filled by multiple interpolation. This process was implemented in Stata (version 14.0). To find out all possible hidden connections, each continuous index was divided into three groups of Min, Max, and Mean. The Max or Min value referred to the maximum or minimum value of all the measured values of the attribute during this ICU stay. Mean represented the average of the maximum and minimum value. The primary outcome was all-cause in-hospital mortality.
Machine Learning Model Comparisons and Identify Risk Indicators
Nine machine learning models were established and validated, including Logistic Regression, Support Vector Classifier (SVC), Decision Tree, Bagging, Gradient Boosting Machine (GBM), K-nearest neighbors (KNN), Random Forest, XGBoost, and LightGBM. A total of 80% of the study population was randomly selected as the training set, and the remaining 20% was used for internal validation. Each model was validated by five times cross-folding, and the average accuracy was obtained. We used areas under the receiver operating characteristic (ROC) curves (AUCs) to evaluate the performance of models as well as the precision and recall rate. The model with the best efficiency was further adjusted by hyper-parameters to optimize its performance. Then, a “perfect” model was established to define risk indicators most related to hospital mortality using SHAP in the three groups: patients with HF with diabetes, high-risk cohort, and low-risk cohort. All the steps were performed using Python.
Shapley Additive Explanations (SHAP) is a visual method to interpret the results of machine learning algorithm. We used SHAP to identify the top 20 indicators associated with in-hospital mortality based on machine learning models. This method assessed the importance of each feature using a game-theoretic approach (22). To obtain the importance of each feature at the overall level, the SHAP values of all features for all samples were drawn, and then, they were sorted in descending order according to the sum of the SHAP values. The color represents the importance of the feature (red represents high, and blue represents low), and each point represents a sample.
In addition, to further obtain the subgroups in the patient population, we used the R package called “ConsensusClusterPlus”. On the basis of this, we can further identify risk factors and test predictive effectiveness in more subdivided patient subgroups. This is an unsupervised clustering method based on the quantity of each index. To prevent the redundancy of work, we divided patients into high-risk groups and low-risk groups.
Comparison Between the New Composite Indicator and Existing Attributes
After the new composite indicator was established by linear fitting using logistics regression, we introduced three analyses to compare the performance between the new indicator and existing attributes, including ROC curve, decision curve analysis (DCA), and calibration curve. The AUC curve only measures the diagnostic accuracy of the predictive model and fails to take into account the clinical utility of a specific model, whereas the advantage of DCA is that it integrates the preferences of patients or decision-makers into the analysis. In the calibration curve analysis, by drawing the fitting of the actual probability under different conditions and the probability predicted by the model, the evaluation of the prediction effect of the model on the actual results is judged.
Statistical Analysis
Data were presented in the tables according to different distributions and types of variables. Categorical variables were presented as numbers (percentages) and tested by Chi-square (or Fisher’s exact) tests. Continuous variables were presented as mean ± standard deviation or median (25–75 percentiles) and were tested by student’s t-test or Wilcoxon rank sum tests. The composite indicator was generated using logistics regression, which was implemented in SPSS (version 23.0). To address the possibility of confounding differences and selection bias, propensity score matching (PSM) was performed using a 1:1 greedy nearest-neighbor algorithm within specified calliper widths. Locally weighted scatter plot smoothing (Lowess) could better deal with this problem by fitting a line in line with the overall trend, so as to better expose the hidden trend.
All statistical analyses in this study were performed using SPSS (version 23.0) or Stata (version 14.0). SHAP and machine learning algorithms were implemented using Python (version 3.9.7). Cluster analysis is implemented using R language (version 4.1.3) (Supplementary Figure 1). Lowess and PSM were analyzed with Stata (version 14.0). A P-value lower than 0.05 was set for statistical significance in this study.
Results
Baseline Characteristics and Cluster Analysis
After screening for inclusion and exclusion criteria, a total of 3,210 MIMIC-IV patients were included in the study cohort. As shown in Supplementary Table 1, 395 patients died during hospitalization, whereas 2,815 patients survived. After cluster analysis of study participants using R language, all patients were divided into two subgroups, namely, cluster 1 and cluster 2 (Figure 2A). Since entering ICU, the survival curves of the two clusters of patients were drawn and the log-rank test was less than 0.001 (Figure 2B). The risk of death in the cluster 2 patients was significantly higher than that in the cluster1 group with hazard ratio (HR) = 1.93 (1.59–2.35). Therefore, we defined cluster 1 as the low-risk group and the other one as the high-risk group. As the Table 1 shown, the patients in high-risk group were older and consisted of more male patients. There was no significant difference in heart rate (HR) and Mean respiratory rate (RR) between these two groups. The difference of value between body temperature and SpO2 was mild, although there was a statistical difference between the two groups. Notably, overall, the systolic blood pressure, diastolic blood pressure, and mean blood pressure of the high-risk group were significantly lower than that of the low-risk group. In terms of biochemical indicators, the high-risk group had lower glucose, HbA1c, platelet, and bicarbonate, whereas blood urea nitrogen and creatinine were significantly higher than the other group, and urine output was lower, indicating that the high-risk group had a worse renal function. For some indexes, reflecting the degree of heart damage, the CK-MB, Troponin-T, and NT-Pro-BNP of the high-risk group were significantly higher than those in the low-risk group. For sodium, potassium, and other indicators, the two groups were very approximate in value.
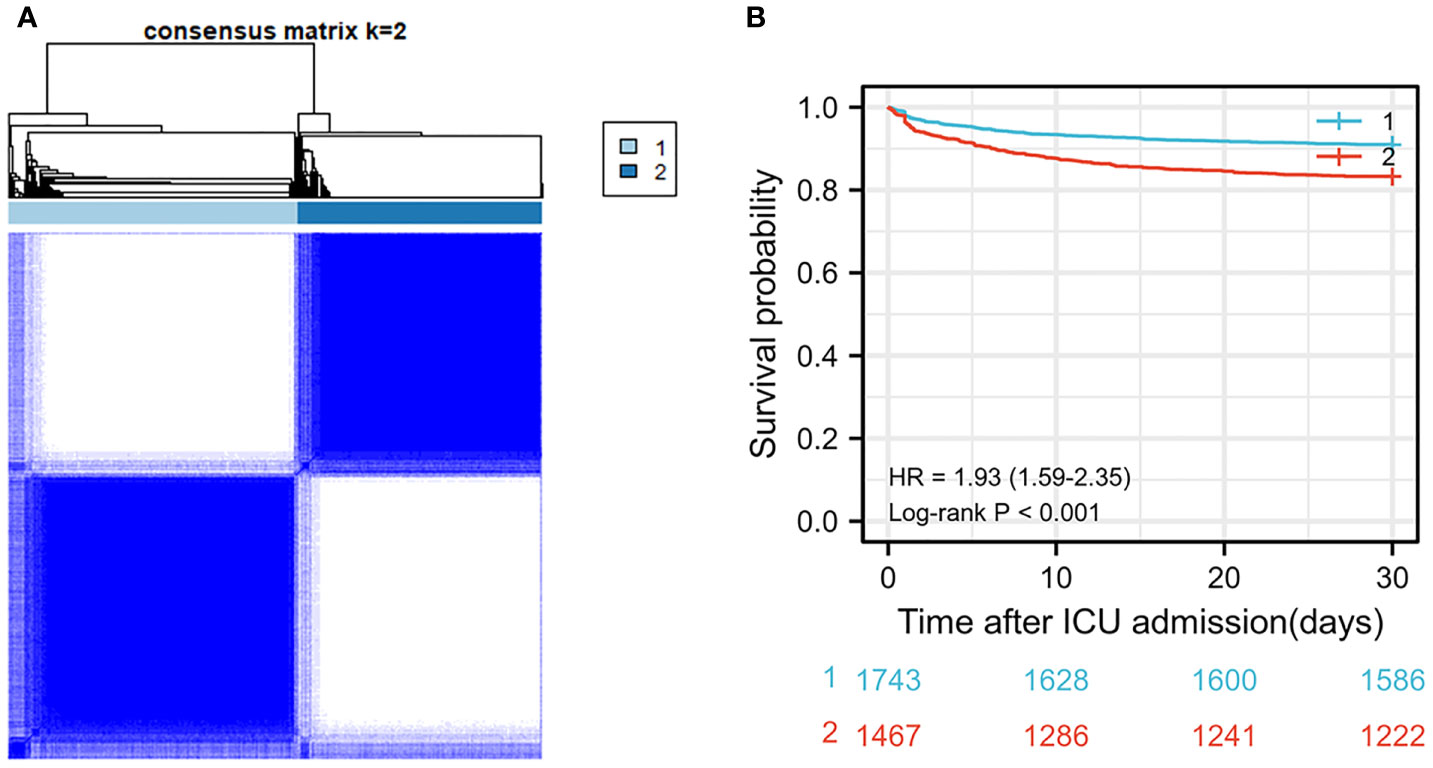
Figure 2 (A) Cluster diagram in MIMIC-IV population. (B) Survival curve between two clusters of patients in MIMIC-IV population.
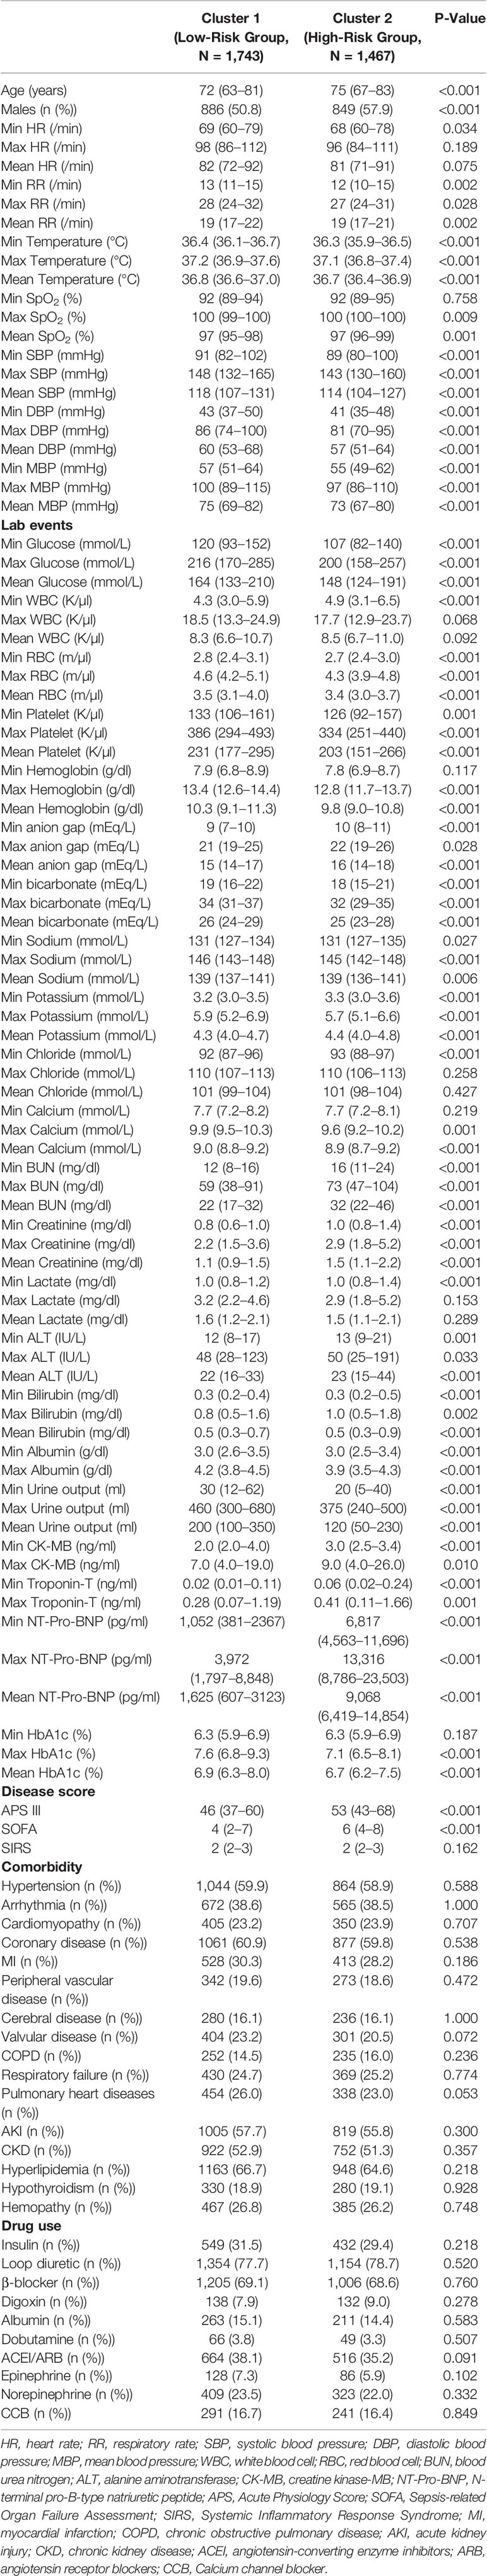
Table 1 Baseline characteristics of the low-risk group and high-risk group after cluster analysis in MIMIC-IV cohort.
Development and Comparison of Machine Learning Models
Nine machine learning models were employed in this study, including Logistic Regression, SVC, Decision Tree, Bagging, GBM, KNN, Random Forest, XGBoost, and LightGBM. These were all commonly used models for solving binary classification problems. Each model was verified by five cross-fold validation, and their AUC and Precision-Recall (P-R) curves were drawn in Figure 3. Among them, the random forest algorithm had the finest discrimination ability with precision = 0.511 and AUC = 0.850 (Table 2), so we chose it to establish the final model. After hyper-parameter optimization using grid and random hyper-parameter search, the final random forest model reached AUC = 0.92, and the confusion matrix was displayed (Figure 4). All demographic information, vital signs, laboratory indicators, complications, and drug medications were included in the final analysis. Whereafter, we respectively analyzed the related factors of the overall population, high-risk group, and low-risk group using the final RM algorithm.
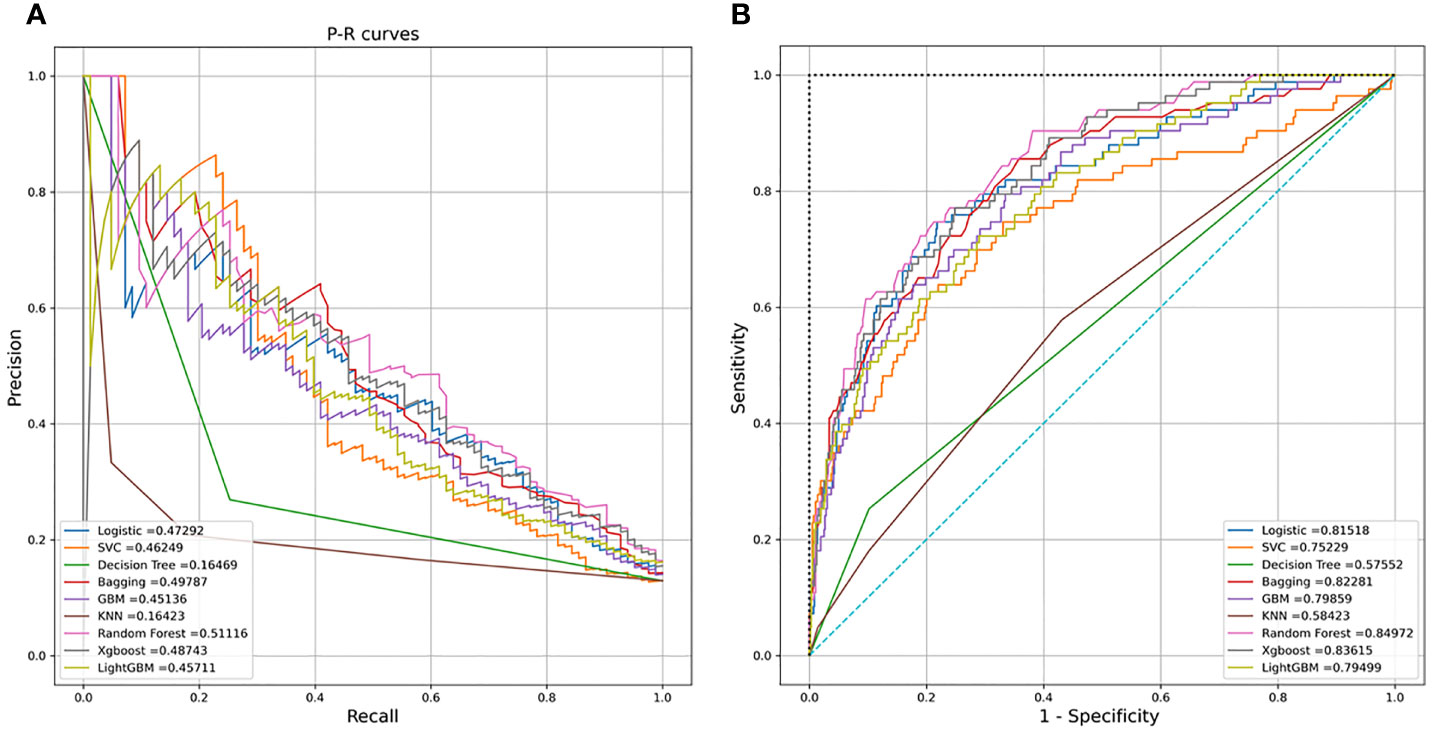
Figure 3 (A) Receiver operating characteristic (ROC) curves of the nine models. (B) Precision-Recall (P-R) curves of the nine models.
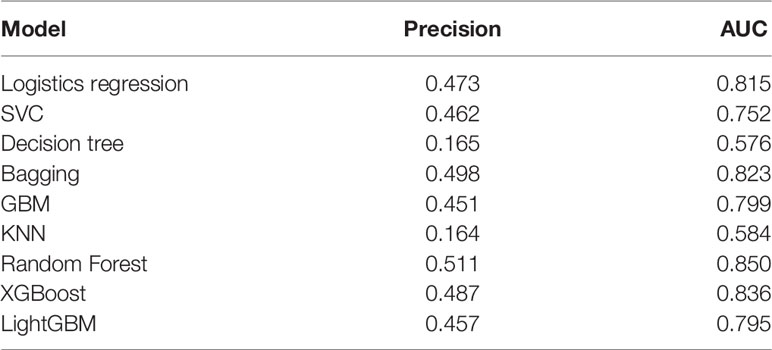
Table 2 Comparisons of nine different machine learning models.
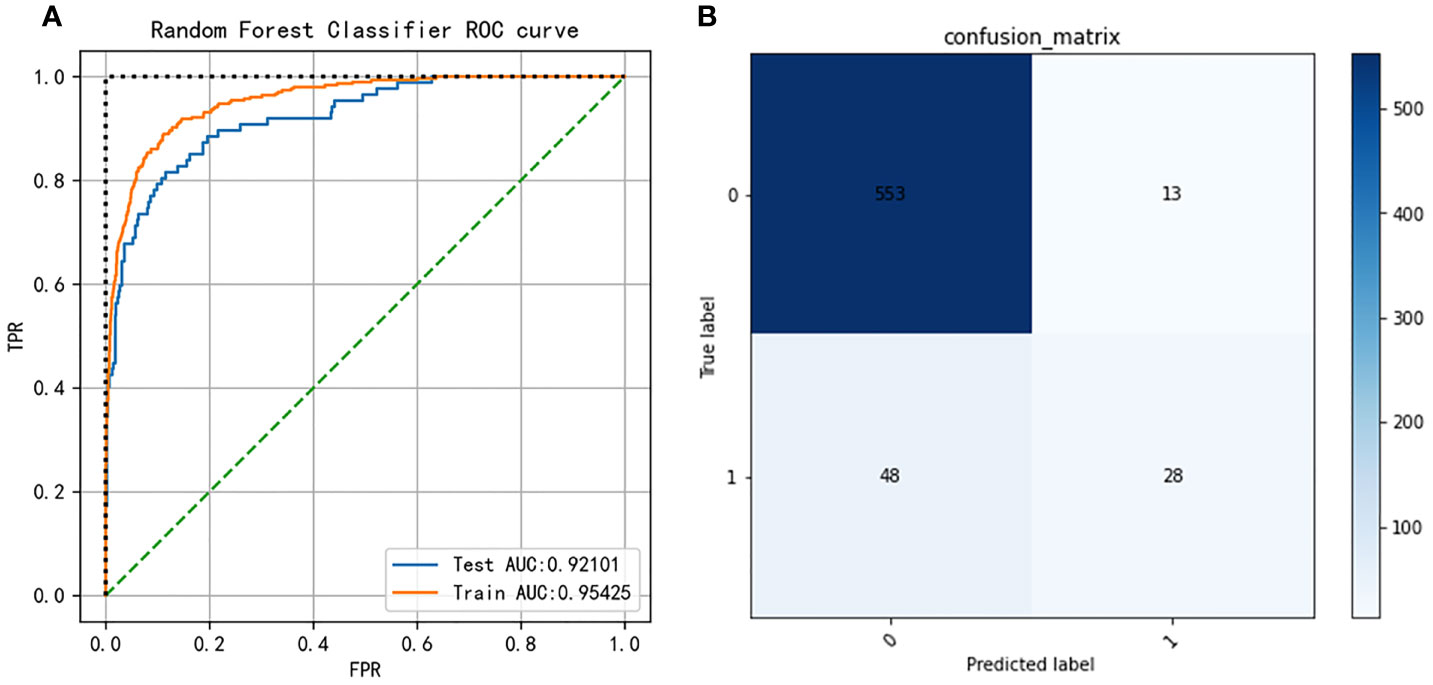
Figure 4 (A) Receiver operating characteristic (ROC) curves of the Random Forest model after hyper-parameter optimization. (B) Confusion matrix of the Random Forest model after hyper-parameter optimization.
Major Indicators Defined by SHAP
To make the output of the model more visual, we introduced SHAP to identify the factors that have the greatest correlation with hospital mortality. As shown in Figure 5, for the entire population, a total of 20 factors were identified. Among them, the top five indicators were APS III, SOFA, Min urine output, Max lactate, and age. After that, we analyzed the low-risk group and high-risk group, respectively. Among the top five factors in the low-risk group, the only factor that was different from the overall population was Mean RR. Interestingly, in the high-risk group, Mean RR was not significantly associated with hospital mortality but was replaced by Max ALT. From the SHAP plot (Figure 6), a rough but imprecise trend could be observed. Among the three groups, patients with higher APS III, SOFA, Max lactate, and lower Min urine output had a greater risk of death. In the low-risk group, the higher Mean RR corresponded to the higher risk of death, whereas in the high-risk group, it was replaced by Max ALT.
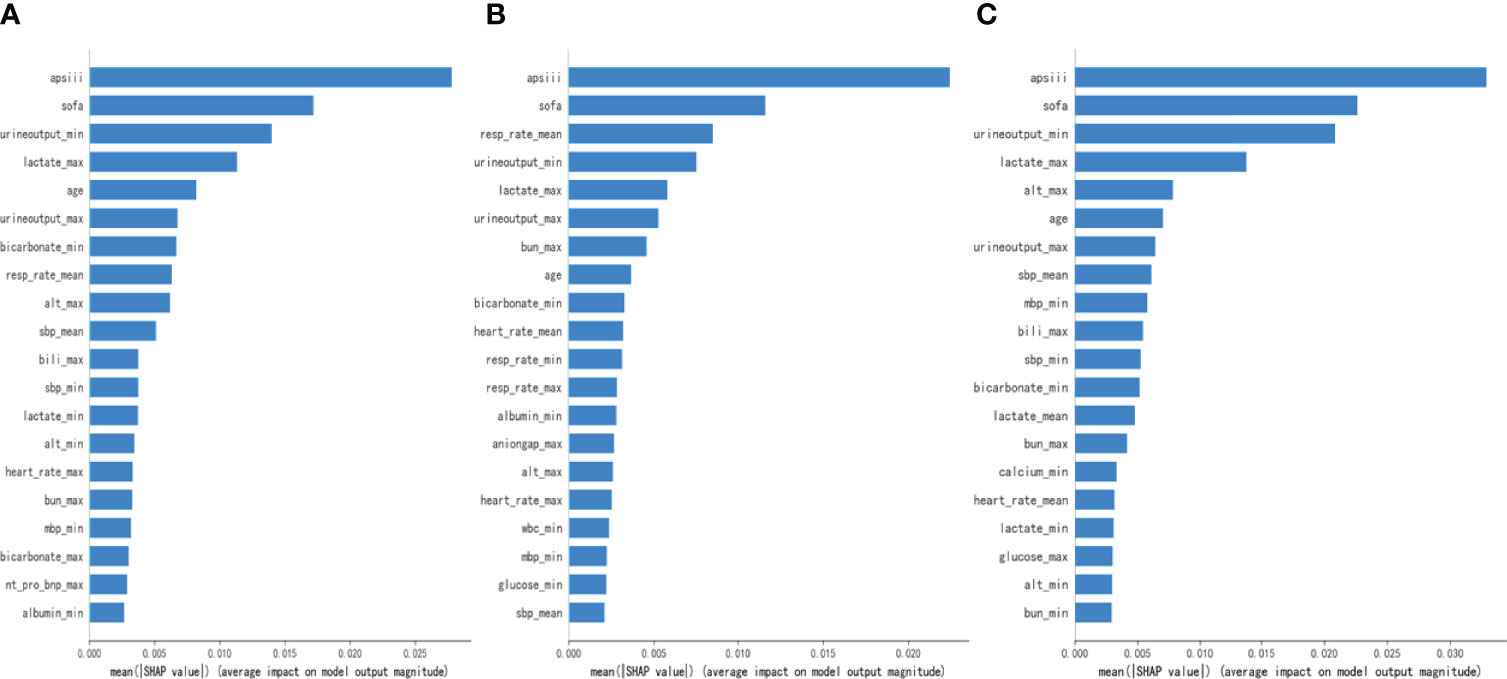
Figure 5 Bar charts that rank the importance of 20 indicators identified by Shapley Additive Explanations (SHAP) values. (A) The overall MIMIC-IV population. (B) Low-risk group. (C) High-risk group.
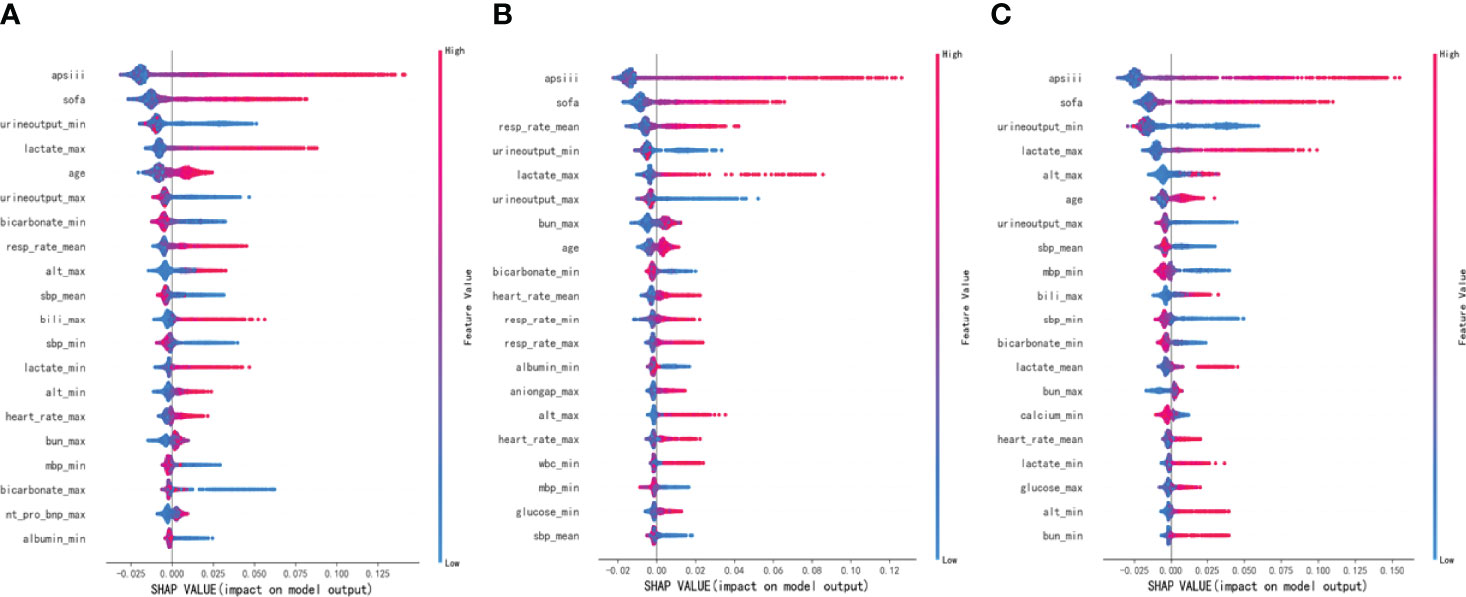
Figure 6 Distribution of the impact each feature had on the full model output using Shapley Additive Explanations (SHAP) values. (A) The overall MIMIC-IV population. (B) Low-risk group. (C) High-risk group.
Establishment of a New Composite Indicator and Internal Validation
As shown in Figures 5, 6, APS III, SOFA, and Max lactate were common indicators associated with in-hospital mortality in patients with HF with diabetes and two subclusters. On the basis of the three indicators mentioned above, logistics regression was employed to establish a novel composite indicator, which was named ASL. We validated this new indicator in MIMIC-IV cohort and found that, compared with APS III and SOFA, ASL had a more significant enhancement in predicting mortality risk in patients with HF with diabetes with AUC = 0.828 (Figure 7), independent of high-risk or low-risk group.
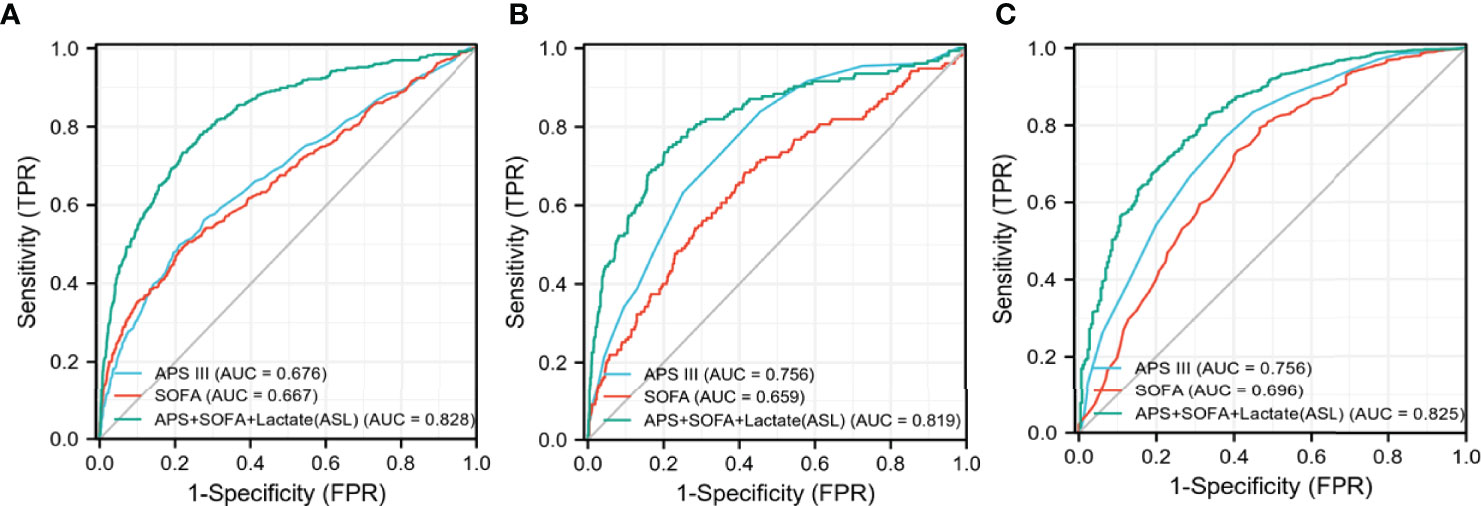
Figure 7 Receiver operating characteristic (ROC) curves of three different indicators in MIMIC-IV cohort. (A) The overall MIMIC-IV population. (B) Low-risk group. (C) High-risk group.
External Validation in the eICU Cohort
To further confirm the predictive ability of ASL, we extracted patients with HF with diabetes from a multi-center database for external validation, namely, the eICU database.
A total of 3,862 patients were included in the eICU cohort. As shown in Table 3, non-survivors were older and had higher lactate, SOFA, and APS III. Compared with APS III and SOFA, ROC curve showed that ASL had a favorable performance in this external validation cohort, and the DCA curve, along with calibration curve, indicated that this indicator also had respectable clinical value (Figures 8A–C). Taken together, this novel predictive indicator had acceptable sensitivity and specificity either in the derivation and validating cohort with a promising clinical value.
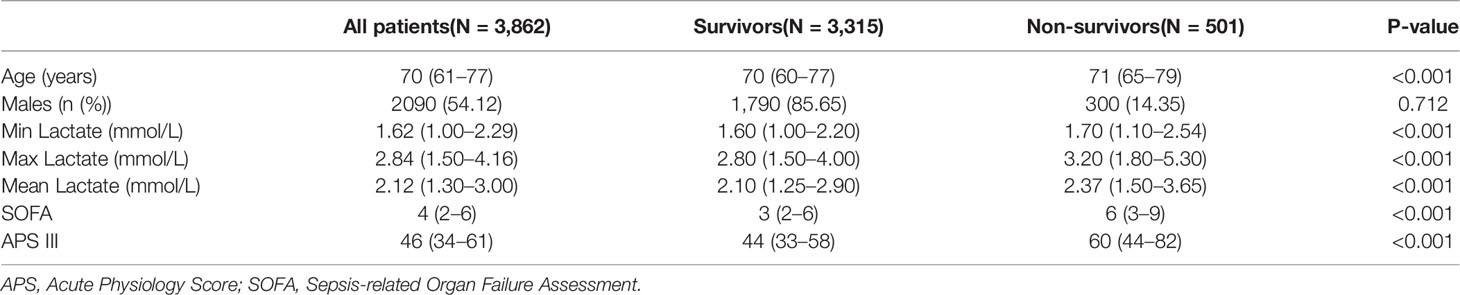
Table 3 Baseline characteristics of the survivors and non-survivors in eICU cohort.
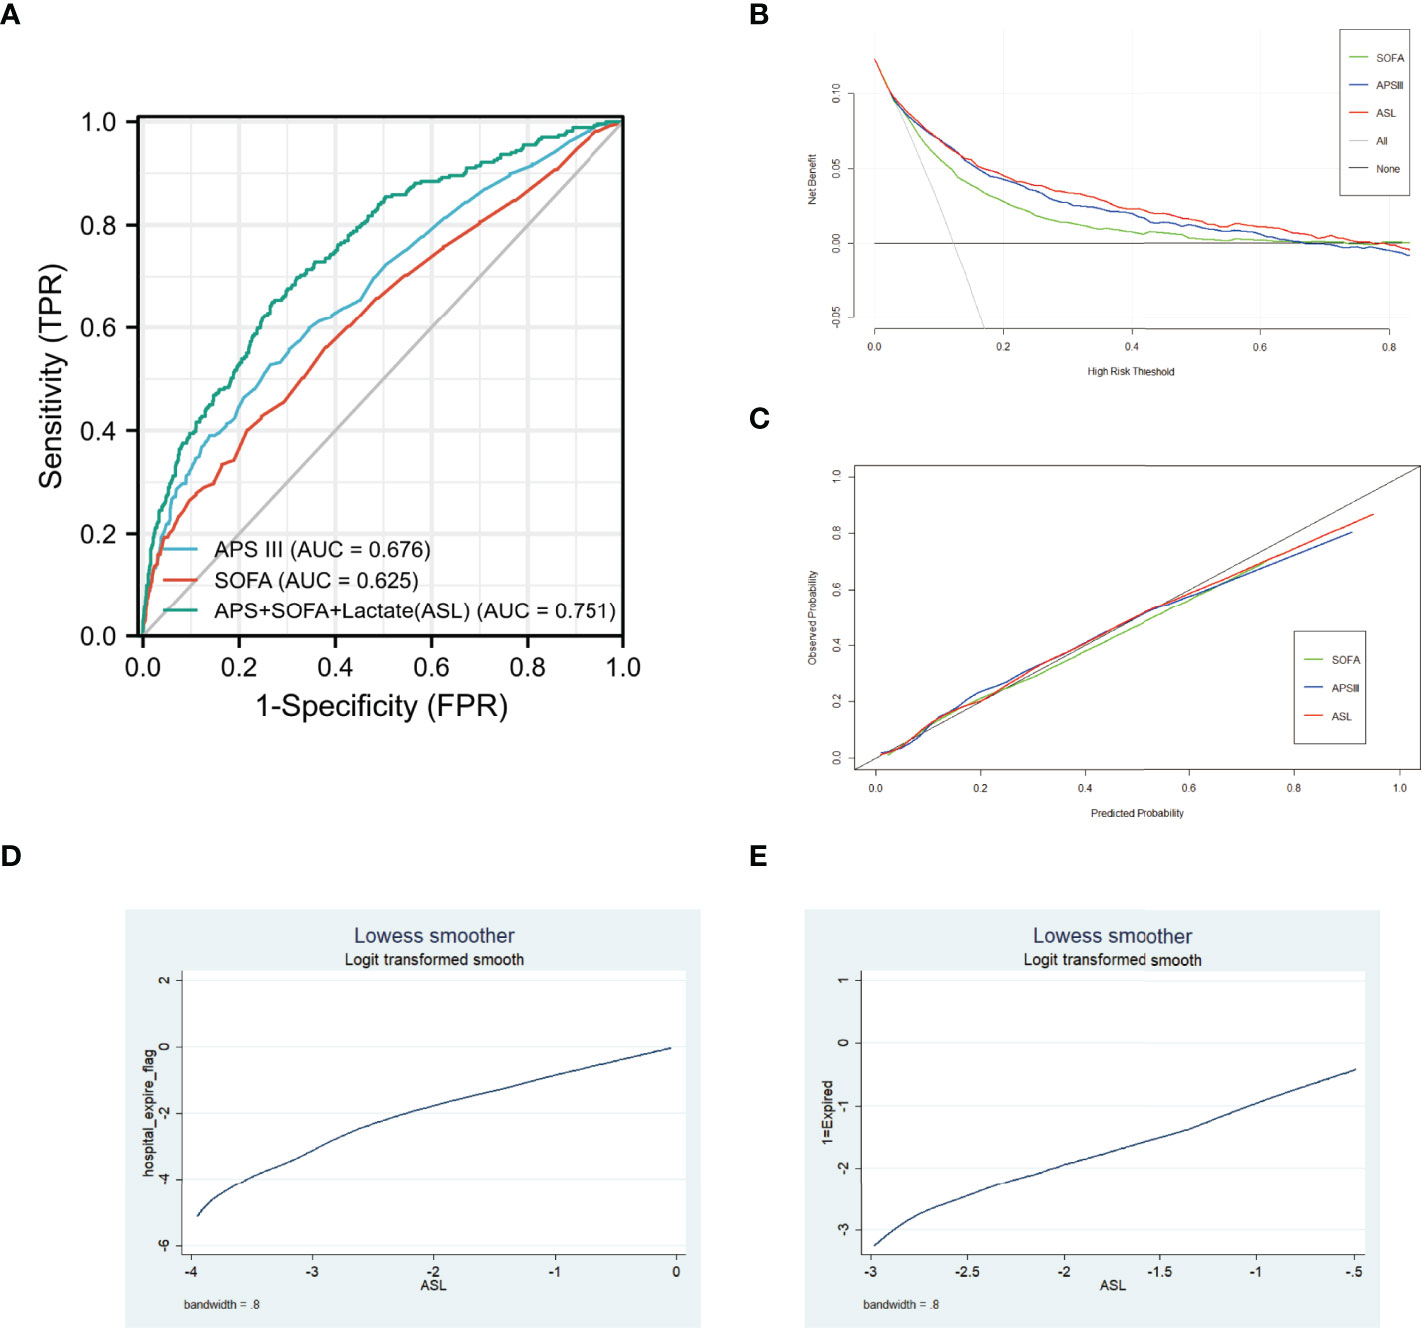
Figure 8 (A) Receiver operating characteristic (ROC) curves of three different indicators in eICU cohort. (B) DCA curves of three different indicators in eICU cohort. (C) Calibration curves of three different indicators in eICU cohort. (D) Association between ASL and hospital mortality in MIMIC-IV cohort using Lowess. (E) Association between ASL and hospital mortality in eICU cohort using Lowess.
Association Between ASL and Hospital Mortality Using Lowess
To further discover the exact relationship between major indicators and hospital mortality, we used the Lowess curve to analyze the overall population. For the general population, the relationship between APS III, SOFA, Max Lactate, and hospital mortality was approximately linear as a whole (Supplementary Figure 2). After using logistics regression to generate ASL, it is not surprising that there was also a linear positive correlation between ASL and mortality in MIMIC-IV cohort and eICU cohort (Figures 8D, E). Then, we divided the patients into low-risk, middle-risk, and high-risk groups according to ASL and found that there were significant differences of mortality among the three groups both in MIMIC-IV cohort and eICU cohort, which showed that this indicator had great risk stratification ability (Table 4). To further confirm the relationship between drug medication and prognosis, patients were divided into medication group and non-medication group according to 1:1 matching. All 20 related factors were corrected by PSM. As displayed in Supplementary Tables 2, 3, the use of diuretics and insulin had no significant effect on hospital mortality.
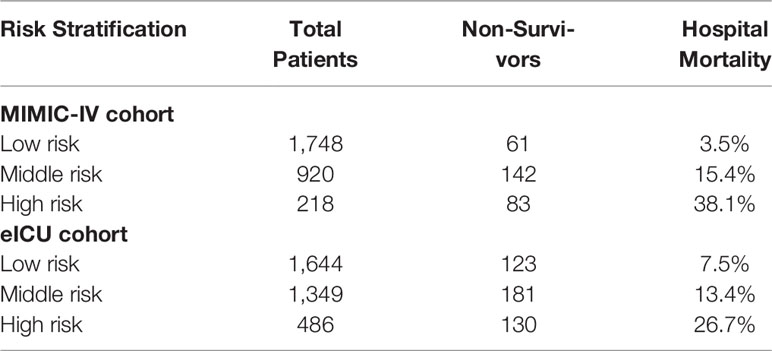
Table 4 Risk stratification using ASL in MIMIC-IV and eICU cohort.
Discussion
In this study, we developed a novel composite indicator for predicting hospital mortality for patients with HF with diabetes. The AUCs of ROC curves demonstrated that, compared with SOFA and APS III, ASL had greater risk discrimination ability in these patients, independent of high-risk or low-risk groups. DCA and calibration curve further ensured the effectiveness and security of this indicator. Compared with existing attributes, this study proved that this novel composite indicator had a distinctive mortality risk prediction ability for this specific population and provided potential guiding values for clinical healthcare in ICU.
With the development of AI, machine learning has been more and more applied in the field of cardiovascular medicine, especially for patients with HF. Current HF diagnosis and management rely on physical examination, both laboratory and imaging data of patients (23). The advantage of machine learning is that it can learn from vast amounts of existing data and output the most valuable results. For example, machine learning has been applied to the diagnosis of HF, the prediction of mortality, and readmission rate and achieved good performance (24–30). Previous studies have also confirmed that the random forest model had outstanding ability to identify risk factors in patients with HF, and the left ventricular ejection fraction was successfully identified as the most relevant feature in predicting the mortality risk of patients (31). In our study, the random forest model stood out among the nine algorithms, which proved that it had the best prediction ability for this specific population. Our study is the first to apply machine learning algorithms to patients with HF with diabetes in the environment of ICU. Even with the development of medical treatment, the mortality rate in ICU remained at a high level with 11.3% in 1996 and 12.0% in 2010 (32). Therefore, predicting the mortality risk of critically ill patients could provide useful guidance for clinical healthcare.
Cardiovascular disease caused 18 million deaths worldwide each year, and the coexistence of diabetes made cardiovascular mortality risk higher (33, 34). Meanwhile, diabetes, especially type 2 diabetes, affected more than 400 million people worldwide (35). Its pathophysiological mechanism has been widely studied, and it has been proved that it is closely related to microvascular and macrovascular complications, especially for the development of HF (36, 37). Therefore, the number of patients with these two common diseases had been already quite widespread and the risk of death might be greatly increased in patients with HF with diabetes. However, there is no risk assessment tool for this type of patient, especially for critical ill patients. Currently, there are many ICU scoring systems, whereas the predictive effect of these scoring systems on the mortality risk varies among different populations, including Acute Physiology and Chronic Health Evaluation (APACHE) (II, III, and IV), SIRS criteria, and SOFA score (38, 39). In terms of their purposes of creation and previous related studies, although they can estimate patients’ conditions quickly within 10 min so that doctors can acquire clinical dynamics of disease changes and give feedback strategies, due to the heterogeneity of the patient population, the performance of the existing scoring system in common use had inevitably volatility (40–43), for example, the SIRS may lack sufficient sensitivity and specificity to identify and risk-stratify patients in some cases. To ensure the monitoring ability of common use scoring systems for HF with diabetes patients, our study selected the APS III, SOFA, and SIRS, which were commonly used in ICU in America. We found that APS III and SOFA performed best in both high-risk and low-risk groups, whereas SIRS performed poorly. APS III was designed to predict the in-hospital mortality of ICU patients; focused on the lowest score of several vital signs, laboratory examinations, and nervous system in the first 24 h; and has been widely used to predict the clinical outcome of mixed critically ill patients now (44, 45). SOFA could describe the dysfunction or failure of one or more organs and evaluate the degree from mild dysfunction to severe failure, from repeated measures of the occurrence and progression of dysfunction in one or all organs. The items in SOFA are continuous variables that are objective, accessible, and reliable to avoid confusion and bias from the source of patients, entities, and demographics (46). Therefore, these two scoring systems complement each other in ASL and fully demonstrate their ability for real-time assessment and long-term dynamic monitoring in the time dimension. Moreover, it not only includes intuitive results such as vital signs and laboratory tests but also objectively collects the changes of various tissues and organs, so as to pay more attention to the overall changes in the spatial dimension (47). Although both urine output and lactate were identified to be highly correlated with hospital mortality based on random forest model, only lactate was selected in the composite indicator for urine output was already included in the APS III score, whereas lactate was not. Lactate, an end-stage product of anaerobic cell metabolism, always occurs during hypoxic conditions and has been reported to be associated with multiple organ dysfunction, poor prognosis, and higher in-hospital mortality. The metabolism of glucose in sensitive tissues is severely altered in diabetes patients or patients with HF who are in a state of oxygen imbalance and depletion, including defective glycogen synthesis and impaired glucose oxidative metabolism, following multiple tissues and organs that act negatively in processing the elevated lactate concentration so that the production of lactic acid increased with the increase of non-oxidized glycolysis in blood (48, 49). Because of the exquisite recognition ability of the machine learning model, the final composite indicator performed better than the existing scoring system in predicting mortality risk in patients with HF with diabetes.
At present, there is no in-depth study on the specific treatment measures for this kind of patient. As displayed in Supplementary Tables 2, 3, we found that diuretics and insulin did not significantly improve the prognosis of these patients after PSM, which indicated that these patients might have unelucidated pathophysiological mechanisms and required more specific treatment. Sodium-glucose co-transporter 2 inhibitors (SGLT2is), which are initially introduced as oral anti-diabetic drugs to reduce blood glucose by inhibition of sodium-glucose cotransporters in kidney, are now known to reduce the combined risk of cardiovascular death in patients with HF with or without diabetes (50, 51). By combining with ASL indicator, we could identify high-risk patients and improve their clinical treatment strategies, such as replacing or adding SGLT2 drugs. The effect of those promising drugs on critical ill patients remained to be further studied in the future.
There were several limitations to this study. First, this was a retrospective study, although we used two databases of multiple centers for internal and external validation respectively, more extensive research studies were still required in the future. Second, there were multiple subtypes of HF and diabetes, which were not subdivided in this study. Nevertheless, this study was the first to focus on patients with HF with diabetes in a critical care environment and was expected to help improve the prognosis of these patients in the future.
Conclusion
In this study, we developed a novel composite indicator for predicting hospital mortality for patients with HF with diabetes admitted to ICU, which was validated in internal and external cohorts. Compared with existing attributes such as APS III and SOFA, the new indicator had better discrimination ability and clinical value, which had potential value in reducing the mortality risk of these patients.
Data Availability Statement
Subject to the databases’ license, the raw data supporting the conclusions of this article will be made available by the authors, without undue reservation.
Ethics Statement
Ethical review and approval was not required for the study on human participants in accordance with the local legislation and institutional requirements. Written informed consent for participation was not required for this study in accordance with the national legislation and the institutional requirements.
Author Contributions
BY and YZ conceived the theme and wrote the manuscript. CS and XL improved the manuscript. All authors contributed to the article and approved the submitted version.
Funding
CS was supported by the National Natural Science Foundation of China (81871105) and the Shanghai Shenkang Hospital Development Center (SHDC2020CR1042B).
Conflict of Interest
The authors declare that the research was conducted in the absence of any commercial or financial relationships that could be construed as a potential conflict of interest.
Publisher’s Note
All claims expressed in this article are solely those of the authors and do not necessarily represent those of their affiliated organizations, or those of the publisher, the editors and the reviewers. Any product that may be evaluated in this article, or claim that may be made by its manufacturer, is not guaranteed or endorsed by the publisher.
Supplementary Material
The Supplementary Material for this article can be found online at: https://www.frontiersin.org/articles/10.3389/fendo.2022.917838/full#supplementary-material
Supplementary Figure 1 | Consensus index and Delta area of cluster analysis.
Supplementary Figure 2 | Association between SOFA, APS III, Max Lactate and hospital mortality in MIMIC-IV cohort using Lowess.
References
1. Groenewegen A, Rutten FH, Mosterd A, Hoes AW. Epidemiology of Heart Failure. Eur J Heart Fail (2020) 22:1342–56. doi: 10.1002/ejhf.1858
2. Jones NR, Roalfe AK, Adoki I, Hobbs FDR, Taylor CJ. Survival of Patients With Chronic Heart Failure in the Community: A Systematic Review and Meta-Analysis. Eur J Heart Fail (2019) 21:1306–25. doi: 10.1002/ejhf.1594
4. Gerber Y, Weston SA, Redfield MM, Chamberlain AM, Manemann SM, Jiang R, et al. A Contemporary Appraisal of the Heart Failure Epidemic in Olmsted County, Minnesota, 2000 to 2010. JAMA Internal Med (2015) 175(6):996–1004. doi: 10.1001/jamainternmed.2015.0924
5. Pfeffer MA, Shah AM, Borlaug BA. Heart Failure With Preserved Ejection Fraction In Perspective. Circ Res (2019) 124:1598–617. doi: 10.1161/CIRCRESAHA.119.313572
6. Lam CSP. Heart Failure in Southeast Asia: Facts and Numbers. ESC Heart Fail (2015) 2:46–9. doi: 10.1002/ehf2.12036
7. Tromp J, Ferreira JP, Janwanishstaporn S, Shah M, Greenberg B, Zannad F, et al. Heart Failure Around the World. Eur J Heart Fail (2019) 21:1187–96. doi: 10.1002/ejhf.1585
8. Tromp J, Teng T-H, Tay WT, Hung CL, Narasimhan C, Shimizu W, et al. Heart Failure With Preserved Ejection Fraction in Asia. Eur J Heart Fail (2019) 21:23–36. doi: 10.1002/ejhf.1227
9. van den Berge JC, Constantinescu AA, Boiten HJ, van Domburg RT, Deckers JW, Akkerhuis KM, et al. Short- and Long-Term Prognosis of Patients With Acute Heart Failure With and Without Diabetes: Changes Over the Last Three Decades. Diabetes Care (2018) 41:143–9. doi: 10.2337/dc17-0544
10. Marwick TH, Ritchie R, Shaw JE, Kaye D. Implications of Underlying Mechanisms for the Recognition and Management of Diabetic Cardiomyopathy. J Am Coll Cardiol (2018) 71:339–51. doi: 10.1016/j.jacc.2017.11.019
11. Inciardi RM, Claggett B, Gupta DK, Cheng S, Liu J, Echouffo Tcheugui JB, et al. Cardiac Structure and Function and Diabetes-Related Risk of Death or Heart Failure in Older Adults. J Am Heart Assoc (2022) 11:e022308. doi: 10.1161/JAHA.121.022308
12. Godinjak A, Iglica A, Rama A, Tančica I, Jusufović S, Ajanović A, et al. Predictive Value of SAPS II and APACHE II Scoring Systems for Patient Outcome in a Medical Intensive Care Unit. Acta Med Acad (2016) 45(2):97–103. doi: 10.5644/ama2006-124.165
13. Kądziołka I, Świstek R, Borowska K, Tyszecki P, Serednicki W.. Validation of APACHE II and SAPS II Scales at the Intensive Care Unit Along With Assessment of SOFA Scale at the Admission as an Isolated Risk of Death Predictor. Anaesthesiol Intensive Ther (2019) 51:107–11. doi: 10.5114/ait.2019.86275
14. Hamet P, Tremblay J. Artificial Intelligence in Medicine. Metabol: Clin Exp (2017) 69S:S36–40. doi: 10.1016/j.metabol.2017.01.011
15. Su L, Zhang Z, Zheng F, Pan P, Hong N, et al. Five Novel Clinical Phenotypes for Critically Ill Patients With Mechanical Ventilation in Intensive Care Units: A Retrospective and Multi Database Study. Respir Res (2020) 21:325. doi: 10.1186/s12931-020-01588-6
16. Hanson CW, Marshall BE. Artificial Intelligence Applications in the Intensive Care Unit. Crit Care Med (2001) 29:427–35. doi: 10.1097/00003246-200102000-00038
17. Greco M, Caruso PF, Cecconi M. Artificial Intelligence in the Intensive Care Unit. Semin Respir Crit Care Med (2021) 42:2–9. doi: 10.1055/s-0040-1719037
18. Komorowski M, Celi LA, Badawi O, Gordon AC, Faisal AA. The Artificial Intelligence Clinician Learns Optimal Treatment Strategies for Sepsis in Intensive Care. Nat Med (2018) 24:1716–20. doi: 10.1038/s41591-018-0213-5
19. Rueckel J, Kunz WG, Hoppe BF, Patzig M, Notohamiprodjo M, Meinel FG, et al. Artificial Intelligence Algorithm Detecting Lung Infection in Supine Chest Radiographs of Critically Ill Patients With a Diagnostic Accuracy Similar to Board-Certified Radiologists. Crit Care Med (2020) 48:e574–e83. doi: 10.1097/CCM.0000000000004397
20. Johnson A, Bulgarelli L, Pollard T, Horng S, Celi LA, Mark R. MIMIC-IV (Version 1.0). PhysioNet (2021). doi: 10.13026/s6n6-xd98
21. Pollard TJ, Johnson AEW, Raffa JD, Celi LA, Mark RG, Badawi O, et al. The eICU Collaborative Research Database, a Freely Available Multi-Center Database for Critical Care Research. Sci Data (2018) 5:180178. doi: 10.1038/sdata.2018.178
22. Lundberg SM, Erion G, Chen H, De Grave A, Prutkin JM, Nair B, et al. From Local Explanations to Global Understanding With Explainable AI for Trees. Nat Mach Intell (2020) 2:56–67. doi: 10.1038/s42256-019-0138-9
23. Ponikowski P, Voors AA, Anker SD, Bueno H, Cleland JG, Coats AJ, et al. [2016 ESC Guidelines for the Diagnosis and Treatment of Acute and Chronic Heart Failure]. Kardiol Polska (2016) 74:1037–147. doi: 10.5603/KP.2016.0141
24. Tabassian M, Sunderji I, Erdei T, Sanchez-Martinez S, Degiovanni A, Marino P, et al. Diagnosis of Heart Failure With Preserved Ejection Fraction: Machine Learning of Spatiotemporal Variations in Left Ventricular Deformation. J Am Soc Echocardiogr: Off Publ Am Soc Echocardiogr (2018) 31(12):1272–84.e9. doi: 10.1016/j.echo.2018.07.013
25. Sanchez-Martinez S, Duchateau N, Erdei T, Kunszt G, Aakhus S, Degiovanni A, et al. Machine Learning Analysis of Left Ventricular Function to Characterize Heart Failure With Preserved Ejection Fraction. Circ Cardiovasc Imaging (2018) 11:e007138. doi: 10.1161/CIRCIMAGING.117.007138
26. Mortazavi BJ, Downing NS, Bucholz EM, Dharmarajan K, Manhapra A, Li SX, et al. Analysis of Machine Learning Techniques for Heart Failure Readmissions. Circ Cardiovasc Qual Outcomes (2016) 9:629–40. doi: 10.1161/CIRCOUTCOMES.116.003039
27. Frizzell JD, Liang L, Schulte PJ, Yancy CW, Heidenreich PA, Hernandez AF, et al. Prediction of 30-Day All-Cause Readmissions in Patients Hospitalized for Heart Failure: Comparison of Machine Learning and Other Statistical Approaches. JAMA Cardiol (2017) 2:204–9. doi: 10.1001/jamacardio.2016.3956
28. Jing L, Ulloa Cerna AE, Good CW, Sauers NM, Schneider G, Hartzel DN, et al. A Machine Learning Approach to Management of Heart Failure Populations. JACC Heart Fail (2020) 8:578–87. doi: 10.1016/j.jchf.2020.01.012
29. Adler ED, Voors AA, Klein L, Macheret F, Braun OO, Urey MA, et al. Improving Risk Prediction in Heart Failure Using Machine Learning. Eur J Heart Fail (2020) 22:139–47. doi: 10.1002/ejhf.1628
30. Angraal S, Mortazavi BJ, Gupta A, Khera R, Ahmad T, Desai NR, et al. Machine Learning Prediction of Mortality and Hospitalization in Heart Failure With Preserved Ejection Fraction. JACC Heart Fail (2020) 8:12–21. doi: 10.1016/j.jchf.2019.06.013
31. Chicco D, Jurman G. Machine Learning can Predict Survival of Patients With Heart Failure From Serum Creatinine and Ejection Fraction Alone. BMC Med Informatics Decis Mak (2020) 20:16. doi: 10.1186/s12911-020-1023-5
32. Sjoding MW, Prescott HC, Wunsch H, Iwashyna TJ, Cooke CR.. Longitudinal Changes in ICU Admissions Among Elderly Patients in the United States. Crit Care Med (2016) 44:1353–60. doi: 10.1097/CCM.0000000000001664
33. World Health Organization Cardiovascular Disease Risk Charts: Revised Models to Estimate Risk in 21 Global Regions. Lancet Global Health (2019) 7:e1332–e45. doi: 10.1016/S2214-109X(19)30318-3
34. Viswanathan V, Jamthikar AD, Gupta D, Shanu N, Puvvula A, Khanna NN, et al. Low-Cost Preventive Screening Using Carotid Ultrasound in Patients With Diabetes. Front Biosci (Landmark Edition) (2020) 25:1132–71. doi: 10.2741/4850
35. Ogurtsova K, da Rocha Fernandes JD, Huang Y, Linnenkamp U, Guariguata L, Cho NH, et al. IDF Diabetes Atlas: Global Estimates for the Prevalence of Diabetes for 2015 and 2040. Diabetes Res Clin Pract (2017) 128:40–50. doi: 10.1016/j.diabres.2017.03.024
36. Defronzo RA. Banting Lecture. From the Triumvirate to the Ominous Octet: A New Paradigm for the Treatment of Type 2 Diabetes Mellitus. Diabetes (2009) 58:773–95. doi: 10.2337/db09-9028
37. Rosano GM, Vitale C, Seferovic P. Heart Failure in Patients With Diabetes Mellitus. Cardiac Fail Rev (2017) 3:52–5. doi: 10.15420/cfr.2016:20:2
38. Salluh JIF, Soares M. ICU Severity of Illness Scores: APACHE, SAPS and MPM. Curr Opin Crit Care (2014) 20:557–65. doi: 10.1097/MCC.0000000000000135
39. Le Gall JR, Lemeshow S, Saulnier F. A New Simplified Acute Physiology Score (SAPS II) Based on a European/North American Multicenter Study. JAMA (1993) 270:2957–63. doi: 10.1001/jama.270.24.2957
40. Arabi Y, Haddad S, Goraj R, Al-Shimemeri A, Al-Malik S. Assessment of Performance of Four Mortality Prediction Systems in a Saudi Arabian Intensive Care Unit. Crit Care (London England) (2002) 6:166–74. doi: 10.1186/cc1477
41. Khwannimit B, Geater A. A Comparison of APACHE II and SAPS II Scoring Systems in Predicting Hospital Mortality in Thai Adult Intensive Care Units. J Med Assoc Thailand = Chotmaihet Thangphaet (2007) 90:643–52.
42. Gupta R, Arora VK. Performance Evaluation of APACHE II Score for an Indian Patient With Respiratory Problems. Indian J Med Res (2004) 119:273–82.
43. Tempe A, Wadhwa L, Gupta S, Bansal S, Satyanarayana L. Prediction of Mortality and Morbidity by Simplified Acute Physiology Score II in Obstetric Intensive Care Unit Admissions. Indian J Med Sci (2007) 61:179–85. doi: 10.4103/0019-5359.31151
44. Zhang Z, Chen K, Chen L. APACHE III Outcome Prediction in Patients Admitted to the Intensive Care Unit With Sepsis Associated Acute Lung Injury. PLos One (2015) 10:e0139374. doi: 10.1371/journal.pone.0139374
45. Keegan MT, Gajic O, Afessa B. Comparison of APACHE IV, SAPS 3, and MPM0III and Influence of Resuscitation Status on Model Performance. Chest (2012) 142:851–8. doi: 10.1378/chest.11-2164
46. Lambden S, Laterre PF, Levy MM, Francois B. The SOFA Score-Development, Utility and Challenges of Accurate Assessment in Clinical Trials. Crit Care (London England) (2019) 23:374. doi: 10.1186/s13054-019-2663-7
47. Raith EP, Udy AA, Bailey M, McGloughlin S, MacIsaac C, Bellomo R, et al. Prognostic Accuracy of the SOFA Score, SIRS Criteria, and qSOFA Score for In-Hospital Mortality Among Adults With Suspected Infection Admitted to the Intensive Care Unit. JAMA (2017) 317:290–300. doi: 10.1001/jama.2016.20328
48. Adeva-Andany M, López-Ojén M, Funcasta-Calderón R, Ameneiros-Rodríguez E, Donapetry-García C, Vila-Altesor M, et al. Comprehensive Review on Lactate Metabolism in Human Health. Mitochondrion (2014) 17:76–100. doi: 10.1016/j.mito.2014.05.007
49. Del Prato S, Bonadonna RC, Bonora E, Gulli G, Solini A, Shank M, et al. Characterization of Cellular Defects of Insulin Action in Type 2 (non-Insulin-Dependent) Diabetes Mellitus. J Clin Invest (1993) 91:484–94. doi: 10.1172/JCI116226
50. Zannad F, Ferreira JP, Pocock SJ, Anker SD, Butler J, Filippatos G, et al. SGLT2 Inhibitors in Patients With Heart Failure With Reduced Ejection Fraction: A Meta-Analysis of the EMPEROR-Reduced and DAPA-HF Trials. Lancet (London England) (2020) 396:819–29. doi: 10.1016/S0140-6736(20)31824-9
51. Zelniker TA, Wiviott SD, Raz I, Im K, Goodrich EL, Bonaca MP, et al. SGLT2 Inhibitors for Primary and Secondary Prevention of Cardiovascular and Renal Outcomes in Type 2 Diabetes: A Systematic Review and Meta-Analysis of Cardiovascular Outcome Trials. Lancet (London England) (2019) 393:31–9. doi: 10.1016/S0140-6736(18)32590-X
Keywords: heart failure, diabetes, machine learning, hospital mortality, indicator
Citation: Yang B, Zhu Y, Lu X and Shen C (2022) A Novel Composite Indicator of Predicting Mortality Risk for Heart Failure Patients With Diabetes Admitted to Intensive Care Unit Based on Machine Learning. Front. Endocrinol. 13:917838. doi: 10.3389/fendo.2022.917838
Received: 11 April 2022; Accepted: 11 May 2022;
Published: 29 June 2022.
Edited by:
Ying Xin, Jilin University, ChinaReviewed by:
Matsumoto Kotaro, Kurume University, JapanNickolas Savarimuthu, National Institute of Technology, Tiruchirappalli, India
Copyright © 2022 Yang, Zhu, Lu and Shen. This is an open-access article distributed under the terms of the Creative Commons Attribution License (CC BY). The use, distribution or reproduction in other forums is permitted, provided the original author(s) and the copyright owner(s) are credited and that the original publication in this journal is cited, in accordance with accepted academic practice. No use, distribution or reproduction is permitted which does not comply with these terms.
*Correspondence: Chengxing Shen, shencx@sjtu.edu.cn; Xia Lu, 18851730292@163.com
†These authors have contributed equally to this work and share first authorship