 Nan Wang
 Jie Zhang
 Chaonan Fei
 Ye Ding
 Li Yang
 Peibei Duan
- 1School of Nursing, Nanjing University of Chinese Medicine, Nanjing, China
- 2Department of Nursing, Jiangsu Province Hospital of Chinese Medicine, Affiliated Hospital of Nanjing University of Chinese Medicine, Nanjing, China
- 3Department of Oncology, Jiangsu Province Hospital of Chinese Medicine, Affiliated Hospital of Nanjing University of Chinese Medicine, Nanjing, China
- 4Department of Endocrinology, Jiangsu Province Hospital of Chinese Medicine, Affiliated Hospital of Nanjing University of Chinese Medicine, Nanjing, China
Background: Postoperative hyperglycemia (POH) is a common metabolic complication in non-diabetic patients undergoing surgery for gastric cancer, and it significantly increases the risk of adverse outcomes. However, current prediction models primarily rely on a limited set of perioperative variables and conventional statistical methods, which often lack accuracy and generalizability. This study aimed to develop and validate a machine learning-based model for the early prediction of POH risk in non-diabetic patients following radical gastrectomy.
Methods: This single-center, retrospective cohort study included 393 non-diabetic patients who underwent radical gastrectomy for gastric cancer between March 2021 and September 2024. A total of 38 perioperative clinical features covering preoperative, intraoperative, and early postoperative periods were collected. The primary outcome was POH, defined as a fasting venous plasma glucose level ≥ 7.8 mmol/L within 24 hours post-surgery. Nine machine learning algorithms, including Support Vector Machine with a radial basis function kernel (SVM-radial), Random Forest, XGBoost, and Logistic Regression, were developed and compared. Model performance was evaluated using accuracy, the area under the receiver operating characteristic curve (AUC), recall, and F1-score. Shapley Additive Explanations (SHAP) analysis was employed to interpret the model and identify key predictive factors.
Results: The incidence of POH was 42.7%. Among all models, the SVM-radial model achieved the best test-set performance (AUC = 0.758, accuracy = 0.724, F1 = 0.743, recall = 0.750, Brier score = 0.186, calibration slope = 1.07).The model exhibited excellent discrimination, predictive accuracy, and probability calibration, indicating strong generalization capabilities and potential clinical utility. Seven key predictors were identified: operation duration, nutritional risk score, sex, surgical approach 2 (robotic surgery), preoperative fasting blood glucose, thrombosis risk score, and alkaline phosphatase. SHAP analysis confirmed the non-linear contributions of these features to POH risk and supported their interpretability for clinical decision-making.
Conclusion: A novel machine learning-based model, utilizing multi-dimensional perioperative features, can accurately predict the risk of POH in non-diabetic patients with gastric cancer. The SVM-radial model demonstrated superior predictive performance and clinical interpretability, providing a viable tool for early risk stratification and personalized glycemic management in the surgical setting.
1 Introduction
Gastric cancer is the fifth most commonly diagnosed malignancy and the third leading cause of cancer-related death worldwide, with approximately 1.1 million new cases and 770,000 deaths annually, representing a major global public health challenge (1, 2). Epidemiological data indicate that Asia bears roughly 60% of the global burden, with China exhibiting the highest incidence and mortality rates (3). Despite advances in radical surgical techniques and widespread adoption of multidisciplinary treatment strategies (4), postoperative complications remain a critical determinant of both short- and long-term outcomes, with reported incidence rates of approximately 12% (5).
POH, a common metabolic response after radical gastrectomy, frequently occurs in patients without pre-existing diabetes and tends to be underestimated in clinical practice. Studies have reported that approximately 55.5% of non-diabetic gastric cancer patients experience postoperative blood glucose levels exceeding 126 mg/dL, with severe hyperglycemia (>200 mg/dL) occurring in 6.3% of cases (6). Compared with normoglycemic patients, those with POH demonstrate significantly higher complication rates (63.6% vs. 13%), as well as reduced 5-year overall survival (45% vs. 57%) and disease-free survival (46% vs. 68%) (7, 8). The underlying mechanisms involve stress-induced counter-regulatory hormone release, enhanced inflammatory responses, and insulin resistance (9, 10). Notably, non-diabetic patients with comparable hyperglycemia exhibit worse prognoses than diabetic counterparts, suggesting that POH may reflect more profound physiological dysregulation (11).
Current POH risk assessment tools primarily rely on traditional statistical models. For example, the postoperative complication model developed by Dong et al. (12) does not specifically target non-diabetic populations, while the logistic regression model by Wang et al. (13) is limited to preoperative and intraoperative variables, without incorporating critical postoperative factors. Most existing models employ linear regression (14, 15), which is inherently limited in capturing nonlinear relationships, variable interactions, and dynamic risk profiles. Furthermore, no standardized prediction tool tailored for POH in non-diabetic gastric cancer patients has been established, leading to reliance on empirical judgment in clinical practice and limiting the effectiveness of personalized interventions.
Recently, machine learning (ML) techniques have demonstrated superior performance over conventional statistical methods in early diagnosis and risk prediction (16). ML algorithms offer advantages such as high-dimensional data processing, nonlinear pattern recognition, and real-time predictive capability, and have been effectively applied to forecast perioperative complications including infection, thrombosis, and malnutrition (17–19). However, the application of ML for predicting POH in gastric cancer patients remains limited, with few high-performing and interpretable models specifically tailored to non-diabetic populations.
Considering the unique characteristics of Chinese gastric cancer patients—including distinct genetic backgrounds, dietary habits, and surgical practices—developing a locally adapted POH risk prediction model is of significant clinical relevance.
1.1 Study hypothesis
We hypothesize that machine learning algorithms can accurately predict POH by integrating multidimensional clinical data, outperforming traditional statistical approaches and identifying key risk factors. Based on this hypothesis, the present study aims to construct a POH risk prediction model for non-diabetic gastric cancer patients using multiple machine learning algorithms. By incorporating preoperative, intraoperative, and early postoperative variables, the model seeks to enable early identification, support precise clinical stratification and targeted interventions, and ultimately improve perioperative care and long-term patient outcomes.
2 Methods
2.1 Study design and patient selection
This was a single-center, retrospective cohort study based on real-world data. Eligible patients were non-diabetic individuals who underwent radical gastrectomy for gastric cancer at Jiangsu Province Hospital of Chinese Medicine between March 2021 and September 2024. The study protocol was approved by the Institutional Ethics Committee (approval date: April 14, 2025). Due to the retrospective nature of the study, the requirement for informed consent was waived.
Inclusion criteria were as follows:
1. Age ≥ 18 years;
2. Pre- or postoperative pathological diagnosis of gastric malignancy;
3. Underwent radical gastrectomy;
4. No prior history of diabetes mellitus.
Exclusion criteria included:
1. Patients were excluded if they met any of the following conditions;
2. had a history of other primary malignant tumors;
3. received preoperative medications affecting glucose metabolism (e.g., corticosteroids);
4. had missing key clinical data exceeding 20%.
As shown in Figure 1, 502 patients were screened, and after exclusions, 393 were included and randomly split into training and test sets.
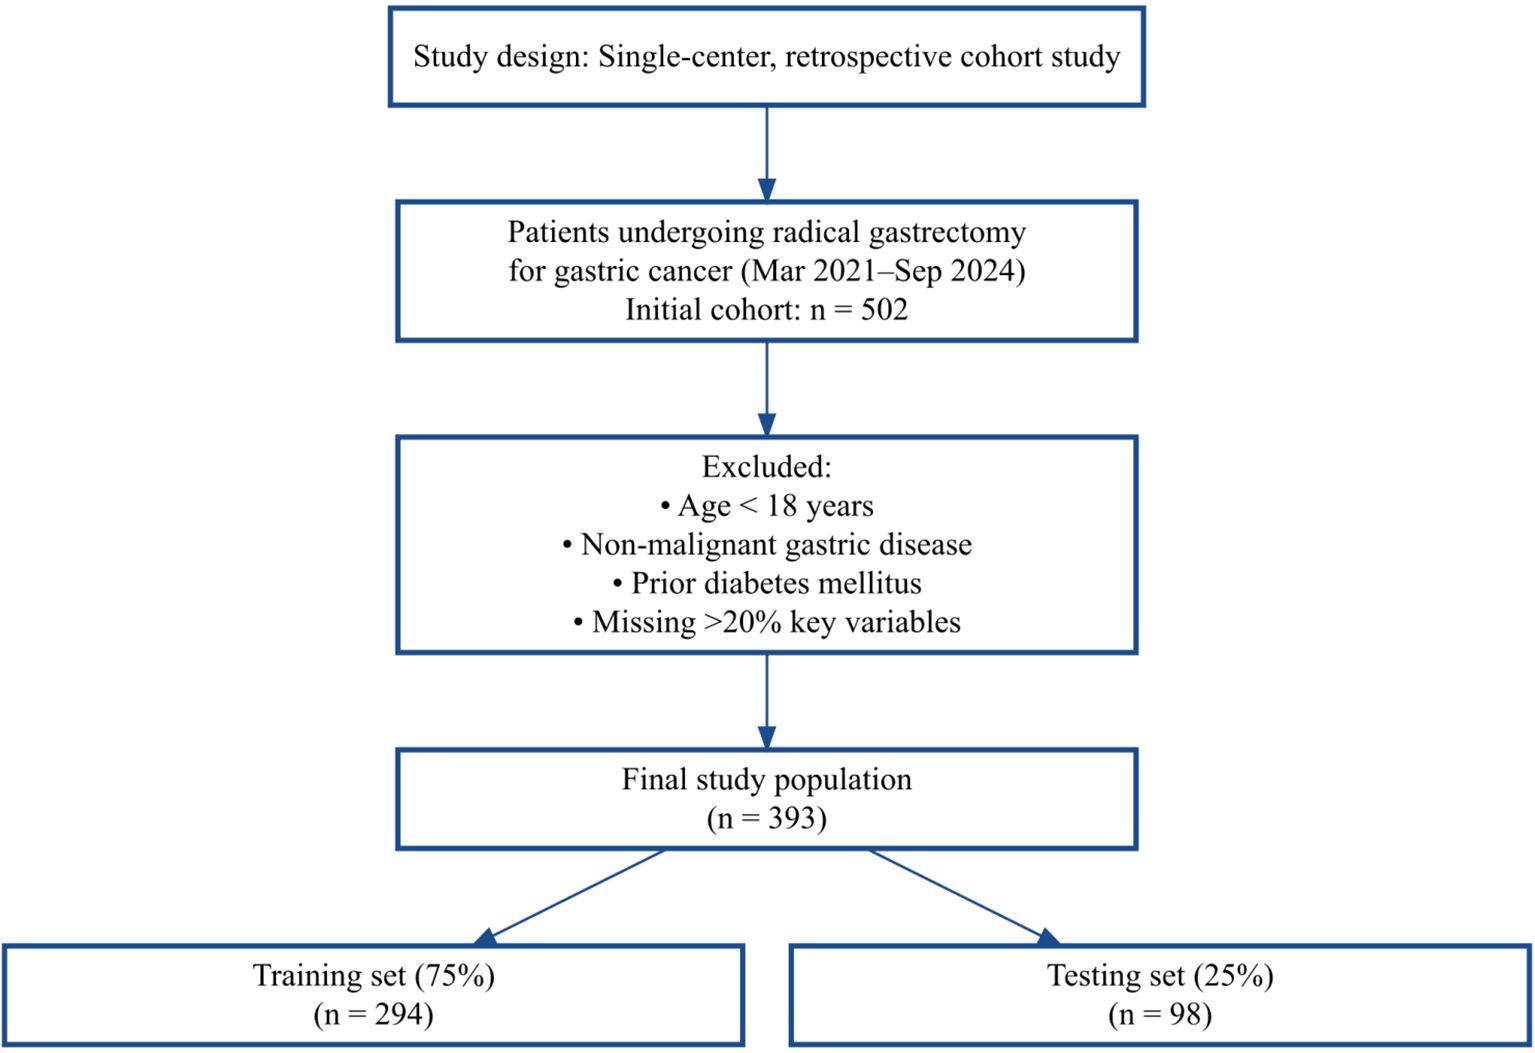
Figure 1. Flowchart of patient enrollment and inclusion/exclusion criteria.
2.2 Primary outcome
In accordance with established diagnostic criteria (10, 20), POH was defined as a fasting venous plasma glucose level ≥ 7.8 mmol/L within 24 hours post-surgery. This time point was selected based on prior evidence indicating that glucose levels typically peak within 24 hours after surgery (21). Venous plasma samples were used to minimize measurement bias compared to bedside glucose monitoring.
2.3 Data collection
Two trained researchers independently extracted patient data from the hospital’s electronic medical record (EMR) system. A double-entry method was used, and any discrepancies were resolved through discussion or adjudication by a third reviewer. A total of 38 demographic and clinical variables were collected.
2.3.1 Demographic variables
Sex, age, body mass index (BMI), smoking status, alcohol consumption, family history of diabetes.
2.3.2 Medical history
Hypertension, coronary artery disease, history of stroke, anemia (hemoglobin < 120 g/L for men, < 110 g/L for women), and hypoalbuminemia (albumin < 35 g/L).
2.3.3 Preoperative laboratory data
White blood cell count, red blood cell count, hemoglobin, platelet count, neutrophil count, lymphocyte count, aspartate aminotransferase (AST), alanine aminotransferase (ALT), total protein, albumin, alkaline phosphatase (ALP), γ-glutamyl transferase (GGT), total bilirubin, direct bilirubin, fasting blood glucose(FBG), and carcinoembryonic antigen (CEA).
2.3.4 Preoperative scores
Nutritional Risk Screening 2002 (NRS2002) and Padua Prediction Score (PPS) for venous thromboembolism (VTE) risk, hereafter referred to as the Thrombosis Risk Score.
2.3.5 Surgical variables
Surgical Approach (laparoscopic, open, robotic), American Society of Anesthesiologists (ASA) classification, operative duration, intraoperative blood loss, fluid administration, and intraoperative use of corticosteroids and anesthetic agents (e.g., propofol, sufentanil, lidocaine).
2.3.6 Postoperative variables
Nutritional support modality (enteral nutrition [EN], parenteral nutrition [PN], or a combination of EN and PN).
2.4 Missing data handling
To ensure data completeness, cases with more than 20% missing values in key variables were excluded. For the remaining cases, any record with missing data was removed, resulting in a final dataset of 393 patients for analysis. This approach ensured that all included cases had complete data, thereby avoiding any potential impact of missing values on the results.
2.5 Data preprocessing
Categorical variables, such as Surgical Approach, ASA classification, and type of nutritional support, were one-hot encoded; multi-label features, including intraoperative anesthetic use, were binarized; continuous variables were standardized using z-scores.
2.6 Feature selection and model development
2.6.1 Statistical analysis
Given the large sample size in this study (n = 393) and based on the central limit theorem (CLT), continuous variables were assumed to be approximately normally distributed. Continuous variables are presented as mean ± standard deviation and compared using independent-samples z-tests. Categorical variables are presented as counts and percentages, and compared using χ² or Fisher’s exact tests, as appropriate. Relationships between continuous variables were assessed using Pearson correlation analysis.
2.6.2 Data splitting
The dataset was randomly divided into a train set (75%) and a test set (25%) using stratified sampling to preserve the distribution of the outcome variable. The train set was used for feature selection, model train, and hyperparameter tuning, while the test set was reserved for the final model evaluation.
2.6.3 Feature selection
Feature selection was first performed using LASSO logistic regression with L1 regularization (C = 0.1), retaining only variables with non-zero coefficients. These selected variables were then subjected to stepwise multivariate logistic regression, removing variables with P > 0.05 to determine the significant predictors. The coefficients of the variables selected by LASSO are presented in Supplementary Figure S1, providing a visual representation of each feature’s contribution to the model.
2.6.4 Machine learning models
Using the final feature set, nine machine learning models were developed:
Logistic Regression (LR)
LASSO Logistic Regression (LR with LASSO)
k-Nearest Neighbors (KNN)
Linear Support Vector Machine (SVM linear)
the SVM-radial model
Decision Tree
Random Forest
Extreme Gradient Boosting (XGBoost)
Light Gradient Boosting Machine (LightGBM)
2.6.5 Hyperparameter tuning
Hyperparameter optimization was performed using the Optuna framework, combining Bayesian optimization with 5-fold cross-validation. AUC was used as the primary performance metric to select the optimal hyperparameter set.
2.7 Model evaluation and interpretability analysis
Model performance was evaluated using AUC, accuracy, precision, recall, and F1 score. Receiver operating characteristic (ROC) curves and calibration plots were generated to assess model discrimination and calibration. Calibration performance was further quantified using the calibration slope, and Brier score. SHAP analysis was performed to quantify the contribution of each predictor to the model output, thereby enhancing model interpretability and clinical applicability.
All data processing and model development were conducted using Python version 3.11. All statistical tests were two-sided, and a P value ≤ 0.05 was considered statistically significant.
3 Results
3.1 Baseline characteristics
A total of 393 non-diabetic patients who underwent radical gastrectomy for gastric cancer were included in the study. Of these, 294 were allocated to the train set and 99 to the test set. The overall incidence of POH was 42.7% (168/393). As shown in Table 1, there were no statistically significant differences in demographic or baseline clinical characteristics between the train and test sets (all P > 0.05), indicating that the two cohorts were comparable.
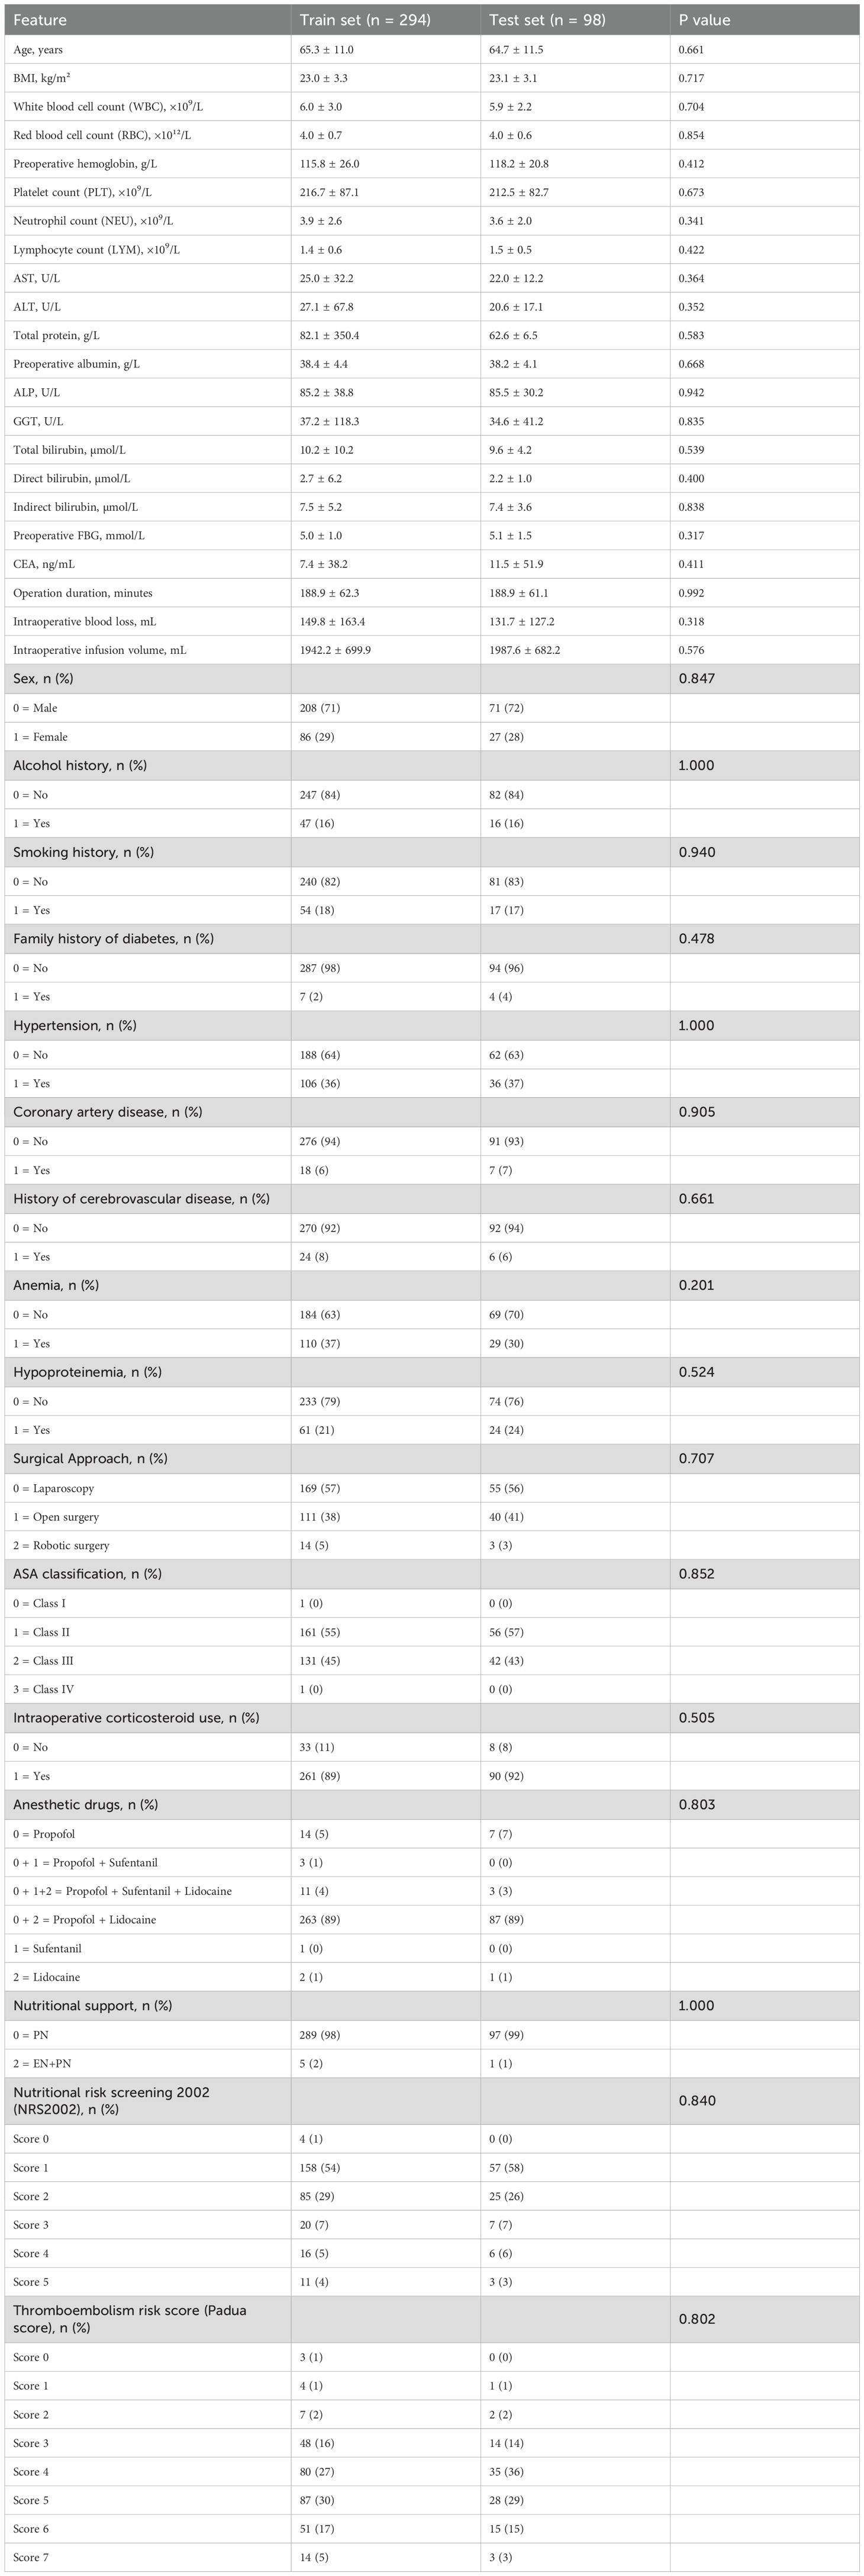
Table 1. summarizes the baseline characteristics of the patients.
3.2 Feature selection and model construction
From the initial 38 candidate variables, seven potential predictors were identified through a combination of LASSO logistic regression and multivariable analysis: operation duration, preoperative fasting blood glucose, nutritional risk score, Sex, thrombosis risk score, ALP, and Surgical Approach 2 (robotic surgery).
To quantify the independent association of these variables with POH, a multivariable logistic regression analysis was performed. The results showed that operation duration (OR: 1.011, 95% CI: 1.006–1.016, P < 0.001), preoperative fasting blood glucose (OR: 1.328, 95% CI: 1.011–1.745, P = 0.042), nutritional risk score (OR: 1.373, 95% CI: 1.070–1.762, P = 0.013), Sex (OR: 2.518, 95% CI: 1.399–4.532, P = 0.002), thrombosis risk score (OR: 1.289, 95% CI: 1.048–1.585, P = 0.016), ALP (OR: 1.010, 95% CI: 1.001–1.019, P = 0.036), and Surgical Approach 2(Robotic surgery) (OR: 0.166, 95% CI: 0.039–0.709, P = 0.015) were independently associated with the occurrence of POH.
3.3 Nomogram construction and evaluation
To facilitate clinical application of our logistic regression model, we developed a nomogram (Figure 2). This nomogram is not a new model, but a visual tool that translates complex regression coefficients into an intuitive scoring system. Each predictor is assigned points proportional to its regression coefficient, reflecting its relative impact on the model output. Clinicians sum the points to obtain a total score, which is then mapped to the predicted risk probability, corresponding exactly to the model’s output. This mapping ensures that the nomogram preserves the quantitative relationships between the regression coefficients and the machine learning model predictions, allowing accurate individualized risk assessment.
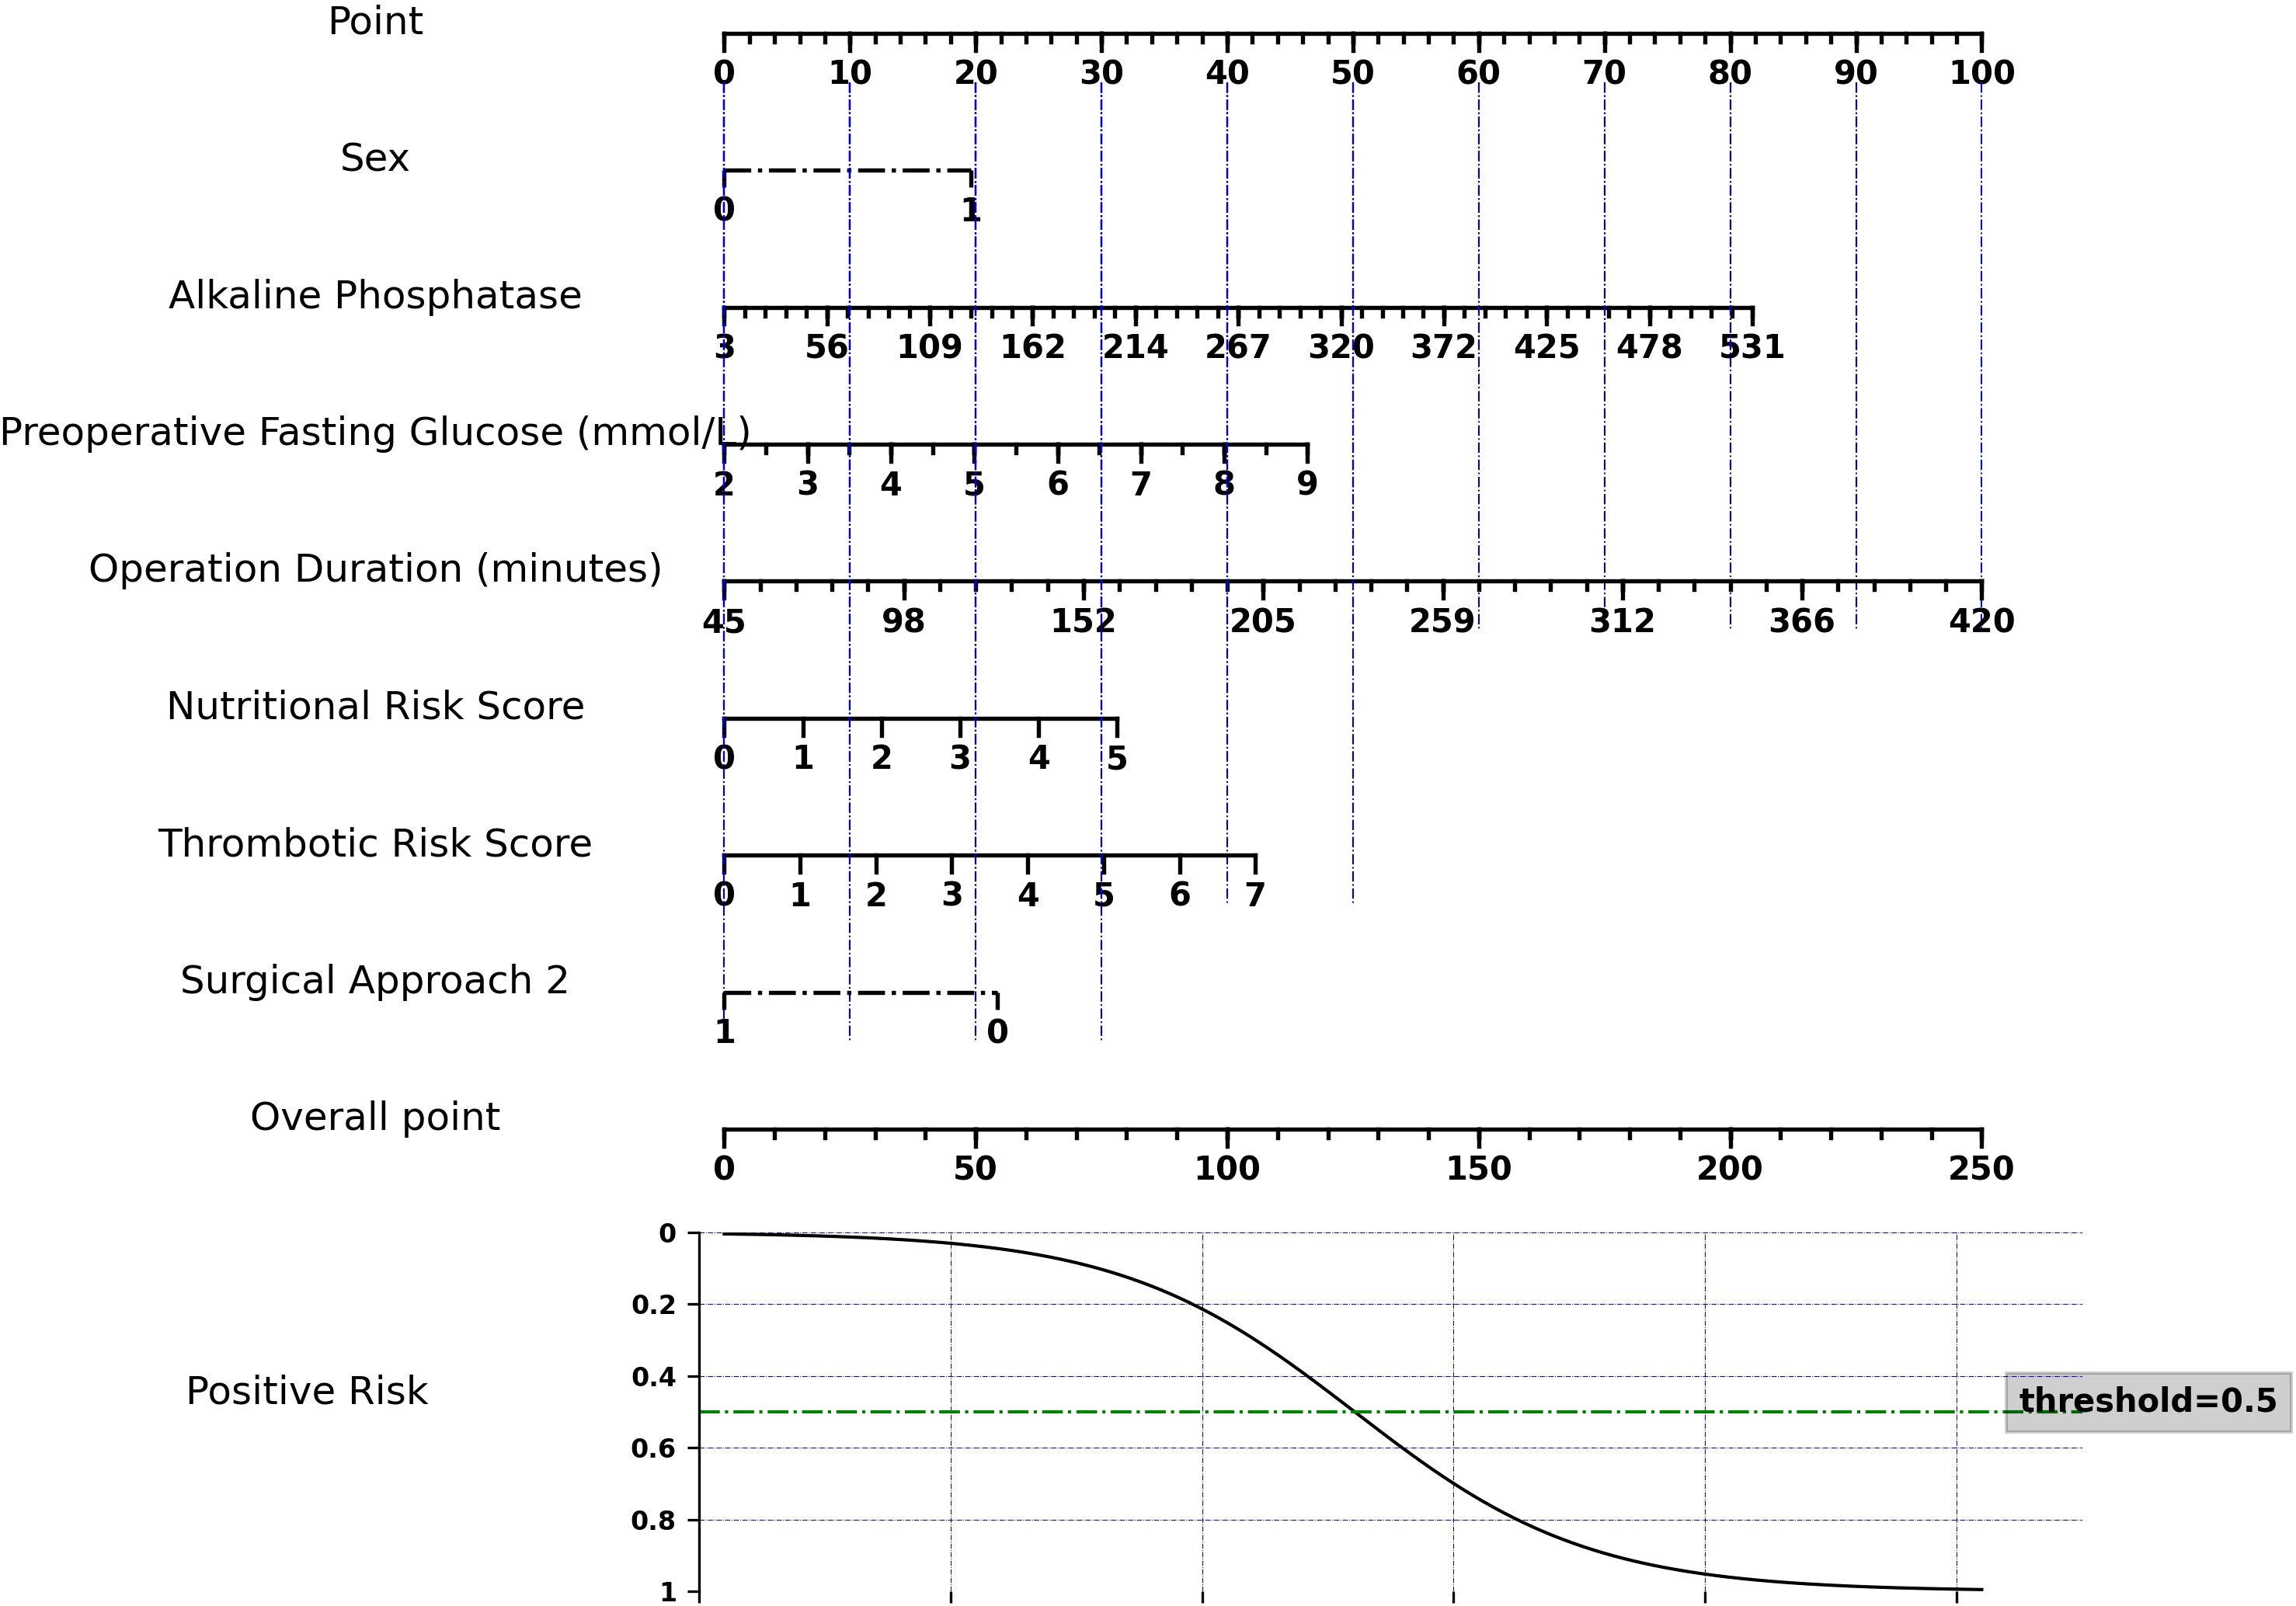
Figure 2. Nomogram for predicting the risk of POH risk in non-diabetic gastric cancer patients.
The model showed robust performance: AUC = 0.734 (train set) and 0.728 (test set), Brier score = 0.192, and calibration slope = 1.22, indicating good agreement between predicted and observed outcomes. Decision curve analysis confirmed that the nomogram provides significant clinical net benefit across a wide range of threshold probabilities (Supplementary Figure S2).
3.4 Machine learning model performance analysis
A comprehensive comparison of the performance across nine machine learning models is presented in Table 2. Overall, ensemble algorithms based on trees demonstrated outstanding performance on the train dataset, with Random Forest, XGBoost, and Decision Tree models all achieving perfect AUC (1.0), while LightGBM attained an impressive AUC of 0.987. However, such near-perfect train set performance often implies overfitting risks—models may have learned specific noise within the data rather than generalizable patterns. Figure 3 displays the ROC curves for all nine ML models on both the training and test datasets, providing a visual comparison of their discriminative performance and potential overfitting patterns.
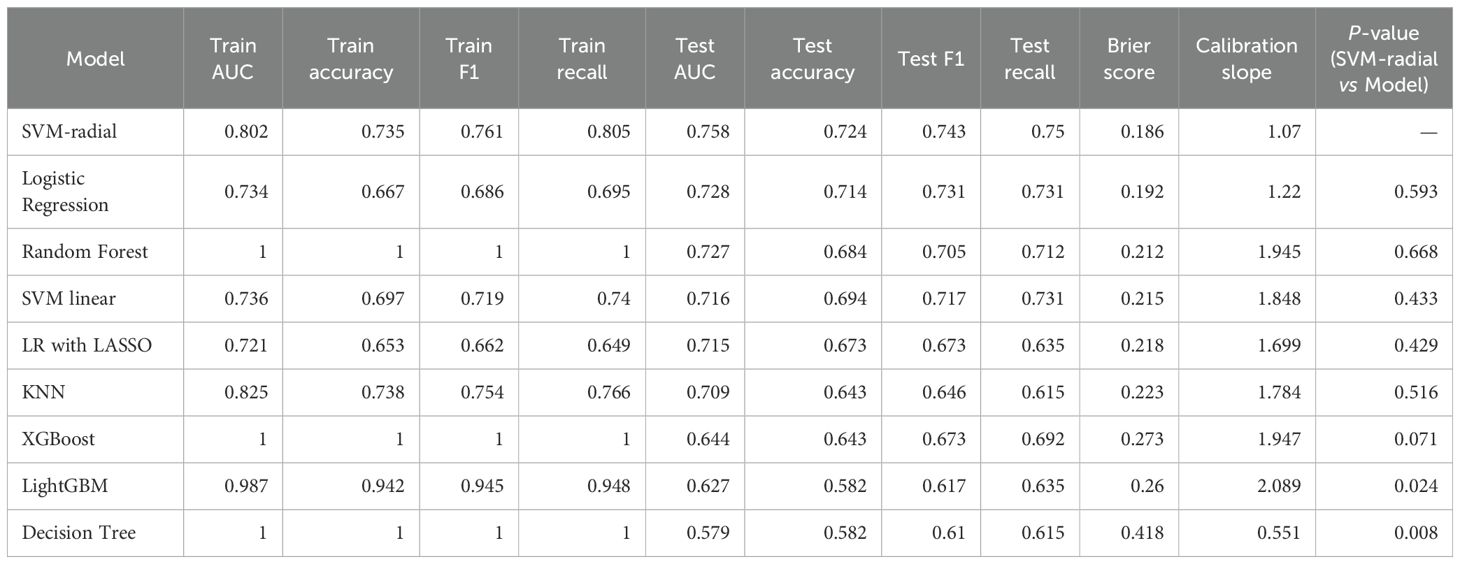
Table 2. Performance comparison of different machine learning models in train and test datasets.
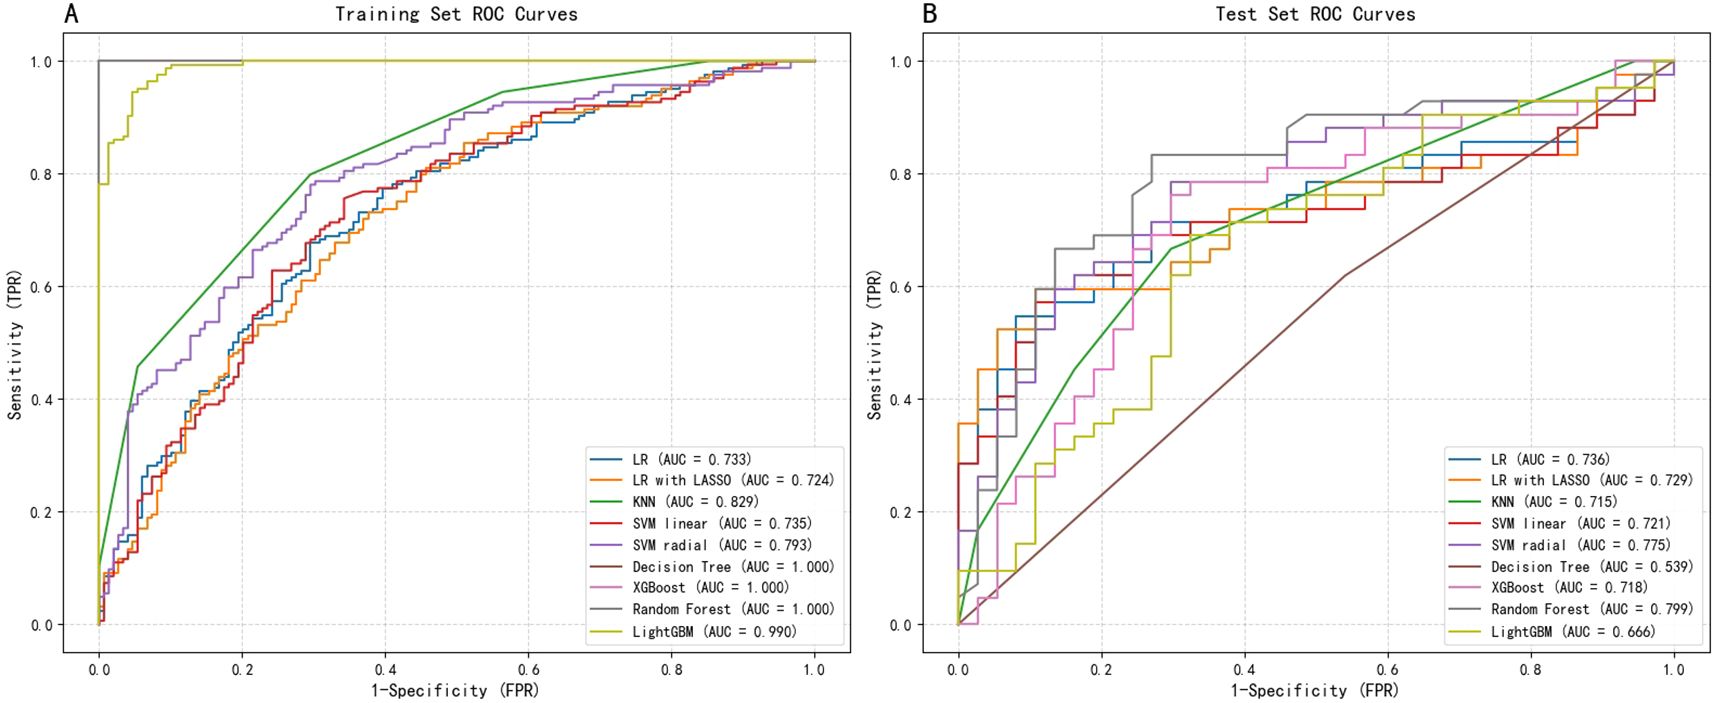
Figure 3. ROC curves for machine learning models on (A) train set and (B) test set.
To address this, we further strengthened internal validation, focusing on model stability and generalization capability. Taking the SVM-radial basis function model as an example, we conducted 10-fold cross-validation on the train set. Results revealed consistent performance across folds, with an average AUC of 0.737 ± 0.074, average accuracy of 0.717 ± 0.063, and average recall of 0.811 ± 0.124. This stable and balanced performance indicates the SVM model strikes a favorable equilibrium between fitting capability and generalization ability, thereby alleviating concerns about overfitting.
However, the true test of the model lies in the independent test set. test results revealed that the SVM-radial basis function model demonstrated the strongest generalization ability, achieving the highest AUC (0.758) and exhibiting robust discriminatory power. Conversely, models that performed perfectly on the train set (such as the decision tree, with a test AUC of 0.579) showed a significant decline in performance on the test set, once again reflecting their overfitting issues.
In clinical predictive applications, recall serves as a critical metric for evaluating a model’s ability to identify all high-risk patients. As shown in Table 2, the SVM-radial basis function model also achieved the highest recall (0.75) on the test set, particularly crucial in early-stage risk screening scenarios emphasizing high sensitivity.
Finally, we employed the DeLong test to compare the AUC differences between each model and the SVM-radial basis function model (column of Table 2). Results indicate no statistically significant difference between the SVM model and other high-performing models (e.g., Logistic Regression, p=0.593). Considering the SVM model’s highest AUC and recall on the test set alongside its stable cross-validation performance, it was ultimately selected as the optimal predictive model. This choice achieves the best equilibrium between discriminative capability and sensitivity towards high-risk patients.
3.5 Model explainability analysis
To conduct an in-depth analysis and validate the internal decision-making mechanisms of the optimal SVM model, we employed the SHAP framework for interpretability analysis (Figure 4).
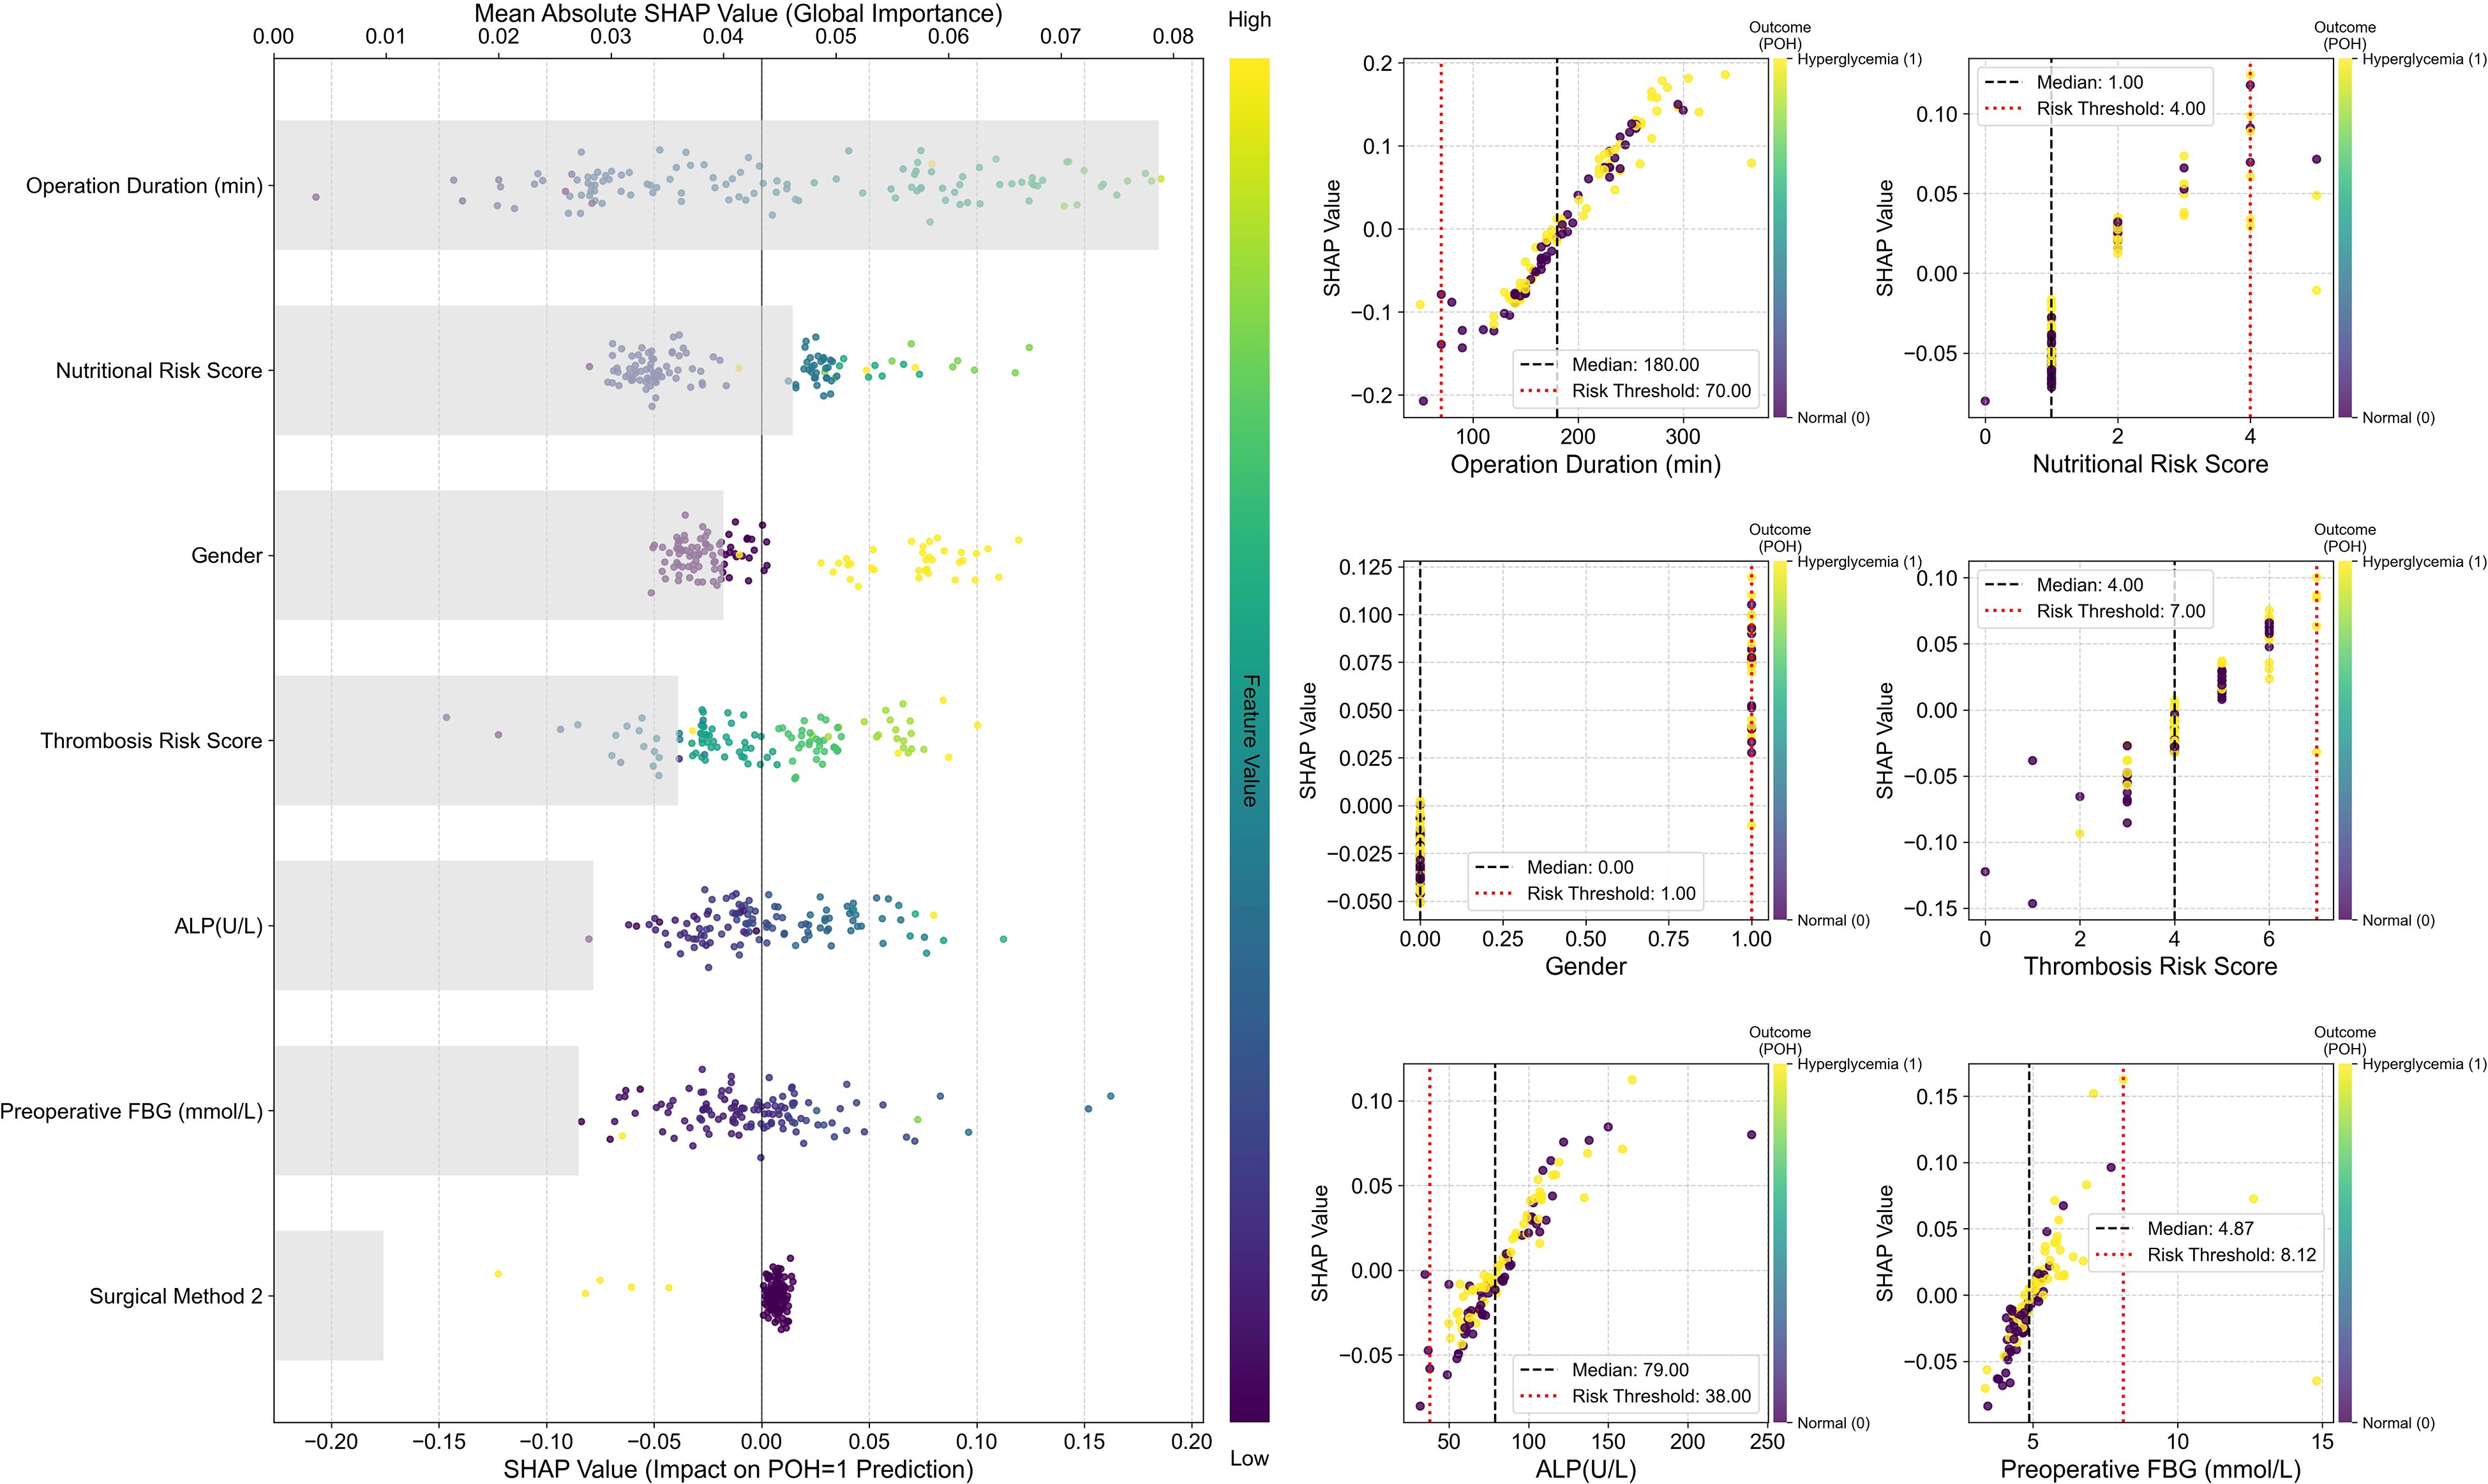
Figure 4. SHAP interpretability analysis of the optimal SVM model. Left: SHAP Summary Plot. The vertical axis ranks all predictors from highest to lowest global importance (mean absolute SHAP value); the horizontal axis displays SHAP values, quantifying each feature’s contribution to each prediction. Positive values indicate a push towards Postoperative hyperglycemia (POH = 1), while negative values indicate a push towards normal blood glucose. The color of each point indicates the magnitude of the corresponding feature value in that sample (defined by the color bar on the right: yellow/green denotes high values, purple/blue denotes low values). Right: SHAP Dependence Plots. Each subplot displays the raw feature value on the x-axis and its SHAP value on the y-axis. The color of each point indicates the sample’s actual outcome: yellow denotes hyperglycemia (Outcome=1), purple denotes no hyperglycemia (Outcome=0).
The global feature importance plot (SHAP Summary Plot) on the left indicates that Operation Duration exerts the most significant influence on model predictions, followed sequentially by Nutritional Risk Score, Sex, Thrombosis Risk Score, ALP, and FBG. The dependency plot indicates that high-value samples (yellowish color) correspond to positive SHAP values for these features, suggesting that longer operation duration, higher nutritional and thrombosis risk scores, and elevated ALP and preoperative blood glucose levels significantly increase the predicted risk of POH. Conversely, SHAP values for Surgical Approach 2 cluster in the negative region, suggesting a potential protective effect within the model.
The SHAP Dependence Plots on the right further reveal local patterns and clinical threshold characteristics in the model’s predictions. Results indicate that POH risk does not increase linearly but undergoes abrupt changes at critical thresholds: SHAP values rise significantly when operating time exceeds 180 minutes or nutritional/thrombotic risk scores reach ≥4 points. Additionally, the model identified a risk threshold range for preoperative fasting blood glucose: risk begins to increase when FBG > 4.87 mmol/L and rises sharply beyond 8.12 mmol/L.
Overall, SHAP analysis validated the model’s predictive logic as highly consistent with clinical understanding, while quantifying the intensity and thresholds of key risk factors. This significantly enhances the model’s interpretability and clinical utility.
3.6 SVM model decision curve and risk stratification
To translate the SVM-radial model’s predictions into a clinically actionable tool, we developed a risk stratification system based on the model’s performance on the test set. ROC curves analysis demonstrated the model’s favorable discriminatory capability, with an AUC of 0.758 (Figure 5A). The optimal statistical threshold determined by Youden’s index was a predicted probability of 0.507.
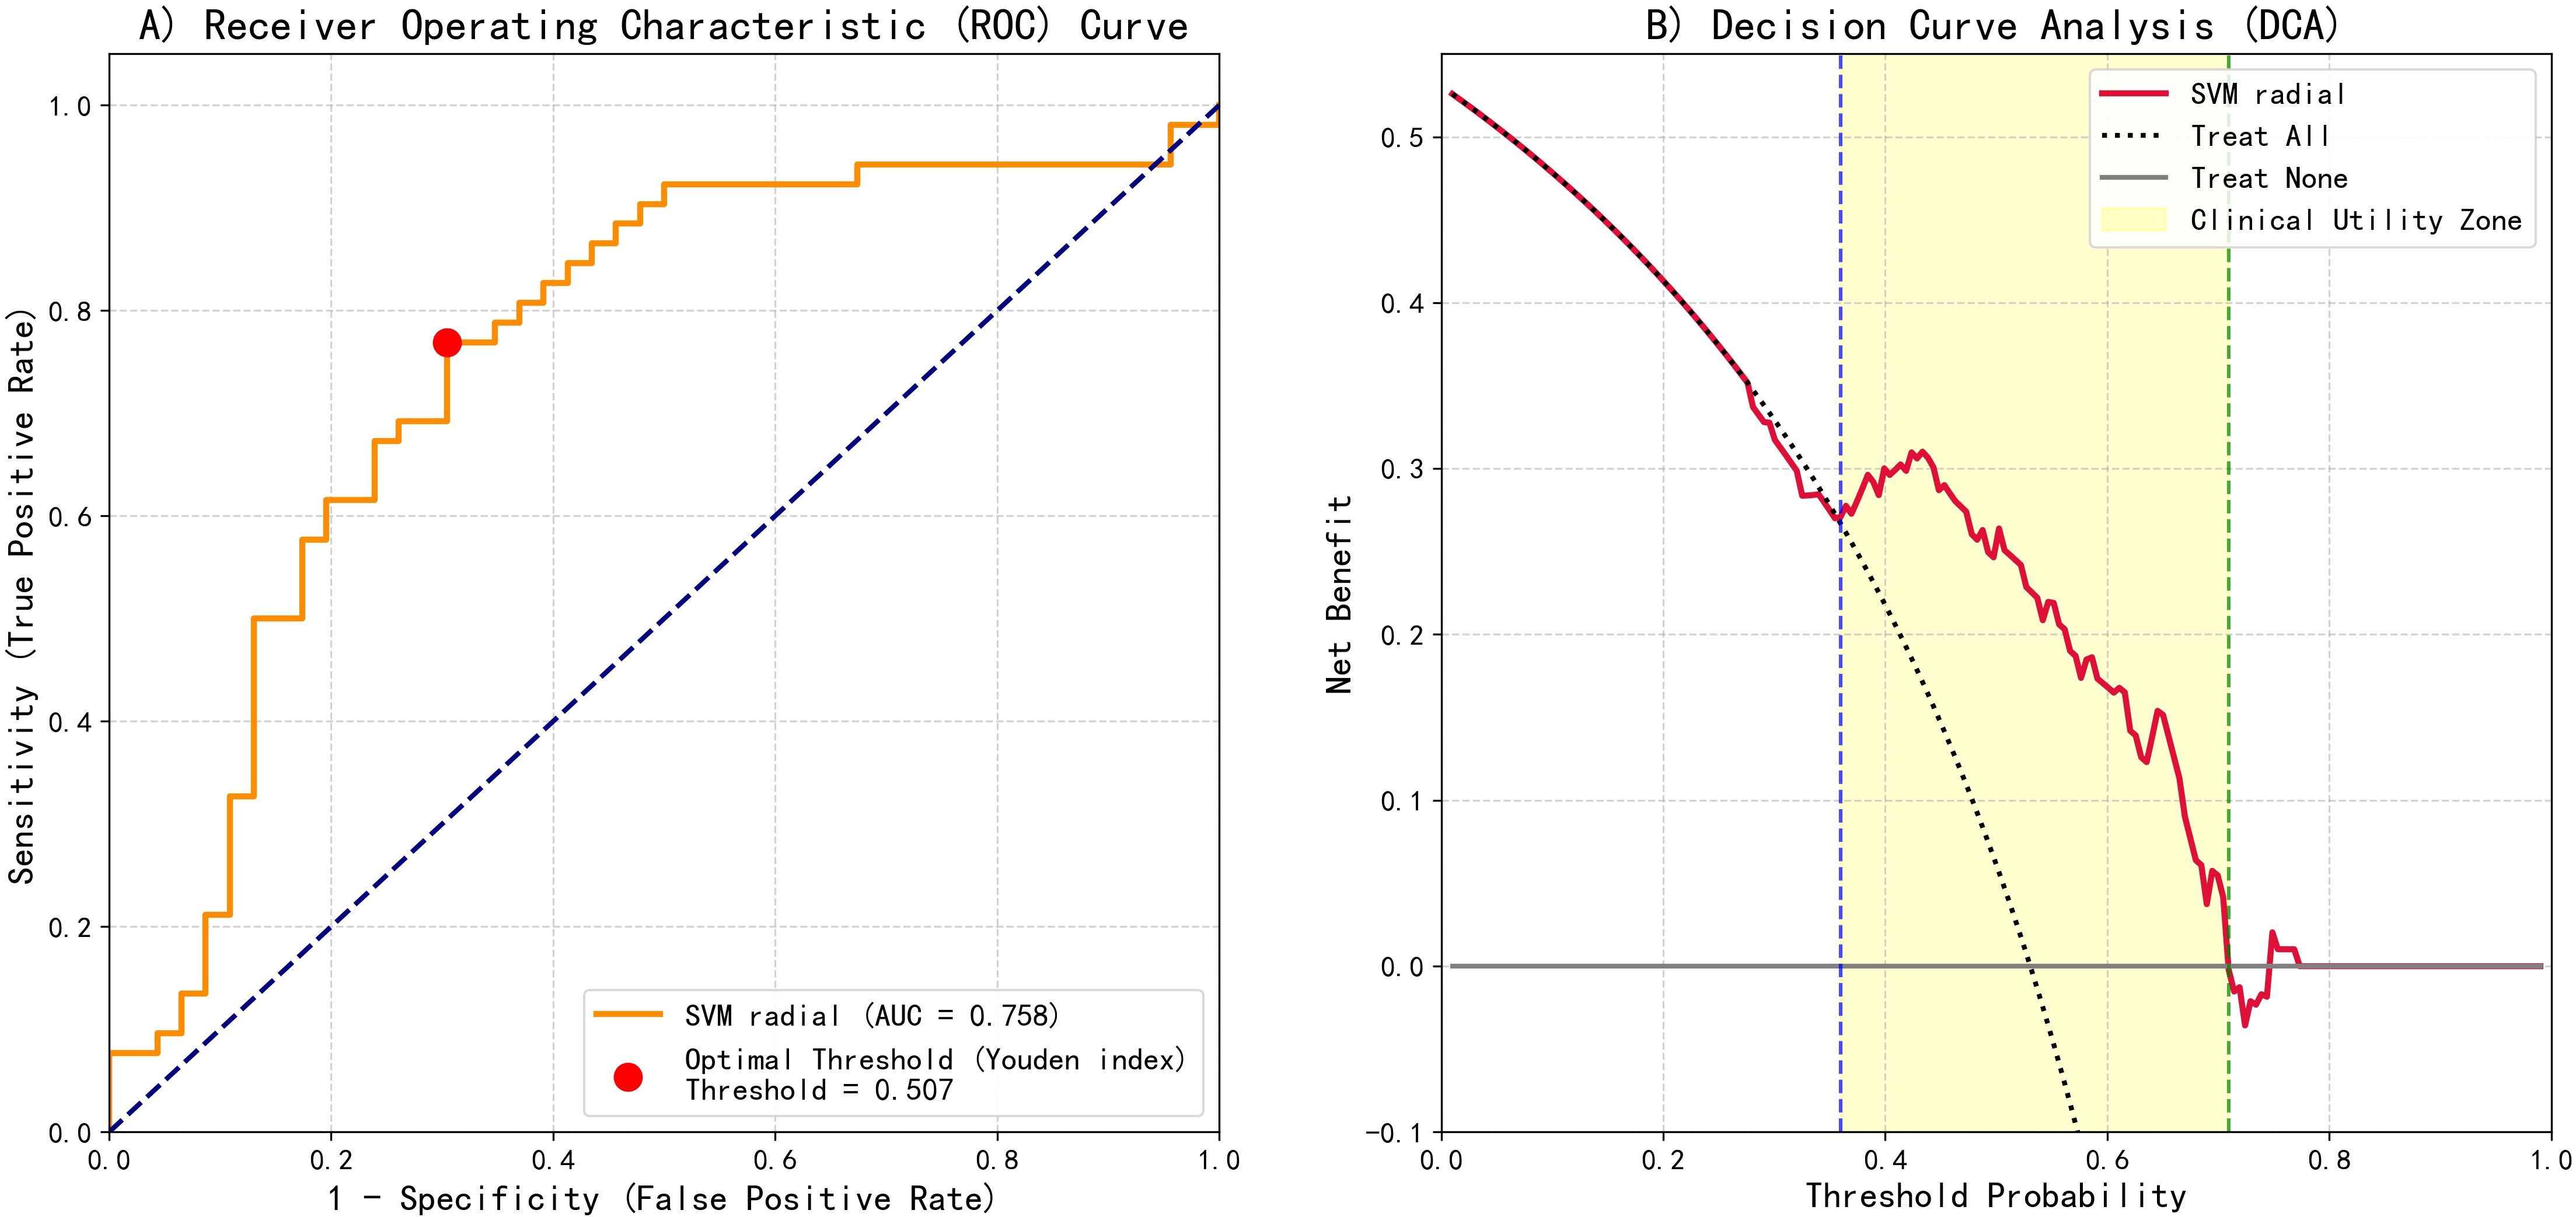
Figure 5. SVM-radial basis function model predictive performance evaluation: ROC and DCA. (A) ROC curve showing the optimal threshold (Youden index = 0.507) and AUC = 0.758. (B) DCA illustrating clinical net benefit compared with "treat-all" and "treat-none" strategies.
Furthermore, decision curve analysis (DCA) was conducted to assess clinical net benefit (Figure 5B). DCA results indicated positive clinical net benefit within the threshold probability range of 0.36 to 0.71.
Based on the aforementioned analysis, a three-tier risk stratification was established: low risk (< 0.30), intermediate risk (0.30–0.60), and high risk (≥ 0.60).
4 Discussion
In this study, we constructed and validated a machine learning model for predicting POH based on real-world clinical data from 393 non-diabetic patients undergoing radical gastrectomy. Among nine machine learning algorithms, the SVM-radial model demonstrated the highest predictive performance. SHAP interpretability analysis identified seven key predictors: operative duration, nutritional risk score (NRS), Sex, Surgical Approach type 2, preoperative fasting blood glucose, thrombotic risk score, and ALP.
POH was defined in this study as fasting blood glucose ≥ 7.8 mmol/L within 24 hours postoperatively. This definition may underestimate transient hyperglycemia induced by intraoperative or postoperative stress responses, thereby introducing potential misclassification bias. Fasting blood glucose was selected due to its standardizable measurement, high clinical feasibility, and relative independence from other perioperative confounders. Future studies may consider incorporating continuous or point-of-care glucose monitoring to more comprehensively reflect intraoperative and immediate postoperative glycemic dynamics (22).
To our knowledge, this represents the first study applying machine learning methods to predict POH risk in non-diabetic gastric cancer patients. By integrating 38 perioperative features—encompassing baseline characteristics, physiological indicators, surgical variables, and early postoperative data—we constructed a dynamic, multidimensional predictive framework capable of capturing the complexity of POH pathogenesis, surpassing traditional logistic regression models (23). Furthermore, we compared nine machine learning algorithms and optimized model parameters through five-fold cross-validation, ensuring scientific rigor and model stability. Concurrently, we subjected the optimal model to performance test via ten-fold cross-validation (10-fold CV) to validate its robustness and generalization capability. This aligns with recent literature indicating machine learning methods outperform traditional logistic regression in modelling perioperative complications such as surgical infections, acute kidney injury, and sepsis (17–19). By focusing on predicting POH risk in non-diabetic gastric cancer patients, this study complements and extends existing machine learning-based risk prediction frameworks.
On the test set, the SVM model achieved a high recall (0.75) while maintaining solid AUC (0.758), F1 score (0.743), and accuracy (0.724). In clinical practice, a high recall is particularly important, as it maximizes the identification of high-risk POH patients and reduces the likelihood of missed diagnoses (24). The nonlinear mapping capability of SVM-RBF enables it to capture complex feature interactions more accurately, thereby improving the discrimination of critical patients. By contrast, although the random forest showed perfect performance on the training set (AUC = 1.0, F1 = 1.0, recall=1.0), its performance on the test set dropped noticeably (AUC = 0.727, F1 = 0.705, recall=0.712), suggesting overfitting. While Miet et al. reported strong performance of random forest in predicting sepsis-associated severe acute kidney injury (sAKI), this method still exhibited overfitting in our dataset (25), indicating that model performance can be influenced by dataset-specific characteristics and clinical context, and should be evaluated accordingly. Therefore, in this clinical setting, recall is a more appropriate metric for model selection than AUC or F1, since the clinical consequences of missing high-risk patients far outweigh those of misclassifying low-risk patients. Selecting SVM as the optimal model based on test set recall is both reasonable and ensures sensitive identification of high-risk patients while maintaining overall predictive performance.
To translate SVM model predictive performance into a clinically actionable tool, we propose a three-tier risk management strategy based on predicted probabilities and Decision Curve Analysis (DCA) results (26). Decision curve analysis (DCA) showed that the clinically effective range of the model was approximately 0.36–0.71; however, to facilitate clinical memorization and ease of implementation, thereby improving operational feasibility, and to better balance sensitivity and specificity, thereby ensuring patient safety, we selected 0.30 and 0.60 as the risk stratification thresholds.
Low risk (<0.30): Within this probability range, the clinical net benefit of model-guided interventions is limited; thus, conventional management strategies represent a reasonable resource allocation choice.
Moderate risk (0.30–0.60): This core range demonstrates significant clinical net benefit over baseline strategies and encompasses the optimal Youden index threshold (0.507). Extended monitoring periods for closer observation are recommended.
High risk (≥0.60): Patients within this range exhibit substantially elevated event probability, necessitating enhanced clinical surveillance and intensive postoperative glucose monitoring.
This model-based, clinically optimized risk stratification method facilitates the allocation of limited healthcare resources towards medium-to-high-risk patients. It constitutes a clinically quantifiable and actionable risk management framework, whose potential for improving resource allocation efficiency has been validated in other clinical settings (27).
Among all predictors, duration of surgery represents a significant independent risk factor for POH (28). Prolonged surgical stress elevates catecholamine levels, intensifies gluconeogenesis and glycogenolysis, and induces pro-inflammatory cytokine release. These mechanisms collectively exacerbate insulin resistance and glycemic dysregulation (29, 30). Perioperative malnutrition constitutes an intervenable risk factor associated with adverse surgical outcomes (31). The positive SHAP distribution of NRS scores indicates that malnourished patients are more susceptible to stress-induced metabolic disorders, potentially linked to impaired β-cell function and reduced peripheral glucose utilization (32). Previous studies have also highlighted that malnutrition increases the risk of postoperative complications and is independently associated with poorer survival rates in cancer patients (33). The findings of this study further support the necessity of preoperative nutritional screening and intervention.
Sex differences also exerted a significant influence, consistent with prior studies (34): male patients exhibited approximately double the risk of POH compared to females. This may relate to the protective role of estrogen in glucose metabolism (35), though the underlying mechanisms warrant further investigation.
Preoperative fasting blood glucose serves as a strong predictor of POH, reflecting underlying metabolic stress and insufficient β-cell reserve prior to surgery, thereby elevating the risk of postoperative metabolic imbalance (36, 37). Additionally, thrombotic risk scores and ALP levels demonstrated significant predictive value. Elevated thrombotic risk scores not only indicate a hypercoagulable state but may also reflect systemic inflammation and activation of the coagulation axis. This pro-inflammatory state may prompt immune cells to release substantial inflammatory mediators, such as tumor necrosis factor-α (TNF-α). These mediators could inhibit downstream signaling of insulin receptor substrate-1 (IRS-1) by activating serine kinases including JNK and IKK, leading to impaired glucose utilization in peripheral tissues—insulin resistance. Concurrently, ALP is a recognized clinical marker for hepatic or skeletal disorders. As the central organ for glucose metabolism, impaired liver function may disrupt regulation of gluconeogenesis and glycogenolysis, thereby destabilizing blood glucose homeostasis. This suggests that thrombotic risk and ALP levels may interact via inflammatory-metabolic pathways to increase the risk of POH (38–40).
Notably, Surgical Approach 2 (robotic surgery) exhibited a negative SHAP distribution in the model, suggesting it may confer a protective effect. This finding may relate to the reduced trauma and lighter intraoperative stress associated with robotic surgery. Existing research indicates that robotic surgery results in less intraoperative blood loss and lower postoperative levels of C-reactive protein (CRP), a sensitive inflammatory marker linked to cardiovascular disease. CRP also exhibits a negative correlation with insulin sensitivity. It may therefore be inferred that robotic surgery, by reducing postoperative inflammation, could be associated with diminished insulin resistance, thereby facilitating the maintenance and restoration of postoperative metabolic homeostasis. Future studies could further compare the effects of different Surgical Approaches on perioperative metabolic homeostasis, providing guidance for optimizing surgical technique selection (41, 42).
Growing evidence indicates that POH in non-diabetic patients is independently associated with increased postoperative complication risk (43) and may adversely affect recovery by promoting metabolic and inflammatory dysregulation (44, 45). Nevertheless, this phenomenon is frequently overlooked in clinical practice, with postoperative glucose monitoring in non-diabetic patients remaining markedly inadequate (6). Early identification of POH risk facilitates the implementation of preventive interventions, enhances metabolic stress tolerance, and promotes postoperative recovery. Recognizing modifiable risk factors—such as nutritional status and surgery-related parameters—also provides a basis for risk prevention and control at the public health level.
This study has several limitations. First, as a single-center retrospective study with a limited sample size (n = 393) and fasting glucose measured only at 24 hours postoperatively, the generalizability of the findings may be limited. In addition, the model is applicable only to non-diabetic gastric cancer patients and lacks external validation; although internal stability was assessed through train-test splitting and 10-fold cross-validation, this may still be insufficient to ensure its applicability across different hospitals, regions, and ethnic populations. Similar machine learning studies predicting surgical complications also emphasize the necessity of external validation to confirm model utility across diverse populations (46).Therefore, future studies should perform external validation in multicenter cohorts encompassing diverse regions and ethnic groups to evaluate the model’s broader generalizability and performance.
Moreover, the model has the potential to be implemented as an online calculator or mobile application, enabling clinicians to assess postoperative hyperglycemia risk in real time based on preoperative patient characteristics. Integration with hospital information systems or electronic medical records could facilitate automated risk evaluation. Finally, the application of the model could inform clinical workflows, such as determining the intensity of postoperative glucose monitoring and the timing or dosing of insulin intervention, thereby optimizing perioperative management and improving patient outcomes.
5 Conclusion
This study successfully developed the first machine learning-based prediction model for POH in non-diabetic gastric cancer patients. The SVM-radial algorithm demonstrated superior predictive performance and identified seven critical risk factors, offering new insights into the pathogenesis of POH. The proposed model may facilitate early risk stratification and individualized management strategies, ultimately improving perioperative care and long-term outcomes.
Data availability statement
The datasets presented in this article are not readily available because The data and materials generated in this study are available from the corresponding author upon reasonable request. Requests must be reviewed and approved by the Ethics Committee of Nanjing University of Chinese Medicine, after which the corresponding author will provide the relevant data and materials. Requests to access the datasets should be directed to PD, MjAyMzEwMDVAbmp1Y20uZWR1LmNu.
Ethics statement
The studies involving humans were approved by IRB of Affiliated Hospital of Nanjing University of Chinese Medicine (Jiangsu Province Hospital of Chinese Medicine). The studies were conducted in accordance with the local legislation and institutional requirements. The ethics committee/institutional review board waived the requirement of written informed consent for participation from the participants or the participants’ legal guardians/next of kin because Ethical approval was granted retrospectively by the Ethics Committee of Jiangsu Province Hospital of Traditional Chinese Medicine (approval date: April 14, 2025), as the study involved non-interventional analysis of de-identified clinical data. Written informed consent was waived according to institutional regulations for retrospective research.
Author contributions
NW: Formal analysis, Visualization, Writing – original draft. JZ: Formal analysis, Visualization, Writing – original draft. CF: Software, Writing – original draft. YD: Data curation, Validation, Writing – original draft. LY: Methodology, Writing – original draft. PD: Software, Supervision, Validation, Writing – original draft, Writing – review & editing.
Funding
The authors declare that no financial support was received for the research, and/or publication of this article.
Acknowledgments
The authors gratefully acknowledge the support of the Department of Nursing and the Department of Information Technology at Jiangsu Province Hospital of Chinese Medicine for their assistance with data access and retrieval. We also thank the clinical staff of the Department of Oncology and Department of Endocrinology for their cooperation during data collection. The authors extend their appreciation to all patients whose anonymized data contributed to this research.
Conflict of interest
The authors declare that the research was conducted in the absence of any commercial or financial relationships that could be construed as a potential conflict of interest.
Generative AI statement
The authors declare that no Generative AI was used in the creation of this manuscript.
Any alternative text (alt text) provided alongside figures in this article has been generated by Frontiers with the support of artificial intelligence and reasonable efforts have been made to ensure accuracy, including review by the authors wherever possible. If you identify any issues, please contact us.
Publisher’s note
All claims expressed in this article are solely those of the authors and do not necessarily represent those of their affiliated organizations, or those of the publisher, the editors and the reviewers. Any product that may be evaluated in this article, or claim that may be made by its manufacturer, is not guaranteed or endorsed by the publisher.
Supplementary material
The Supplementary Material for this article can be found online at: https://www.frontiersin.org/articles/10.3389/fendo.2025.1687745/full#supplementary-material
References
1. Bray F, Laversanne M, Sung H, Ferlay J, Siegel RL, Soerjomataram I, et al. Global cancer statistics 2022: GLOBOCAN estimates of incidence and mortality worldwide for 36 cancers in 185 countries. CA Cancer J Clin. (2024) 74:229–63. doi: 10.3322/caac.21834
2. Sundar R, Nakayama I, Markar SR, Shitara K, van Laarhoven HWM, Janjigian YY, et al. Gastric cancer. Lancet. (2025) 405:2087–102. doi: 10.1016/S0140-6736(25)00052-2
3. Mousavi SE, Ilaghi M, Elahi Vahed I, and Nejadghaderi SA. Epidemiology and socioeconomic correlates of gastric cancer in asia: results from the GLOBOCAN 2020 data and projections from 2020 to 2040. Sci Rep. (2025) 15:6529. doi: 10.1038/s41598-025-90064-6
4. Hsu JT, Lin YN, Chen YF, Kou HW, Wang SY, Chou W-C, et al. A comprehensive overview of gastric cancer management from a surgical point of view. Biomed J. (2025) 48:100817. doi: 10.1016/j.bj.2024.100817
5. Yu Z, Liang C, Xu Q, Li R, Gao J, Gao Y, et al. Analysis of postoperative complications and long term survival following radical gastrectomy for patients with gastric cancer. Sci Rep. (2024) 14:23869. doi: 10.1038/s41598-024-74758-x
6. Fiorillo C, Rosa F, Quero G, Menghi R, Doglietto GB, and Alfieri S. Postoperative hyperglycemia in nondiabetic patients after gastric surgery for cancer: perioperative outcomes. Gastric Cancer. (2017) 20:536–42. doi: 10.1007/s10120-016-0621-5
7. Lan N, Chen X, Lu Y, Zhou Y, Kong F, Zhao Y, et al. The impact and clinical prediction of hyperglycemia during parenteral nutrition for nondiabetic patients after gastrectomy for gastric cancer. Front Nutr. (2022) 9:807841. doi: 10.3389/fnut.2022.807841
8. Fiorillo C, Quero G, Laterza V, Mascagni P, Longo F, Menghi R, et al. Postoperative hyperglycemia affects survival after gastrectomy for cancer: A single-center analysis using propensity score matching. Surgery. (2020) 167:815–20. doi: 10.1016/j.surg.2019.11.006
9. Vedantam D, Poman DS, Motwani L, Asif N, Patel A, and Anne KK. Stress-induced hyperglycemia: consequences and management. Cureus. (2022) 14:e26714. doi: 10.7759/cureus.26714
10. Sreedharan R, Khanna S, and Shaw A. Perioperative glycemic management in adults presenting for elective cardiac and non-cardiac surgery. Perioper Med. (2023) 12:13. doi: 10.1186/s13741-023-00302-6
11. Zhang Y, Yan Y, Sun L, and Wang Y. Stress hyperglycemia ratio is a risk factor for mortality in trauma and surgical intensive care patients: a retrospective cohort study from the MIMIC-IV. Eur J Med Res. (2024) 29:558. doi: 10.1186/s40001-024-02160-4
12. Dong Z, Liu G, Tu L, Su X, and Yu Y. Establishment of a prediction model of postoperative infection complications in patients with gastric cancer and its impact on prognosis. J Gastrointest Oncol. (2023) 14:1250–58. doi: 10.21037/jgo-23-231
13. Wang L, Wang R, Liu T, Cao P, and Zhao L. Development of a risk prediction model for intraoperative abnormal blood glucose in elderly patients without diabetes. Chin J Nursing. (2023) 58:318–24. doi: 10.3761/j.issn.0254-1769.2023.03.009
14. Graeßner M, Jungwirth B, Frank E, Schaller SJ, Kochs E, Ulm K, et al. Enabling personalized perioperative risk prediction by using a machine-learning model based on preoperative data. Sci Rep. (2023) 13:7128. doi: 10.1038/s41598-023-33981-8
15. Shah NJ, Leis A, Kheterpal S, Englesbe MJ, and Kumar SS. Association of intraoperative hyperglycemia and postoperative outcomes in patients undergoing non-cardiac surgery: a multicenter retrospective study. BMC Anesthesiol. (2020) 20:106. doi: 10.1186/s12871-020-01022-w
16. Zale A and Mathioudakis N. Machine learning models for inpatient glucose prediction. Curr Diabetes Rep. (2022) 22:353–64. doi: 10.1007/s11892-022-01477-w
17. Bihorac A, Ozrazgat-Baslanti T, Ebadi A, Motaei A, Madkour M, Pardalos PM, et al. MySurgeryRisk: development and validation of a machine-learning risk algorithm for major complications and death after surgery. Ann Surg. (2019) 269:652–62. doi: 10.1097/SLA.0000000000002706
18. Huang Z, Buddhiraju A, Chen TL-W, RezazadehSaatlou M, Chen SF, Bacevich BM, et al. Machine learning models based on a national-scale cohort accurately identify patients at high risk of deep vein thrombosis following primary total hip arthroplasty. Orthop Traumatol Surg Res. (2025) 111:104238. doi: 10.1016/j.otsr.2025.104238
19. Lin Z, He H, Yan M, Chen X, Chen H, and Ke J. Machine learning and the nomogram as the accurate tools for predicting postoperative malnutrition risk in esophageal cancer patients. Front Nutr. (2025) 12:1606470. doi: 10.3389/fnut.2025.1606470
20. Pasquel FJ, Lansang MC, Dhatariya K, and Umpierrez GE. Management of diabetes and hyperglycemia in the hospital. Lancet Diabetes Endocrinology. (2021) 9:174–88. doi: 10.1016/S2213-8587(20)30381-8
21. Yoneda A, Takesue Y, Takahashi Y, Ichiki K, Tsuchida T, Ikeuchi H, et al. Improvement in hyperglycemia prevents surgical site infection irrespective of insulin therapy in non-diabetic patients undergoing gastrointestinal surgery. World J Surg. (2020) 44:1450–58. doi: 10.1007/s00268-020-05371-y
22. American Diabetes Association Professional Practice Committee. Diabetes care in the hospital: standards of care in diabetes—2025. Diabetes Care. (2025) 48:S321–34. doi: 10.2337/dc25-S016
23. Dejen ET, Workie MM, Zeleke TG, Admass BA, Melesse DY, and Melkie TB. Postoperative hyperglycemia among adult non-diabetic surgical patients at university of gondar comprehensive specialized hospital, northwest Ethiopia. BMC Anesthesiol. (2024) 24:217. doi: 10.1186/s12871-024-02592-9
24. Dou Y and Meng W. An optimization algorithm for computer-aided diagnosis of breast cancer based on support vector machine. Front Bioeng Biotechnol. (2021) 9:698390. doi: 10.3389/fbioe.2021.698390
25. Mi T, Li X, Fang Q, and Feng M. Machine learning models for predicting severe acute kidney injury in patients with sepsis-induced myocardial injury. Sci Rep. (2025) 15:19563. doi: 10.1038/s41598-025-04579-z
26. Vickers AJ and Elkin EB. Decision curve analysis: a novel method for evaluating prediction models. Med Decis Making. (2006) 26:565–74. doi: 10.1177/0272989X06295361
27. Ming DK, Hernandez B, Sangkaew S, Vuong NL, Lam PK, Nguyet NM, et al. Applied machine learning for the risk-stratification and clinical decision support of hospitalised patients with dengue in Vietnam. PLoS Digit Health. (2022) 1:e0000005. doi: 10.1371/journal.pdig.0000005
28. Moorthy V, Sim MA, Liu W, Chew STH, and Ti LK. Risk factors and impact of postoperative hyperglycemia in nondiabetic patients after cardiac surgery: a prospective study. Medicine. (2019) 98:e15911. doi: 10.1097/MD.0000000000015911
29. Székely A, Levin J, Miao Y, Tudor IC, Vuylsteke A, Ofner P, et al. Investigators of the Multicenter Study of Perioperative Ischemia Research Group and the Ischemia Research and Education Foundation. Impact of hyperglycemia on perioperative mortality after coronary artery bypass graft surgery. J Thorac Cardiovasc Surg. (2011) 142:430–37. doi: 10.1016/j.jtcvs.2011.03.009
30. Soop M and Ljungqvist O. Metabolic responses to surgical stress. Clin Nutr ESPEN. (2025) 67:178–83. doi: 10.1016/j.clnesp.2025.02.021
31. Williams DGA, Molinger J, and Wischmeyer PE. The malnourished surgery patient: a silent epidemic in perioperative outcomes? Curr Opin Anaesthesiol. (2019) 32:405–11. doi: 10.1097/ACO.0000000000000722
32. Wadivkar P, Thomas N, Jebasingh F, Bacot-Davis VR, Maini R, and Hawkins M. Undernutrition-associated diabetes mellitus: pathophysiology of a global problem. Physiology. (2025) 40. doi: 10.1152/physiol.00065.2024
33. Zang Y, Xu W, Qiu Y, Gong D, and Fan Y. Association between risk of malnutrition defined by the nutritional risk screening 2002 and postoperative complications and overall survival in patients with cancer: a meta-analysis. Nutr Cancer. (2023) 75:1600–09. doi: 10.1080/01635581.2023.2227402
34. Bui H, Hatzakorzian R, and Schricker T. Diagnosing preoperative hyperglycemia in non-diabetic patients: a challenge and an opportunity. Can J Anesth/J Can Anesth. (2011) 58:582–83. doi: 10.1007/s12630-011-9481-y
35. Tramunt B, Smati S, Grandgeorge N, Lenfant F, Arnal J-F, Montagner A, et al. Sex differences in metabolic regulation and diabetes susceptibility. Diabetologia. (2020) 63:453–61. doi: 10.1007/s00125-019-05040-3
36. Yang MH, Jaeger M, Baxter M, VanDenKerkhof E, and van Vlymen J. Postoperative dysglycemia in elective non-diabetic surgical patients: a prospective observational study. Can J Anesth/J Can Anesth. (2016) 63:1319–34. doi: 10.1007/s12630-016-0742-7
37. Wang S, Zhou H, Cai K, Fan Y, Yang X, Zhang B, et al. Predictive value of perioperative fasting blood glucose for post pancreatectomy diabetes mellitus in pancreatic ductal carcinoma patients. World J Surg Oncol. (2025) 23:55. doi: 10.1186/s12957-025-03705-5
38. Engelmann B and Massberg S. Thrombosis as an intravascular effector of innate immunity. Nat Rev Immunol. (2013) 13:34–45. doi: 10.1038/nri3345
39. Hotamisligil G. Inflammation and metabolic disorders. Nature. (2006) 444:860–7. doi: 10.1038/nature05485
40. Harmey D, Hessle L, Narisawa S, Johnson KA, Terkeltaub R, and Millán JL. Concerted regulation of inorganic pyrophosphate and osteopontin by akp2, enpp1, and ank: an integrated model of the pathogenesis of mineralization disorders. Am J Pathol. (2004) 164:1199–209. doi: 10.1016/S0002-9440(10)63208-7
41. Davis G, Fayfman M, Reyes-Umpierrez D, Hafeez S, Pasquel FJ, Vellanki P, et al. Stress hyperglycemia in general surgery: why should we care? J Diabetes Complications. (2018) 32:305–09. doi: 10.1016/j.jdiacomp.2017.11.010
42. Cuk P, Simonsen RM, Komljen M, Nielsen MF, Helligsø P, Pedersen AK, et al. Improved perioperative outcomes and reduced inflammatory stress response in Malignant robot-assisted colorectal resections: a retrospective cohort study of 298 patients. World J Surg Onc. (2021) 19:155. doi: 10.1186/s12957-021-02263-w
43. Festa A, D’Agostino R Jr, Howard G, Mykkänen L, Tracy RP, and Haffner SM. Chronic subclinical inflammation as part of the insulin resistance syndrome: the Insulin Resistance Atherosclerosis Study (IRAS). Circulation. (2000) 102:42–7. doi: 10.1161/01.cir.102.1.42
44. Supabphol S, Seubwai W, Wongkham S, and Saengboonmee C. High glucose: an emerging association between diabetes mellitus and cancer progression. J Mol Med. (2021) 99:1175–93. doi: 10.1007/s00109-021-02096-w
45. Cui S, Li L, Zhang Y, Lu J, Wang X, Song X, et al. Machine learning identifies metabolic signatures that predict the risk of recurrent angina in remitted patients after percutaneous coronary intervention: a multicenter prospective cohort study. Adv Sci (Weinh). (2021) 8:2003893. doi: 10.1002/advs.202003893
Keywords: postoperative hyperglycemia, non-diabetic patients, gastric cancer, machine learning, risk prediction, perioperative management, SHAP, SVM-radial
Citation: Wang N, Zhang J, Fei C, Ding Y, Yang L and Duan P (2025) Development of machine learning models for predicting postoperative hyperglycemia in non-diabetic gastric cancer patients: a retrospective cohort study analysis. Front. Endocrinol. 16:1687745. doi: 10.3389/fendo.2025.1687745
Received: 18 August 2025; Accepted: 27 October 2025;
Published: 10 November 2025.
Edited by:
Arvind Mukundan, National Chung Cheng University, TaiwanReviewed by:
Liqun Tu, Stanford University, United StatesMikhail Potievskiy, FSBI National Medical Radiological Research Center, Russia
Copyright © 2025 Wang, Zhang, Fei, Ding, Yang and Duan. This is an open-access article distributed under the terms of the Creative Commons Attribution License (CC BY). The use, distribution or reproduction in other forums is permitted, provided the original author(s) and the copyright owner(s) are credited and that the original publication in this journal is cited, in accordance with accepted academic practice. No use, distribution or reproduction is permitted which does not comply with these terms.
*Correspondence: Peibei Duan, MjAyMzEwMDVAbmp1Y20uZWR1LmNu
†These authors have contributed equally to this work