Numerical Simulation of Simultaneous Electrostatic Precipitation and Trace Gas Adsorption: Electrohydrodynamic Effects
 Herek L. Clack
- Department of Civil and Environmental Engineering, University of Michigan, Ann Arbor, MI, USA
Electrostatic precipitators (ESPs) are now being tasked with simultaneously removing particulate matter (PM) and trace gas-phase pollutants such as mercury released during coal combustion. This represents a significant expansion of their original operational mission, one which is not captured by decades old quasi-1-D analytical expressions developed from first principles for predicting PM removal alone. At the same time, technological advances in ESP power supplies have led to steady increases over the years in the applied voltage achievable in new or refurbished ESPs. In light of these industry trends, the present study extends our previous study to examine the multiphase flow phenomena that may occur during such ESP operations, specifically the effects of electrohydrodynamic (EHD) fluid flow phenomena that can emerge when electrical current densities are high and/or fluid velocities are low. The results show good agreement at low current densities between the present numerical simulation results and ESP performance predictions obtained from classical analytical expressions, with increasing divergence in predicted performance at higher current densities. Under the influence of EHD phenomena, the acceleration of the fluid by electric body forces effectively increases average fluid velocities through the ESP channel with a commiserate reduction in PM removal efficiency. The impact on trace gas-phase pollutant removal is mixed, with EHD phenomena found to variously promote or inhibit gas-phase pollutant removal.
Introduction
Over decades of use in controlling particulate emissions, electrostatic precipitators (ESPs) have been proven to be robust devices with electronic control systems that often operate virtually independently with minimal human intervention. Especially for well-defined processes for which particulate emissions vary little over time, such as stationary power generation, well-designed ESPs have operated reliably for decades after initial installation, typically undergoing periodic repair and maintenance or receiving power supply upgrades. When significant changes in particulate control performance have been needed, often due to changes in particle electrical properties, flue gas conditioning additives such as sulfur trioxide, and less commonly ammonia, have been injected upstream of ESPs (Shanthakumar et al., 2008), altering particle electrical properties and improving the particulate matter (PM) removal performance of the device. Operating temperature has long been known to affect ESP performance, and the perceived advantages of high-temperature electrostatic largely drove the installation of a number of so-called hot-side ESPs (Calvert and Englund, 1984), and researchers continue to study how elevated gas temperatures may be used to mitigate ESP performance fluctuations due to variable coal quality (Noda and Makino, 2010). The development of combustion systems capable of postcombustion carbon capture has also driven studies of ESP operation during oxy-fueled combustion (Han et al., 2010; Kim et al., 2014). Increasingly, ESPs have been the focus not for PM emissions but rather for simultaneously controlling the emissions of a second pollutant. Upstream injection of lime, limestone, or trona to neutralize acid gases and powdered mercury sorbents such as powdered activated carbon (PAC) to adsorb toxic trace metals such as mercury has grown in the United States as new and more stringent regulations take effect.
Wet and dry ESPs operate on the same basic particle collection principles, but differ in how they handle the bulk collected dust. Dry ESPs periodically mechanically or acoustically dislodge the bulk collected dust (dustcake) from the collection electrodes, causing it to fall by gravity into collection hoppers below. Wet ESPs direct a flow of water, either continuously or intermittently, over the surfaces of the collection electrodes, thereby capturing particles in the falling liquid sheet that are extracted from the liquid in a separate process. Because of the added complexity of the separate liquid handling system and the liquid waste stream produced by wet ESPs, their main use has been in controlling liquid mists or sticky particulates, explosive aerosol suspensions, and as mist recovery processes in sulfuric acid production (Cooper and Alley, 2011; Seetharama et al., 2013). The use of ESPs for two-way (or even three-way) air pollutant emissions control is advancing. Compared to dry ESPs, the lower operating temperatures and elimination of particle resuspension into the flue gas during mechanical rapping offered by wet ESPs increase the removal efficiencies of fine particles (PM2.5) (Cooper and Alley, 2011). Because of their high surface area per unit mass, these smallest particles are also most likely to harbor compounds condensed from the flue gas such as heavy metals (Seames and Wendt, 2000) including mercury (Reynolds, 2004; Seetharama et al., 2013), providing modest, incidental removal of such semivolatile pollutants. In addition to higher PM2.5 removal efficiency, wet ESPs are also superior to dry ESPs at removing liquid particles, droplets, and mists (Cooper and Alley, 2011). Although flue gas from coal combustion nominally contains no condensate, the moist, low-temperature operating environment within wet ESPs promotes condensation of acid gases such as sulfuric acid as temperatures approach the acid dew point of the flue gas. In this way, wet ESPs act to reduce acid gas emissions along with PM emissions.
Dry ESPs used for two- or three-way air pollutant emissions control have made advances largely through full-scale field tests and extrapolating from decades of ESP operating experience. Given the dominance of dry ESPs in use at electric utilities in the United States and elsewhere, the remaining discussion focuses on this primary population of devices; references to ESPs beyond this point imply dry ESPs. The reliance on ESP PM removal principles to interpret trace gaseous pollutant emissions reductions observed from ESP field tests, however, can lead to erroneous inferences of causal relationships. For example, ESP PM removal efficiency is understood to increase with increasing collection electrode area; however, mass transfer limitations prevent the accumulated dustcake on collection electrodes from contributing significantly to the overall reduction in trace pollutant concentrations across an ESP, thereby greatly weakening the influence of collection electrode area on trace pollutant removal. Suspended adsorbent particles in the flue gas contribute to a greater degree to trace pollutant removal in ESPs of conventional design. Even the implicit assumption that multiple mechanisms of trace pollutant adsorption can be dealt with in an additive fashion is questionable. Results from a recent numerical simulation of trace mercury adsorption by suspended aerosols and the accumulated dustcake on the collection electrodes of an ESP channel (Clack, 2015) indicate that the mercury-lean boundary layers that develop over the adsorbent dustcake suppress adsorption by suspended aerosols as they drift toward the collection electrodes. Because all aerosols must traverse these boundary layers before they are collected on the plate electrodes, this suppression has an outsized impact on in-flight adsorption. In the extreme case of collection of electrodes covered by a highly adsorbent dustcake layer, the deeply mercury-lean concentration boundary layers that are produced actually result in lower mercury removal by the combined in-flight and wall-bounded mechanisms that would be predicted by summing the separate contributions of the two adsorption mechanisms.
Nevertheless, anecdotal evidence from full-scale field tests suggests that larger ESPs as measured by space velocity broadly tend to exhibit higher levels of mercury removal. While increased space velocity can reflect greater collection electrode, and thus dustcake, surface area, it can also reflect reduced flue gas velocities. Reduced gas velocity increases the potential for electrohydrodynamic (EHD) phenomena to occur within ESP channels by reducing fluid inertial forces compared to EHD forces, the ratio of which is represented by EHD number or Masuda number and which can be used to predict the onset of prominent EHD phenomena and flow features (IEEE-DEIS-EHD Technical Committee, 2003). Study of EHD phenomena in principle began in the 1980s (Leonard et al., 1983; Yamamoto and Sparks, 1986; Kallio and Stock, 1992) with detailed simulations (Zhao and Adamiak, 2008) and experimental measurements (Zouzou et al., 2011) arising more recently that focus on conventional ESPs and PM control. This study seeks to shed light on how EHD phenomena might affect, either incidentally or intentionally, the performance of ESPs operated as multipollutant collectors that simultaneously remove PM and trace toxic metals from combustion flue gas. Considerations of EHD effects have particular relevance given operating and design conventions that call for increases in ESP-specific collection area (SCA) and/or power supply upgrades to improve PM collection efficiency; both actions have the effect of increasing the relative influence of electric body forces and the relative extent in the flow field of EHD effects.
Materials and Methods
The methodology of the numerical simulation has been presented in detail previously (Clack, 2015) and thus will be summarized here. Solved are the steady conservation equations for the electric and fluid fields (including EHD forces); charged-induced particle motion; and associated convective gas-particle mass transfer rates. There are two 2-D computational domains representing partial segments of a complete ESP channel: a 3-wire segment measuring 2 m × 0.3 m (L × W) or a 9-wire segment measuring 5 m × 0.3 m, each containing 1 mm diameter wire discharge electrodes spaced 0.5 m apart. Figure 1 presents a schematic view of the 3-wire segment; the 9-wire segment is longer but of similar design to the 3-wire segment, both having the same spacing between the wire discharge electrodes and the same distance separating the inlet from the first electrode and the last electrode from the outlet.
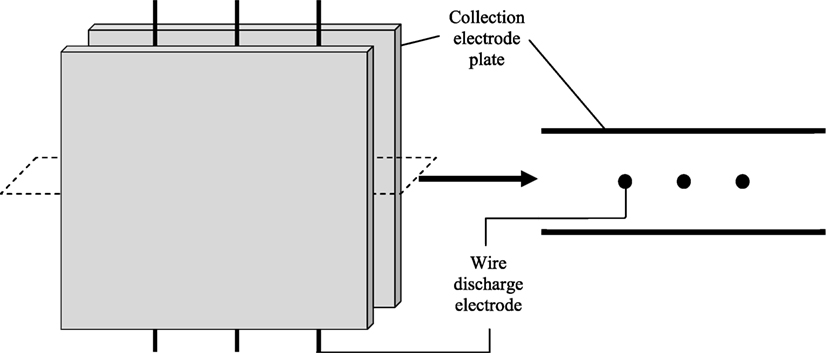
Figure 1. Left: Schematic of a portion of wire-plate electrostatic precipitators in typical electrode arrangement, showing 3-wire channel segment. Right: Corresponding schematic of 2-D computational domain. Schematic not to drawn to scale.
Electric Field
The electric field, assumed to depend only on the continuous phase fluid properties, derives from Eq. 1 for the electric potential:
where Φ is voltage [V] and is the electric field vector [V/m]. The solution to Eq. 1 must also satisfy Poisson’s equation (Eq. 2) and current continuity (Eq. 3) assuming Fickian ion diffusion is neglected compared to fluid and electric field-driven ion advection:
where qi is the local space charge density [C/m3], ε is the electrical permittivity of the fluid, bi is the ionic mobility in air (1.6e−4 [m2/V − s]), α is the ion diffusivity coefficient, and is the fluid velocity vector. The space charge density distribution qi(x,y) that constrains Φ(x,y) such that ∇qi(x,y) and ∇Φ(x,y) satisfy Eqs 2 and 3 is determined through repeated, iterative solutions of the electric field, as described previously (Clack, 2015). The discharge corona constitutes a negligible fraction of the computational domain, and thus, it is not numerically simulated.
Fluid/Continuous Phase
The incompressible Reynolds-averaged Navier–Stokes equations (Eqs 4 and 5) modified to include a term representing the electric body force are as follows:
In Eqs 4 and 5, is local gas velocity vector [m/s], P is local pressure [Pa], ρ is gas density [kg/m3], μ is the gas dynamic viscosity [Pa − s], qi is local space charge density [C/m3], and Φ is local electric potential [V]. The material property database that is native in COMSOL includes the temperature dependency of fluid properties and the native k − ε turbulence model; its default parameters are used without modification.
Particle/Dispersed Phase
Particle volume fraction ϕ and number density NDp are treated as scalar quantities, spatially distributed in the fluid flow, i.e., ϕ(x,y) and NDp(x,y). Both because particle charging and particle dynamic motion are highly dependent on particle size, both quantities must be tracked by particle size, i.e., ϕ(x,y,dp) and NDp(x,y,dp). Considered here are two particle size distributions entering each ESP channel segment: a log-normal distribution and an algebraic representation of a measured size distribution reported previously (Clack, 2015). Figure 2 compares the two size distributions and Table 1. The two particle size distributions are discretized into 11 size bins (1.5 < dp < 125 μm; see Table 1) for the log-normal distribution and 10 size bins (1.5 < dp < 85 μm) for the measured size distribution. Particles are assumed to be PAC, the measured size distribution being that of Norit FGD (Prabhu et al., 2012).
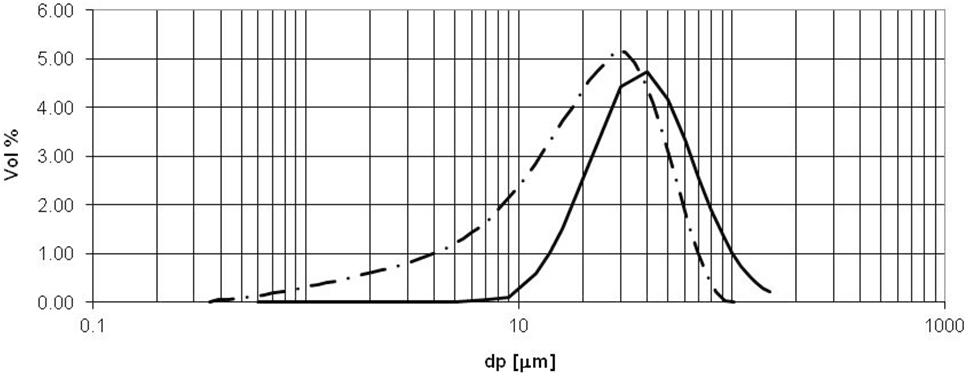
Figure 2. Particle size distributions assumed in present analysis. Solid line: Log-normal particle size distribution, = 20 μm, σg = 1.75. Dashed line: Measured size distribution (Prabhu et al., 2012) of FGD powdered activated carbon product, d50 = 17.32 μm.
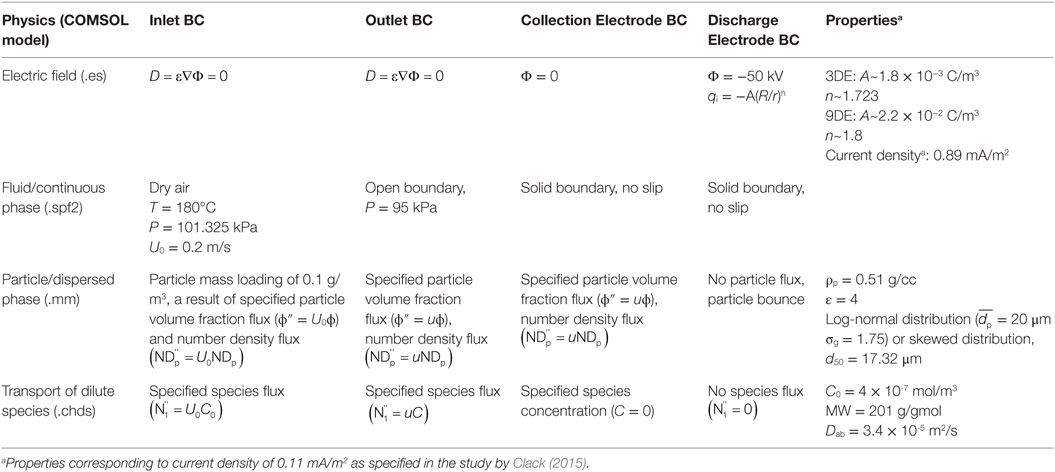
Table 1. Boundary conditions, by physical phenomenon.
Although in practice PAC along with mineral fly ash is suspended, the flue gas entering an ESP, under most circumstances, the contribution of fly ash to adsorbed mercury is negligible, as discussed previously (Clack, 2015). Particle–particle interactions and two-way particle-fluid coupling are beyond the scope of this analysis. The boundary condition for particles intercepting the wire discharge electrodes is an elastic bounce, while particles intercepting the planar collection electrodes are removed from the computational domain permanently. For particles of the size considered here (<150 μm), displacements due to gravitational acceleration are negligible compared to that of fluid drag and Coulombic (charge-driven) forces.
Solutions for the size-dependent spatial distributions of particle number density NDp(x,y,dp) and particle volume fraction ϕ(x,y,dp) for all size bins are computed simultaneously to accurately render their collective rates of gas-particle mass transfer and influence on the local concentration of the gas-phase pollutant C(x,y), assumed here to be mercury. The gas-particle mass transfer rate for particles of size dp is a function of the relative velocity between the two phases, i.e., the particle slip velocity . For charged particles within an electric field, EHD phenomena can introduce strong velocity gradients in the fluid and Coulombic forces induce slip velocities between the fluid and the particle typically at least an order of magnitude greater than gravitational settling and spatially varying. Thus, inclusion of such effects in calculating gas-particle mass transfer represents an important advance beyond previously reported Deutsch-Anderson (D-A)-based analyses (Clack, 2006a,b, 2009).
At the inlet boundary, the two-phase gas-particle flow enters the computational domain with a uniform specified gas (continuous phase) velocity, zero particle slip velocity, and a particle mass loading concentration of 0.1 g/m3, the equivalent of 6 lbs/MMacf (pounds of PAC per million actual cubic feet of flue gas). Trajectories of particles of size dp are governed by the x- and y-components of , uslip, and vslip, representing the balance between viscous and Coulombic forces on the particles:
where Ne is the number of elementary charges on each particle, e is the elementary charge of an electron (1.6E−19 C), Ex and Ey are the x- and y-components of the electric field vector , respectively, and μ and dp are as previously defined. Cc is the Cunningham slip correction factor:
where Kn, Knudsen number, is defined as λ/dp and where λ is the gas mean free path evaluated identically as our previous analyses (Clack, 2006a,b). As described previously (Clack, 2015), particle charging occurs very rapidly under typical ESP conditions. Given the computational expense that would be required in using a Lagrangian approach to explicitly calculate particle charge as a function particle position for ~109 particles, assigning a constant saturation charge for each particle size class that represents Ne induced by the average and qi(x,y) in the domain was previously deemed (Clack, 2015) to be an acceptable compromise between accuracy and computational expense. Because only super-micron size bins are considered in the present analysis, only field charging is considered in the determination of Ne [Eq. 9, from the study by Friedlander (2000)]:
where , ε is the particle relative permittivity (dielectric constant) [-], approximated as that of graphite for PAC, and dp and e are as defined previously.
Eq. 10 (Frössling equation) is a correlation between Reynolds number based on slip velocity and the Sherwood number, a non-dimensional mass transfer parameter the definition of which can be used to solve for the mean convective mass transfer coefficient between a flowing fluid and a spherical particle :
where Dab is the binary mass diffusivity of a species in a dilute mixture, here assumed to be elemental mercury diffusing in air [3.4E−5 m2/s, taken from the study by Clack (2006a,b)], and μ, ρ, and dp are as defined previously. The spatial distribution of the collective rate of gas-particle mass transfer for all particles is subsequently used to calculate the distribution of mercury concentration.
Adsorption of Trace Mercury
The spatial distribution of mercury concentration C(x,y) [mol/m3] in the domain reflects the inlet mercury concentration, reduced by the collective gas-particle mass transfer of the suspended particles; adsorption occurring due to the collected dustcake of particles on the surface of the collection electrodes (Clack, 2015) is not considered. The mass transfer rate of mercury between the gas and the surface of each particle is given by:
where C and Cs are the mercury concentrations locally in the gas and at the surface, respectively; all other quantities are as defined previously. Concentration of mercury at the particle surface is assumed to be zero, based on the high reactivity and high adsorption capacity of current-generation PAC products (Clack, 2015). Mercury removal efficiency in all cases is the percentage difference between inlet species flux and outlet species flux for each channel segment.
COMSOL Multiphysics™ has been previously demonstrated to be suitable for simulating gas-particle phenomena within ESPs (Back and Cramsky, 2012; Clack, 2013), and here version 4.4 was used. An example of the computational mesh is presented in Figure 3, for the 3-wire channel segment. Grid independence was established from the 9-wire channel segment results in which a nearly twofold increase in the number of computational elements from 24,000 to 47,000 yielded a 0.42% change in the PM2.5 particle volume flux at the channel segment outlet (1.089e−16 to 1.0936e−16 m3/s). Computational times on a 64-bit HP Xeon workstation (2 2.93 GHz processors, 6 Gb RAM) were typically ~60 min for the 3-wire channel segment. COMSOL automatically meshes the computational domain based on the physical scale of the computational domain, the boundary conditions applied, and the order of the PDEs being solved.
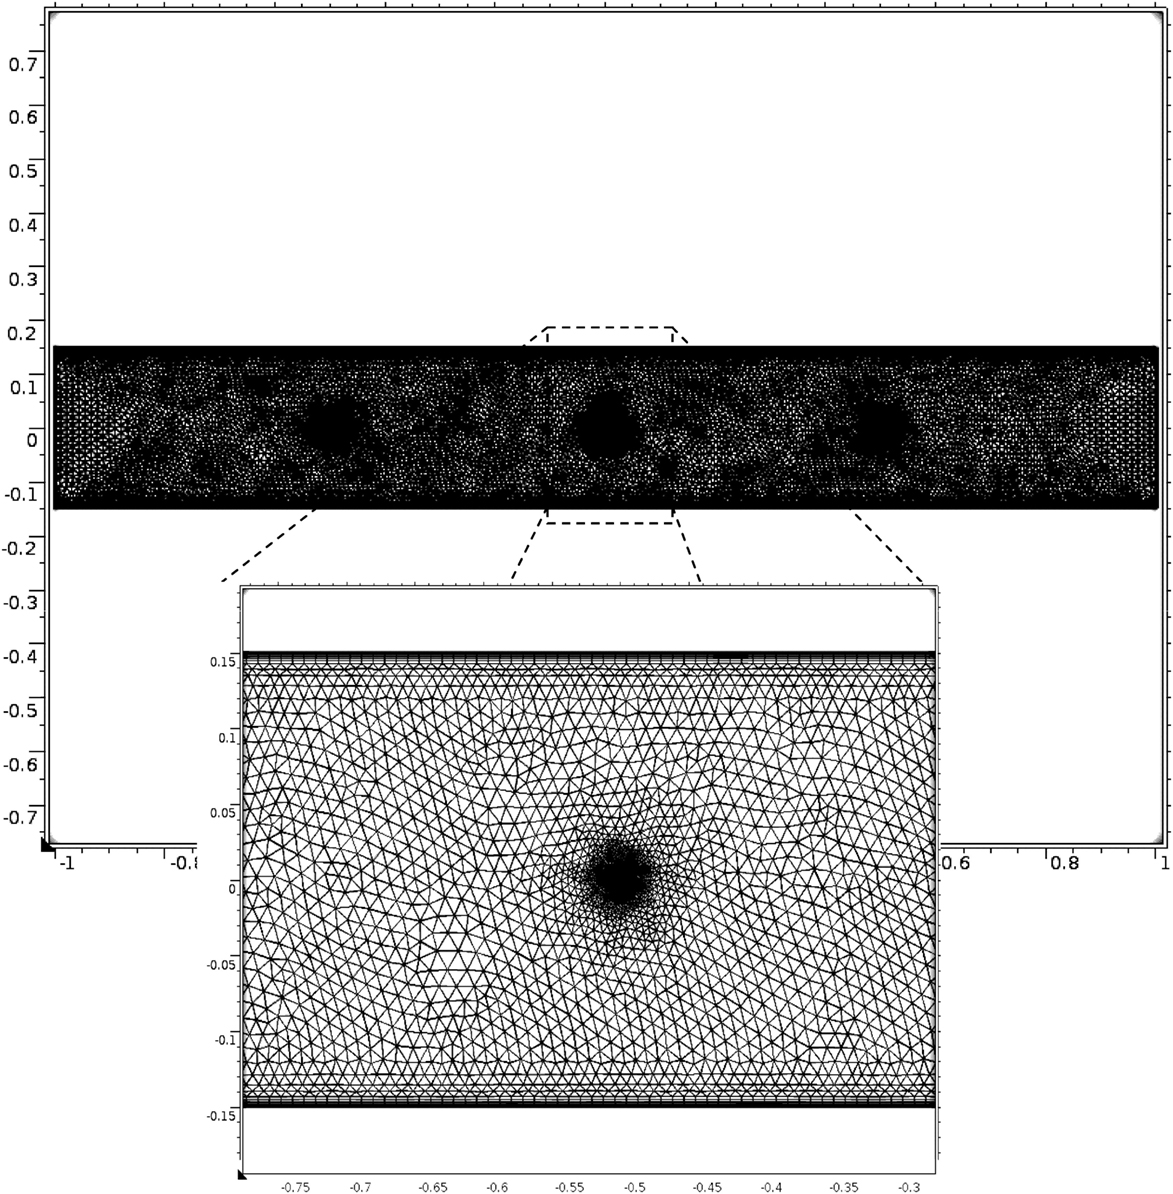
Figure 3. Illustration of typical distribution of computational elements within computational domain of a 3-wire ESP channel segment. Inset: Illustration of increased computational element density in high-gradient regions near solid boundaries (e.g., wire discharge electrodes, collection electrodes).
Table 1 summarizes the physical mechanisms, their governing equations and boundary and initial conditions, and parameter and variable definitions treated by the separate computational modules. The methodology, constraints, and assumptions are similar to those described in the study by Clack (2015) with two exceptions. First, the earlier work considered three trace pollutant removal mechanisms: so-called in-flight (gas-particle) adsorption, wall-bounded adsorption by an adsorbent dustcake layer covering the collection electrodes, and coupling of both in-flight and wall-bounded adsorption. The present work only considers in-flight and wall-bounded trace pollutant adsorption separately. Second, the previous work only considered fluid and electrical conditions (fluid inlet velocity; current density and electric potential) unlikely to produce EHD phenomena. In the present work, fluid and electrical conditions are specifically chosen to promote the onset of EHD phenomena. EHD phenomena become significant for values of EHD number, NEHD (Eq. 12)
approximately equal to or exceeding (≈>) the square of the Reynolds number, ReL2 (IEEE-DEIS-EHD Technical Committee, 2003), in which L, A, and I0 are, respectively, the characteristic dimension, surface area, and electrical current of the relevant component, in this case the wire discharge electrodes. For air, bi is the ionic mobility (assumed value of 1.6e−4 m2 V–1 s–1) and ν is the kinematic viscosity. For the square of the Reynolds number, ReL2 = U02 L2 /ν2, where U0 is the gas velocity entering the channel segment, ReL2 = 154 for the present analysis. At the higher of the two current densities (0.89 mA/m2), values of NEHD for the 3-wire (NEHD = 57.5) and 9-wire (NEHD = 125) ESP channel segments are somewhat lower than the value of ReL2, but by a much smaller margin than in our previous work (Clack, 2015), in which NEHD = 25.7 < 9,260 = ReL2 for current density of 0.11 mA/m2 and velocity U0 = 1.55 m/s. Computed fluid streamline patterns at 0.89and 0.11 mA/m2 (see Figure 4, see Results and Discussion) are consistent with the principle that EHD phenomena become increasingly significant as NEHD approaches and exceeds the value of ReL2.
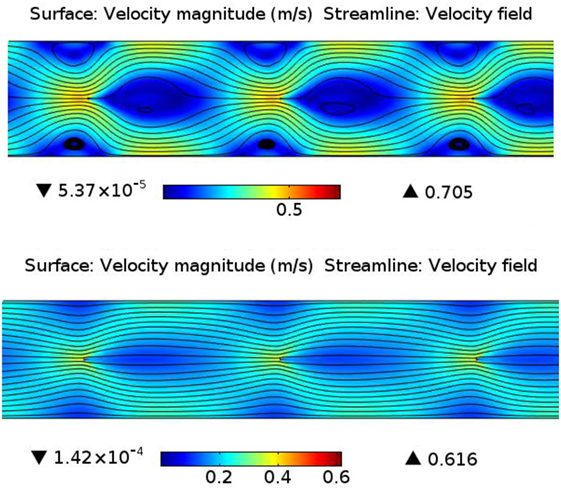
Figure 4. Strong (upper) and weak (lower) EHD effects on |U| (color map) and streamlines near electrodes 4–6 of 9-wire ESP channel segment. Conditions as listed in Table 1.
Total computational times on a 64-bit HP Xeon workstation (2 2.93 GHz processors, 6 Gb RAM) were approximately 60 min for the 3-wire channel segment (13,340 computational elements).
Results and Discussion
Under high EHD conditions, the major EHD-induced flow feature within both the 3- and 9-wire channel segments for U0 = 0.2 m/s is a repeating diverging-converging fluid flow pattern interspersed between the wire electrodes. Figure 4 compares the velocity distributions within two 9-wire channel segments under high and low EHD conditions as reflected by their different imposed space charge density distributions and the different current densities (0.89 vs. 0.11 mA/m2) that result. The higher current density condition produces a more pronounced diverging-converging flow pattern at these velocities; at higher velocities (and thus higher ReL2), the momentum of the bulk flow dominates, preventing the establishment by the electric body forces of any discernible secondary flows. This repeating diverging-converging flow pattern strongly influences the suspended particle motion as well, given that charge-driven particle drift velocities are several orders of magnitude smaller than gas velocities. The diverging regions of this flow pattern would be expected to enhance PM collection through particle advection toward the collection electrodes, with the greatest benefit apparent in the fine fraction whose charge-driven drift velocities are slowest. Accordingly, diminished PM collection would be expected in converging regions of the flow that carry particles away from the walls.
PM Removal: Influences of EHD Phenomena
Figure 5 presents six data points for PM2.5 collection efficiency obtained from numerical simulations of the log-normal particle suspension: four results representing the conditions of the current analysis and two results from previous analyses (Clack, 2015) at the same electrical condition (0.11 mA/m2) but a much higher inlet velocity (U0 = 1.55 m/s) that are presented to assist in interpreting the four EHD-influenced results. The four results from the current analysis represent the two ESP channel segment lengths (3 and 9 wires) and the two electrical conditions (0.11 and 0.89 mA/m2), all for U0 = 0.2 m/s. The higher electrical condition led to higher PM2.5 collection efficiency, with greater performance enhancement occurring for the 3-wire geometry (increased from 13 to 90%) than the 9-wire geometry (increased from 84 to 99.6%). Although detailed results for the skewed PSD are not presented, overall trends were similar to those for the log-normal PSD. Generally, PM2.5 collection efficiency for the skewed PSD was lower (10.7% under high EHD conditions, increasing to 83.3% in the 9-wire channel segment) than results for the log-normal PSD under the same conditions. Lower PM2.5 collection efficiency for the skewed PSD likely reflects its larger fine fraction.
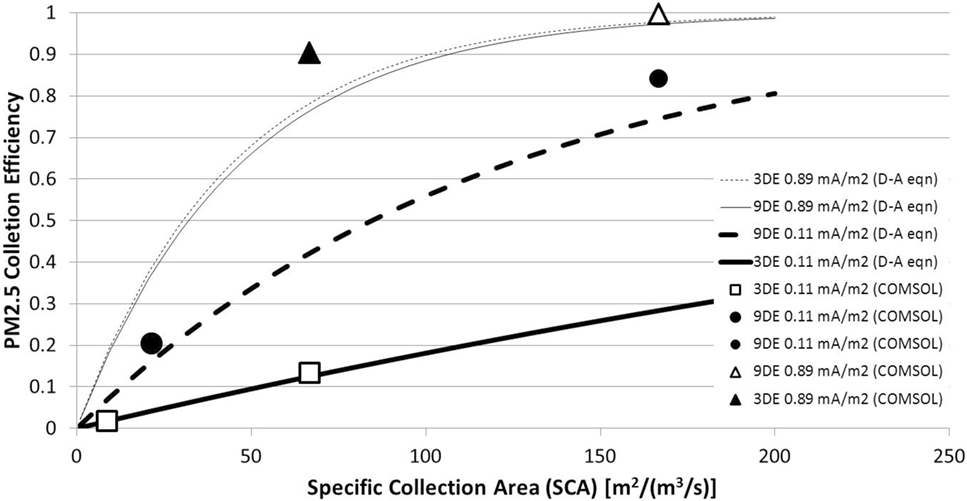
Figure 5. Six numerical simulation results (symbols) of PM2.5 (i.e., dp ≤ 2.5 μm) removal efficiency, compared with four Deutsch-Anderson predictions (curves) of dp = 2.5 μm removal efficiency.
The differences in computed PM2.5 collection efficiency attributable to EHD phenomena in Figure 5 can be only properly interpreted if they are distinguished from effects resulting from changes in other conventional ESP operating parameters. In comparing two electrical conditions, the higher electrical condition would be expected to produce higher PM collection efficiencies in a conventional ESP through more highly charged particles and stronger electric fields. In comparing the 3-wire and 9-wire channel segments having the same inlet gas velocity, the longer of the two channels would be expected to have a higher collection efficiency due to its higher SCA. The 3- and 9-wire channel segments operating at the same current density also have different distributions of space charge density and electric field: The average |E| in the 9-wire channel segment (1.37 × 10⁵ V/m) is about twice that in the 3-wire segment (6.57 × 10⁴ V/m) when both are operating at 0.11 mA/m2. Even for both 3-wire and 9-wire channel segments energized to 0.11 mA/m2, the higher E-field of the longer channel segment increases particle saturation charge, particle drift velocities, and rates of PM collection independent of the increased collection surface area and SCA. In light of these considerations, along with the six PM2.5 collection efficiency results determined from present and previous simulations, Figure 5 also presents four continuous collection efficiency curves predicted from D-A analyses of dp = 2.5 μm particles. The four D-A-predicted collection efficiency curves represent the two ESP channel segment lengths (3 and 9 wire) and two values of current density (0.11 and 0.89 mA/m2). Each combination presents a different particle charging environment because different space charge density values are needed to achieve the same current density in ESP channel segments of different lengths. Each of the four D-A-predicted collection efficiency curves for dp = 2.5 μm is based on the spatially averaged transverse drift velocity of all 2.5 μm particles as determined from the corresponding numerical simulation. Because a D-A analysis assumes that both the electric field and particle transverse drift velocity (for a specified dp) are uniform, the effects of fluid–electric coupling cannot be represented, making it a useful point of comparison both for PM collection efficiency and for interpreting the effects of EHD phenomena.
The two highest collection efficiency curves for dp = 2.5 μm predicted by D-A analyses correspond to the higher current density (0.89 mA/m2) and the lowest collection efficiency curve corresponds to the lower current density (0.11 mA/m2), irrespective of the channel segment length (Figure 5). These D-A-predicted results confirm the known relationships between higher current densities and higher particle collection through higher particle saturation charge irrespective of EHD considerations. This is evident when considering the example of a 7- μm particle: assuming the conditions in Table 1, increasing current density from 0.11 to 0.89 mA/m2 increases its saturation charge on average by more than an order of magnitude (from 112e− to 3810e−), with corresponding increases in transverse drift velocity, rates of collection, and overall collection efficiency. Saturation charges on particles of dp = 2.5 μm and their resulting transverse drift velocities are different for the 3-wire and 9-wire geometries energized to 0.11 mA/m2, a consequence of the different space charge density and electric field distributions needed to impose the same current density within the two domains having different numbers of discharge electrodes (by a factor of 3). Under these conditions, the combined differences in particle saturation charge and the distribution of the gradient of the electric potential yield average dp = 2.5 μm transverse drift velocities computed from the COMSOL results that differ by a factor of 4 between the 3-wire (0.002 m/s) and 9-wire (0.008 m/s) channel segments at 0.11 mA/m2. These same combined effects yielded more similar transverse drift velocities between the two channel segments at 0.89 mA/m2 (0.022 and 0.023 m/s). The impact of these differences on the D-A-predicted removal efficiencies is a more pronounced performance difference between the two channel segments at 0.11 mA/m2 than at 0.89 mA/m2 for all values of SCA.
Comparing the six PM2.5 (i.e., dp < 2.5 μm) numerical simulation results to the D-A-predicted results, there is very good agreement, less than 1% point difference, for the 3-wire channel segment at the lower current density value (0.11 mA/m2) for both values of SCA (8.6 and 66.7 s/m). Under these fluid and electrical conditions, EHD effects are essentially non-existent, and the electric field is not sufficiently strong that spatial variations in particle drift velocities translate into deviations from D-A-predicted collection efficiencies. For the longer 9-wire channel segment at 0.11 mA/m2 current density, the increased SCA compared to the 3-wire channel segment leads to correspondingly higher predictions of particle removal efficiency. For equivalent SCA, the numerical simulation results for the 9-wire channel segment are marginally to significantly higher than the corresponding D-A-predicted results: several percentage points higher at SCA = 21.5 s/m and 10% points higher at SCA = 166.7 s/m. The two methods employ the same values for particle charge and the same average electric field (a spatially uniform value for the D-A analysis, derived from the spatially resolved E-field calculated in the numerical simulation). Consequently, the differences between the two methods in predicting particle removal efficiency are not likely attributable to SCA, particle charge, current density, or electric field. Because the D-A analysis assumes dp = 2.5 μm, whereas the numerical simulation considers PM2.5 (i.e., dp ≤ 2.5 μm), it would be expected that the D-A analysis would predict higher PM removal efficiencies than the numerical simulation and its contingent of 1.5 μm particles and their slower drift velocities. The opposite trend is evident in Figure 5, with higher PM removal efficiencies predicted by the numerical simulation. The answer to this apparent contradiction may be the result of the uniform E-field assumption inherent in the D-A analysis.
Figure 6 presents D-A-predicted and numerically simulated particle fluxes for dp = 2.5 μm particles to the walls of a 3-wire channel segment energized to 0.11 mA/m2. The D-A analysis and its assumption of a spatially uniform electric field yield a gradually and monotonically decreasing particle flux, while the particle flux derived from the numerical simulation is much more dynamic, starting near 0 at the channel inlet and rapidly rising to exceed the D-A-predicted particle flux in regions surrounding each of the three discharge electrodes. At 0.11 mA/m2 in the 3-wire channel segment (Figure 6, upper), the predicted dp = 2.5 μm collection efficiency determined from D-A analysis (1.7%) is nearly the same as that determined by the numerical simulation (1.8%), confirming that D-A analyses and their assumption of spatially uniform E-field introduce negligible error in predicted PM collection efficiencies at low current densities. However, considering the 9-wire channel segment still at 0.11 mA/m2 current density, predicted dp = 2.5 μm removal efficiencies for the two methods begin to diverge with the numerical simulation predicting higher removal efficiency (20.5%) than the D-A analysis (16.2%). Even at values of current density unlikely to produce EHD effects, Figure 6 shows that non-uniformity of the electric field leads to local maxima in particle wall fluxes, maxima whose influence on overall PM collection efficiency grows with E-field strength even when holding SCA, current density, and particle charge constant and absent the influence of EHD phenomena. Thus, PM removal efficiencies determined at high current density conditions likely represent the influences of both EHD phenomena and the non-uniform particle fluxes driven by non-uniform E-fields, none of which is captured by D-A analyses and their assumptions of spatially uniform E-fields.
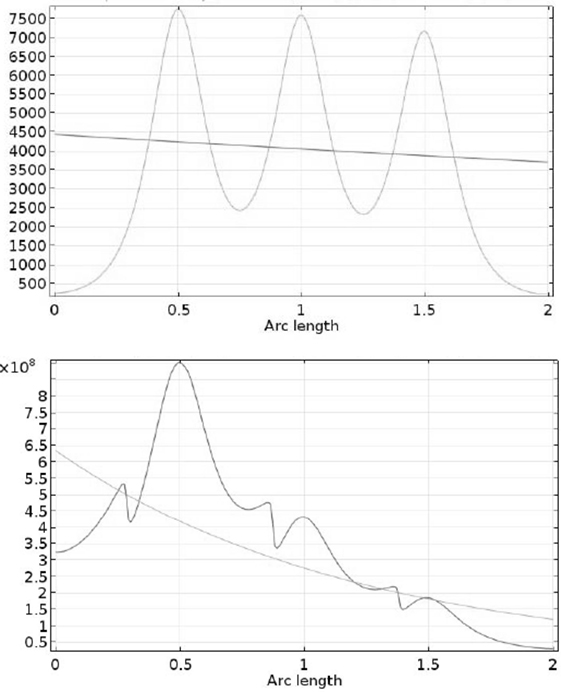
Figure 6. Numerical simulation and Deutsch-Anderson analysis of the flux of dp = 2.5 μm particles to collection electrodes of a 3-wire ESP channel segment at 0.11 mA/m2 (upper) and 0.89 mA/m2 (lower) current density. Conditions as listed in Table 1.
At the higher value of current density (0.89 mA/m2), EHD-driven fluid flow patterns become significant, potentially contributing to any differences between the numerical simulation results and the D-A-predicted results for PM removal efficiency, particularly given that the D-A-predicted results categorically cannot capture EHD effects. Figure 6, lower, shows particle fluxes for the 3-wire channel segment energized to 0.89 mA/m2. Particle fluxes at 0.89 mA/m2 are of much greater magnitude [O(108)] than at 0.11 mA/m2 [O(103)]. The numerical simulation results more clearly exhibit a streamwise decay trend in particle flux comparable to the D-A-predicted flux, most evident in the dramatic decay in peak particle flux in the vicinity of the three discharge electrodes. Particularly noticeable are the sharp inflexions in particle flux immediately upstream of the three electrodes. These correspond to the recirculation zones (see Figure 7, lower) and the regions of reverse flow, wall impingement, and flow separation from the wall that they engender. The effects of these recirculation zones on particle flux are superimposed on the periodic behavior corresponding to the peaks in electric field around the discharge electrodes. The discrepancies between D-A-predicted dp = 2.5 μm removal efficiency and the numerical simulation results likely reflect, in part, the spatial resolution in particle flux that is not captured in the D-A analysis.
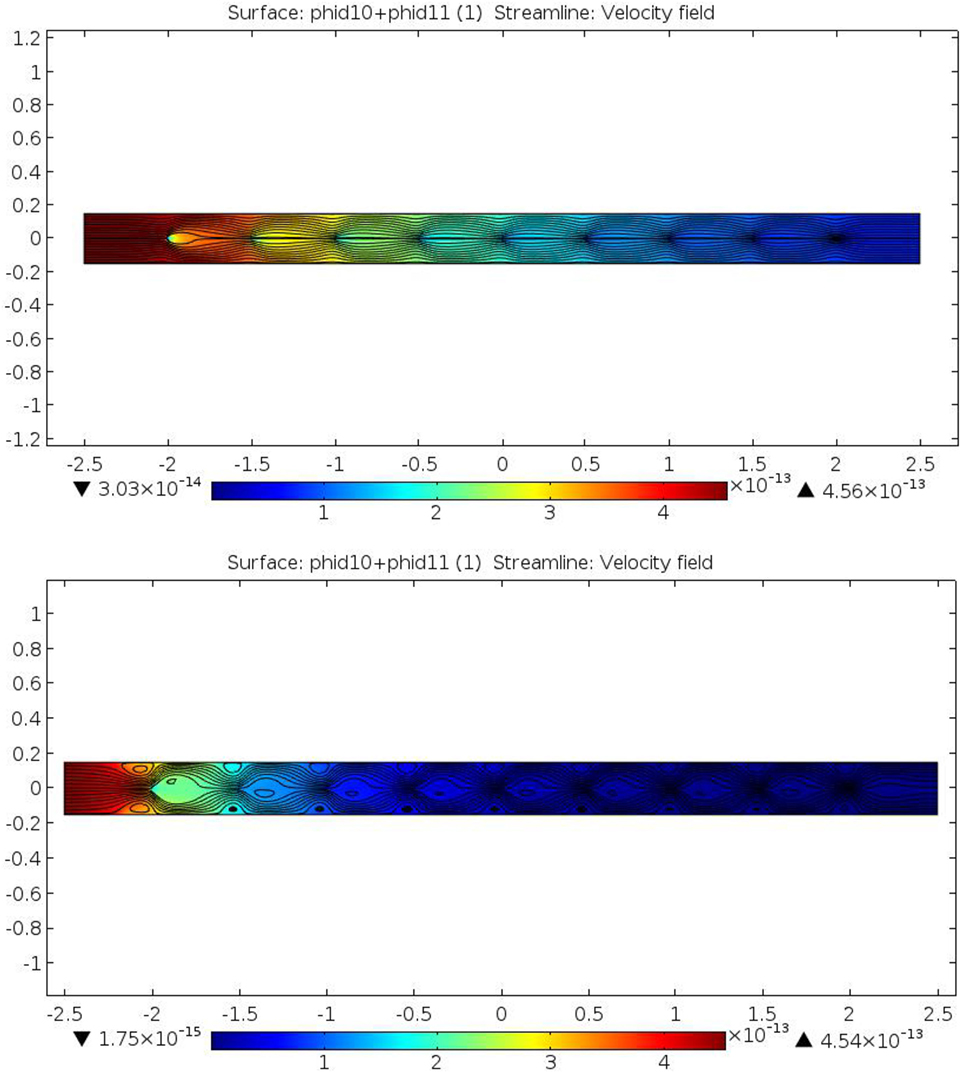
Figure 7. PM2.5 volume fraction in a 9-wire ESP channel segment under low (0.11 mA/m2, upper) and high (0.89 mA/m2, lower) EHD conditions. Conditions as listed in Table 1.
Figure 5 shows that compared to the predicted results at 0.11 mA/m2, both numerical simulation and D-A analysis predict markedly higher collection efficiencies at 0.89 mA/m2 for all values of SCA. Although D-A analyses predicted markedly higher collection efficiencies for the 9-wire channel segment compared to the 3-wire segment when both are energized to 0.11 mA/m2 due to the former’s generally higher electric field and higher particle saturation charge, at 0.89 mA/m2, D-A-predicted results are quite similar between both channel segment lengths. As was the case at 0.11 mA/m2, at 0.89 mA/m2, numerical simulation results are higher than D-A-predicted results: higher by 12% points at SCA = 66.7 s/m and by 2% points at SCA = 166.7 s/m. The latter is still a significant increase in the context of removal efficiencies exceeding 97% in an asymptotic region where incremental performance increases require disproportionate increases in operating conditions. Figure 7 shows numerical simulation results of the distributions of PM2.5 concentration in a 9-wire channel segment at 0.11 and 0.89 mA/m2. Figure 7 considers only PM2.5 concentrations because particles of such size present the greatest challenge to ESP performance, are most relevant to current air quality regulations, and to distinguish their behavior from that of the coarser PM fraction that is collected more rapidly and for which total PM collection efficiency exerts an outsized influence on overall PM collection efficiency. Compared to 0.11 mA/m2, at 0.89 mA/m2, PM2.5 concentration reduces more rapidly in the along the length of the channel segment (Figure 4). Also shown in Figure 4 are streamline patterns that reveal the prominence of EHD phenomena in the two fluid flows; the characteristic periodic converging-diverging patterns that are more evident under the 0.89 mA/m2 conditions could promote more rapid collection of PM2.5.
Trace Gaseous Pollutant Adsorption: Influences of EHD Phenomena
Figure 5 shows mercury (Hg) concentration distributions resulting from numerical simulations of a 9-wire ESP channel segment energized to 0.11 (upper) and 0.89 (lower) mA/m2. Both results illustrate the rapid reduction in Hg concentration at the channel segment entrance where particle concentrations, and therefore gas-particle mass transfer, are highest and downstream of which the majority of particles have been removed and streamwise Hg concentration gradients become negligible. The key feature distinguishing the results at the higher current density condition is the appearance of Hg-lean regions in a periodic pattern along the channel segment walls. The periodic regions of low Hg concentration are generally more prominently featured than similar regions in the PM2.5 concentration results and coincide with the pairs of EHD-induced recirculation zones along the channel segment walls at the higher current density condition. Distributed in between the paired, EHD-induced recirculation zones are regions of jetted fluid in which fluid velocities substantially exceed U0 and are responsible for the transport of inlet concentrations of Hg and PM well into the channel segment. For both the 0.11 and 0.89 mA/m2 conditions, the centerline region is generally characterized by low PM concentrations and high Hg concentration relative to areas at the same axial position but nearer to the channel walls. Overall, Hg removal efficiency in the 9-wire channel segment for the log-normal PSD is higher (17.2%) at the lower current density of 0.11 mA/m2 than at 0.89 mA/m2 under the influence of EHD phenomena (9.4%). Generally, as rates of PM removal increase, particles remain suspended in the gas for shorter periods of time, reducing the opportunity for in-flight adsorption of trace pollutants. Consequently, intercomparisons between the trends in PM2.5 removal efficiency and Hg removal efficiency are illustrative. As shown in Figure 5 and discussed previously for the 3-wire and 9-wire channel segments, D-A analysis confirms that even when two ESP channel segments are operated at comparable values of current density and SCA, the longer channel segment imposes a stronger electric field with a more intense particle charging environment leading to higher particle removal efficiencies than the shorter segment. In our recent analysis of particle and trace pollutant removal within ESPs under conditions that are unfavorable to EHD (Clack, 2015), numerical simulation results for conditions well below the threshold for onset of EHD phenomena demonstrated that, all other conditions being comparable, more rapid particle collection diminishes trace pollutant adsorption by the in-flight mechanism. For the present results, the same trends are evident when comparing results with and without EHD phenomena. Comparing results obtained for the 3-wire channel segment, increasing current density from 0.11to 0.89 mA/m2 causes PM2.5 removal efficiency for the log-normal PSD to increase from 13.4 to 90.4% and Hg removal efficiency to decrease from 27.7 to 5.9%. The results for the finer skewed PSD reflect its greater concentration of fine particles: increasing current density from 0.11 to 0.89 mA/m2 produces the same trends in PM2.5 removal efficiency (10.7% increasing to 83.3%) and Hg removal efficiency (80% decreasing to 44.7%) involving values of each that are, respectively, lower and higher than corresponding values for the coarser log-normal PSD. In addition to the effects of more rapid particle collection as discussed previously (Clack, 2015), these results reflect the influences of EHD phenomena. It is worth noting that the decrease in Hg removal efficiency at the higher value of current density suggests that the higher gas-particle mass transfer that results from higher particle slip velocities is offset by the reduction in gas-particle mass transfer caused by the loss of particles and available particle surface area.
Mercury removal through the in-flight mechanism is strongly influenced by the collective particle surface area available in the fluid flow and the time available for gas-particle mass transfer to that collective surface. The pronounced EHD-driven flow patterns evident at 0.89 mA/m2 in Figures 7 and 8 include regions of fluid convergence where fluid velocity magnitude can reach 2.5 U0. EHD-induced fluid acceleration means shorter fluid residence or transit times through the channel and less time available for gas-particle mass transfer, ultimately producing a lower Hg removal efficiency.
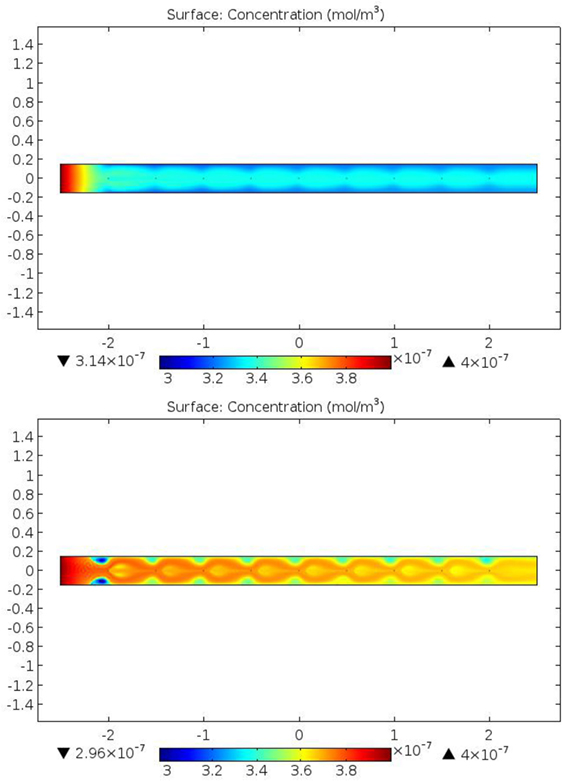
Figure 8. Evolution of trace mercury (Hg) concentration in a 9-wire ESP channel segment under low (0.11 mA/m2, upper) and high (0.89 mA/m2, lower) current density. Conditions as listed in Table 1.
The two indentified mechanisms through which high current densities and EHD phenomena impact Hg removal efficiency—more highly charged particles removed more rapidly from the flow and EHD-driven acceleration of fluid and particle transport—can be considered separately by considering numerical simulations at high current density in which the electric body force term of the Navier–Stokes equations has been disabled. For a 3-wire channel segment operating at a current density of 0.89 mA/m2, U0 = 0.2 m/s, and the electric body force term enabled, predicted PM2.5 collection efficiencies are 90.4% for the log-normal PSD and 83.3% for the skewed PSD. The results of tracking 10 1-μm, neutrally charged and neutrally buoyant tracer particles through this flow field revealed a range of particle transit times, from 8.25 s to as short as 6.3 s, times that are 17 to 37% shorter than the 10 s average residence time that would be determined from a plug flow analysis given the inlet velocity (U0 = 0.2 m/s) and the channel segment length (2 m). These results provide strong evidence of the non-uniform fluid acceleration induced by EHD phenomena. Disabling the electric body force to eliminate EHD phenomena increased PM2.5 collection efficiencies: 97.4% for the log-normal PSD and 87.3% for the skewed PSD. With the electric body force disabled, systematic increases in U0 decreased PM2.5 collection efficiency in numerical simulations: When U0 was increased from 0.2 m/s to 0.24 (+ 17%) and 0.32 (+ 37%) m/s, predicted PM2.5 removal efficiencies decreased to 94.3 and 86.3%, respectively, for the log-normal PSD and to 86.2 and 76.3%, respectively, for the skewed PSD. The corresponding Hg removal efficiency results suggest that the presence of EHD phenomena, despite the negative impacts on PM2.5 removal efficiency, actually enhances Hg removal. For the log-normal PSD, numerical simulation results with electric body force terms enabled and U0 = 0.2 m/s yielded the highest Hg removal efficiency (5.9%), higher than the three results in which EHD phenomena were eliminated: U0 = 0.2 m/s (5.7% Hg removal efficiency), 0.24 m/s (5.45%), and 0.32 m/s (5%). For these results, it appears that EHD-induced fluid acceleration and jetting through the channel segment were offset by higher Hg removal in other portions of the channel segment, most likely in the Hg-lean paired recirculation zones (Figure 8). In the absence of EHD phenomena, these regions are eliminated, and plug flow simulations through the channel achieve approximately the same or lower Hg removal depending on what value of U0 is used (or not used) to achieve fluid transit times through the channel segment that are comparable to those induced in the presence of EHD phenomena. For the skewed PSD, numerical simulation results with electric body force terms enabled and U0 = 0.2 m/s achieved an Hg removal efficiency (44.7%) that was greater than two of the three results in which EHD phenomena were eliminated; the highest Hg removal efficiency (46.3%) was predicted in the simulation without EHD phenomena and in which there was no increase in U0 to achieve comparable fluid transit times through the channel segment (i.e., U0 = 0.2 m/s). Taking the log-normal and skewed PSD results together, the results suggest that EHD phenomena both promote and diminish Hg removal, with particle size distribution helping to determine the net overall effect. Finally, it bares noting that spatial non-uniformities in the E-field, velocity field, and concentration fields (whether particle or gas) cannot be accommodated within the assumptions underlying classical analytical or quasi-1-D approaches to modeling ESP performance.
Conclusion
This study advances fundamental understanding of EHD phenomena and their influences on particulate removal and trace gaseous pollutant removal within industrial ESPs. 2-D numerical simulations reveal differences in the collection patterns of PM and gaseous pollutants as a function of imposed current density, length of the wire-plate ESP channel, and the particle size distribution of the suspended particles. Comparisons to the classical D-A ESP performance prediction equation show that the high current densities required to induce EHD phenomena also lead to higher electric fields and greater saturation charge on particles, both of which promote more rapid particle collection independent of the onset of EHD phenomena. However, even when accounting for such enhancement, numerical simulations of fine PM collection generally agree with classical equations for predicting ESP performance at low current densities but predict higher collection efficiency than the classical equations at higher current densities. Trace pollutant removal by the in-flight mechanism of gas-particle adsorption is shown to be both promoted and diminished by the presence of EHD phenomena. Accelerations of the fluid caused by the electric body force reduce the time available for gas-particle mass transfer. However, this is offset to varying degrees by the greater degree of trace pollutant adsorption that occurs in key regions of the flow in which fluid recirculation occurs. The relative magnitude of the promotion and diminution mechanisms appears to be dependent on the initial distribution of particle sizes and likely will also depend on geometric factors characterizing the ESP channel.
Author Contributions
HC is wholly responsible for the entire content of this manuscript.
Conflict of Interest Statement
The author declares that the research was conducted in the absence of any commercial or financial relationships that could be construed as a potential conflict of interest.
Funding
No sponsored research funds were used in the completion of this work.
References
Back, A., and Cramsky, J. (2012). Comparison of numerical and experimental results for the duct-type electrostatic precipitator. Int. J. Plasma Environ. Sci. Technol. 6, 33–42.
Calvert, S., and Englund, H. M. (1984). Handbook of Air Pollution Technology. New York, NY: John Wiley and Sons.
Clack, H. L. (2006a). Mass transfer within ESPs: in-flight adsorption of mercury by charged suspended particulates. Environ. Sci. Technol. 40, 3617–3622. doi: 10.1021/es050246+
Clack, H. L. (2006b). Particle size distribution effects on gas-particle mass transfer within electrostatic precipitators. Environ. Sci. Technol. 40, 3929–3933. doi:10.1021/es051649c
Clack, H. L. (2009). Mercury capture within coal-fired power plant electrostatic precipitators: model evaluation. Environ. Sci. Technol. 43, 1460–1466. doi:10.1021/es8015183
Clack, H. L. (2013). “Computational modeling of electrohydrodynamically-influenced mercury adsorption within ESPs,” in 11th International Conference on Electrostatic Precipitation (Bangalore, India).
Clack, H. L. (2015). Simultaneous removal of particulate matter and gas-phase pollutants within electrostatic precipitators: coupled in-flight and wall-bounded adsorption. Aerosol Air Qual. Res. 15, 2445–2455. doi:10.4209/aaqr.2015.06.0280
Cooper, C. D., and Alley, F. C. (2011). Air Pollution Control: A Design Approach. Long Grove, IL: Waveland Press.
Friedlander, S. K. (2000). Smoke, Dust and Haze, Fundamentals of Aerosol Dynamics. Oxford: Oxford University Press.
Han, B., Kim, H. J., and Kim, Y. J. (2010). Fine particle collection of an electrostatic precipitator in CO2-rich gas conditions for oxy-fuel combustion. Sci. Total Environ. 408, 5158–5164. doi:10.1016/j.scitotenv.2010.07.028
IEEE-DEIS-EHD Technical Committee. (2003). Recommended international standard for dimensionless parameters used in electrohydrodynamics. IEEE Trans. Dielectr. Electr. Insul. 19, 3–6. doi:10.1109/TDEI.2003.1176545
Kallio, G. A., and Stock, D. E. (1992). Interaction of electrostatic and fluid dynamic fields in wire-plate electrostatic precipitators. J. Fluid Mech. 240, 133–166. doi:10.1017/S0022112092000053
Kim, H., Han, B., Woo, C., Kima, Y., Ono, R., and Oda, T. (2014). Performance evaluation of dry and wet electrostatic precipitators used in an oxygen-pulverized coal combustion and a CO2 capture and storage pilot plant. J. Aerosol Sci. 77, 116–126. doi:10.1016/j.jaerosci.2014.07.003
Leonard, G. L., Mitchner, M., and Self, S. A. (1983). An experimental study of the electro-hydrodynamic flow in electrostatic precipitators. J. Fluid Mech. 127, 123–140. doi:10.1017/S0022112083002657
Noda, N., and Makino, H. (2010). Influence of operating temperature on performance of electrostatic precipitator for pulverized coal combustion boiler. Adv. Powder Technol. 21, 495–499. doi:10.1016/j.apt.2010.04.012
Prabhu, V., Kim, T., Khakpour, Y., Serre, S., and Clack, H. L. (2012). On the electrostatic precipitation of fly ash-powdered mercury sorbent mixtures. Fuel Process. Technol. 93, 8–12. doi:10.1016/j.fuproc.2011.09.006
Reynolds, J. (2004). “Multi-pollutant control using membrane-based up-flow west electrostatic precipitation,” in National Energy Technology Laboratory Report on Wet ESP Performance at First Energy’s Bruce Mansfield Plant. U.S. Department of Energy.
Seames, W. S., and Wendt, J. (2000). Partitioning of arsenic, selenium, and cadmium during the combustion of Pittsburgh and Illinois #6 coals in a self-sustained combustor. Fuel Process. Technol. 63, 179–196. doi:10.1016/S0378-3820(99)00096-X
Seetharama, S., Benedict, A., and Reynolds, J. (2013). “Comparison of wet and dry electrostatic precipitator (ESP) technologies,” in 13th International Conference on Electrostatic Precipitation (Bangalore, India).
Shanthakumar, S., Singh, D. N., and Phadke, R. C. (2008). Flue gas conditioning for reducing suspended particulate matter from thermal power stations. Prog. Energy Combust. Sci. 34, 685–695. doi:10.1016/j.pecs.2008.04.001
Yamamoto, T., and Sparks, L. E. (1986). Numerical simulation of three-dimensional tuft corona and electrohydrodynamics. IEEE Trans. Ind. Appl. 22, 880–885. doi:10.1109/TIA.1986.4504808
Zhao, L., and Adamiak, K. (2008). Numerical simulation of the electrohydrodynamic flow in a single wire-plate electrostatic precipitator. IEEE Trans. Ind. Appl. 44, 683–691. doi:10.1109/TIA.2008.921453
Keywords: electrohydrodynamics, electrostatic precipitator, ESP, particulate matter, mercury, activated carbon
Citation: Clack HL (2017) Numerical Simulation of Simultaneous Electrostatic Precipitation and Trace Gas Adsorption: Electrohydrodynamic Effects. Front. Energy Res. 5:3. doi: 10.3389/fenrg.2017.00003
Received: 05 September 2016; Accepted: 16 February 2017;
Published: 21 March 2017
Edited by:
Kalpit V. Shah, RMIT University, AustraliaReviewed by:
Milinkumar Shah, Curtin University, AustraliaLaltu Chandra, Indian Institute of Technology Jodhpur, India
Copyright: © 2017 Clack. This is an open-access article distributed under the terms of the Creative Commons Attribution License (CC BY). The use, distribution or reproduction in other forums is permitted, provided the original author(s) or licensor are credited and that the original publication in this journal is cited, in accordance with accepted academic practice. No use, distribution or reproduction is permitted which does not comply with these terms.
*Correspondence: Herek L. Clack, hclack@umich.edu