 Rachel Freeman
- UK Energy Research Centre and Tyndall Centre for Climate Change Research, School of Mechanical, Aerospace and Civil Engineering, The University of Manchester, Manchester, United Kingdom
The paradox underlying the rebound effect is that, due to secondary effects, improvements in resource efficiency provide smaller reductions in the consumption of energy and/or material resources than are expected—or even an overall net increase in resource use. The rebound effect has played a role in economic growth and industrialization, yet it remains a problem for the task of reducing negative environmental impacts. This paper proposes that the size of the rebound effect, and the type of impacts it causes, may be affected by future changes in the system within which it arises. Four types of rebound effect are considered: economy-wide effects, transformational effects, frontier effects, and international rebound effects. A conceptual model of the historical role of the rebound effect in socio-technical systems, and the relationship of socio-technical systems with natural capital and human-created capital, provides a “sandbox” for testing ideas about the future. The model theory draws upon the concepts of natural capital, the Global Ecological Footprint, and the Great Acceleration. How the size of four types of the rebound effect might change in future, as supplies of resources from natural capital become more constrained, is discussed within three storylines. In the first storyline, natural capital declines but remains fairly stable; rebound is much decreased as resources are less available and efficiency is used up more in stabilizing supplies of goods and services. In the second storyline, growth continues without constraint amid regional rivalry; eventually there is a strong downturn in availability of resources and negative impacts on both society and natural capital. In the third storyline, impact caps are implemented for different types of resources; for some time, industry and society adapt by investing in low resource-use innovation and global cooperation on management of natural capital; once natural capital recovers and stabilizes, growth and consumption may increase along with the rebound effect, but staying within a Global Ecological Footprint of 1 Earth. The theory and model in this paper are intended to contribute to new thinking on the subject of the rebound effect.
Introduction
The paradox underlying the rebound effect is that, due to secondary effects, improvements in resource efficiency provide smaller reductions in the consumption of energy and/or material resources than are expected—or even an overall net increase in resource use. The rebound effect has been well described and analyzed by many authors and its fundamental mechanism is not challenged in this paper. Rather, this paper proposes that the magnitude of the rebound effect and the type of impacts it causes will be affected by future changes in the system within which it arises. The rebound effect has been seen at many levels of society, from the individual, to the nation, to across nations. This paper only considers the rebound effect at the macro level (national economy) and upwards. Four types of rebound effect are considered: economy-wide effects, transformational effects, frontier effects, and international rebound effects.
The rebound effect occurs within socio-technical systems (Geels, 2004) such as transport, energy supply and demand, and industry. The approach taken in this paper is to create a conceptual model of the historical role of the rebound effect within socio-technical systems, and the relationship of socio-technical systems with stocks of natural capital and human-created capital. The conceptual model is provided solely as a “sandbox” for testing ideas and is not simulated. The theory guiding development of the model draws upon the concepts of natural capital, the Global Ecological Footprint, and the Great Acceleration. The model represents global flows of energy and material resources and waste, during the Great Acceleration, between stocks of natural capital, human-created capital, and waste.
Widespread resource constraints are expected in future decades due to the ongoing decline in stocks of non-renewable natural capital (e.g., fossil fuels and mined minerals), and a decline in the stability and size of the ecosystems that make up renewable natural capital. The conceptual model is used to consider how the size and impacts of the rebound effect might change in future, if socio-technical systems are impacted by resource constraints. Three storylines, based partly on the Shared Socioeconomic Pathways (SSPs) (Riahi et al., 2015), theorize about what the role of the rebound effect could be in the future. All the storylines envisage some forms of the rebound effect shrinking or disappearing—although perhaps only temporarily. The most optimistic storyline describes a future in which an impact cap ensures that natural capital becomes stabilized and the Global Ecological Footprint stays below 1 Earth. In this storyline, once natural capital has stabilized the rebound effect might actually play a role in improving access to goods and services (G&S). The theory and model in this paper are intended to contribute to new thinking on the subject of the rebound effect.
Background
Mechanisms of the Rebound Effect
The rebound effect is generally understood to mean that due to secondary effects, improvements in resource efficiency such as energy efficiency provide smaller reductions in the consumption of energy and/or material resources than are expected. Secondary effects can lead to an overall net increase in resource use—also known as backfire (Sorrell, 2009). To simplify language, this paper does not distinguish between backfire and rebound.
The rebound effect has been observed in the supply and consumption of numerous types of G&S. The rebound effect is most commonly analyzed with economic tools, for example in (Holm and Englund, 2009; Koesler et al., 2016); however, Turner (2013) finds that this approach limits the discussion of the rebound effect. The rebound effect in energy efficiency is the most well studied manifestation, for example in Birol and Keppler (2000) and Stapleton et al. (2016). The size and characteristics of the rebound effect change within different temporal and spatial boundaries. Sorrell (2009) finds that over the lifetime of technologies, the rebound effect in energy efficiency is more likely to occur during the innovation and early adopter stages within the Bass diffusion curve (Bass, 1969). The rebound effect is generally higher in industrializing (developing) nations than in mature economies because of higher growth rates, more intensive use of energy, higher energy costs, and being in the earlier stages of the diffusion curve for key energy using services—as seen in China's high rates of rebound effect in energy use (Brockway et al., 2017).
Macro-level rebound effects, seen at the level of national economies, occur due to “the interaction between different actors, both producers and consumers, in the economy” (Hertwich, 2005). At this level, the rebound effect has been described by several authors as playing a key role in economic growth—for example: “it is the rebound effect that translates technological efficiency improvements into economic growth” (Birol and Keppler, 2000); energy efficiency is a major driver of economic growth (Ayres and Warr, 2009). Studies of efficiency and resource use with longer historical timelines indicate the presence of the rebound effect for different technology types. Dahmus (2014) identified net growth in resource use in the USA for 10 types of resources and G&S over several decades, ranging from aluminum to freight—despite concurrent improvements in resource efficiency. Fouquet and Pearson (2006) presented trends in energy and consumption in lighting in the UK between 1,700 and 2,000; analysis of their data shows that during that period energy use for lighting increased by a factor of 39 despite lighting technology efficiency growing by a factor of 925. At the national level, the long-term macro-economic rebound effect from energy efficiency was estimated to be 15% in the Netherlands (Berkhout et al., 2000).
Four types of the rebound effect, at the macro level and upwards, are considered in this paper:
• Secondary rebound effects (input-output effects) occur when technological efficiency reduces the cost of production, which leads to reduced prices for G&S, and therefore increased demand for G&S, and finally increased demand for resources (Hertwich, 2005). This reflects the basic working of rebound at the household or organizational levels, aggregated at the macro level.
• Transformational rebound effects occur when changes in technologies lead to changes in consumer preferences, social institutions, and the organization of production (Greening et al., 2000). Examples of this include changes to business models (e.g., local to global trading due to the internet), and improvements in production efficiency from automation—which enable cheaper and more available G&S, which increases consumption.
• The theory of frontier effects proposes that they arise as emergent properties of efficiency gains “enable the creation of entirely new products, applications, and even whole new industries” (Saunders, 2013). The theory, proposed by Jenkins et al., is that frontier effects arise as emergent properties of efficiency improvements that have multiple applications, which have “complex and synergistic impacts on the productivity or supply of other factors of production as well, driving more complex and ultimately greater impacts on energy demand (Jenkins et al., 2011). Frontier effects are also seen where several efficiency improvements occur at the same time and interact with each other. For example, personal computers were unaffordable for most households up to the 1990s, yet are now ubiquitous in industrialized countries, and new formats such as tablets and laptops have been added to desktops, multiplying the total number of devices. Rapid improvements in computer chip speeds, along with reduced size and energy use, have been key factors in driving the continual growth of this industry. The concept of frontier rebound is not yet well established. A causal connection between efficiency improvements and the development of new industries has not yet been proven, although it is clear that they are often correlated. Emergent properties in complex systems are extremely difficult to model and so the proof of frontier rebound, if it does happen, may take some time. Despite this, this paper uses the term frontier effects because of its relevance when considering the rebound effect over decades and at a global scale, which Jenkins et al. state “will likely be somewhat larger than even the most sophisticated global integrated models are able to project” (ibid.).
• International rebound effects occur when the transfer of resource-conserving technologies lead to increasing resource use since the transfer is not accompanied by incentives to improve resource efficiency. In fact, “the primary function of any technology transfer is to make the recipient a richer country” (Sarr and Swanson, 2017). Examples include the expected doubling of light-duty vehicles by 2050 due to rising affluence, especially in China, India, and South East Asia (Creutzig et al., 2015).
Natural Capital and Resources
Capital, in its various forms, can be described as “a stock able to generate a flow” (Mancini et al., 2017). Natural capital is the stock of natural resources that generate a flow that can be used by socio-technical systems. Natural capital has been defined in several ways. For example: the total stock of “minerals, ecosystems, the atmosphere and so on” (Costanza et al., 1998); the “stock of renewable and non-renewable resources (e.g., plants, animals, air, water, soils, minerals) that combine to yield a flow of benefits to people”1 and as the aggregate of “all the biophysical stocks which produce both ecosystem goods (raw materials and mineral resources) and ecosystem services” (Boumans et al., 2002).
Ecosystem G&S are described as follows: “Ecosystem services include: soil formation, gas regulation, climate regulation, nutrient cycling, disturbance regulation, recreation and culture, and waste assimilation. Ecosystem goods include: water, harvested organic matter, mined ores, and extracted fossil fuel” (Boumans et al., 2002). While ecosystem goods can accumulate or be depleted at a certain rate, ecosystem services cannot. Noted here, but not discussed in any detail, are the numerous feedbacks between ecosystem services and the production of ecosystem goods; for example, climate regulation supports more reliable production of organic matter and soil formation, which in turn supports climate regulation.
Ecosystem G&S can be considered as either renewable or non-renewable, the difference being determined by the rate of regeneration (Mancini et al., 2017). The following definitions are used in this paper:
(i) Renewable resources are those ecosystem G&S that regenerate within relatively short timeframes (e.g., decades). There are two categories of interest to this paper: (i) provisioning of nutrition, materials and energy (e.g., fresh water, organic matter, biofuels, soil formation, marine foodstuffs); (ii) regulation and maintenance (e.g., atmospheric gas regulation, climate regulation, nutrient cycling, waste dilution and sequestration, pest and disease control, etc.) (Haines-Young and Potschin, 2011). Ekins et al. (2003) note that waste assimilation can either add to the stock of renewable resources through processes such as composting, or can cause environmental deterioration such as industrial pollutants in rivers.
(ii) Non-renewable resources are ecosystem goods that regenerate over very long time frames (e.g., geological ages). They include non-renewable organic sources (fossil fuels), metals, minerals, and secondarily as plastics derived from fossil fuels (Ayres and Ayres, 2002). A study of global resource supplies found that future scarcity problems are most likely to occur for non-renewable minerals before fossil fuels (Valero et al., 2010).
Serious degradation of natural capital would cause declines in many resource supplies used by society (King et al., 2015), and humanity's over-use of environmental functions is already having negative impacts on ecosystem stability and resilience (Ekins et al., 2003). Future impacts on resources will include, amongst many others, unreliable weather caused by climate change (IPCC, 2014) affecting food production, and decline of marine life caused by overfishing and/or increased ocean acidity (Pörtner, 2014) affecting supplies of seafood. These will, in turn, affect the functioning of socio-technical systems.
The Global Ecological Footprint
One way to describe the health of natural capital is with the concept of the Ecological Footprint, which compares “human demands on natural capital with the ability of natural capital to produce the services that humans use” (Wackernagel et al., 2004). Ecological footprinting measures “how much life-supporting natural capital, expressed in biologically productive area, is necessary to meet the resource demand and waste absorption requirements of a given population.” It can be done at scales from local to global (Mancini et al., 2017). The Ecological Footprint calculation incorporates fossil energy, built up area, arable land, pasture, forest, and sea, and it is measured in units of global hectares (Wackernagel et al., 1999). Of the non-renewable resources it includes only fossil fuels and not mined ores. Included in the footprint is a hypothetical forest area that is large enough to take up the CO2 being released from the burning of fossil fuels. Whenever the Ecological Footprint exceeds available biocapacity, this indicates that natural capital is being gradually liquidated, a state described as “overshoot” (Wackernagel et al., 2004).
According to data form the Global Footprint Network2 the Global Ecological Footprint has been in a state of overshoot since 1970, and the cumulative Global Ecological Footprint deficit, as of 2013, is 13.6 Earths. This deficit represents society's overuse of the capacity of ecosystems to sequester CO2 emissions, which has been observed in the ever-increasing accumulation of atmospheric CO2 above pre-industrial levels. Although atmospheric concentrations have increased, the average surface temperature has not yet risen above 2°C—the point at which most climate scientists predict that major negative impacts will be seen. One main reason is that oceans are taking up 93% of the extra energy being added to the climate system, acting as an enormous buffer (Victor and Kennel, 2014).
The Great Acceleration
The Great Acceleration describes socio-economic trends from 1945 to today (Steffen et al., 2011a). Rapid, exponential growth has been seen in resource use, human population and economy, and infrastructure, along with corresponding declines in natural capital and increases in waste (Steffen et al., 2015). While the period from 1945 to today has seen particularly fast rates of socio-economic change, many of these trends started at a much gentler pace at the beginning of the industrial revolution (around 1850). Table 1 describes six types of trends included in the Great Acceleration study and two example trends for each type taken from the study data.
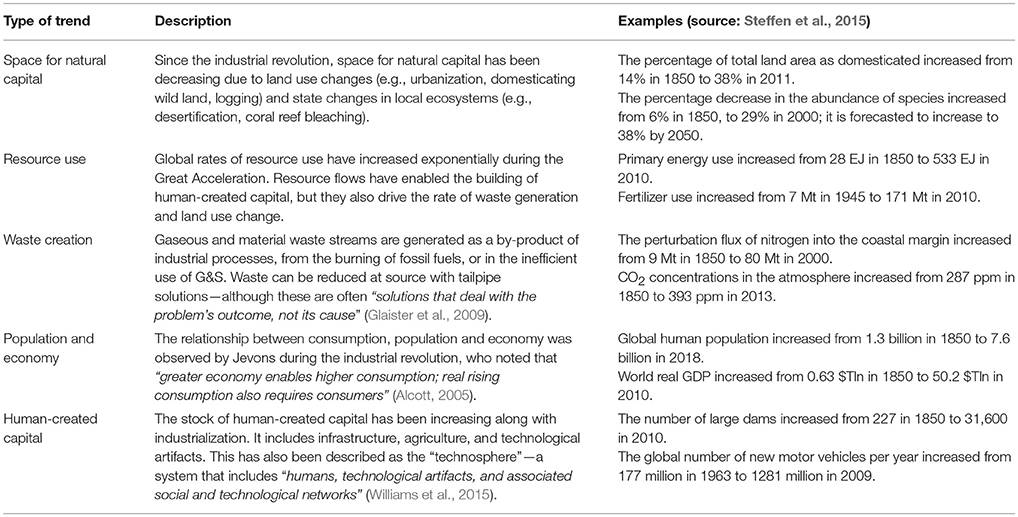
Table 1. Trends in the Great Acceleration with examples of changes in indicators.
Method
Theory building for this paper is supported with the development of a conceptual stock and flow model that represents: (i) stocks of natural capital, human-created capital, and waste; (ii) the resource flows between them; and (iii) the causes of the resource flows. The approach used in this paper is similar to that of the Social-ecological Systems Framework: “Actors use resources impacting on the ecological system and may cause externalities in related Social-Ecological Systems. These externalities feedback to the social system in that the productivity of the system changes affecting the harvesting rates” (Binder et al., 2013). A similar model was published by Mancini et al. (2017); the authors developed a comprehensive framework of the dynamics between stocks and flows of natural capital and ecosystem services; they found that representing ecosystem services as stocks and coupling these with the concept of the Ecological Footprint could help in distinguishing between the use of flows and the consumption of stocks of resources. Other examples of similar approaches include (Boumans et al., 2002; Collins et al., 2011; Motesharrei et al., 2016; van Vuuren et al., 2016).
The modeling approach is based on the system dynamics methodology (Forrester, 1994) which proposes that the behavior of a system arises largely from its structure (Sterman, 2001). The rebound effect has been modeled with system dynamics by other authors. For example, policy resistance to fuel efficient cars was studied using used system dynamics, with the model including the rebound effect in the reduced cost of driving from efficiency (Stasinopoulos et al., 2012); a system dynamics model of the relevance of information and communication technologies for sustainability represented rebound in freight transport as a demand elasticity (Hilty et al., 2006).
System dynamics can be used to describe system behavior by modeling dynamic interactions between different types of system elements. System dynamics models are made up of three types of elements: (i) stocks (represented as boxes), which represent accumulations of things; the sizes of stocks generally change slowly over time; (ii) rates (represented as wide arrows with a flow symbol), which represent the size and speed of flows between stocks; and (iii) auxiliaries, which can be defined as constants such as exogenous influences on the system, or as variables which calculate outputs based on inputs from other system elements. System dynamic models usually contain dynamic structures, which contribute to the observed behavior of the whole system. These include reinforcing feedback loops that grow indefinitely until interrupted, balancing feedback loops that are goal seeking and grow until a goal or limit is reached, and nonlinear dynamics created by the interaction of physical and institutional structures with the decision-making processes of agents acting within the system (Sterman, 2000). System dynamics models are commonly parameterized, calibrated, and simulated to test system behavior under different conditions. They can also be used un-parameterized to communicate a theory, or a dynamic hypothesis (Coyle and Exelby, 1999), about system behavior. This paper presents a highly simplified, conceptual model used to convey a theory, as advocated by other authors (e.g., Ghaffarzadegan and Richardson, 2011), which is not simulated. It is provided as a “sandbox” to explore ideas, and as a way to diagrammatically represent the system of interest.
One phenomenon that is often recognized in system dynamics is the role of buffers in systems. Buffers slow down the response of a system to shocks and stresses; their presence can lead to complacency in those using stocks of resources. For example, if an urban area draws upon a local reservoir at an unsustainable rate, in which reservoir charging is slower than water extraction, the reservoir will continue to supply water at a constant rate up until the point where the water level drops below the level of the intake pipe. If, however, water is extracted from a river then the seasonal changes in water flows and the impacts of drought are seen almost immediately and overexploitation is difficult (Meadows, 1997). Buffers are a key aspect of the subject of this paper.
Why was system dynamics chosen for this paper when other approaches, such as agent based modeling, could have been used to take a speculative look at the rebound effect in the future? The core idea of this paper is that the rebound effect plays a role in causing changes to the environment in which it arises, and that eventually, if the environment changes enough, the strength of the rebound effect in its different forms will be affected. The core idea can be described as an extremely large-scale (global) and slow-moving (over decades) balancing feedback loop, with buffering effects slowing down the feeding back process. Whether this very slow and very large feedback may exist or not (now or in the future) is explored in the following two sections. System dynamics is particularly suitable for exploring the core idea of the paper since it can represent the underlying structures that change very slowly over time, the dynamic factors that drive changes in flows, and the relationships between structures and dynamic factors.
When modeling the rebound effect, a common approach is to represent economic growth as an exogenous factor that is unaffected by the rebound effect. To explore the core idea of the paper, the system boundary has to be extremely large, since this theoretical balancing effect would not exist within a smaller boundary. Because the model has such an extremely wide boundary, no exogenous control variables are included that might influence the system in any ad-hoc way. Not to say definitively that none exist, but just to say that exogenous variables are not needed in order to develop the theory presented in this paper. In other words, economic growth is endogenous, or causal, within the same system as the rebound effect.
Development of the storylines in section A Theory About the Future of the Rebound Effect was based on insights gained from developing the model, combined with the possible futures described in the chosen SSPs. The theory on dynamics and structure described by the model was extended into the future, according to the direction that societies around the world take on the management of natural capital and the growth of socio-technical systems that are described in the SSPs. The differences in the SSPs could lead to different changes in the strength and direction of the feedback loops, and therefore different effects on natural capital. This provided a basis for theorizing about possible changes to the size and role of the four types of rebound effect discussed in the paper.
A Model of the Rebound Effect During the Great Acceleration
This section presents a conceptual model of the role of the rebound effect during the Great Acceleration. This historical view lays the foundation for imagining different futures for the rebound effect in section A Theory About the Future of the Rebound Effect. The model diagram is shown in Figure 1, a description of model stocks is in Table 2, and a description of feedback loops along with their causal implications is in Table 3.
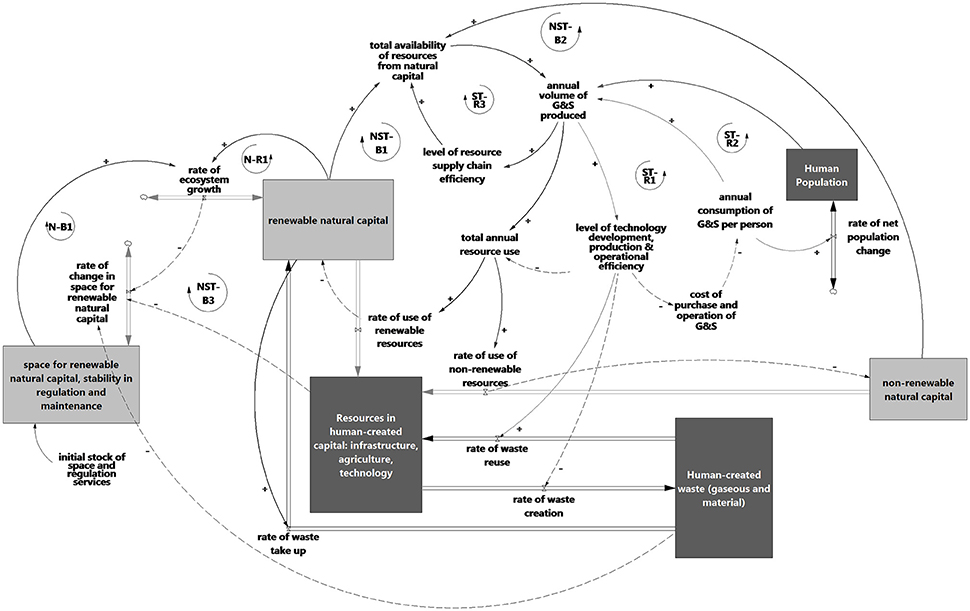
Figure 1. Conceptual model representing the role of the rebound effect in the Great Acceleration. Stocks related to natural capital are light gray rectangles with black text; human-created stocks are dark gray rectangles with white text. Double arrows are flows of physical things (e.g., resources, people, waste). Solid arrows with a “+” sign indicate positive causation (a rise or fall in the first element causes a corresponding rise or fall in the second element); dashed arrows with a “–“ sign indicate negative causation (a rise or fall in the first element causes a corresponding fall or rise in the second element). Feedback loops are labeled “N-“ for natural capital related, “ST-“ for socio-technical related, or “NST-“ for feedbacks between natural capital and socio-technical systems. Reinforcing loops are labeled “-R” and balancing loops are labeled “-B”.
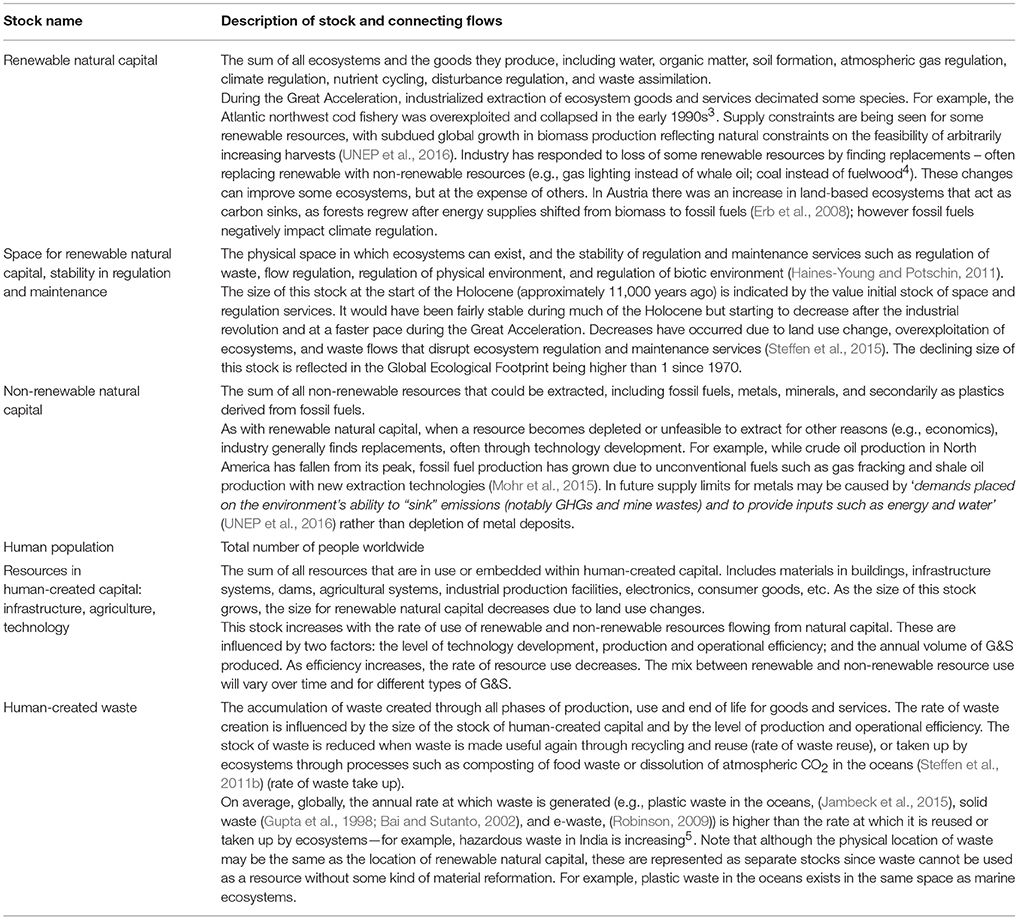
Table 2. Description of model stocks and the flows between them.
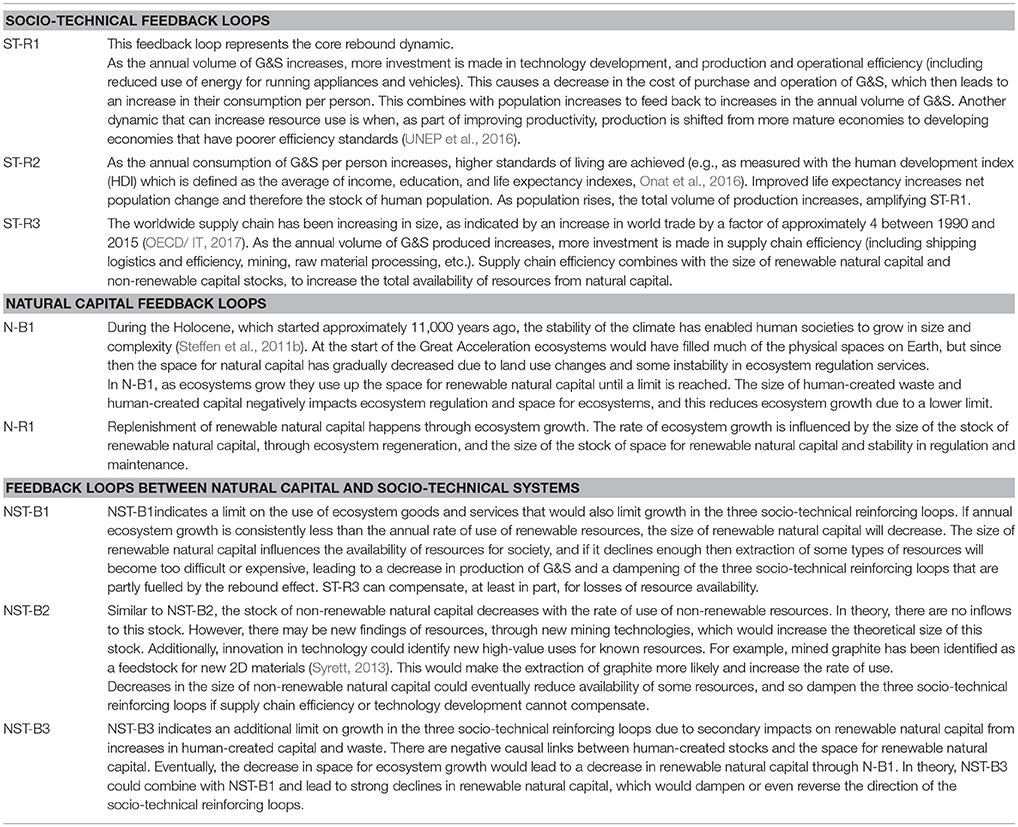
Table 3. Feedback loops in the model and their causal implications.
The model described in this section represents a theory about trends in natural capital and human-created capital during the Great Acceleration. During this time, due to high rates of resource use and waste creation, humanity began liquidating some parts of the stock of natural capital (Fiksel, 2006). Through a stock and flow structure, the model represents trends of increasing stocks of human-created capital and waste, and decreasing stocks of natural capital. The engine of this trend is represented by three interacting reinforcing loops, representing socio-technical systems that are fuelled in part by the rebound effect. Despite there being many indicators of ecological overshoot, such as increasing rates of species losses (Barnosky et al., 2011), there is little evidence of there being any influence from three balancing loops in the model—NST-B1, NST-B2, and NST-B3—that limit socio-technical growth according to the availability of resources. In fact, per capita global material extraction per year rose from approximately 6.5 tons in 1970 to over 10 tons in 2010 (UNEP et al., 2016). The next section uses the model to develop a theory about the future.
A Theory About the Future of the Rebound Effect
This section presents three storylines about how the size and role of the rebound effect may change in coming decades, as the impact of ecological overshoot and depletion of non-renewable resources begin to have an effect. The storylines combine insights from the model with three of the published Shared Socioeconomic Pathways (SSPs), which were created by the climate change research community to describe “plausible major global developments that together would lead in the future to different challenges for mitigation and adaptation to climate change” (Riahi et al., 2015). Possible non-resource effects of the storylines on society are not discussed.
Storyline One: The Rebound Effect Declines and Natural Capital Is Stable but Degraded and at Risk
Storyline One draws upon SSP2, called “Middle of the Road”: “Social, economic, and technological trends do not shift markedly from historical patterns. Environmental systems experience degradation, although there are some improvements and overall the intensity of resource and energy use declines. Global population growth is moderate and levels off in the second half of the century” (Riahi et al., 2015).
In Storyline One, current high rates of economic growth and associated resource use decline, but growth continues along with gradual depletion of natural capital. While the health of ecosystems is not prioritized over economic growth, many societies acknowledge the benefits of ecosystem preservation, including climate and other regulation. Interventions to limit environmental damage to ecosystems are enacted in many regions, but these are partial. Natural capital stocks continue to decline, and the Global Ecological Footprint remains higher than 1 Earth, but the decline is at a reduced pace. Eventually, possibly after 2050 and partly caused by climate change impacts, reduced resource availability starts to significantly increase the cost of production and operation of G&S. Driven by higher costs and a growing population, there is increasing emphasis on maintaining affordable supplies of G&S by improving supply chain and production efficiency. Efficiency has physical limits, however (Cullen and Allwood, 2010). Due to restrained growth there is only limited investment capital available for R&D to develop new materials, food supplies, and energy sources. Eventually, due to increasing resource constraints, the limits of efficiency, the lack of affordable new technologies that can be quickly rolled out, and changing environmental conditions from locked-in climate change, the Human Development Index (HDI) starts to fall in some regions. Growth in most socio-technical systems is close to zero. Natural capital remains largely stable but degraded and smaller, and there is more vulnerability to failure in individual ecosystems.
Table 4 presents a summary of how different types of rebound effects might play out under Storyline One.
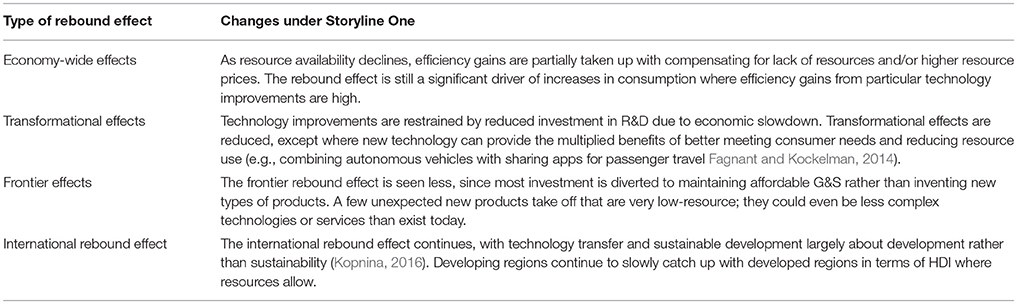
Table 4. Storyline one changes in four types of macro-level rebound effects.
Storyline Two: The Rebound Effect Turns Negative With Strong Declines in Natural Capital
Storyline Two draws upon SSP3, called “Regional Rivalry—a Rocky Road”: “Countries focus on achieving energy and food security goals within their own regions. Economic development is slow, consumption is material-intensive, and inequalities persist or worsen over time. A low international priority for addressing environmental concerns leads to strong environmental degradation in some regions” (Riahi et al., 2015).
In Storyline Two the Great Acceleration continues at an unrestrained pace, with the Global Ecological Footprint staying near its current rate of around 1.62. A combination of climate change, direct negative effects on ecosystems, and high rates of resource extraction stresses ecosystems. Sooner than expected, possibly before 2040, these continual stressors lead to the crossing of ecological thresholds for some ecosystems “into states deleterious or even catastrophic to human well-being” (Rockström et al., 2009). Rates of natural capital regeneration fall, or regeneration changes its location or form (such as when species migrate) making resource harvesting more difficult and requiring changes to industrial supply chains. Non-renewable natural capital stocks also decline, drawn down at increasing rates; some non-renewable resources become scarce. Balancing loops NST-B1 and NST-B2 start to dominate. Resource constraints strongly impact socio-technical systems, as the cost of resources rises and availability declines, and this has negative effects on industry, infrastructure, world trade, and society in general. The Human Development Index (HDI) falls in some regions. The three socio-technical reinforcing loops start to run in the opposite direction. As the cost of G&S rise, due to rising costs for resources, consumption per person falls, production falls, and investment in efficiency falls. Negative rebound sets in, as disinvestment occurs because profits decline and so there is less investment in capital stock (Turner, 2009). Societies respond by retracting international cooperation on environmental protection, such as the Paris climate agreement and the Convention on Biological Diversity. Instead, they prioritize ensuring their access to resources and survival of their industries. Environmental damage increases as the costs of environmental protection are diverted elsewhere, and investment is made instead in finding new sources for resources. Some investment in R&D for new materials and energy sources continues, but in the spirit of regional rivalry rather than global cooperation.
Table 5 presents a summary of how different types of the rebound effect might play out under Storyline Two.
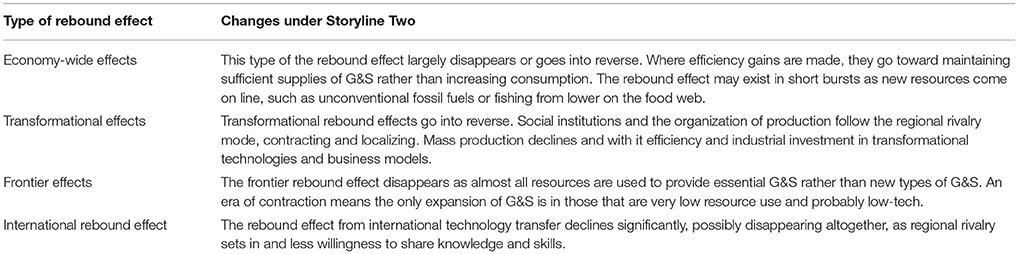
Table 5. Storyline two changes in four types of macro-level rebound effects.
Storyline Three: The Rebound Effect Disappears for Some Time While Natural Capital Is Stabilized but Then Returns
Storyline Three draws upon SSP1, called “Sustainability—Taking the Green Road”: “The world shifts gradually, but pervasively, toward a more sustainable path, emphasizing more inclusive development that respects perceived environmental boundaries. Management of the global commons slowly improves… Consumption is oriented toward low material growth and lower resource and energy intensity” (Riahi et al., 2015).
In Storyline Three, after some time the preservation of natural capital is achieved and global society stops going into ecological overshoot; the Global Ecological Footprint is brought down to 1 Earth or less. This is achieved through the application of impact caps, rather than “end-of-pipe” environmental protection measures. Impact caps set a limit on the impacts that are allowed to happen to natural capital. For energy use, impact cap interventions could include, for example, “limiting energy consumption per person (quotas, rations)…limit consumption of energy inputs to the level perceived to be sustainable” (Alcott, 2010). Similar impact caps would need to be defined for renewable and non-renewable resources, based on scientific evidence on the maximum sustainable rate of resource extraction and generation of waste flows.
The idea of an impact cap for renewable natural capital is explored through Figure 2, which is a simplified version of Figure 1. In Figure 2 growth in socio-technical systems is no longer linked to the stock of renewable natural capital, but to the annual production of ecosystem goods and services. A new balancing loop, LIMIT-B, restricts resource use to only that generated annually by ecosystems. The three socio-technical reinforcing loops would be expected to show strong improvements in technology development and resource efficiency, but with little rebound effect and its associated increases in resource use. After some years of living only from the interest on natural capital, assuming enough stability in climate and other regulation services, natural capital would start to stabilize and eventually start to increase in size. Then the annual availability of resources would increase, lessening (but not eliminating) restrictions on the growth in socio-technical systems. Rebound might return, although this time well managed, and consumption levels could rise again. The balancing loop LIMIT-B would continue to dominate the three reinforcing loops.
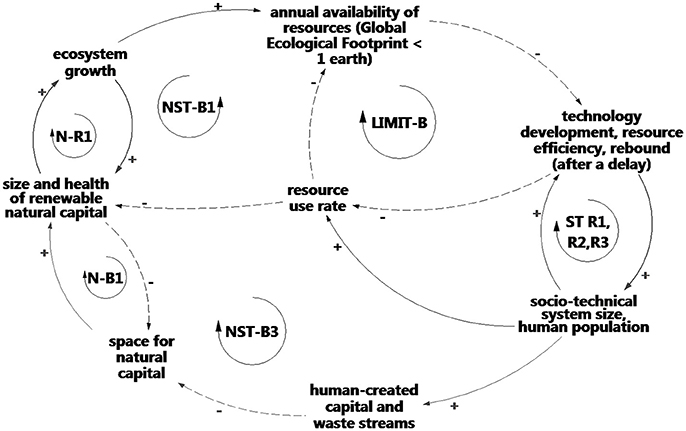
Figure 2. In storyline three a new balancing loop, LIMIT-B ensures availability of renewable resources is defined by the rate of ecosystem regeneration rather than the total natural capital stock. Rebound disappears while natural capital recovers, but eventually as natural capital grows resource availability increases and rebound may reappear.
One approach that could contribute to achieving the impact cap for material use is the circular economy. The circular economy concept proposes cutting raw material consumption and the creation of waste through increasing the re-use of resources within closed loop cycles (Reichel et al., 2016). Examples of circular processes include: industrial symbiosis, in which there is an “exchange of by-products, materials and energy between companies in the same geographical vicinity” (De Angelis et al., 2018); the use of waste CO2 to create low-carbon methanol (Turner et al., 2012); and the use of waste plastic to replace some of the materials used to surface roads6. Globally, only 6% of processed materials currently follow a circular flow back into use (increasing to 37% if all biomass is included) (Haas et al., 2015). A perfectly circular economy is not possible due to entropy (Skene, 2017) but increasing circularity would help to make up for reduced availably of resources due to an impact cap.
It is difficult to say what the relationship between costs and rebound might be in the theoretical future of storyline three, based on this simplistic model. New types of economic policies or accounting tools are likely to be needed to bring the idea of impact caps into reality. One concern is that the implementation of impact caps could have negative impacts on the economics of industry due to increased resource costs and increased costs for disposal of waste. This could lead to negative rebound, which would actually impede progress toward sustainability. Economic policies and investment decisions would need to be designed to avoid the risk of negative rebound. Worldwide cooperation on technology development for industrial sustainability would help to multiply the benefits of R&D investment in different regions.
Table 6 outlines how different types of rebound might change in storyline three.
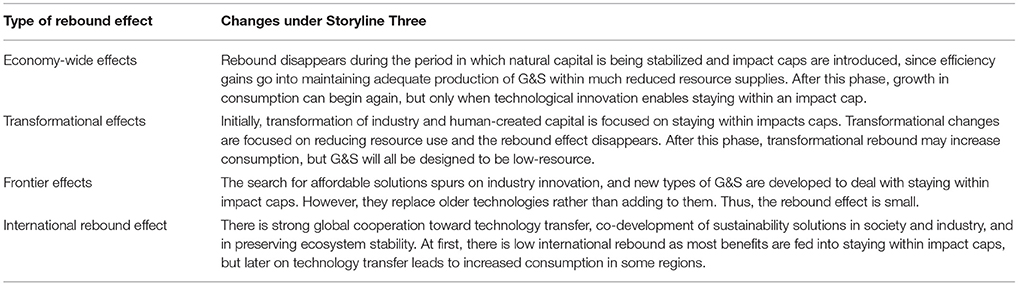
Table 6. Storyline three changes in four types of macro-level rebound effects.
Discussion
The system dynamics model and three storylines explored the core idea of the paper, which is that an extremely large-scale (global) and slow-moving (over decades) balancing feedback loop may exist between socio-technical systems (partly driven by the rebound effect) and natural capital—with buffering effects slowing down the feeding back process. To model this, an extremely wide boundary was adopted for system modeling. This approach differs from the many approaches to modeling the rebound effect that represent economic growth as an exogenous factor, unaffected by the rebound effect. In this model economic growth is endogenous, or causal, within the same system as the rebound effect. Viewing the rebound effect within such a wide boundary has allowed its future size and its different manifestations be considered in a new way. The rebound effect can be seen as a benefit or a dis-benefit, depending on the metric being discussed and the point of view of the observer. Within a model boundary that is large enough, both these conflicting views can be included and contrasted.
Use of the SSPs provided guidance in considering a hugely uncertain future. A theory was developed for each SSP based on the model, and the role of the four types of rebound in that future was described based on the structure of the model. None of the three storylines presented in this paper are ideal from the perspectives of today's human population, ecosystems, or future generations. The size of the constraints on resources that are likely to come into play in future will depend on how well natural capital is managed, including aspects such as international cooperation and protection for ecosystems. In storylines one and two, shortages in resources may cause unwanted changes in socio-technical systems, while for storyline three this change would be due to voluntarily imposed impact caps and would be only temporary.
Many transformative, and unfortunately negative, changes are expected to occur in natural capital in the coming decades. It seems reasonable to theorize that the size and impacts of different types of rebound effect will be affected by these changes. Results of this theoretical study imply that rebound may not continue to be such an important factor as it has been up to now.
Conclusions
The paradox underlying the rebound effect is that, due to secondary effects, improvements in resource efficiency provide smaller reductions in the consumption of energy and/or material resources than are expected—or even an overall net increase in resource use. The rebound effect has been well described and analyzed by many authors and its fundamental mechanism is not challenged in this paper. Rather, this paper proposes that the magnitude of the rebound effect and the type of impacts it causes will be affected by future changes in the system within which it arises. The rebound effect has been seen at many levels of society, from the individual, to the nation, to across nations. This paper only considers the rebound effect at the macro level (national economy) and upwards. Four types of rebound effect are considered: economy-wide effects, transformational effects, frontier effects, and international rebound effects.
The rebound effect occurs within socio-technical systems (Geels, 2004) such as transport, energy supply and demand, and industry. The approach taken in this paper is to create a conceptual model of the historical role of the rebound effect within socio-technical systems, and the relationship of socio-technical systems with stocks of natural capital and human-created capital. The conceptual model is provided solely as a “sandbox” for testing ideas and is not simulated. The theory guiding development of the model draws upon the concepts of natural capital, the Global Ecological Footprint, and the Great Acceleration. The model represents global flows of energy and material resources and waste, during the Great Acceleration, between stocks of natural capital, human-created capital, and waste.
Widespread resource constraints are expected in future decades due to the ongoing decline in stocks of non-renewable natural capital (e.g., fossil fuels and mined minerals), and a decline in the stability and size of the ecosystems that make up renewable natural capital. The conceptual model is used to consider how the size and impacts of the rebound effect might change in future, if socio-technical systems are impacted by resource constraints. Three storylines, based partly on the Shared Socioeconomic Pathways (SSPs) (Riahi et al., 2015), theorize about what the role of the rebound effect could be in the future. All the storylines envisage some forms of the rebound effect shrinking or disappearing—although perhaps only temporarily. The most optimistic storyline describes a future in which an impact cap ensures that natural capital becomes stabilized and the Global Ecological Footprint stays below 1 Earth. In this storyline, once natural capital has stabilized the rebound effect might actually play a role in improving access to goods and services.
The theory and model in this paper are intended to contribute to new thinking on the subject of the rebound effect. To explore the core idea of the paper an extremely wide boundary was adopted for system modeling. Viewing the rebound effect within such a wide boundary has allowed its future size and its different manifestations to be considered in a new way. The rebound effect can be seen as a benefit or a dis-benefit, depending on the metric being discussed and the point of view of the observer. Within a model boundary that is large enough, both these conflicting views can be included and contrasted. None of the three storylines presented in this paper are ideal from the perspectives of today's human population, ecosystems, or future generations. In storylines one and two, shortages in resources may cause unwanted changes in socio-technical systems, while for storyline three this change would be due to voluntarily imposed impact caps and would be only temporary.
Many transformative, and unfortunately negative, changes are expected to occur in natural capital in the coming decades. It seems reasonable to theorize that the size and impacts of different types of rebound effect will be affected by these changes. Results of this theoretical study imply that rebound may not continue to be such an important factor as it has been up to now.
One Sentence Summary
The rebound effect reduces expected savings from resource efficiency; in future, as society sees increasing resource constraints, the rebound effect may disappear in some of its forms; however, it could also play a role within a sustainable future if it is well managed.
Author Contributions
RF is the sole author for this paper. RF would like to acknowledge the valuable contributions, in terms of ideas and challenging discussions, from colleagues at the Systems Centre, University of Bristol; the Tyndall Centre for Climate Change Research, University of Manchester; the Earth Systems Engineering group at the University of Newcastle; and numerous others in the system dynamics community.
Funding
The author is funded through the UK Energy Research Centre project called RACER (Rapid Acceleration of Car Emissions Reductions), under the UKERC Flexible Fund Round 2, EPSRC award EP/L024756/01.
Conflict of Interest Statement
The author declares that the research was conducted in the absence of any commercial or financial relationships that could be construed as a potential conflict of interest.
Footnotes
1. ^Natural Capital Coalition https://naturalcapitalcoalition.org/natural-capital/
2. ^Global Footprint Network https://www.footprintnetwork.org/
3. ^Grid Arendal. http://www.grida.no/resources/6067
4. ^History Today https://www.historytoday.com/alan-d-dyer/wood-and-coal-change-fuel
5. ^Banega Swachh India https://swachhindia.ndtv.com/indias-deadliest-waste-pile-up-the-rising-rate-of-hazardous-wastes-7856/
6. ^MacRebur http://www.macrebur.com/
References
Alcott, B. (2010). Impact caps: why population, affluence and technology strategies should be abandoned. J. Clean. Prod. 18, 552–560. doi: 10.1016/j.jclepro.2009.08.001
Ayres, R., and Ayres, L. (2002). A Handbook of Industrial Ecology. Cheltenham; Northampton, MA: Edward Elgar Publishing
Ayres, R., and Warr, B. (2009). “Energy efficiency and economic growth: the ‘Rebound Effect' as driver,” in Energy Efficiency and Sustainable Consumption, eds H. Herring, and S. Sorrell (London: Palgrave Macmillan), 119–135. doi: 10.1057/9780230583108
Bai, R., and Sutanto, M. (2002). The practice and challenges of solid waste management in Singapore. Waste Manag. 22, 557–567. doi: 10.1016/S0956-053X(02)00014-4
Barnosky, A. D., Matzke, N., Tomiya, S., Wogan, G. O., Swartz, B., Quental, T. B., et al. (2011). Has the Earth's sixth mass extinction already arrived? Nature 471, 51–57.doi: 10.1038/nature09678
Bass, F. (1969). A new product growth model for consumer durables. Manage. Sci. 15, 215–227. doi: 10.1287/mnsc.15.5.215
Berkhout, P. H. G., Muskens, J. C., and Velthuijsen, J. W. (2000). Defining the rebound effect. Energy Policy 28, 425–432. doi: 10.1016/S0301-4215(00)00022-7
Binder, C. R., Hinkel, J., Bots, P., and Pahl-wostl, C. (2013). Frameworks for analyzing social-ecological systems. Ecol. Soc. 18:26. doi: 10.5751/ES-05551-180426
Birol, F., and Keppler, J. H. (2000). Prices, technology development and the rebound effect. Energy Policy 28, 457–469. doi: 10.1016/S0301-4215(00)00020-3
Boumans, R. M. J., Castanea, R., Farley, J., Wilson, M. A., Rotmans, J., Villa, F., et al. (2002). Modeling the dynamics of the integrated earth system and the value of global ecosystem services using the GUMBO model. Ecol. Econ. 41, 529–560. doi: 10.1016/S0921-8009(02)00098-8
Brockway, P. E., Saunders, H., Heun, M. K., Foxon, T. J., Steinberger, J. K., Barrett, J. R., et al. (2017). Energy Rebound as a Potential Threat to a Low-Carbon Future: findings from a new exergy-based national-level rebound approach. Energies 10:51 doi: 10.3390/en10010051
Collins, S. L., Carpenter, S. R., Swinton, S. M., Orenstein, D. E., Childers, D. L., Gragson, T. L., et al. (2011). An integrated conceptual framework for long-term social-ecological research. Front. Ecol. Environ. 9, 351–357. doi: 10.1890/100068
Costanza, R., d'Arge, R., de Groot, R., Farber, S., Grasso, M., Hannon, B., et al. (1998). The value of the world's ecosystem services and natural capital. Nature 387, 253–260.
Coyle, G., and Exelby, D. (1999). The Validation of commercial system dynamics models. Syst. Dyn. Rev. 16, 27–41.
Creutzig, F., Jochem, P., Edelenbosch, O. Y., Mattauch, L., van Vuuren, D. P., McCollum, D., et al. (2015). Transport: a roadblock to climate change mitigation? Science 350, 911–912. 10.1126/science.aac8033
Cullen, J. M., and Allwood, J. M. (2010). Theoretical efficiency limits for energy conversion devices. Energy 35, 2059–2069. doi: 10.1016/j.energy.2010.01.024
Dahmus, J. B. (2014). Can Efficiency Improvements Reduce Resource Consumption? A Historical Analysis of Ten Activities. J. Ind. Ecol.18, 883–897.doi: 10.1111/jiec.12110
De Angelis, R., Howard, M., and Miemczyk, J. (2018). Supply chain management and the circular economy: towards the circular supply chain. Prod. Plan. Control 26, 425–437. doi: 10.1080/09537287.2018.1449244
Ekins, P., Simon, S., Deutsch, L., Folke, C., and De Groot, R. (2003). A framework for the practical application of the concepts of critical natural capital and strong sustainability. Ecol. Econ. 44, 165–185. doi: 10.1016/S0921-8009(02)00272-0
Erb, K. H., Gingrich, S., Krausmann, F., and Haberl, H. (2008). Industrialization, fossil fuels, and the transformation of land use: an integrated analysis of carbon flows in Austria 1830-2000. J. Ind. Ecol. 12, 686–703. doi: 10.1111/j.1530-9290.2008.00076.x
Fagnant, D. J., and Kockelman, K. M. (2014). The travel and environmental implications of shared autonomous vehicles, using agent-based model scenarios. Transp. Res. C Emerg. Technol. 40, 1–13. doi: 10.1016/j.trc.2013.12.001
Fiksel, J. (2006). Sustainability and Resilience: toward a systems approach. Sustain. Sci. Pract. Policy 2, 14–21. doi: 10.1080/15487733.2006.11907980
Forrester, J. (1994). System dynamics , systems thinking , and soft OR. Syst. Dyn. Rev. 10, 245–256. doi: 10.1002/sdr.4260100211
Fouquet, R., and Pearson, P. (2006). Seven Centuries of Energy Services: the price and use of light in the United Kingdom (1300-2000). Energy 27, 139–177. doi: 10.5547/ISSN0195-6574-EJ-Vol27-No1-8
Geels, F. (2004). From sectoral systems of innovation to socio-technical systems. Res. Policy 33, 897–920. doi: 10.1016/j.respol.2004.01.015
Ghaffarzadegan, N., and Richardson, G. (2011). How small system dynamics models can help the public policy process. Syst. Dyn. Rev. 27, 22–44.doi: 10.1002/sdr.442
Glaister, B., Hodgson, T., and Beale, N. (2009). The environmental cost of international shipping. Natl. Environ. Law Rev. 4, 58–63.
Greening, L. A., Greene, D. L., and Difiglio, C. (2000). Energy efficiency and consumption - the rebound effect-a survey. Energy Policy 28, 389–401. doi: 10.1016/S0301-4215(00)00021-5
Gupta, S., Mohan, K., Prasad, R., Gupta, S., and Kansal, A. (1998). Solid waste management in India: Options and opportunities. Resour. Conserv. Recycl. 24, 137–154. doi: 10.1016/S0921-3449(98)00033-0
Haas, W., Krausmann, F., Wiedenhofer, D., and Heinz, M. (2015). How circular is the global economy? An assessment of material flows, waste production, and recycling in the European union and the world in 2005. J. Ind. Ecol. 19, 765–777. doi: 10.1111/jiec.12244
Haines-Young, R., and Potschin, M. (2011). Common International Classification of Ecosystem Services (CICES): 2011 Update. Report to the European Environment Agency, Nottingham.
Hertwich, E. (2005). Consumption and the rebound effect: an industrial ecology perspective. J. Ind. Ecol. 9, 85–98. doi: 10.1162/1088198054084635
Hilty, L., Arnfalk, P., Erdmann, L., Goodman, J., Lehmann, M., and Wäger, P. A. (2006). The relevance of information and communication technologies for environmental sustainability – a prospective simulation study. Environ. Model. Softw. 21, 1618–1629. doi: 10.1016/j.envsoft.2006.05.007
Holm, S. O., and Englund, G. (2009). Increased ecoefficiency and gross rebound effect: evidence from USA and six European countries 1960–2002. Ecol. Econ. 68, 879–887. doi: 10.1016/j.ecolecon.2008.07.006
Jambeck, J. R., Geyer, R., Wilcox, C., Siegler, T. R., Perryman, M., Andrady, A., et al. (2015). Plastic waste inputs from land into the ocean. Science 347, 768–771. doi: 10.1126/science.1260352
Jenkins, J., Nordhaus, T., and Shellenberger, M. (2011). Energy Emergence: Rebound & Backfire as Emergent Phenomena. The Breakthrough Institute.
King, D., Schrag, D., Dadi, Z., Ye, Q., and Ghosh, A. (2015). Climate Change: A Risk Assessment. Centre for Policy Research, University of Cambridge. Available online at: http://www.csap.cam.ac.uk/projects/climate-change-risk-assessment/
Koesler, S., Swales, K., and Turner, K. (2016). International spillover and rebound effects from increased energy efficiency in Germany. Energy Econ. 54, 444–452. doi: 10.1016/j.eneco.2015.12.011
Kopnina, H. (2016). The victims of unsustainability: a challenge to sustainable development goals. Int. J. Sustain. Dev. World Ecol. 23, 113–121. doi: 10.1080/13504509.2015.1111269
Mancini, M. S., Galli, A., Niccolucci, V., Lin, D., Hanscom, L., et al. (2017). Stocks and flows of natural capital: implications for ecological footprint. Ecol. Indic. 77, 123–128. doi: 10.1016/j.ecolind.2017.01.033
Mohr, S. H., Wang, J., Ellem, G., Ward, J., and Giurco, D. (2015). Projection of world fossil fuels by country. Fuel 141, 120–135. doi: 10.1016/j.fuel.2014.10.030
Motesharrei, S., Rivas, J., Kalnay, E., Asrar, G. R., Busalacchi, A. J., Cahalan, R. F., et al. (2016). Modeling sustainability: population, inequality, consumption, and bidirectional coupling of the Earth and Human Systems. Natl. Sci. Rev. 3, 470–494. doi: 10.1093/nsr/nww081
OECD/ IT, 2017~OECD/IT. (2017). “ITF Transport Outlook 2017,” International Transport Forum. Paris: OECD Publishing.
Onat, N. C., Kucukvar, M., Tatari, O., and Egilmez, G. (2016). Integration of system dynamics approach toward deepening and broadening the life cycle sustainability assessment framework: a case for electric vehicles. Int. J. Life Cycle Assess. 21, 1009–1034. doi: 10.1007/s11367-016-1070-4
Pörtner, H. O., Karl, D. M., Boyd, P. W., Cheung, W. W. L., Lluch-Cota, S. E., Nojiri, Y., et al. (2014). “Ocean systems,” in Climate Change 2014: Impacts, Adaptation, and Vulnerability. Part A: Global and Intergovernmental, Sectoral Aspects. Contribution of Working Group II to the Fifth Assessment Report of the Panel on Climate Change, eds T. E. B. Field, C. B. V. R. Barros, D. J. Dokken, K. J. Mach, M. D. Mastrandrea, L. L. W. M. Chatterjee, K. L. Ebi, Y. O. Estrada, R. C. Genova, B. Girma, E. S. Kissel, A. N. Levy, S. MacCracken, and P. R. Mastrandrea (Cambridge, UK; New York, NY: Cambridge University Press), 411–484.
Reichel, A., De Schoenmakere, M., and Gillabel, J. (2016). Circular economy in Europe; Developing the knowledge base. European Environment Agency Report 2/2016.
Riahi, K., van Vuuren, D. P., Kriegler, E., Edmonds, J., 'Neill, B. C.O., Fujimori, S., et al. (2015). The Shared Socioeconomic Pathways and their energy, land use, and greenhouse gas emissions implications: an overview. Glob, Environ. Chang. 42, 153–168. doi: 10.1016/j.gloenvcha.2016.05.009
Robinson, B. H. (2009). E-waste: An assessment of global production and environmental impacts. Sci. Total Environ. 408, 183–191. doi: 10.1016/j.scitotenv.2009.09.044
Rockström, J., Steffen, W., Noone, K., Persson, Å., Chapin, F. S.III., Lambin, E., et al. (2009). Planetary Boundaries: exploring the safe operating space for humanity. Ecol. Soc. 14, 81–87. doi: 10.5751/ES-03180-140232
Sarr, M., and Swanson, T. (2017). Will technological change save the world? The rebound effect in international transfers of technology. Environ. Resour. Econ. 66, 577–604. doi: 10.1007/s10640-016-0093-4
Saunders, H. (2013). Is what we think of as “‘rebound”' really just income effects in disguise? Energy Policy 57, 308–317. doi: 10.1016/j.enpol.2013.01.056
Skene, K. R. (2017). Circles, spirals, pyramids and cubes: why the circular economy cannot work. Sustain. Sci. 13, 1–14.doi: 10.1007/s11625-017-0443-3
Sorrell, S. (2009). Jevons' Paradox Revisited: the evidence for backfire from improved energy efficiency. Energy Policy 37, 1456–1469. doi: 10.1016/j.enpol.2008.12.003
Stapleton, L., Sorrell, S., and Schwanen, T. (2016). Estimating direct rebound effects for personal automotive travel in Great Britain. Energy Econ. 54, 313–325. doi: 10.1016/j.eneco.2015.12.012
Stasinopoulos, P., Compston, P., and Jones, H. M. (2012). “Policy resistance to fuel efficient cars and the adoption of next-generation technologies,” in 30th International Conference of the System Dynamics Society (St. Gallen).
Steffen, W., Broadgate, W., Deutsch, L., Gaffney, O., and Ludwig, C. (2015). The trajectory of the Anthropocene: the great acceleration. Anthr. Rev. 2, 81–98. doi: 10.1177/2053019614564785
Steffen, W., Grinevald, J., Crutzen, P., and McNeill, J. (2011a). The Anthropocene: conceptual and historical perspectives. Philos. Trans. R. Soc. A Math. Phys. Eng. Sci. 369, 842–867. doi: 10.1098/rsta.2010.0327
Steffen, W., Persson, A., Deutsch, L., Zalasiewicz, J., Williams, M., Richardson, K., et al. (2011b). The anthropocene: From global change to planetary stewardship. Ambio 40, 739–761. doi: 10.1007/s13280-011-0185-x
Sterman, J. (2000). Business Dynamics: Systems Thinking and Modeling for a Complex World. Boston, MA; London: Irwin/McGraw-Hill.
Sterman, J. (2001). System Dynamics Modeling: tools for learning in a complex world. Calif. Manage. Rev. 43,8–25. doi: 10.2307/41166098
Turner, J. W. G., Pearson, R. J., Harrison, P., Marmont, A., Jennings, R., Verhelst, S., et al. (2012). “Evolutionary decarbonization of transport: a contiguous roadmap to affordable mobility using sustainable organic fuels for transport,” in Sustainable Vehicle Technologies: Driving the Green Agenda (Warwickshire), 71–88.
Turner, K. (2009). Negative rebound and disinvestment effects in response to an improvement in energy efficiency in the UK economy. Energy Econ. 31, 648–666. doi: 10.1016/j.eneco.2009.01.008
Turner, K. (2013). “Rebound” effects from increased energy efficiency: a time to pause and reflect. Energy J. 34, 25–42. doi: 10.5547/01956574.34.4.2
UNEP, Schandl, H., West, J., Giljum, S., Dittrich, M., Eisenmenger, N., et al. (2016). Global Material Flows and Resource Productivity; An Assessment Study of the UNEP International Resource Panel. Paris: United Nations Environment Programme.
Valero, A., Valero, A., and Martínez, A. (2010). Inventory of the exergy resources on earth including its mineral capital. Energy. 35, 989–995. doi: 10.1016/j.energy.2009.06.036
van Vuuren, D., van Soest, H., Riahi, K., Clarke, L., Krey, V., Kriegler, E., et al. (2016). Carbon budgets and energy transition pathways. Environ. Res. Lett. 11:075002. doi: 10.1088/1748-9326/11/7/075002
Victor, D. G., and Kennel, C. F. (2014). Climate policy: ditch the 2°C warming goal. Nature 514, 30–31. doi: 10.1038/514030a
Wackernagel, M., Monfreda, C., Schulz, N., Erb, K.-H., Haberl, H., and Krausmann, F. (2004). Calculating national and global ecological footprint time series: resolving conceptual challenges. Land Use Policy 21, 271–278. doi: 10.1016/j.landusepol.2003.10.006
Wackernagel, M., Onisto, L., Bello, P., Linares, A. C., Falfán, I. S. L., García, J. M., et al. (1999). National natural capital accounting with the ecological footprint concept. Ecol. Econ. 29, 375–390. doi: 10.1016/S0921-8009(98)90063-5
Keywords: the rebound effect, socio-technical systems, system dynamics, natural capital, Global Ecological Footprint
Citation: Freeman R (2018) A Theory on the Future of the Rebound Effect in a Resource-Constrained World. Front. Energy Res. 6:81. doi: 10.3389/fenrg.2018.00081
Received: 28 February 2018; Accepted: 23 July 2018;
Published: 17 August 2018.
Edited by:
Simone Bastianoni, University of Siena, ItalyReviewed by:
Jaume Freire-González, Fundació ENT, SpainFranco Ruzzenenti, University of Groningen, Netherlands
Copyright © 2018 Freeman. This is an open-access article distributed under the terms of the Creative Commons Attribution License (CC BY). The use, distribution or reproduction in other forums is permitted, provided the original author(s) and the copyright owner(s) are credited and that the original publication in this journal is cited, in accordance with accepted academic practice. No use, distribution or reproduction is permitted which does not comply with these terms.
*Correspondence: Rachel Freeman, cmFjaGVsLmZyZWVtYW5AbWFuY2hlc3Rlci5hYy51aw==