High Throughput Screening Technologies in Biomass Characterization
 Stephen R. Decker1*
  Anne E. Harman-Ware1
  Renee M. Happs1
  Edward J. Wolfrum1
  Gerald A. Tuskan2
  David Kainer2
  Gbekeloluwa B. Oguntimein3
  Miguel Rodriguez2
  Deborah Weighill2,4
  Piet Jones2,4
  Daniel Jacobson2,4
- 1National Renewable Energy Laboratory, Biosciences Center, Golden, CO, United States
- 2Oak Ridge National Laboratory, Biosciences Division, Oak Ridge, TN, United States
- 3Department of Civil Engineering, Morgan State University, Baltimore, MD, United States
- 4The Bredesen Center for Interdisciplinary Research and Graduate Education, University of Tennessee, Knoxville, TN, United States
Biomass analysis is a slow and tedious process and not solely due to the long generation time for most plant species. Screening large numbers of plant variants for various geno-, pheno-, and chemo-types, whether naturally occurring or engineered in the lab, has multiple challenges. Plant cell walls are complex, heterogeneous networks that are difficult to deconstruct and analyze. Macroheterogeneity from tissue types, age, and environmental factors makes representative sampling a challenge and natural variability generates a significant range in data. Using high throughput (HTP) methodologies allows for large sample sets and replicates to be examined, narrowing in on more precise data for various analyses. This review provides a comprehensive survey of high throughput screening as applied to biomass characterization, from compositional analysis of cell walls by NIR, NMR, mass spectrometry, and wet chemistry to functional screening of changes in recalcitrance via HTP thermochemical pretreatment coupled to enzyme hydrolysis and microscale fermentation. The advancements and development of most high-throughput methods have been achieved through utilization of state-of-the art equipment and robotics, rapid detection methods, as well as reduction in sample size and preparation procedures. The computational analysis of the large amount of data generated using high throughput analytical techniques has recently become more sophisticated, faster and economically viable, enabling a more comprehensive understanding of biomass genomics, structure, composition, and properties. Therefore, methodology for analyzing large datasets generated by the various analytical techniques is also covered.
Introduction
Crop breeding for improved traits has been in constant development since mankind first intentionally put seeds in the ground. Selection of better crops has been, until recently, a long-term strategy, with simple selection criteria of higher yield or increased tolerance to various stresses. With the advent of molecular genetics, plant breeding has accelerated significantly, with specific genes and entire metabolic pathways being added or deleted in a few days, however the results are not always selectable with simple phenotypic criteria. While plants continue to require weeks, months, or years to fully mature and exhibit stable traits, phenotypes such as reduced recalcitrance, altered polysaccharide and lignin content, and other changes in cell wall composition are not readily discernable. Technologies to rapidly evaluate engineered plants for non-phenotypically evident resultant traits has not kept pace with the generation of these mutations, nor has the analytical methodology needed to catalog, interpret, compare, and model the huge genetic information being uncovered gene by gene.
As plant engineering methodologies have evolved to generate more variants in shorter time, screening these expanded sample sets has ranged from cumbersome to nearly impossible, depending on the analyses and turnaround required. Simple changes to phenotype such as biomass yield can be readily evaluated by increasing the area planted to accommodate more variants and replicates and measuring height, width, mass, etc. by hand. Given enough researchers (most probably students), several thousand plants can be evaluated in this manner, however, understanding the more intricate specifics of compositional analysis, conversion potential, and chemical changes to components such as lignin require much more detailed analyses.
Over the past decade or so, multiple research groups have developed methods to address some of these complex measurements. In this review, we cover advances in measuring changes in plant cell wall chemistry and recalcitrance, developments in rapid sugar and fatty acid analysis, advances in spectroscopy applications and instrumentation to cell wall composition determination, and use of data analysis and systems biology modeling to develop understandings from the acquired data.
Table 1 is a summary of HTP methods used in HTP analysis of biomass. Details for each method can be found in sections High Throughput Plant Cell Wall Compositional Analysis, HTP Recalcitrance Screening, NMR for Biomass Sugar and Fatty Acid Composition and in the associated references. Data analysis and systems biology modeling is handled separately in section Data Analysis and Systems Biology Modeling for High Throughput Biomass Analysis.
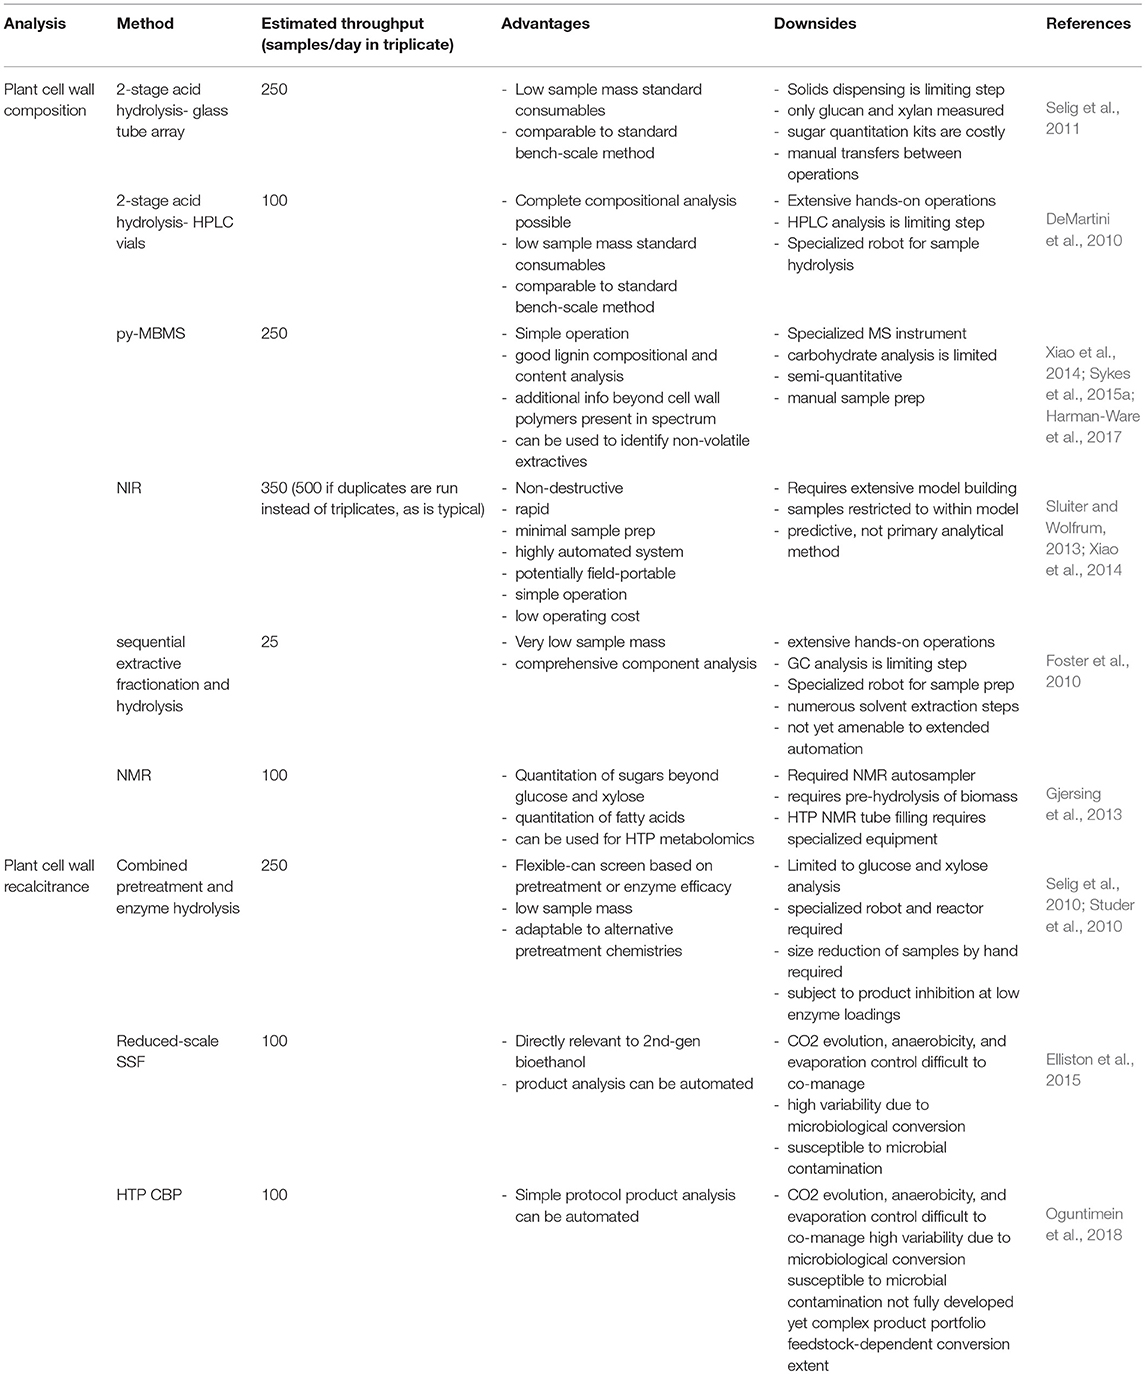
Table 1. Summary of HTP methods in biomass conversion.
High Throughput Plant Cell Wall Compositional Analysis
Compositional analysis of biomass is a complex, but necessary and important analytical technique. The ratio, composition, and content of the three major cell wall components (cellulose, hemicellulose, lignin), have a direct impact on the technoeconomics of biomass conversion to products and knowing the potential yields is the best way to standardize the cost analysis across different feedstocks. Several methods have been developed to deconvolute the complexity of the plant cell wall down to the subunit level. Such methods are laborious, slow, and employ a variety of harsh reagents requiring some degree of remediation (Elliston et al., 2015). Destructive methods, such as 2-stage acid hydrolysis and pyrolysis-Molecular Beam Mass Spectrometry (py-MBMS), rely on breaking apart the various polymers and measuring the content of the resultant subunits, which can then be mathematically reassembled to estimate the various polymer content. The use of simpler and more rapid spectroscopic methods have proved invaluable in analyzing biomass (Elliston et al., 2015). Non-destructive spectroscopic methods such as Near InfraRed (NIR) spectroscopy rely on specific bond detection and quantitation, which is then fed to a multivariate model in order to predict the content of the various polymers, using samples previously characterized by destructive methods to build the model. While this latter method is fast and non-destructive, it is not a primary measurement and requires significant upfront efforts to build good models. Any samples that fall outside the predictive range of the model cannot be characterized with any precision. While the destructive methods provide direct data, they can be very slow (2-stage acid hydrolysis), require detailed analytical methods to measure products, and can use a lot of sample material. The NIR and py-MBMS methods have been reviewed by Xiao et al. for readers interested in more details (Xiao et al., 2014).
Micro-Scale 2-Stage Acid Hydrolysis
Decades ago, the National Renewable Energy Laboratory established several standard Laboratory Analytical Procedures (LAPs) designed to standardize analytical methods in an emerging and very chemically complicated landscape of biomass conversion. Basing many of these LAPs on tried-and-true methods from pulp and paper and forage analysis, these protocols became a standard yardstick by which disparate labs could meaningfully measure complex parameters of biomass conversion. The procedures established were highly regimented and geared toward the bench-scale, i.e., using 1–10 g of material and requiring several days for completion. A reasonably well-trained technician could be expected to handle 40–50 samples per week for compositional analysis and enzyme hydrolysis and/or Simultaneous Saccharification and Fermentation (SSF). A large fraction of that time taken up by the manual manipulations of weighing the samples and taking representative samples, as well as the relatively long analysis times (30–60 min/sample) via HPLC.
The bench-scale compositional analysis LAP requires 0.3–3 g of biomass to be hydrolyzed first by 72% (w/w) H2SO4 at 30°C and then by 4% (w/w) H2SO4 in an autoclave, sequentially hydrolyzing cellulose and hemicellulose to oligomers and then to monomers, but requiring the use of pressure-rated glass vessels (Sluiter et al., 2008). The severe conditions result in degradation of sugars to hydroxymethyl furfural, furfural, levulinic acid, and other products as they are released from the polymer matrix, necessitating the use of sugar recovery standards to account for those losses. The sugars are typically measured via HPLC with Pb-, Ca-, or H-based ion exchange resins used to resolve the various sugars. The best separation and quantitation is typically found using the Pb-based chemistry, however these columns require neutralization of samples (CaCO3), long run times (~45–60 min), and de-ashing guard columns to protect the analytical column Pb-groups from complexing with the neutralization CO ions. For a sample set of 50, running them in triplicate and with various sugar, sugar recovery, and instrument validation standards, could easily tie up an HPLC for a week or longer. The soluble lignin was estimated by absorbance and the insoluble lignin, whether natural or precipitated by the severe conditions, was measured gravimetrically, adjusting for inorganic content as determined gravimetrically after ashing the sample.
In 2011, Selig et al. published the first HTP method for measuring glucan and xylan content in plant cell walls (Selig et al., 2011). The protocol was primarily a scaled-down version of the NREL LAP, with enzyme-linked spectrophotometric measurements replacing HPLC as the primary sugar analysis. This limited sugar detection to glucose and xylose only, but allowed for parallel processing of multiple samples and automated quantitation by microtiter plate (MTP) spectrophotometers while only using 50 mg of sample for each analysis. While liquid handling and absorbance reading steps were all automated using various robots, transfer between the robots was carried out by hand. Solids dispensing was automated into special dispensing plates that were used to manually add samples to the custom Hastelloy deep 96-well reactor plates. As manual mixing during the acid hydrolysis was not practical, sonication was used to maintain sample dispersity and special clamping mechanisms were used to seal the reactor during the digestion. Other adaptations included the inclusion of strong buffering of diluted aliquots instead of whole sample neutralization to minimize differences in pH which affected the enzyme-linked assays, and the use of centrifugation to minimize solids interference with pipetting by the robots. While the scaled-down version of the compositional analysis method was fast and reproducible, it did not track exactly 1:1 with standard bench-scale analysis (due mainly to the change in sugar detection and the simple error propagation of using small masses and volumes), and should therefore only be used in a comparative manner within a given sample set and not as a precise analytical tool. It also suffered from the requirement of highly specialized, expensive, and very heavy custom reactor plates. Subsequent refinements to the method substituted 96-well format glass tubes for the Hastelloy reactor plate, eliminating the expensive custom reactor, the need for problematic sealing films, and allowed for the use of an autoclave instead of a Parr reactor for the 2nd stage of hydrolysis. Extraction and enzymatic de-starching of the starting material, especially for herbaceous feedstocks, was also worked into the method after the initial publication (Decker et al., 2012).
DeMartini et al. (2010) developed a similar method around the same time, utilizing HPLC vials instead of Hastelloy reactors or 96-well format glass tubes (DeMartini et al., 2010). The use of readily available HPLC vials allowed for automated solid and liquid dispensing, as well as heating on the Symyx Core Module robot, however subsequent manipulations, such as centrifugation, transfer of supernatant to polypropylene tubes, neutralization with CaCO3, and analysis by HPLC required individual manual operations. The other advantage of the HPLC vials, however, was the ability to estimate insoluble lignin content gravimetrically after washing and drying the residual solids and subtracting previously determined ash content, even if the washing steps were carried out by hand.
Foster et al. (2010) developed a small-scale protocol for plant cell wall compositional analysis as well, however the protocol utilized numerous solvent addition and removal steps as well as sample extraction and de-starching. The starting material was mechanically sized-reduced biomass from essentially an automated small-scale ball mill. These complex steps precluded ready automation, but the protocol provided much of the same information as larger-scale standard analyses while using considerably less material (Foster et al., 2010).
Though several labs have developed HTP/micro-scale compositional analysis methods, it remains a major tenet of this work that these methods are not as precise and accurate as larger-scale, lower throughput methodologies. Much of this is tied up in the heterogeneity of the samples, especially when a single particle of bark or rind can comprise 10% or more of a single sample or when automated dispensing results in size-fractionation of the bulk material during repeated sample aliquoting. Primarily, these methods are useful in ranking large samples sets in terms of cellulose content or percent theoretical conversion in subsequent enzymatic or microbiological conversion. They also result in significant savings in reagent costs, sample prep, and technician time, however the costs of the robots, especially those designed for accurate and reproducible solids dispensing in the 1–10 mg range, is prohibitive for many research groups.
Pyrolysis-MBMS For Analysis of Cell Wall Composition and Other Components Present in Lignocellulosic Biomass (LCB)
The analysis of biomass by analytical pyrolysis techniques has been practiced for decades as it can provide a significant amount of information regarding the structure and composition of biomass as well as inform pyrolysis processes, conditions and upgrading strategies that are used to generate bio-oil. Fast pyrolysis, the rapid thermal decomposition of material in the absence of oxygen, produces analytes that originate from different components in the feedstock that can be analyzed using detectors such as mass spectrometers. Pyrolysis-molecular beam mass spectrometry (py-MBMS) is an analytical technique that uses a pyrolyzer coupled to a molecular beam mass spectrometer to analyze all ions generated without chromatographic separation. Fast pyrolysis of samples is typically performed at temperatures between 300 and 700°C in the timescale of < 1 min/sample. Electron ionization is used to generate ions with voltages ranging from < 20 eV up to 70 eV and ions are detected after passing through a quadrupole which typically scans for the analysis of m/z 30–450. Py-MBMS has been used as a high throughput technique to analyze LCB for estimation of lignin content, syringyl/guaiacyl (S/G) ratios, sugar composition as well as diterpenoid resin acid content in biomass extract. The benefits of using py-MBMS for biomass analysis include rapid throughput (250 samples/day), minimal sample preparation and low sample amount requirements (10 mg). The high-throughput nature of py-MBMS has enabled studies across large populations and sample set sizes allowing for the incorporation of appropriate statistical and biological variations in data. Py-MBMS data can be analyzed using various statistical tools such as principle component analysis (PCA), partial least squares regression (PLS), clustering methods and other predictive analytics that provide both quality control measures and a means to understand the underlying spectral patterns as well as their sources and associations with other biomass properties and genomics.
Lignin content in biomass samples can be estimated relative to a standard of known Klason lignin content run in the same set of samples by py-MBMS through summation of ion intensities that originate from phenolic species generated during pyrolysis which may include m/z 120, 124, 137, 138, 150, 152, 154, 164, 167, 168, 178, 180, 181, 182, 194, 208, and 210 (Sykes et al., 2008). Relative syringyl (S) monomers in lignin are typically calculated by summation of ion intensities of m/z 154, 167, 168, 182, 194, 208, 210; whereas relative guaiacyl (G) monomeric values can be determined by summation of ion intensities of m/z 124, 137, 138, 150, 164, 178. S/G ratios are then determined by dividing the sum of S-based ions by the sum of G-based ions. Table 2 summarizes the sources of various ions seen in py-MBMS spectra of biomass and example spectra of maize stems are shown in Figure 1 (Penning et al., 2014a). Otherwise, PLS models can be used to determine lignin content in a set of samples relative to wet chemistry methods using a variety of standards. The analysis of lignin content and S/G ratios in lignocellulosic biomass by py-MBMS has been reported extensively in the literature and has been used in studies focused on the analysis of biomass recalcitrance, (Studer et al., 2011; Biswal et al., 2015, 2018; Decker et al., 2015; Sykes et al., 2015b) for genetic studies including as QTL and GWAS, (Wegrzyn et al., 2010; Penning et al., 2014a; Muchero et al., 2015) to determine within-plant variability and the effects of environmental conditions on cell wall structure (Sykes et al., 2008; Mann et al., 2009), and for the analysis of biomass either engineered or selected for different lignin content and monomer compositions (Penning et al., 2014b; Sykes et al., 2015b; Edmunds et al., 2017).
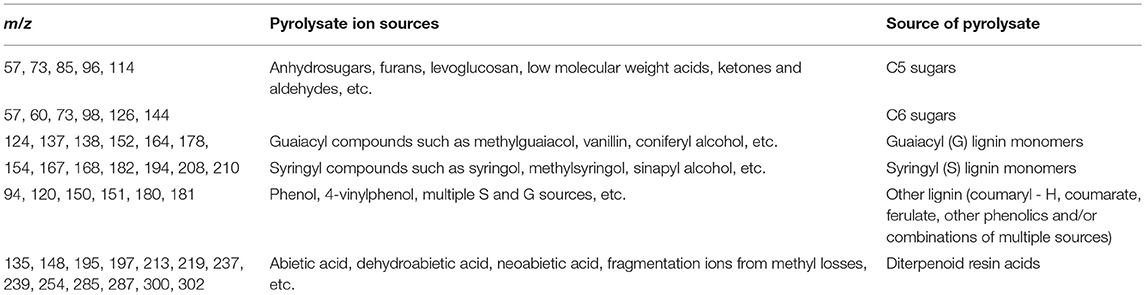
Table 2. Summary of ion assignments in py-MBMS spectra of lignocellulosic biomass or biomass extracts.
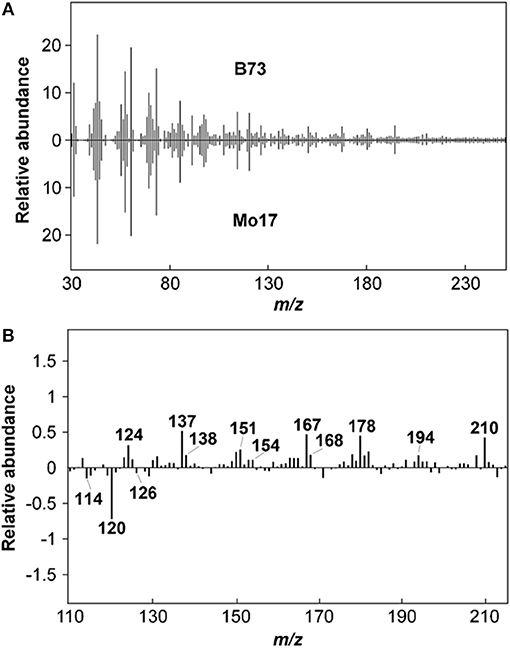
Figure 1. Py-MBMS spectra of maize stems can be used to compare relative abundances of lignin and carbohydrate components. (A) upper and lower spectra of stems from different lines can be subtracted to show differences in certain ions as shown in subtraction spectrum, (B) Reprinted by permission from Penning et al. (2014b), Bioenergy Research: Springer Nature, copyright 2014.
Structural carbohydrate or sugar composition has also been estimated in a variety of LCB types by py-MBMS. Ions that can originate from C5 sugars (xylose, etc.) include m/z 57, 73, 85, 96, 114 and ions attributed to C6 sugars (glucose, etc.) include m/z 57, 60, 73, 98, 126, 144. The pyrolysates from which the carbohydrate-derived ions originate include anhydrosugars, furans, low molecular weight aldehydes and ketones and other compounds as shown in Table 2. In a study by Sykes et al. (2015a) structural carbohydrates were determined using a standard method involving low-throughput two-stage acid hydrolysis of biomass followed by HPLC analysis of the hydrolysates. The HPLC method was used to build a PLS model with py-MBMS spectra for the prediction of sugar content in various types of biomass. The best PLS models incorporated different biomass types (hardwood, softwood, etc.) which extended the range in composition of each of the major sugars predicted. While models used to predict sugar composition within a biomass type were not ideal, py-MBMS analysis for sugar composition of biomass has a significant increase in throughput over traditional methods using two-stage acid hydrolysis followed by HPLC analysis (Sykes et al., 2015a).
Diterpenoid resin acids from pine and pine extracts have also been analyzed using py-MBMS. Typically, diterpenoid resin acids are extracted from coniferous biomass and derivatized prior to analysis by GC. The derivatizing step of resin acids is cumbersome, time consuming and consumes an additional step involving a derivatizing reagent. Harman-Ware et al. (2017) developed a high-throughput method for the analysis of diterpenoid resin acids from the organic extract obtained from pine sapling cross sections using py-MBMS. While the py-MBMS analysis of pine biomass correlated spectral patterns indicative of variable levels of diterpenoid resin acids with GC data, it was not possible to use or spike standards for the quantification of these compounds in the biomass samples. Additionally, the low content (< 5 wt%) of the resin acids made reliable quantification by analysis of the whole biomass difficult and the variability within trees complicated sampling methodology. Instead, total diterpenoid content was determined by py-MBMS analysis of the organic extract left after evaporation by means of an external calibration standard consisting of a mixture of components closely resembling the composition as determined by GC (Harman-Ware et al., 2017).
The analysis of biomass by py-MBMS is limited to non-volatile samples and analytes (for quantification) and small sample size. Therefore, harvesting, sample preparation, and variability of biomass are all experimental considerations that must be made in advance and understood when interpreting spectral data. Other considerations that must be made when interpreting spectra include the presence of inorganic salts and other compounds (proteins, lipids, etc.), the pyrolysis temperature, the fragmentation energy of the ionization source and other parameters that can influence the pyrolysis and subsequent spectra of a given sample. Also, it is not recommended to compare samples analyzed when instrument maintenance and tuning adjustments have been made as the spectra could change slightly. Typically, standards are run within a set and samples that need to be compared are run within a set without maintenance down time of the instrument between sample analyses. As no chromatographic separation has occurred, the sources of the ions present in the spectra must also be interpreted with caution as many analytes may produce the same ions.
Py-MBMS data has been used to analyze large data sets with a focus on a small number of ions present in the spectra. The mining of MBMS spectral data for clustering, mapping and making spectral associations with genotypes and phenotypes will extend the usefulness and capabilities of py-MBMS analyses as more genetic and phenotypic information about biomass is elucidated. Improvements in mass resolution and sensitivity would also extend capabilities for py-MBMS to analyze components that are difficult to identify and quantify and/or make up a smaller fraction of biomass such as metabolites, lipids, etc. While py-MBMS has proven to be instrumental in the elucidation of biomass characteristics relating particularly to lignin, there may still be untapped information present in the spectra that could potentially inform other useful properties of biomass.
NIR Spectroscopy for Structural Components
As an alternative to the wet chemistry method, Near Infrared (NIR) spectroscopy has been used for decades for the rapid analysis of biomass, starting with the prediction of forage quality (Norris et al., 1976; Shenk et al., 1979; Abrams et al., 1987). Its use for the prediction of biomass composition in a biorefinery context originated later (Sanderson et al., 1996; Hames et al., 2003). An overview of the technique and a comprehensive review of its use in biomass conversion processes was recently published (Skvaril et al., 2017).
Rapid analysis using NIR is considered a secondary analytical method, because NIR spectra are correlated with primary biomass compositional analysis data using multivariate calibration algorithms to produce a calibration equation. This equation can then be used to predict the composition of samples in lieu of primary biomass compositional analysis. Robust calibration methods, including methods for estimating calibration and predicting have been developed (Martens and Næs, 1992; Martens and Martens, 2001; Olivieri Alejandro et al., 2006; Zhang and Garcia-Munoz, 2009).
Because the method relies only on the collection of a NIR spectrum for a given sample, the technique can provide compositional analysis data much more quickly than traditional chemical analysis methods. Many calibration models for biomass feedstocks and process intermediates have been published, including contributions from these authors (Wolfrum and Sluiter, 2009; Godin et al., 2011; Liu et al., 2013; Sluiter and Wolfrum, 2013; Payne and Wolfrum, 2015). These models have been used for the prediction of large numbers of samples, saving substantial amounts of time (and cost) compared to conventional laboratory analysis (Pordesimo et al., 2005; Templeton et al., 2009).
Care must be taken when using NIR spectroscopy for rapid biomass analysis. Because it is a secondary method, a prediction of biomass composition will be accurate only if the underlying sample set used to develop the calibration equation contains sufficient compositional variability compared to that expected in the sample population. Unknown samples that are not part of the calibration population are inevitably poorly predicted. If careful attention is not paid to this issue, unreliable and even misleading results will be obtained. Poorly predicted samples (flagged either as outliers or with large prediction uncertainties) can be excellent candidates for improving a calibration model. If these samples undergo compositional analysis using traditional analytical methods, they can be added to the existing calibration model to extend its predictive range; by definition, these new samples are within the calibration population.
As discussed above, high-throughput analysis using NIR spectroscopy involves (1) collecting a NIR spectra of a biomass sample, and then (2) predicting one or more chemical properties of the biomass sample by comparing the collected spectra to a collection or library of samples for which spectral and chemical properties are known. There are opportunities to make improvements in both areas.
Spectrometer manufacturers are constantly improving the performance of NIR spectrometers, such as increasing the signal-to-noise ratio, the spectral resolution, or the spectral range of instruments, and it is likely that these improvements in performance will continue in the future. While these improvements require additional research and development on conventional spectrometers and are important advances, they represent incremental improvements to existing technology. There are two different and complementary approaches that offer opportunities for substantial improvement in high-throughput analysis using NIR spectroscopy: NIR hyperspectral imaging and low-cost, ultra-portable NIR spectrometers.
NIR hyperspectral image cameras are conceptually similar to conventional cameras except the pixels of the two-dimensional images produced consist of NIR spectra (Boldrini et al., 2012). Recent contributions have presented comprehensive reviews and discussions of applications of hyperspectral imaging for biomass analysis (Fahlgren et al., 2015; Eylenbosch et al., 2017). This is an active area of research, and the Department of Energy ARPA-E Transportation Energy from Renewable Agriculture (TERRA, https://arpa-e.energy.gov/?q=arpa-e-programs/terra) is currently supporting work in high-throughput biomass phenotyping in both laboratory and field environments using a variety of spectroscopy approaches, including hyperspectral imaging. Work sponsored by the ARPA-E TERRA will dramatically accelerate the application of hyperspectral imaging for biomass analysis in the coming years.
Several ultra-portable NIR spectrometers have been developed in recent years that have the potential to provide performance comparable to conventional NIR spectrometers in a much smaller form factor and at a much lower cost than traditional NIR spectrometers. Very-low cost, ultra-portable, and ubiquitous NIR spectrometers could represent a compelling alternative to traditional NIR rapid analysis approaches for biomass analysis. The composition of biomass materials could be tracked essentially continuously across the value chain from harvest and collection, transport, storage, through conversion to fuels and chemicals. Table 3 highlights four different instruments (listed alphabetically) that represent unique approaches to ultra-portable NIR spectroscopy.
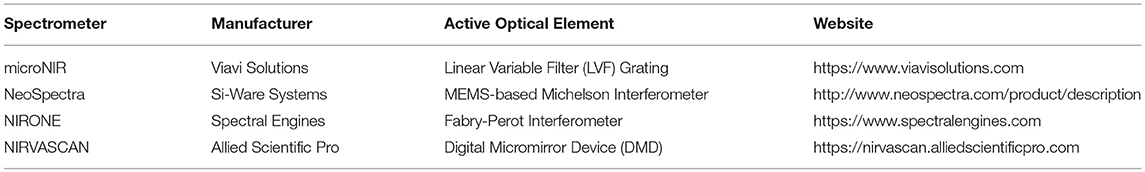
Table 3. Ultra-portable NIR spectrometers.
While this is not meant to be an exhaustive list of all ultra-portable NIR spectrometers, the list does demonstrate the breadth of technical innovation in this area. For example, each of these instruments employs a different active optical element or light processing modality. The microNIR instrument uses a fixed Linear Variable Filter as the dispersive element in the optical path. The NeoSpectra is a Fourier Transform spectrometer, using a miniature Michelson Interferometer based on micro-electro-mechanical system (MEMS) fabrication technology. The NIRONE uses a MEMS-based Fabry-Perot Interferometer (FPI) as a tunable optical filter. The NIRVASCAN instrument uses a fixed grating in combination with a digital micromirror device (DMD) consisting of several hundred thousand miniature mirrors acting as a wavelength filter. Each of these instruments has a different spectral range, signal-to-noise ratio, sample presentation geometry, and data collection and processing environment. It is beyond the scope of this work to provide a comprehensive comparison of the performance of each of these instruments; the suitability of a given instrument depends in large part on the potential application.
Some challenges remain for further development of these novel spectrometers, including the demonstration of adequate data collection and processing environments, long-term performance stability in real-world applications, the ability to develop useful and robust calibration models for use on these new platforms, and to perform accurate calibration transfer among spectrometers (Workman and Mark, 2013) so that calibration equations developed on a primary instrument can be used on multiple secondary instruments. Nonetheless, it is clear that there has been substantial developing in ultra-portable NIR spectroscopy in recent years, and this development will likely continue.
As mentioned above, the way NIR spectroscopy is used for rapid analysis (calibration model development and subsequent sample prediction) has evolved substantially over the last several decades, for example, with more robust PLS modeling algorithms and improved outlier detection and measures of prediction uncertainty. However, as NIR spectroscopy for rapid biomass analysis becomes more widely used (in part due to developments in hyperspectral imaging instruments and lower-cost spectrometer technology), it will be possible to take fundamentally new approaches to deriving useful information from larger collections of spectral data. While the size of these data sets may never approach those of laboratory analytical techniques such as hyphenated chromatography (e.g., GC-GC-MS, LC-MS), they will likely be large enough and have enough variability to permit machine learning or neural net modeling approaches for classification applications, and real-time updating of classification and prediction modeling using cloud computing resources. Both the development of novel approaches for processing the data and the curation and management of the data itself will represent key technical challenges (and opportunities) in the future. In summary, rapid analysis using near Infrared (NIR) spectroscopy has proven to be a robust, reliable technique for high-throughput biomass characterization when used properly and with care. In the future new opportunities for the technique will develop because of improvements in the two complementary technologies that have made the technique useful in the past: NIR spectroscopy instrumentation and spectral data processing techniques, particularly machine learning approaches.
HTP Recalcitrance Screening
Measuring biomass recalcitrance across large numbers of natural and transgenic plant variants has long held the promise of identifying promising lignocellulosic biofuel feedstocks. The best screen should include both compoitonal analysis of the starting feedstock as well as sugar release after processing, in order to measure conversion efficiency as well as titer and yield (Sykes et al., 2015a). For conversion, either pretreatment, enzyme hydrolysis, or a combined approach may be used. More recently, microbial assays of a Consolidated Bioconversion Process (CBP) nature, in which cellulolytic microbes are used to hydrolyze lignocellulosic feedstocks and measured by product formation, have been employed. Both approaches can be used to screen a range of substrates for differences in recalcitrance by holding the catalyst(s) constant or to evaluate different catalysts (pretreatment conditions, enzyme systems, microbes) on a single defined substrate. In both systems, product detection is critical to evaluating the differences induced by the variables introduced. Many of the methods used to set up and analyze the experiments are the same or similar.
HTP screening methods are being increasingly applied to process development in biotechnology (Long et al., 2014; Back et al., 2016; Yang et al., 2017; Zutz et al., 2017). As new methodology is developed, HTP screening is increasingly employed to collect biological data that historically required extensive time and effort (Scheel and Lutke-Eversloh, 2013; Suzuki et al., 2015) and is widely used today in the development of fermentation process assays (Decker et al., 2003, 2009; Selig et al., 2010, 2011; Studer et al., 2010; Suzuki et al., 2015; Yang et al., 2017). There have been rapid developments of HTP techniques in recent years in micro-scale culturing, online analysis and monitoring, and real-time control, which have enabled increased systems automation (Yang et al., 2017). A key technology in applying HTP to microbiological screening has been the miniaturization of bioreactors, making large experimental cultivation economical and practical (Back et al., 2016; Velez-Suberbie et al., 2017). Both micro- and mini-bioreactors are critical to biotechnology process development. Recent HTP developments applied to biological research have been applied to developing more effective large-scale operations, greatly decreasing the time and expense compared to development at scale (Lattermann and Buchs, 2015) and it is likely that there is room for continued improvements (Long et al., 2014). As an example, microtiter plates (MTP) are simple, easy to shake, and inexpensive (Bharadwaj et al., 2011; Yang et al., 2017) and have been demonstrated to effectively replace shake flasks (Oguntimein et al., 2018). MTPs have been used to screen specific activities of enzyme variants using various techniques, such as protein quantitation by immunoturbidimetric (ITA) assays, (Yang et al., 2017), direct fluorescence resonance energy transfer for protease activity (Suzuki et al., 2015), cell free protein production (Casteleijn et al., 2013), fungal biosensor assay to detect estrogen activity (Zutz et al., 2017), protein purification and characterization for crystallographic studies (Kim et al., 2011), and enzyme-screening of ionic liquid pretreated lignocellulose (Bharadwaj et al., 2011). Despite these recent examples of MTP-based screening, few details are known regarding actual culture conditions inside the MTP, the technology to measure these details in real time in such numbers and small volumes remains lacking (Long et al., 2014).
Lignocellulosic biomass (LCB) has been the focus of research as a renewable source for second generation bioethanol production but selection and development of these substrates with high bioethanol yield requires the availability of reliable methods for compositional and structural characterization (Elliston et al., 2015). As discussed in Section High Throughput Plant Cell Wall Compositional Analysis, quick HTP analysis of the potential of LCB feedstocks is an important step in the development of second generation bioethanol. HTP screening allows the rapid investigation of a large set of samples at minimum cost. An assay used to determine bioethanol production from large numbers of LCBs must be robust, rapid, easy to perform, and must use modest amounts of the samples (Elliston et al., 2015). This section of the review focuses on the use of high throughput (HTP) pretreatment and enzyme hydrolysis as well as consolidated bioprocessing for the conversion of LCB into bioethanol.
The production of second generation biofuel involves a number of consecutive process operations, each with a combination of multitude steps. These operations can be delineated into pretreatment, hydrolysis, fermentation, and distillation and/or separation. The overall process design could be one of several general approaches, including separate hydrolysis and fermentation (SHF) or simultaneous saccharification and fermentation (SSF) for any given LCB substrate, but the most rapid, effective, and cost effective method to produce bioethanol for any approach requires the optimization of various process parameters. Bearing this in mind, Decker et al. (2009) and Gomez et al. (2010) developed methods for the rapid screening of biomass for the hydrolysis stage (Decker et al., 2009; Gomez et al., 2010), however further research is required to investigate downstream process impacts due to yeast or other micro-organisms. The potential effect of fermentation inhibitors released during biomass processing on the final alcohol yields is also very critical. This may be process or substrate-specific (Pienkos and Zhang, 2009). In view of the importance of both separate hydrolysis and fermentation (SHF) and simultaneous saccharification and fermentation (SSF) methodologies, SSF methodology on a solid substrate has not been widely investigated at the much smaller HTP scale. The SSF approach introduces a complication as a result of CO2 production during yeast fermentation which must be vented to reduce pressure in the reaction vessel while at the same time controlling evaporation, all whilst potentially being stirred vigorously. The current paradigm, however, is focused more toward SHF (Waldron, 2014) and consolidated bioprocessing (CBP) (Oguntimein et al., 2018). This method simplifies the engineering requirement such as decreased capital and operational expenditures and reduces the potential for microbial contamination prior to the addition of yeast.
Substrate Preparation
The preparation of solid substrates in the case of second generation biofuels presents its own unique set of problems to HTP screening, primarily the requirement to accurately, repeatedly and rapidly dispense solid, heterogenous sample material by weight. Manual weighing is too labor intensive and time consuming, making it impractical. Recent solutions have included automatic weighing robots (Santoro et al., 2010), production of handbills (dry biomass sheets that can be subdivided to repeatable mass) (Berlin et al., 2006) and biomass slurry pipetting (Chundawat et al., 2008). Automatic weighing and dispensing robots for dry biomass are expensive and require dedicated operation. Grinding of sample is required, with suitable size ranges pre-determined for each biomass type. Typically, the grinding is accomplished off-deck before loading the samples onto the robot, however on deck grinding through ball-milling has been used in several labs (Foster et al., 2010; Santoro et al., 2010). Attention should be paid to avoid over-milling, which reduces structural recalcitrance factors in the material. Electrostatic forces generated during dispensing (by a rotating anti-bridging wire on plastic dispenser walls or steel balls grinding biomass in a plastic tube for example) must be addressed or else the sample will be errantly dispensed to the adjacent wells, inter-well spaces, or the bottom of the balance or robot. Sample heterogeneity is also a major issue, especially in small sample masses (Santoro et al., 2010).
The use of handbills requires additional equipment and expertise, so the use of filter paper as a universal substrate for the measurement of cellulase activity has been adapted by many groups (Ghose, 1987). Elliston et al. (2015) have investigated slurry pipetting techniques using a Tecan Freedom Evo™ liquid handling robot equipped with a multi-channel arm (Tecan Group Ltd, Mannedorf, Switzerland). Liquid transfer was applied in the study for HTP SSF analyses using a 96-well plate format. The major obstacles include evaporation of samples, with the small scales utilized in HTP (typically ≤ 1 mL) driving the requirement for effective sealing, especially when incubated for days at elevated temperatures. In order to measure evaporative loss, a 1.0 mL matrix storage tube plate dried to a constant weight at 50°C was used with each well filled with 1.0 mL yeast nitrogen base (YNB) medium. The tubes were sealed with screw caps and incubated at 50°C (enzyme optimum temperature) over 72 h. Evaporation rates were low and linear over 24, 48, and 72 h time points, with evaporative losses of 0.28, 0.60, and 0.91%, respectively (Elliston et al., 2015).
For pretreated substrates, several methods have been employed. In one of the earliest studies on HTP pretreatment and enzyme hydrolysis, Chundawat et al. (2008) utilized ammonia fiber expansion in a batch pretreatment of corn stover, dispensing the pretreated material into the wells of a 96-well microtiter plate and evaluating the effects of solids loading and particle size on digestibility (Chundawat et al., 2008). While this approach gives the advantage of potentially screening numerous enzyme combinations, the process is limited to one of a few types of biomass. A more versatile approach, pioneered by Studer et al. (2010), Decker et al. (2009), and Selig et al. (2010) was to carry out pretreatment in a HTP reactor plate containing parallel individual reaction chambers. Multiple biomass types can be screened in a massively parallel fashion, though conversion conditions are limited to a single pretreatment and digestion temperature/time/pressure combination for each plate. For reactor plates in a standard 96-well format, the added advantage of automated or semi-automated simultaneous liquid transfers for all wells greatly increases throughput while retaining the option to pipet individual enzyme or acid catalysts by well. Use of acid-resistant metallurgy and appropriate sealing systems allows for high temperature and acid-catalyzed thermochemical pretreatments (Decker et al., 2009; Selig et al., 2010; Studer et al., 2010).
Effect of Solid Substrate Mass on Simultaneous Saccharification and Fermentation (SSF)
In one of the earliest biomass-related HTP methods, Decker et al. (2003) used Whatman number one filter paper and powdered celluloses dispensed as a slurry to automated the filter paper assay used to quantify cellulase activity as a precursor to SSF (Decker et al., 2003). In 2012 and 2014, Yee et al. developed a reduced-bench-scale system for both SSF and Consolidated BioProcessing (CBP, see below) of biomass using bottles, measuring products by HPLC and substrate utilization by mass loss (Yee et al., 2012, 2014). Reducing SSF to HTP-friendly microtiter plate formatting, Elliston et al. (2015), using Whatman number one filter paper (FP) and office copier paper (OCP) (6 mm diameter) as substrates, found that the masses were highly repeatable; 2.36 mg ± 3.1% (w/w) and 2.19 mg ± 2.5% (w/w), respectively, with six sample points. The consistent thickness and density of these substrates, which enabled the high mass repeatability, allowed for rapid allocation of substrate to small matrix tubes. In a comparative experiment between shake flask (200 mL in 500 mL Erlenmeyer flasks), tubes (10 mL in 30 mL screw-capped culture bottles) and MTP format (1 mL in 1 mL screw-cap matrix storage) using yeast and mold media (YM) plus glucose [0.9% (w/v)], OCP [2.5% (w/v)], or FP [2.5% (w/v)], ethanol yield was similar at each scale, validating the use of the HTP small scale method for screening yeasts by SSF (Elliston et al., 2015).
Effect of Microorganisms on Bioethanol Production From LCB
Oguntimein et al. (2018) demonstrated a HTP 96 well microplate assay to evaluate MTP- consolidated bioprocessing as a method to measure biomass conversion potential. Twenty milligrams of pre-milled switchgrass or avicel was dispensed into deep well MTPs (2.2 mL/well volume) 96 well microplates shown in Figure 2 using a Powdernium®; powder dispensing system (Symyx, Geneva, Switzerland). After additional of liquid medium, C. thermocellum Δhpt was inoculated into rows A-C while C. thermocellum LL1210 was inoculated into rows E-G). Sterile water as added to rows D and H. Plates were placed at a 45-degree angle on an orbital shaker (Cole Palmer Model 51300) set at 125 rpm in a 60°C incubator in a Coy anaerobic chamber (5% H2, 10% CO2, and 85% N2, Coy Laboratories Products Inc., Grass Lake, MI).
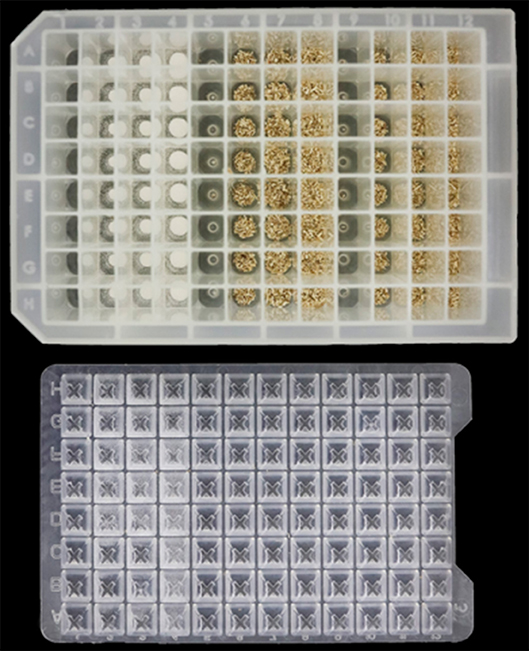
Figure 2. Biomass loaded into deepwell microtiter plate for high throughput evaluation of Clostridia for consolidated biomass processing.
Both C. thermocellum Δhpt and LL1210 strains metabolized Avicel, generating cellobiose, glucose, lactic acid, formic acid, acetic acid and ethanol in titers and ratios similar to that obtained in bench scale fermentations, demonstrating the applicability of a HTP method using CBP using C. thermocellum. Strain LL1210 generated higher ethanol titers than those of strain Δhpt, which is consistent based on earlier reports from larger-scale experiments (Dumitrache et al., 2016). The absolute titers for ethanol were lower than those produced in pH-controlled bioreactors and switchgrass generated lower ethanol concentrations than avicel (Oguntimein et al., 2018).
Effect of Lignocellulosic Biomass
Lindedam et al. (2014) compared three HTP pretreatment and enzymatic hydrolysis systems (HTPH-systems) for screening lignocellulosic biomass by enzymatic saccharification to confirm that quantitative differences in substrate can be detected at a small scale. Twenty winter wheat cultivars grown at two sites in Denmark were hydrothermally pretreated and enzymatically digested in three separately engineered HTPH-systems at (1) University of California, Riverside, (2) National Renewable Energy Laboratory (NREL), Colorado, and (3) University of Copenhagen (CPH). All three systems delineated differential sugar release among the cultivars, though average extent of cellulose conversion varied at 57, 64, and 71% for Riverside, NREL and CPH, respectively. Riverside and NREL systems had the highest pair-wise correlation with glucose, while xylose yields correlated best between Riverside and CPH. All three systems agreed on Flair as the cultivar with the highest yield and Dinosor, Glasgow, and Robigus with the lowest. Despite the varied conditions between the three HTPH-systems which resulted in different absolute values, the correlation and rank ordering agreement between them clearly indicates that microscale combined thermochemical and enzymatic conversion can be used to identify recalcitrant phenotypes between varied feedstocks (Lindedam et al., 2014).
Elliston et al. used ethanol production under SSF conditions to assay the conversion of milled wheat straw pretreated under two different conditions different conditions (195°C for 10 min and 210°C for 10 min). Analysis of twelve replicates demonstrated the expected increase in ethanol yield for wheat straw pretreated at 210°C for 10 min (80% of theoretical yield) compared to pretreatment at 195°C for 10 min (64% of theoretical yield) (Elliston et al., 2015).
Zhang et al. also used HTP pretreatment and co-hydrolysis (HTPH) to rapidly identify promising Miscanthus genotypes, including hybrids of Miscanthus sacchariflorus/M. sinensis as well as M. lutarioriparius, highlighting the commercially promising hybrids. The results also indicated that, at least in Miscanthus, glucan plus xylan content influences both mass and theoretical yields, while lignin and ash contents had no measurable impact (Zhang et al., 2012).
Applying consolidated bioprocessing (CBP) in HTP assay format, Oguntimein et al. demonstrated the fermentation of switchgrass and Avicel by a parent strain of Clostridium thermocellum (Δhpt) (Oguntimein et al., 2018). The HTP, MTP-based CBP assay produced ethanol levels similar to bench-scale Avicel and switchgrass fermentations (Dumitrache et al., 2016; Tian et al., 2016). According to the authors, additional studies are needed comparing the effect of biomass concentration on bioethanol production, to correlate the HTP CBP screen with other analytical methods such as quantitative saccharification of residual biomass, and evaluation of well pooling necessary to determine the extent of hydrolysis and fermentation. Screening on other biomass feedstocks such as corn stover and poplar is also needed to validate a broader application of the method. Lastly, evaluating multiple microbial strains will provide a more comparative picture of the impact of microbial factors on the assay specificity (Oguntimein et al., 2018).
This review reports on the factors influencing HTP assays methods for screening of otherwise recalcitrant lignocellulosic substrates for bioethanol production so that they can be performed efficiently and reproducibly in a laboratory setting. Current methods are influenced by the preparation of LCB, the type of LCB, weight of biomass and the type of fermenting organisms. Further studies are required to evaluate and optimize the interactions of these factors in order to have practical uses in the biorefining of biomass substrates for second generation biofuels. Most of the HTP methods have been developed to mimic large-scale operating conditions (Lattermann and Buchs, 2015). This trend will likely continue toward even smaller reactors, potentially even single-cell microfluidic chips (Oguntimein et al., 2018).
NMR for Biomass Sugar and Fatty Acid Composition
Detailed characterization is required for the continued development of biomass feedstocks possessing traits desirable for biofuels and bio-derived chemicals. Quick and precise identification of cell wall chemistry traits and composition due to both gene transformation and natural variation can be accomplished through high-throughput (HTP) characterization using nuclear magnetic resonance (NMR) spectroscopy. Traditionally, lignin and carbohydrate chemistries have been obtained through time and labor-intensive bench-scale HPLC and gravimetric determination (Sluiter et al., 2008, 2010). While carbohydrate characterization methods can incorporate automated sample preparation in 96-well plates, a time-consuming HPLC analysis step for minor sugars composition is often the bottleneck in throughput (Selig et al., 2011).
Simple 1H NMR methods provide a wealth of information about liquid samples, such as biomass hydrolysates, including both carbohydrate and hydrolysate by-product compositions. Mixture analysis of NMR spectra is well developed, with many software applications making analysis straightforward and reliable (da Silva Neto et al., 2009; Powers, 2009; Spraul et al., 2009; Da Silva et al., 2013). Traditionally, sugar analysis in biomass hydrolysates has been performed using integration of the anomeric proton region between 4.4 and 5.4 ppm against a reference standard (Kiemle et al., 2003; Mittal et al., 2009), but peak overlap occurs for several sugars and the large water peak at 4.8 ppm often makes integration of these peaks impossible. Shifting of the water peak above the anomeric proton region requires either highly acidic conditions, which cause NMR instrumentation issues (Kelly et al., 2002), or a below-freezing temperatures of water, rendering them undesirable for high-throughput analysis. Gjersing et al. (2013) reported a method developed for high-throughput screening of biomass hydrolysates generated from two-stage acid hydrolysis using 1H NMR spectra. HPLC-measured concentration data was used to construct a Partial Least Squares Regression (PLS) model for sugar composition using NMR spectra of aqueous hydrolysates. A model for each monomeric sugar can be used to determine concentrations within the hydrolysate mixture. In this method, 8 biomass feedstocks were used to construct a PLS model with HPLC data and NMR spectra. The fully cross-validated model was used to predict sugar concentrations for 15 samples, including a feedstock that was not in the original model, and compared to HPLC-measured concentrations. The NMR based PLS model and HPLC-measured concentrations agreed, within error, demonstrating the applicability of the model (Gjersing et al., 2013). Use of a cryoprobe allowed for the NMR experiment time to be further reduced, and preliminary work indicates 4 min per sample—a dramatic increase in throughput compared to traditional HPLC methods. A combination of this NMR approach for analysis of carbohydrates combined with the high-throughput micro-scale hydrolysis preparation discussed previously (Selig et al., 2011) could provide a truly high-throughput screening method for biomass sugar composition.
Increasingly, metabolite profiles are being used to screen biological materials, including biomass populations to look for varying plant responses to stress (Ruan and Teixeira da Silva, 2011; Sun et al., 2016). Recent reports demonstrate that the laborious extraction procedures for metabolites has been improved, making metabolic analysis by NMR more practical (Fumagalli et al., 2009; Martineau et al., 2011; Rivas-Ubach et al., 2013). Additionally, high-resolution magic angle spinning (HR MAS) NMR provides the ability to use whole cell plant material to detect changes in abundant metabolites, which eliminates several preparation steps (Silva et al., 2012; Blondel et al., 2016).
Fatty acids from non-lignocellulosic biomass such as microalgae have become more routinely recognized as a feedstock for biofuel production (Fukuda et al., 2001; Chisti, 2007; Wijffels and Barbosa, 2010). Algal lipid composition varies greatly among species and additional variation is added when culture growth conditions are modified (Scott et al., 2010). Thus, it is imperative that analytical tools be developed for rapid screening of large numbers of samples necessary for comparative studies. Traditionally, protocols for analysis of lipids from microalgae involve time-consuming and labor-intensive extraction followed by chromatography (Bligh and Dyer, 1959; Jones et al., 2012). A fluorescent model was developed that suffered from many technical drawbacks to large-scale screening, including daily calibration of the fluorescent probe and specificity of cell response (Cooksey et al., 1987; Elsey et al., 2007; Chen et al., 2009). However, a simple 1H NMR screening method was developed that allowed for assessment of major lipid classes from rough microalgae extracts (Nuzzo et al., 2013). The collection of a single NMR spectrum took only a few minutes, without purification of rough extracts, and employed the use of a reference electronic signal as an external standard, known as ERETIC (Akoka et al., 1999). This allowed for the quantification of several major lipid classes important for biodiesel synthesis, including total fatty acids, free fatty acids, triacylglycerols, unsaturated fatty acids, and saturated fatty acids (Nuzzo et al., 2013).
Overall, there have been dramatic improvements in sample handling over the last two decades that have allowed traditional bench-scale methodologies to become high-throughput. As robotics and sample changers become more common place, methodologies can be upgraded to accommodate the demand for the large data sets involved in bioinformatics.
Data Analysis and Systems Biology Modeling for High Throughput Biomass Analysis
There is a need for integrated biological models to capture the higher order complexity in the interactions that occur among cellular components. A full model of all of the higher order interactions of cellular and organismal components is one of the ultimate grand challenges of systems biology (Sweetlove et al., 2017). The ability to build such comprehensive models will usher in a new era in biology. Success in the construction and application of computational algorithms will enable new insights into the molecular mechanisms responsible for complex biological systems and related emergent properties; using technologies not previously available on a scale not feasible before. A full systems biology model of all of the higher order interactions of cellular and organismal components would lead to breakthroughs, which would have profound effects on the field (Sweetlove et al., 2017).
The cost of generating biological data is dropping exponentially, resulting in increased data that has far outstripped the predictive growth in computational power from Moore's Law. This flood of data has opened a new era of systems biology in which there are unprecedented opportunities to gain insights into complex biological systems. The dominant paradigm of high-throughput systems biology is the use of new technologies to generate massive amounts of data that can then be analyzed computationally for new insights and hypothesis generation. Solving such complex combinatorial problems will give us extraordinary levels of understanding of biological systems. Paradoxically, understanding higher order sets of relationships among biological objects leads to a combinatorial explosion in the search space of biological data. These exponentially increasing volumes of data, combined with the desire to model more and more sophisticated sets of relationships within a cell and across an organism (or in some cases even ecosystems), have led to a need for computational resources and sophisticated algorithms that can make use of such datasets. Thus, the bottleneck in biological science is often no longer data generation but rather the computational analysis.
Biological organisms, including plants, microbes, and humans, are derived from complex genetic systems that are composed of functional networks of interacting molecules, macromolecules, and even species (Foster et al., 2017). The subsequent phenotypes are the result of orchestrated, hierarchical, varied collections of expressed genomic variants regulated by and related to biotic and abiotic signals. However, at the individual organism level, the measured effects of these genomic variants can be viewed as the result of historic selective pressure and current environmental as well as epigenetic interactions. Thus, the co-occurrence of genome variants and the resulting complex phenotypes can be viewed in the context of genome-wide associations in several different ways. This phenomenon allows us to use vectors of genome variant-to-trait associations to detect the higher order interactions occurring in an organism across hierarchical phenotypes. A full model of all of the higher order interactions of cellular and organismal components is one of the ultimate grand challenges of systems biology.
We are attempting to do this for the bioenergy feedstock Populus trichocarpa (black cottonwood) and are currently using 10 million genome variants derived from the resequenced genomes of more than a thousand different genotypes and 160,000 phenotypes that have been measured across this population (including transcriptomics, metabolomics, microbiomics, and phenomics data).
Networks
Networks are useful tools for modeling and analyzing complex biological systems by representing biological objects as nodes, (e.g., genes, proteins or metabolites) and representing the relationships/interactions/similarities between them as edges (Barabasi and Oltvai, 2004). For example, networks can model co-expression relationships between genes, sequence similarity between genes, physical interactions between proteins and/or correlations between metabolites. Networks allow for biological datasets to be visualized in an intuitive manner and network visualization packages such as Cytoscape provide an interactive environment for network visualization. However, networks are not simply useful as a visualization tool. Networks provide a data structure that serves as a mathematical representation of a complex system, allowing further analysis to be performed on a dataset represented as a network. Datasets represented as networks are also very easily merged with other networks, thus constructing a useful tool for combining information from different data sources to create a combined and holistic environment for data interpretation (Shannon et al., 2003).
GWAS Network Construction
Phenotypes are often complex traits, in that they are influenced by the environment and potentially a large number of genes (Solovieff et al., 2013). GWAS attempts to associate the presence of SNPs with these complex traits (Visscher et al., 2012; Solovieff et al., 2013). This involves genotyping a large number of individuals in a population, measuring phenotypes across all of these individuals and statistically determining the association between the presence/absence of the genotyped markers or SNPs and each phenotype (Korte and Farlow, 2013). A general concern when conducting GWAS studies is that individuals within a population that can be genetically related and share causal alleles, which cause the phenotype, and non-causal alleles artifactually connected to the phenotype (Visscher et al., 2012; Korte and Farlow, 2013). These causal and non-causal alleles can be located near each other on a chromosome and could thus be in linkage disequilibrium (i.e., alleles which are correlated across a population and co-inherited. This linkage disequilibrium (LD) between causal and non-causal alleles across related individuals results in non-causal alleles being correlated with a phenotype when they have no actual effect on the phenotype. A common approach to correcting for this phenomenon is to take population structure into account to avoid artificially inflated p-values. Population structure is often estimated from a kinship matrix and incorporated into the model (Flint-Garcia et al., 2003).
Spurious phenotype-to-genotype associations can also result from outlier phenotype values, this is especially evident when using linear models to calculate such associations. We therefore often apply a median absolute deviation (MAD) from the median cutoff in order to determine if a given phenotype measurement is an outlier compared to measurement taken across the population (Leys et al., 2013).
Associations between genome variants (SNPs) and phenotypes are typically made with the use of a linear mixed model as found in EMMAX (Kang et al., 2010). This results in multiple individual tests being performed, thereby introducing a multiple hypotheses bias, i.e., type 1 error. This bias is often mitigated with one of several false discovery rate methods, including the Benjamini–Hochberg method (Benjamini and Hochberg, 1995).
Alternatively, networks can then be created in which the respective SNPs and phenotypes are nodes and an edge denotes a significant GWAS association between them, enabling the subsequent determination of whether or not a phenotype-associated SNPs reside within genes and create a subnetwork of gene-phenotype associations.
Layered Networks, LOE Scores, and New Potential Targets
Alternate lines of evidence about the relationships between genes, and between genes and phenotypes can be created using several sets of networks. We recently developed a Lines of Evidence scoring system (LOE scores) in order to quantify the number of lines of evidence connecting genes to phenotypes (Figure 3). The GWAS network layers provide functional information at various scales (from molecular to organismal to environmental), which reflect signaling cascades, biosynthetic pathway information, and various regulatory circuits. For example, the co-expression and co-methylation networks provide information from multiple regulatory layers within the cell and the SNP correlation network models putative co-evolution relationships between genes (Climer et al., 2014; Joubert et al., 2018; Weighill et al., 2018).
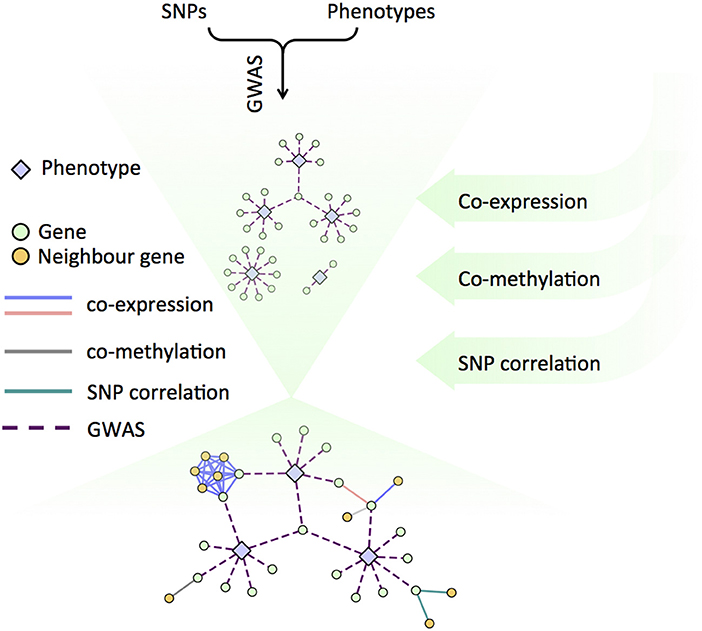
Figure 3. Schematic of the Lines of Evidence scoring system (LOE scores) used to quantify the number of lines of evidence connecting genes to phenotypes.
LOE (Lines of Evidence) scores for each gene can be calculated by starting with functions or topics of interest, revealing the strength of the evidence linking each gene to the function or topic of interest. The LOE breadth score quantifies types of LOE's (number of layers) that connect a gene and topic or function, and the LOE depth score quantifies the total number of functions/topic a gene is associated with. Individual layer LOE scores from each layer (e.g., co-expression or GWAS) indicate the number of function/topic associations a gene has within that particular layer (Weighill et al., 2018).
This LOE approach provides a new approach for exploring the vast data collections that are occurring in biology today. Any known genes, phenotypes or annotation topics of interest can be provided as input. A rank-order list of new candidate genes that have multiple lines of evidence supporting their involvement in the area of interest can be created from LOE scores. And as such, this approach generates a prioritized list for genetic modification via transformation, genome editing, selective breeding etc. used to validate and/or manipulate a phenotype or set of phenotypes.
Deeper Discoveries in Systems Biology: The Balance Between Type 1 and Type 2 Error
In a GWAS analysis that is done in isolation there is often large concern for false positives and stringent, riotous FDR thresholds are frequently applied. However, this overcompensation for type-1 error (avoiding false positives) will likely result in large type 2 errors (i.e., false negatives). If one's goal is to create a systems biology model that captures as many biological interactions (e.g., protein-protein interactions, epistatic and pleiotropic interactions, biosynthetic regulators, etc.) as possible, this is a heavy price to pay. We are now using a combination of relaxed FDR thresholds in combination with LOE on the resulting associations in order to strike an improved balance between type 1 and type 2 error, allowing for a more comprehensive models of the entire biological system. As such, our ability to reconstruct the entirety of a complex biological system improves as the number of population-scale endo-, meso- and exo-phenotypes are measured and combined with deep layers of experimental data collected on individual genotypes.
Future Prospects for High Throughput Biomass and Data Analysis
This review has covered recent developments for the high throughput analysis of biomass composition and other properties that have been made possible through the use of robotics and miniaturized equipment, sophisticated computational tools, rapid detection instrumentation and by reduction in sample size, preparation, man-power, and materials needed for analyses. There is still room for improvement in these processes, particularly in relation to increases in preparation throughput and accuracy of the results. Improvements to instrumentation will continue in effort to enhance sensitivity, resolution, dynamic range, and robustness. Additionally, smaller and portable instruments that can be brought to the field would aid in reducing sample collection resources and errors. Processing parameters, scalability and the effects of other variables, associated particularly in deconstruction and conversion analyses, still require further investigations for accuracy and applicability to large-scale conditions. Comprehensive analysis of data using sophisticated computational tools could extend the capabilities of associated analytical methods and instrumentation and provide a better understanding of biological systems as a whole.
Author Contributions
SD coordinated manuscript assembly and editing, provided content for sections on 2-stage acid hydrolysis and HTP recalcitrance screening, RH Provided content on NMR analysis of sugars and fatty acids, AH-W Provided content on py-MBMS, EW Provided content on NIR, DJ, DW, PJ, GT, DK: Provided content on data management, MR, GO Provided content on HTP recalcitrance screening.
Funding
Funding was also provided by The Center for Bioenergy Innovation (CBI). U.S. Department of Energy Bioenergy Research Centers supported by the Office of Biological and Environmental Research in the DOE Office of Science.
Conflict of Interest Statement
The authors declare that the research was conducted in the absence of any commercial or financial relationships that could be construed as a potential conflict of interest.
Acknowledgments
Portions of the manuscript have been authored by UT-Battelle, LLC under Contract No. DE-AC05-00OR22725 with the U.S. Department of Energy. The United States Government retains and the publisher, by accepting the article for publication, acknowledges that the United States Government retains a non-exclusive, paid-up, irrevocable, worldwide license to publish or reproduce the published form of this manuscript, or allow others to do so, for United States Government purposes. The Department of Energy will provide public access to these results of federally sponsored research in accordance with the DOE Public Access Plan (http://energy.gov/downloads/doe-public-access-plan).
This work was authored in part by Alliance for Sustainable Energy, LLC, the manager and operator of the National Renewable Energy Laboratory for the U.S. Department of Energy (DOE) under Contract No. DE-AC36-08GO28308. Funding provided by U.S. Department of Energy Office of Energy Efficiency and Renewable Energy Bioenergy Technologies Office. The views expressed in the article do not necessarily represent the views of the DOE or the U.S. Government. The U.S. Government retains and the publisher, by accepting the article for publication, acknowledges that the U.S. Government retains a nonexclusive, paid-up, irrevocable, worldwide license to publish or reproduce the published form of this work, or allow others to do so, for U.S. Government purposes.This research was also supported by the Department of Energy Laboratory Directed Research and Development funding (7758), at the Oak Ridge National Laboratory. Oak Ridge National Laboratory is managed by UT-Battelle, LLC, for the US DOE under contract DE-AC05-00OR22725.
This research described herein was supported by an award of computer time provided by the INCITE program and used resources of the Oak Ridge Leadership Computing Facility (OLCF) and the Compute and Data Environment for Science (CADES) at the Oak Ridge National Laboratory, which is supported by the Office of Science of the U.S. Department of Energy under Contract No. DE-AC05-00OR22725.
Support for the Poplar GWAS dataset was provided by The BioEnergy Science Center (BESC) and The Center for Bioenergy Innovation (CBI). U.S. Department of Energy Bioenergy Research Centers supported by the Office of Biological and Environmental Research in the DOE Office of Science. The Poplar GWAS Project used resources of the Oak Ridge Leadership Computing Facility and the Compute and Data Environment for Science at Oak Ridge National Laboratory, which is supported by the Office of Science of the U.S. Department of Energy under Contract No. DE-AC05-00OR22725.
The JGI Plant Gene Atlas project conducted by the U.S. Department of Energy Joint Genome Institute was supported by the Office of Science of the U.S. Department of Energy under Contract No. DE-AC02-05CH11231. Full Gene Atlas data sets are available at: http://phytozome.jgi.doe.gov.
References
Abrams, S. M., Shenk, J. S., Westerhaus, M. O., and Barton, F. E. II (1987). Determination of forage quality by near infrared reflectance spectroscopy: efficacy of broad-based calibration equations1,2,3,4. J. Dairy Sci. 70, 806–813. doi: 10.3168/jds.S0022-0302(87)80077-2
Akoka, S., Barantin, L., and Trierweiler, M. (1999). Concentration measurement by proton NMR using the ERETIC method. Anal. Chem. 71, 2554–2557. doi: 10.1021/ac981422i
Back, A., Rossignol, T., Krier, F., Nicaud, J. M., and Dhulster, P. (2016). High-throughput fermentation screening for the yeast Yarrowia lipolytica with real-time monitoring of biomass and lipid production. Microb. Cell Fact. 15:147. doi: 10.1186/s12934-016-0546-z
Barabasi, A. L., and Oltvai, Z. N. (2004). Network biology: understanding the cell's functional organization. Nat. Rev. Genet. 5, 101–113. doi: 10.1038/nrg1272
Benjamini, Y., and Hochberg, Y. (1995). Controlling the false discovery rate: a practical and powerful approach to multiple testing. J. R. Stat. Soc. Ser. B 57, 289–300.
Berlin, A., Maximenko, V., Bura, R., Kang, K. Y., Gilkes, N., and Saddler, J. (2006). A rapid microassay to evaluate enzymatic hydrolysis of lignocellulosic substrates. Biotechnol. Bioeng. 93, 880–886. doi: 10.1002/bit.20783
Bharadwaj, R., Wong, A., Knierim, B., Singh, S., Holmes, B. M., Auer, M., et al. (2011). High-throughput enzymatic hydrolysis of lignocellulosic biomass via in-situ regeneration. Bioresour. Technol. 102, 1329–1337. doi: 10.1016/j.biortech.2010.08.108
Biswal, A. K., Atmodjo, M. A., Li, M., Baxter, H. L., Yoo, C. G., Pu, Y., et al. (2018). Sugar release and growth of biofuel crops are improved by downregulation of pectin biosynthesis. Nat. Biotechnol. 36, 249–257. doi: 10.1038/nbt.4067
Biswal, A. K., Hao, Z., Pattathil, S., Yang, X., Winkeler, K., Collins, C., et al. (2015). Downregulation of GAUT12 in Populus deltoides by RNA silencing results in reduced recalcitrance, increased growth and reduced xylan and pectin in a woody biofuel feedstock. Biotechnol. Biofuels 8:41. doi: 10.1186/s13068-015-0218-y
Bligh, E. G., and Dyer, W. J. (1959). A rapid method of total lipid extraction and purification. Can. J. Biochem. Physiol. 37, 911–917.
Blondel, C., Khelalfa, F., Reynaud, S., Fauvelle, F., and Raveton, M. (2016). Effect of organochlorine pesticides exposure on the maize root metabolome assessed using high-resolution magic-angle spinning (1)H NMR spectroscopy. Environ. Pollut. 214, 539–548. doi: 10.1016/j.envpol.2016.04.057
Boldrini, B., Kessler, W., Rebner, K., and Kessler, R. W. (2012). Hyperspectral imaging: a review of best practice, performance and pitfalls for in-line and on-line applications. J. Near Infrared Spectrosc. 20, 483–508. doi: 10.1255/jnirs.1003
Casteleijn, M. G., Urtti, A., and Sarkhel, S. (2013). Expression without boundaries: cell-free protein synthesis in pharmaceutical research. Int. J. Pharm. 440, 39–47. doi: 10.1016/j.ijpharm.2012.04.005
Chen, W., Zhang, C., Song, L., Sommerfeld, M., and Hu, Q. (2009). A high throughput Nile red method for quantitative measurement of neutral lipids in microalgae. J. Microbiol. Methods 77, 41–47. doi: 10.1016/j.mimet.2009.01.001
Chisti, Y. (2007). Biodiesel from microalgae. Biotechnol. Adv. 25, 294–306. doi: 10.1016/j.biotechadv.2007.02.001
Chundawat, S. P., Balan, V., and Dale, B. E. (2008). High-throughput microplate technique for enzymatic hydrolysis of lignocellulosic biomass. Biotechnol. Bioeng. 99, 1281–1294. doi: 10.1002/bit.21805
Climer, S., Yang, W., de las Fuentes, L., Davila-Roman, V. G., and Gu, C. C. (2014). A custom correlation coefficient (CCC) approach for fast identification of multi-SNP association patterns in genome-wide SNPs data. Genet. Epidemiol. 38, 610–621. doi: 10.1002/gepi.21833
Cooksey, K. E., Guckert, J. B., Williams, S. A., and Callis, P. R. (1987). Fluorometric determination of the neutral lipid content of microalgal cells using Nile Red. J. Microbiol. Methods 6, 333–345. doi: 10.1016/0167-7012(87)90019-4
da Silva Neto, H. G., da Silva, J. B., Pereira, G. E., and Hallwass, F. (2009). Determination of metabolite profiles in tropical wines by 1H NMR spectroscopy and chemometrics. Magn. Reson. Chem. 47 (Suppl. 1), S127–S129. doi: 10.1002/mrc.2520
Da Silva, L., Godejohann, M., Martin, F. P., Collino, S., Burkle, A., Moreno-Villanueva, M., et al. (2013). High-resolution quantitative metabolome analysis of urine by automated flow injection NMR. Anal. Chem. 85, 5801–5809. doi: 10.1021/ac4004776
Decker, S. R., Adney, W. S., Jennings, E., Vinzant, T. B., and Himmel, M. E. (2003). Automated filter paper assay for determination of cellulase activity. Appl. Biochem. Biotechnol. 105–108, 689–703. doi: 10.1385/ABAB:107:1-3:689
Decker, S. R., Brunecky, R., Tucker, M. P., Himmel, M. E., and Selig, M. J. (2009). High-throughput screening techniques for biomass conversion. Bioenergy Res. 2, 179–192. doi: 10.1007/s12155-009-9051-0
Decker, S. R., Carlile, M., Selig, M. J., Doeppke, C., Davis, M., Sykes, R., et al. (2012). Reducing the effect of variable starch levels in biomass recalcitrance screening. Methods Mol. Biol. 908, 181–195. doi: 10.1007/978-1-61779-956-3_17
Decker, S. R., Sykes, R. W., Turner, G. B., Lupoi, J. S., Doepkke, C., Tucker, M. P., et al. (2015). High-throughput screening of recalcitrance variations in lignocellulosic biomass: total lignin, lignin monomers, and enzymatic sugar release. J. Vis. Exp. 103:e53163. doi: 10.3791/53163
DeMartini, J. D., Studer, M. H., and Wyman, C. E. (2010). Small-scale and automatable high-throughput compositional analysis of biomass. Biotechnol. Bioeng. 108, 306–312. doi: 10.1002/bit.22937
Dumitrache, A., Akinosho, H., Rodriguez, M. Jr., Meng, X., Yoo, C. G., Natzke, J., et al. (2016). Consolidated bioprocessing of Populus using Clostridium (Ruminiclostridium) thermocellum: a case study on the impact of lignin composition and structure. Biotechnol. Biofuels 9:31. doi: 10.1186/s13068-016-0445-x
Edmunds, C. W., Peralta, P., Kelley, S. S., Chiang, V. L., Sharma-Shivappa, R. R., Davis, M. F., et al. (2017). Characterization and enzymatic hydrolysis of wood from transgenic Pinus taeda engineered with syringyl lignin or reduced lignin content. Cellulose 24, 1901–1914. doi: 10.1007/s10570-017-1231-z
Elliston, A., Wood, I. P., Soucouri, M. J., Tantale, R. J., Dicks, J., Roberts, I. N., et al. (2015). Methodology for enabling high-throughput simultaneous saccharification and fermentation screening of yeast using solid biomass as a substrate. Biotechnol. Biofuels 8:2. doi: 10.1186/s13068-014-0181-z
Elsey, D., Jameson, D., Raleigh, B., and Cooney, M. J. (2007). Fluorescent measurement of microalgal neutral lipids. J. Microbiol. Methods 68, 639–642. doi: 10.1016/j.mimet.2006.11.008
Eylenbosch, D., Bodson, B., Baeten, V., and Fernández Pierna Juan, A. (2017). NIR hyperspectral imaging spectroscopy and chemometrics for the discrimination of roots and crop residues extracted from soil samples. J. Chemom. 32:e2982. doi: 10.1002/cem.2982
Fahlgren, N., Gehan, M. A., and Baxter, I. (2015). Lights, camera, action: high-throughput plant phenotyping is ready for a close-up. Curr. Opin. Plant Biol. 24, 93–99. doi: 10.1016/j.pbi.2015.02.006
Flint-Garcia, S. A., Thornsberry, J. M., and Buckler, E. S. (2003). Structure of linkage disequilibrium in plants. Annu. Rev. Plant Biol. 54, 357–374. doi: 10.1146/annurev.arplant.54.031902.134907
Foster, C. E., Martin, T. M., and Pauly, M. (2010). Comprehensive compositional analysis of plant cell walls (lignocellulosic biomass) part II: carbohydrates. J. Vis. Exp. 37:1837. doi: 10.3791/1837
Foster, K. R., Schluter, J., Coyte, K. Z., and Rakoff-Nahoum, S. (2017). The evolution of the host microbiome as an ecosystem on a leash. Nature 548, 43–51. doi: 10.1038/nature23292
Fukuda, H., Kondo, A., and Noda, H. (2001). Biodiesel fuel production by transesterification of oils. J. Biosci. Bioeng. 92, 405–416. doi: 10.1016/S1389-1723(01)80288-7
Fumagalli, E., Baldoni, E., Abbruscato, P., Piffanelli, P., Genga, A., Lamanna, R., et al. (2009). NMR techniques coupled with multivariate statistical analysis: tools to analyse Oryza sativa metabolic content under stress conditions. J. Agron. Crop Sci. 195, 77–88. doi: 10.1111/j.1439-037X.2008.00344.x
Gjersing, E., Happs, R. M., Sykes, R. W., Doeppke, C., and Davis, M. F. (2013). Rapid determination of sugar content in biomass hydrolysates using nuclear magnetic resonance spectroscopy. Biotechnol. Bioeng. 110, 721–728. doi: 10.1002/Bit.24741
Godin, B., Agneessens, R., Gerin, P. A., and Delcarte, J. (2011). Composition of structural carbohydrates in biomass: precision of a liquid chromatography method using a neutral detergent extraction and a charged aerosol detector. Talanta 85, 2014–2026. doi: 10.1016/j.talanta.2011.07.044
Gomez, L. D., Whitehead, C., Barakate, A., Halpin, C., and McQueen-Mason, S. J. (2010). Automated saccharification assay for determination of digestibility in plant materials. Biotechnol. Biofuels 3:23. doi: 10.1186/1754-6834-3-23
Hames, B. R., Thomas, S. R., Sluiter, A. D., Roth, C. J., and Templeton, D. W. (2003). “Rapid biomass analysis,” in Biotechnology for Fuels and Chemicals: The Twenty-Fourth Symposium, eds B. H. Davison, J. W. Lee, M. Finkelstein and J. D. McMillan (Totowa, NJ: Humana Press), 5–16.
Harman-Ware, A. E., Davis, M. F., Peter, G. F., Wang, Y., and Sykes, R. W. (2017). Estimation of terpene content in loblolly pine biomass using a hybrid fast-GC and pyrolysis-molecular beam mass spectrometry method. J. Anal. Appl. Pyrolysis 124, 343–348. doi: 10.1016/j.jaap.2017.01.011
Jones, J., Manning, S., Montoya, M., Keller, K., and Poenie, M. (2012). Extraction of algal lipids and their analysis by HPLC and mass spectrometry. JAOCS 89, 1371–1381. doi: 10.1007/s11746-012-2044-8
Joubert, W., Nance, J., Climer, S., Weighill, D., and Jacobson, D. (2018). Parallel accelerated vector similarity calculations for genomics applications. Parallel Comput. 75, 130–145. doi: 10.1016/j.parco.2018.03.009
Kang, H. M., Sul, J. H., Service, S. K., Zaitlen, N. A., Kong, S. Y., Freimer, N. B., et al. (2010). Variance component model to account for sample structure in genome-wide association studies. Nat. Genet. 42, 348–354. doi: 10.1038/ng.548
Kelly, A. E., Ou, H. D., Withers, R., and Dötsch, V. (2002). Low-conductivity buffers for high-sensitivity NMR measurements. J. Am. Chem. Soc. 124, 12013–12019. doi: 10.1021/ja026121b
Kiemle, D. J., Stipanovic, A. J., and Mayo, K. E. (2003). ”Proton NMR methods in the compositional characterization of polysaccharides,“ in Hemicelluloses: Science and Technology (American Chemical Society), 122–139.
Kim, Y., Babnigg, G., Jedrzejczak, R., Eschenfeldt, W. H., Li, H., Maltseva, N., et al. (2011). High-throughput protein purification and quality assessment for crystallization. Methods 55, 12–28. doi: 10.1016/j.ymeth.2011.07.010
Korte, A., and Farlow, A. (2013). The advantages and limitations of trait analysis with GWAS: a review. Plant Methods 9:29. doi: 10.1186/1746-4811-9-29
Lattermann, C., and Buchs, J. (2015). Microscale and miniscale fermentation and screening. Curr. Opin. Biotechnol. 35, 1–6. doi: 10.1016/j.copbio.2014.12.005
Leys, C., Ley, C., Klein, O., Bernard, P., and Licata, L. (2013). Detecting outliers: do not use standard deviation around the mean, use absolute deviation around the median. J. Exp. Soc. Psychol. 49, 764–766. doi: 10.1016/j.jesp.2013.03.013
Lindedam, J., Bruun, S., Jørgensen, H., Decker, S. R., Turner, G. B., DeMartini, J. D., et al. (2014). Evaluation of high throughput screening methods in picking up differences between cultivars of lignocellulosic biomass for ethanol production. Biomass Bioenergy 66, 261–267.
Liu, C., Xiao, L., Jiang, J., Wang, W., Gu, F., Song, D., et al. (2013). Biomass properties from different Miscanthus species. Food Energy Secur. 2, 12–19. doi: 10.1002/fes3.19.
Long, Q., Liu, X., Yang, Y., Li, L., Harvey, L., McNeil, B., et al. (2014). The development and application of high throughput cultivation technology in bioprocess development. J. Biotechnol. 192 (Pt B), 323–338. doi: 10.1016/j.jbiotec.2014.03.028
Mann, D. G. J., Labbé, N., Sykes, R. W., Gracom, K., Kline, L., Swamidoss, I. M., et al. (2009). Rapid assessment of lignin content and structure in switchgrass (Panicum virgatum L.) grown under different environmental conditions. Bioenergy Res. 2, 246–256. doi: 10.1007/s12155-009-9054-x
Martens, H., and Martens, M. (2001). Multivariate analysis of quality. an introduction. Meas. Sci. Technol. 12:1746. doi: 10.1088/0957-0233/12/10/708
Martineau, E., Tea, I., Loaec, G., Giraudeau, P., and Akoka, S. (2011). Strategy for choosing extraction procedures for NMR-based metabolomic analysis of mammalian cells. Anal. Bioanal. Chem. 401, 2133–2142. doi: 10.1007/s00216-011-5310-y
Mittal, A., Scott, G. M., Amidon, T. E., Kiemle, D. J., and Stipanovic, A. J. (2009). Quantitative analysis of sugars in wood hydrolyzates with 1H NMR during the autohydrolysis of hardwoods. Bioresour. Technol. 100, 6398–6406. doi: 10.1016/j.biortech.2009.06.107
Muchero, W., Guo, J., DiFazio, S. P., Chen, J.-G., Ranjan, P., Slavov, G. T., et al. (2015). High-resolution genetic mapping of allelic variants associated with cell wall chemistry in Populus. BMC Genomics 16:24. doi: 10.1186/s12864-015-1215-z
Norris, K. H., Barnes, R. F., Moore, J. E., and Shenk, J. S. (1976). Predicting forage quality by infrared replectance spectroscopy. J. Anim. Sci. 43, 889–897. doi: 10.2527/jas1976.434889x
Nuzzo, G., Gallo, C., D'Ippolito, G., Cutignano, A., Sardo, A., and Fontana, A. (2013). Composition and quantitation of microalgal lipids by ERETIC 1H NMR method. Mar. Drugs 11, 3742–3753. doi: 10.3390/md11103742
Oguntimein, G. B., Rodriguez, M. Jr., Dumitrache, A., Shollenberger, T., Decker, S. R., Davison, B. H., et al. (2018). Anaerobic microplate assay for direct microbial conversion of switchgrass and Avicel using Clostridium thermocellum. Biotechnol. Lett. 40, 303–308. doi: 10.1007/s10529-017-2467-2
Olivieri Alejandro, C., Faber Nicolaas, M., Ferré, J., Boqué, R., Kalivas John, H., and Mark, H. (2006). Uncertainty Estimation and Figures of Merit for Multivariate Calibration (IUPAC Technical Report). Pure and Applied Chemistry.
Payne, C. E., and Wolfrum, E. J. (2015). Rapid analysis of composition and reactivity in cellulosic biomass feedstocks with near-infrared spectroscopy. Biotechnol. Biofuels 8:43. doi: 10.1186/s13068-015-0222-2
Penning, B. W., Sykes, R. W., Babcock, N. C., Dugard, C. K., Held, M. A., Klimek, J. F., et al. (2014a). Genetic determinants for enzymatic digestion of lignocellulosic biomass are independent of those for lignin abundance in a maize recombinant inbred population. Plant Physiol. 165, 1475–1487. doi: 10.1104/pp.114.242446
Penning, B. W., Sykes, R. W., Babcock, N. C., Dugard, C. K., Klimek, J. F., Gamblin, D., et al. (2014b). Validation of PyMBMS as a high-throughput screen for lignin abundance in lignocellulosic biomass of grasses. Bioenergy Res. 7, 899–908. doi: 10.1007/s12155-014-9410-3
Pienkos, P. T., and Zhang, M. (2009). Role of pretreatment and conditioning processes on toxicity of lignocellulosic biomass hydrolysates. Cellulose 16, 743–762. doi: 10.1007/s10570-009-9309-x
Pordesimo, L. O., Hames, B. R., Sokhansanj, S., and Edens, W. C. (2005). Variation in corn stover composition and energy content with crop maturity. Biomass Bioenergy 28, 366–374. doi: 10.1016/j.biombioe.2004.09.003
Powers, R. (2009). NMR metabolomics and drug discovery. Magn. Reson. Chem. 47 (Suppl. 1), S2–S11. doi: 10.1002/mrc.2461
Rivas-Ubach, A., Pérez-Trujillo, M., Sardans, J., Gargallo-Garriga, A., Parella, T., Peñuelas, J., et al. (2013). Ecometabolomics: optimized NMR-based method. Methods Ecol. Evol. 4, 464–473. doi: 10.1111/2041-210X.12028
Ruan, C. J., and Teixeira da Silva, J. A. (2011). Metabolomics: creating new potentials for unraveling the mechanisms in response to salt and drought stress and for the biotechnological improvement of xero-halophytes. Crit. Rev. Biotechnol. 31, 153–169. doi: 10.3109/07388551.2010.505908
Sanderson, M. A., Agblevor, F., Collins, M., and Johnson, D. K. (1996). Compositional analysis of biomass feedstocks by near infrared reflectance spectroscopy. Biomass Bioenergy 11, 365–370. doi: 10.1016/S0961-9534(96)00039-6
Santoro, N., Cantu, S. L., Tornqvist, C.-E., Falbel, T. G., Bolivar, J. L., Patterson, S. E., et al. (2010). A high-throughput platform for screening milligram quantities of plant biomass for lignocellulose digestibility. Bioenergy Res. 3, 93–102. doi: 10.1007/s12155-009-9074-6
Scheel, M., and Lutke-Eversloh, T. (2013). New options to engineer biofuel microbes: development and application of a high-throughput screening system. Metab. Eng. 17, 51–58. doi: 10.1016/j.ymben.2013.03.002
Scott, S. A., Davey, M. P., Dennis, J. S., Horst, I., Howe, C. J., Lea-Smith, D. J., et al. (2010). Biodiesel from algae: challenges and prospects. Curr. Opin. Biotechnol. 21, 277–286. doi: 10.1016/j.copbio.2010.03.005
Selig, M. J., Tucker, M. P., Law, C., Doeppke, C., Himmel, M. E., and Decker, S. R. (2011). High throughput determination of glucan and xylan fractions in lignocelluloses. Biotechnol. Lett. 33, 961–967. doi: 10.1007/s10529-011-0526-7
Selig, M. J., Tucker, M. P., Sykes, R. W., Reichel, K. L., Brunecky, R., Himmel, M. E., et al. (2010). Lignocellulose recalcitrance screening by integrated high-throughput hydrothermal pretreatment and enzymatic saccharification. Industr.Biotechnol. 6, 104–111. doi: 10.1089/ind.2010.0009
Shannon, P., Markiel, A., Ozier, O., Baliga, N. S., Wang, J. T., Ramage, D., et al. (2003). Cytoscape: a software environment for integrated models of biomolecular interaction networks. Genome Res. 13, 2498–2504. doi: 10.1101/gr.1239303
Shenk, J. S., Westerhaus, M. O., and Hoover, M. R. (1979). Analysis of forages by infrared reflectance1. J. Dairy Sci. 62, 807–812. doi: 10.3168/jds.S0022-0302(79)83330-5
Silva, L. M. A., Alves Filho, E. G., Choze, R., Lião, L. M., and Alcantara, G. B. (2012). 1H HRMAS NMR spectroscopy and chemometrics for evaluation of metabolic changes in citrus sinensis Caused by Xanthomonas axonopodis pv. citri. J. Braz. Chem. Soc. 23, 1054–1061. doi: 10.1590/S0103-50532012000600009
Skvaril, J., Kyprianidis, K. G., and Dahlquist, E. (2017). Applications of near-infrared spectroscopy (NIRS) in biomass energy conversion processes: a review. Appl. Spectrosc. Rev. 52, 675–728. doi: 10.1080/05704928.2017.1289471
Sluiter, A., Hames, B., Ruiz, R., Scarlata, C., Sluiter, J., Tempelton, D., et al. (2008). Determiniation of Structural Carbohydrates and Lignin in Biomass”, in: Laboratory Analytical Procedure. Golden, CO: National Renewable Energy Laboratory.
Sluiter, A., and Wolfrum, E. (2013). Near infrared calibration models for pretreated corn stover slurry solids, isolated and in situ. J. Near Infrared Spectrosc. 21, 249–257. doi: 10.1255/jnirs.1065
Sluiter, J. B., Ruiz, R. O., Scarlata, C. J., Sluiter, A. D., and Templeton, D. W. (2010). Compositional analysis of lignocellulosic feedstocks. 1. review and description of methods. J. Agric. Food Chem. 58, 9043–9053. doi: 10.1021/jf1008023
Solovieff, N., Cotsapas, C., Lee, P. H., Purcell, S. M., and Smoller, J. W. (2013). Pleiotropy in complex traits: challenges and strategies. Nat. Rev. Genet. 14, 483–495. doi: 10.1038/nrg3461
Spraul, M., Schutz, B., Humpfer, E., Mortter, M., Schafer, H., Koswig, S., et al. (2009). Mixture analysis by NMR as applied to fruit juice quality control. Magn. Reson. Chem. 47 (Suppl. 1), S130–S137. doi: 10.1002/mrc.2528
Studer, M. H., DeMartini, J. D., Brethauer, S., McKenzie, H. L., and Wyman, C. E. (2010). Engineering of a high-throughput screening system to identify cellulosic biomass, pretreatments, and enzyme formulations that enhance sugar release. Biotechnol. Bioeng. 105, 231–238. doi: 10.1002/bit.22527
Studer, M. H., DeMartini, J. D., Davis, M. F., Sykes, R. W., Davison, B., Keller, M., et al. (2011). Lignin content in natural Populus variants affects sugar release. Proc. Natl. Acad. Sci. U.S.A. 108, 6300–6305. doi: 10.1073/pnas.1009252108
Sun, C. X., Li, M. Q., Gao, X. X., Liu, L. N., Wu, X. F., and Zhou, J. H. (2016). Metabolic response of maize plants to multi-factorial abiotic stresses. Plant Biol. 18 (Suppl. 1), 120–129. doi: 10.1111/plb.12305
Suzuki, M., Sakata, I., Sakai, T., Tomioka, H., Nishigaki, K., Tramier, M., et al. (2015). A high-throughput direct fluorescence resonance energy transfer-based assay for analyzing apoptotic proteases using flow cytometry and fluorescence lifetime measurements. Anal. Biochem. 491, 10–17. doi: 10.1016/j.ab.2015.08.022
Sweetlove, L. J., Nielsen, J., and Fernie, A. R. (2017). Engineering central metabolism - a grand challenge for plant biologists. Plant J. 90, 749–763. doi: 10.1111/tpj.13464
Sykes, R., Kodrzycki, B., Tuskan, G., Foutz, K., and Davis, M. (2008). Within tree variability of lignin composition in Populus. Wood Sci. Technol. 42, 649–661. doi: 10.1007/s00226-008-0199-0
Sykes, R. W., Gjersing, E. L., Doeppke, C. L., and Davis, M. F. (2015a). High-throughput method for determining the sugar content in biomass with pyrolysis molecular beam mass spectrometry. Bioenergy Res. 8, 964–972. doi: 10.1007/s12155-015-9610-5
Sykes, R. W., Gjersing, E. L., Foutz, K., Rottmann, W. H., Kuhn, S. A., Foster, C. E., et al. (2015b). Down-regulation of p-coumaroyl quinate/shikimate 3′-hydroxylase (C3′H) and cinnamate 4-hydroxylase (C4H) genes in the lignin biosynthetic pathway of Eucalyptus urophylla × E. grandis leads to improved sugar release. Biotechnol. Biofuels 8:128. doi: 10.1186/s13068-015-0316-x
Templeton, D. W., Sluiter, A. D., Hayward, T. K., Hames, B. R., and Thomas, S. R. (2009). Assessing corn stover composition and sources of variability via NIRS. Cellulose 16, 621–639. doi: 10.1007/s10570-009-9325-x
Tian, L., Papanek, B., Olson, D. G., Rydzak, T., Holwerda, E. K., Zheng, T., et al. (2016). Simultaneous achievement of high ethanol yield and titer in Clostridium thermocellum. Biotechnol. Biofuels 9:116. doi: 10.1186/s13068-016-0528-8
Velez-Suberbie, M. L., Betts John, P. J., Walker Kelly, L., Robinson, C., Zoro, B., and Keshavarz-Moore, E. (2017). High throughput automated microbial bioreactor system used for clone selection and rapid scale-down process optimization. Biotechnol. Prog. 34, 58–68. doi: 10.1002/btpr.2534
Visscher, P. M., Brown, M. A., McCarthy, M. I., and Yang, J. (2012). Five years of GWAS discovery. Am. J. Hum. Genet. 90, 7–24. doi: 10.1016/j.ajhg.2011.11.029
Waldron, K. (2014). Bioalcohol Production: Biochemical Conversion of Lignocellulosic Biomass. Boca Raton, FL: Woodhead Publishing.
Wegrzyn, J. L., Eckert, A. J., Choi, M., Lee, J. M., Stanton, B. J., Sykes, R., et al. (2010). Association genetics of traits controlling lignin and cellulose biosynthesis in black cottonwood (Populus trichocarpa, Salicaceae) secondary xylem. New Phytol. 188, 515–532. doi: 10.1111/j.1469-8137.2010.03415.x
Weighill, D., Jones, P., Shah, M., Ranjan, P., Muchero, W., Schmutz, J., et al. (2018). Pleiotropic and epistatic network-based discovery: integrated networks for target gene discovery. Front.Energy Res. 6:30. doi: 10.3389/fenrg.2018.00030
Wijffels, R. H., and Barbosa, M. J. (2010). An outlook on microalgal biofuels. Science 329, 796–799. doi: 10.1126/science.1189003
Wolfrum, E. J., and Sluiter, A. D. (2009). Improved multivariate calibration models for corn stover feedstock and dilute-acid pretreated corn stover. Cellulose 16, 567–576. doi: 10.1007/s10570-009-9320-2
Workman, J., and Mark, H. (2013). Calibration transfer. Spectroscopy 28, 24–37. doi: 10.1177/0003702817736064
Xiao, L., Wei, H., Himmel, M. E., Jameel, H., and Kelley, S. S. (2014). NIR and Py-mbms coupled with multivariate data analysis as a high-throughput biomass characterization technique: a review. Front. Plant Sci. 5:388. doi: 10.3389/fpls.2014.00388
Yang, X., Feng, Y., Chong, H., Wang, D., Hu, X., Pu, J., et al. (2017). High-throughput estimation of specific activities of enzyme/mutants in cell lysates through immunoturbidimetric assay of proteins. Anal. Biochem. 534, 91–98. doi: 10.1016/j.ab.2017.05.015
Yee, K. L., Rodriguez, M. Jr., Thompson, O. A., Fu, C., Wang, Z. Y., Davison, B. H., et al. (2014). Consolidated bioprocessing of transgenic switchgrass by an engineered and evolved Clostridium thermocellum strain. Biotechnol. Biofuels 7:75. doi: 10.1186/1754-6834-7-75
Yee, K. L., Rodriguez, M. Jr., Tschaplinski, T. J., Engle, N. L., Martin, M. Z., Fu, C., et al. (2012). Evaluation of the bioconversion of genetically modified switchgrass using simultaneous saccharification and fermentation and a consolidated bioprocessing approach. Biotechnol. Biofuels 5:81. doi: 10.1186/1754-6834-5-81
Zhang, L., and Garcia-Munoz, S. (2009). A comparison of different methods to estimate prediction uncertainty using Partial Least Squares (PLS): a practitioner's perspective. Chemom. Intell. Lab. Syst. 97, 152–158. doi: 10.1016/j.chemolab.2009.03.007
Zhang, T., Wyman, C. E., Jakob, K., and Yang, B. (2012). Rapid selection and identification of Miscanthus genotypes with enhanced glucan and xylan yields from hydrothermal pretreatment followed by enzymatic hydrolysis. Biotechnol Biofuels 5:56. doi: 10.1186/1754-6834-5-56
Keywords: biomass recalcitrance, biomass compositional analysis, high throughput analysis, neural networks, biomass conversion
Citation: Decker SR, Harman-Ware AE, Happs RM, Wolfrum EJ, Tuskan GA, Kainer D, Oguntimein GB, Rodriguez M, Weighill D, Jones P and Jacobson D (2018) High Throughput Screening Technologies in Biomass Characterization. Front. Energy Res. 6:120. doi: 10.3389/fenrg.2018.00120
Received: 01 June 2018; Accepted: 23 October 2018;
Published: 27 November 2018.
Edited by:
J. Richard Hess, Idaho National Laboratory (DOE), United StatesReviewed by:
Ruchi Agrawal, Indian Oil Corporation, IndiaAlok Satlewal, Indian Oil Corporation, India
Copyright © 2018 Decker, Harman-Ware, Happs, Wolfrum, Tuskan, Kainer, Oguntimein, Rodriguez, Weighill, Jones and Jacobson. This is an open-access article distributed under the terms of the Creative Commons Attribution License (CC BY). The use, distribution or reproduction in other forums is permitted, provided the original author(s) and the copyright owner(s) are credited and that the original publication in this journal is cited, in accordance with accepted academic practice. No use, distribution or reproduction is permitted which does not comply with these terms.
*Correspondence: Stephen R. Decker, steve.decker@nrel.gov