Concentration Pulse Method for the Investigation of Transformation Pathways in a Glycerol-Fed Bioelectrochemical System
 Fabian Kubannek
 Christopher Moß2
  Jörg Overmann
 Uwe Schröder
- 1Institute of Energy and Process Systems Engineering, Technische Universität Braunschweig, Braunschweig, Germany
- 2Institute of Environmental and Sustainable Chemistry, Technische Universität Braunschweig, Braunschweig, Germany
- 3Department Microbial Ecology and Diversity Research, Leibniz Institute DSMZ-German Collection of Microorgansims and Cell Cultures, Braunschweig, Germany
We investigated transformation pathways and determined rate constants in a continuously operated glycerol-fed bioelectrochemical system under chemostatic conditions by applying concentration pulses of various intermediates. Our methodology does not require the interruption of the continuous operation and is thus in principle suitable for elucidating processes in continuously operated bioreactors in industry as well as in laboratory studies. Specifically for the example of glycerol electrooxidation, pulse responses of current density and effluent concentrations reveal that glycerol is first fermented to acetate, which is then oxidized electrochemically by the anode respiring bacteria. Microbial community analysis confirms this division of labor with a bioanode dominated by Geobacter species (92.8%) and a much more diverse fermenting community in the planktonic phase, containing mainly Desulfovibrio sp. (45.2%) and Spiroaetales (18.1%). Desulfovibrio and Geobacter species are identified as promising candidates for tailored communities for glycerol electro-oxidation. From an acetate concentration pulse experiment, growth rates and half saturation rate constants for the biofilm of 1.4 mol m-3 and 933 mmol m-2d-2 are obtained, respectively. Furthermore, 1,3-propanediol and glycerol concentration pulse experiments show that the reaction from glycerol to 1,3-propanediol is reversed at high 1,3-propanediol concentrations. The presented methodology allows one to study pathways and extract rate constants through simple experiments in a running system without irreversibly altering the microbial community or destroying the biofilm.
1. Introduction
Understanding reaction pathways and process interactions within bioelectrochemical systems (BES) running on complex substrates is an important step toward performance optimization. Many reports on complex substrates which are degraded by a defined artificial community of two or more species were able to assign clear roles to single bacterial species (Wang et al., 2015; Kim et al., 2016; Moscoviz et al., 2017). However, the performance of these cultures often is low compared to mixed cultures, making the later more attractive for applications.
Even though a wide range of techniques is available for analysis of biofilms in BES (Harnisch and Rabaey, 2012), often little is known about metabolic pathways for complex substrates. There is a knowledge gap concerning pathways and kinetics for degeneration of complex substrates in BES by mixed cultures. Quantitative information is especially rare and there are also no standard methods available to close this gap because the types of interaction strongly depend on the individual BES.
Our goal is to demonstrate a methodology to extract qualitative information on reaction pathways and process interactions and quantitative information on rate constants by evaluating the dynamic response of a BES.
In general, dynamic methods can offer additional insights since they allow for the decoupling of phenomena with different time constants (Donoso-Bravo et al., 2011). They have been successfully applied to various electrochemical systems so far. Dynamic methods with sinusoidal change in current, e.g., electrochemical impedance spectroscopy or nonlinear frequency response analysis have been used to identify the kinetics e.g., of methanol electrooxidation (Krewer et al., 2006) and oxygen electroreduction (Mao and Krewer, 2013). Also step-wise changes in current or concentration (Krewer et al., 2007a) have been used to study electrochemical kinetics and interaction of reaction and transport (Krewer et al., 2007b). The corresponding response signals contain significant information on mechanisms and the state of the electrode. In the field of anaerobic digestion, concentration pulse responses have been evaluated quantitatively using concentration data over time: Kalfas et al. (2006) successfully parameterized a model for anaerobic digestion of olive pulp with data obtained from pulse injection of various intermediates.
Based on the promising approaches summarized above, we further develop the concentration pulse method to analyse BES and extract quantitative information.
In BES literature, only responses of the current density to concentration pulses have been discussed in-depth, whereas concentration data have not been analyzed in detail. Mahmoud et al. (2016) used acetate pulses to show that acetate availability was limiting current production in an MEC treating landfill leachate. Similarly, Parameswaran et al. (2009) demonstrated with pulse experiments that ethanol was not consumed directly in an MEC, but fermented to acetate first.
In this study, we selected glycerol as a promising example substrate to apply the concentration pulse methodology for a number of reasons: In recent years, glycerol utilization technologies have received increasing attention because glycerol is the major by-product from biodiesel production (da Silva et al., 2009; Garlapati et al., 2016). About 10% (w/w) glycerol is produced for every unit of biodiesel (Marchetti et al., 2007). Glycerol is also an interesting substrate for BES, and several approaches have been reported in literature, including electricity generation (Feng et al., 2011; Nimje et al., 2011; Chookaew et al., 2014; Tremouli et al., 2016), 1,3-propanediol production (Zhou et al., 2013; Moscoviz et al., 2016), and hydrogen production (Escapa et al., 2009; Selembo et al., 2009; Chignell and Liu, 2011; Sharma et al., 2011; Kumar and Venugopalan, 2015; Montpart et al., 2015).
A number of fermentation products have been identified in BES utilizing glycerol as carbon source, e.g., lactate, butyrate, ethanol, methane, acetate, propionate, 1,3-propanediol. A more detailed overview is given in Table S1. Still, while metabolic pathways for fermentation of glycerol have been thoroughly discussed in literature (Biebl et al., 1999; Yazdani and Gonzalez, 2007; da Silva et al., 2009; Moscoviz et al., 2016), it is not easy to determine which pathways are active in a given glycerol-fed BES nor which of the fermentation products contribute to electricity generation and which do not. Thus glycerol is a promising example substrate to demonstrate our methodology.
In this work, we set up a continuously operated glycerol-fed BES and recorded concentration pulse responses by observing the transients of current and concentrations after the injection of intermediates at high concentrations. With this methodology, we identify the pathway from glycerol to current and calculate conversion efficiencies for each intermediate. We show how these experiments can be used to extract rate constants for substrate conversion and we characterize the dynamic system behavior. Finally, community analysis links the pathways to key players in the microbial community.
2. Materials and Methods
2.1. Reactor Set Up and Operation
In Figure 1, the experimental set up is depicted. The experiments were conducted in a heating cabinet (L) at a constant temperature of 35 °C. The reactor consisted of a 5-necked round bottom glass flask (A) that was agitated by a magnetic stirrer (I). The working electrode (B) was made from a graphite rod (CP Handels-GmbH, A = 6 cm2, d = 1 cm). The counter electrode (D) was made from the same material as the anode. The reactor was operated in half-cell mode under potentiostatic control with a ZiveZ5 potentiostat (WonATech, South Korea). All potentials are reported with respect to a saturated Ag/AgCl reference electrode (C, Meinsberger Elektroden, Germany, +0.197 V vs. SHE). Chronoamperometry (CA) was recorded at a constant potential of 0.2 V, cyclic voltammograms (CV) were recorded from 0.2 V to -0.5 V at 1 mV/s. Before starting an experiment, the reactor was filled with 180 ml of a deaerated solution consisting of a glycerol solution and a vitamin and mineral solution. Details of the media composition are provided in the next section. After inoculation, the reactor was kept in batch mode until current production was detected. A three-channel peristaltic pump (K) was used to continuously feed the reactor with glycerol solution (E) and vitamin and mineral solution (F). Nitrogen-filled gas bags (M) were attached to the bottles to avoid under-pressure in the feed bottles that could cause air to enter. The ratio of the volumetric flow rate of glycerol solution to vitamin and mineral solution was 1:0.85 at all times. All glycerol inlet concentrations and flow rates in the following are reported with respect to the total volume flow after mixing both solutions.
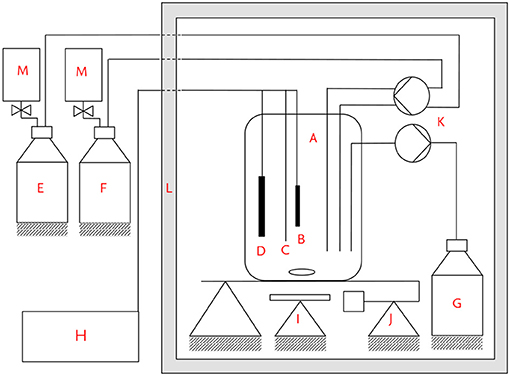
Figure 1. Experimental set up. (A) Reaction vessel, (B) working electrode, (C) reference electrode, (D) counter electrode, (E) glycerol solution bottle, (F) vitamin and trace element solution bottle, (G) effluent bottle, (H) potentiostat, (I) magnetic stirrer, (J) balance, (K) three-channel peristaltic pump, (L) heating cabinet, (M) nitrogen gas bags.
The liquid level was controlled via a balance (J), whose signal was used to control the third channel of the peristaltic pump, that was pumping solution out of the reactor into the effluent bottle (C). The hydraulic residence time was 28.8 h for all experiments, apart from pretests described in the Supplementary Information, for which hydraulic residence time was varied between 5.4 and 21.6 h. HPLC samples were taken at the end of the outlet tube and filtered through a 0.2 μm syringe filter before HPLC analysis. From the volume of the tube and the flow rates, a mean residence time of 15 min was calculated for the outlet tube and taken into account during sampling. The reactor was inoculated in batch-mode. After rising current production indicated a successful colonization, continuous operation was started. The microbial community that developed in the anodic biofilm and in the planktonic phase was determined by RNA sequencing after 2 months of operation (see section 2.4). For the concentration pulses, ~2 ml concentrated solution was injected directly into the 180 ml solution within the reactor through a silicone rubber stopper. The liquid level was not influenced significantly by the injection and the parameters of the pump controller were chosen in a way that the 2 ml injection did not cause a rapid change in outlet flow rate. A first set of concentration pulse experiments was performed under closed circuit potentiostatic operating conditions beginning 29 days after inoculation, and a second set of pulse experiments was performed under open circuit conditions beginning 114 days after inoculation.
2.2. Inoculum and Media Composition
Buffered glycerol solution was produced by dissolving glycerol (PanReac AppliChem) in a pH 7 buffer solution containing 2.69 g NaH2PO4, 4.33 g Na2HPO4, 0.31 g NH4Cl, and 0.31 g KCl per litre (Kim et al., 2005). The glycerol solution was boiled prior to the experiments for deaeration and disinfection. Vitamin and trace element solution was made by mixing 12.5 ml trace element mixture and 12.5 ml vitamin mixture with 1,025 ml of deionized water (Balch et al., 1979). The vitamin and trace element solution was deaerated with high purity nitrogen for at least 20 min prior to the experiments. For the concentration pulse experiments, 50 ml of concentrated solutions were produced by dissolving sodium propionate (Sigma-Aldrich), sodium acetate (Merck), 1,3-propanediol (Sigma-Aldrich), or glycerol (PanReac AppliChem) in buffer solution. The substances were chosen after a pretest (see section SI1 in the Supporting Information), and the solutions were bubbled with N2 for at least 20 min prior to injection.
The inoculum used in this study was taken from a mixed-culture biofilm dominated by Geobacter anodireducens/sulfurreducens which was enriched from waste water (from the Wastewater treatment plant Steinhof, Braunschweig, Germany). Details on the enrichment procedure have been described by Riedl et al. (2017). Glycerol was the sole initial carbon source in the reactor. No community analysis of this initial inoculum was performed.
2.3. HPLC Measurements
Quantitative concentration analyses were performed by HPLC, with a refractive index (RI) detector (Spectrasystem P4000, Finnigan Surveyor RI Plus Detector, Fischer Scientific), a HyperREZ XP carbohydrate H+8 μm (S/N: 026/H/012-227) column, and H2SO4 (0.01 mol L−1, flow rate 0.5 mL min−1) as eluent. The column and the RI detector were operated at 25°C. Samples were collected from the reactor effluent, and bacteria were removed by filtering with a 0.2 μm pore size filter. No other pretreatment was performed. Some HPLC samples were measured repeatedly and the concentration values showed only minor deviations which were no larger than 0.02 mmol L−1.
2.4. Bacterial Community Analysis
After 67 days of operation part of the biofilm was scraped from the anode with a sterile doctor's blade for sequencing analysis of the anode biofilm community. At the same time, a sample from the solution inside the reactor was taken to analyse the microbes in the planktonic phase. After taking the samples, the reactor was sealed again and operation was continued.
A modified protocol of Lueders and Friedrich (Lueders et al., 2003) was employed to extract RNA from the biofilm and the planktonic phase samples. The precipitation step of the nucleic acids in polyethylene glycol was prolonged to 90 min instead of 30 min and the nucleic acids were finally resuspended in 50μL EB buffer instead of 100μL EB buffer as originally described in Lueders et al. (2003). The DNA was removed by the application of the Qiagen RNeasy MinElute CleanUp Kit and of the Thermo Fisher RNase-free DNase I digestion Kit according the manufacturers' instructions. Subsequently, a potential contamination with remaining DNA was assessed with the QubitTM dsDNA HS Assay Kit and the concentration of RNA was checked with the Quant-iTTM RiboGreenTM RNA Assay Kit. After the reverse transcription of the RNA into cDNA, amplicons of the V3 region of the 16S rRNA gene were prepared with the primer pair 341f and 515r as described by Bartram et al. (2011). The quality of the Bartram libraries was checked with a 2100 Bioanalyzer (Agilent Technologies, Santa Clara, CA, U.S.) and the subsequent sequencing was performed in 100 bp paired end mode on a HiSeq2500 (Illumina, San Diego, CA, U.S.). The generated sequences were processed with an amplicon analysis pipeline after the quality of the raw reads had been checked by FastQC version 0.10.1 (Simon Andrews; www.bioinformatics.babraham.ac.uk/projects/fastqc/). After the trimming of the forward and the reverse reads to a length of 100 bp, the raw sequence data were purified from potential primer dimers by a JAVA program called DimerFilter. Fastq-join (Aronesty, 2013) joined the forward and reverse reads with a 20 percent mismatch and a minimum overlap of 6 bp. FASTA converted sequence files were subsequently checked with Uchime (Usearch 5.2.32, Edgar et al., 2011) against the gold database provided by ChimeraSlayer (drive5.com/otupipe/gold.tz) and the RDP classifier 2.10.1 (Wang et al., 2007; Cole et al., 2014). The RDP classifier 2.10.1 (Wang et al., 2007; Cole et al., 2014) with a confidence value of 0.5 which is recommended for short read amplicon data was employed to perform taxonomic dependent analyses of the bacterial community.
3. Results and Discussion
3.1. Concentration Pulse Responses Under Closed Circuit Potentiostatic Conditions
In this section, the results of the concentration pulse experiments under electrical closed circuit conditions and continuous flow are discussed. The reaction pathway that we suggest based on the experimental results is summarized in section 3.3.
In Figure 2, the typical fluctuation of the current density in the continuously operated reactor over time is shown. After chemostatic conditions are established, a steady-state current density of ~0.2 mA cm−2 is reached. The fact that a steady state can be maintained with only minor fluctuations and the fact that the system returns to steady state after each concentration pulse are important conditions for evaluating the concentration pulse experiments which are discussed in this section.
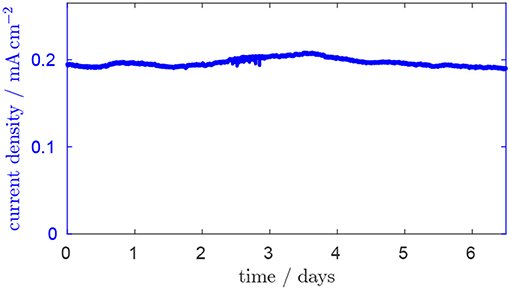
Figure 2. Current over time after chemostatic conditions are established. Residence time is 28.8 h, glycerol inlet concentration 1.8 mM, anode potential 0.2 V.
In Figure 3A, the system's response to a pulse in acetate concentration is depicted. Current density is plotted on the left axis, concentration values on the right axis. After injecting acetate, the current density rises rapidly, within 4 min, from 0.185 mA cm−2 to 0.235 mA cm−2. Subsequently, the current density continues to increase linearly for 1 day to a level of 0.72 mA cm−2, which is sustained for 7.2 h. After this plateau, the current density drops because of the decreasing acetate concentration. The acetate concentration is falling because acetate is washed out of the reactor, which has a residence time of 28.8 h, and is consumed by the microorganisms. We conclude from the almost instantaneous increase in current density and the absence of any other concentration peaks that acetate is directly oxidized in the biofilm without other intermediates being involved. The maximum current density is close to the current density we observed in the same reactor using acetate as the only carbon source (data not shown). Also, the community analysis (see section 3.7), which shows a high share of Geobacter sp. in the biofilm, supports the conclusion that acetate is oxidized directly in the biofilm. The comparatively slow linear increase from 0.235 to 0.72 mA cm−2 is attributed to biofilm growth because of the duration of about 1 day. Biofilm growth is analyzed quantitatively below. After each pulse the current density returns to its steady state value within 3 to 5 days. Thus we conclude that biofilm growth is a reversible process and that the biofilm returns to its original performance level after the injected substances have been washed out of the reactor.
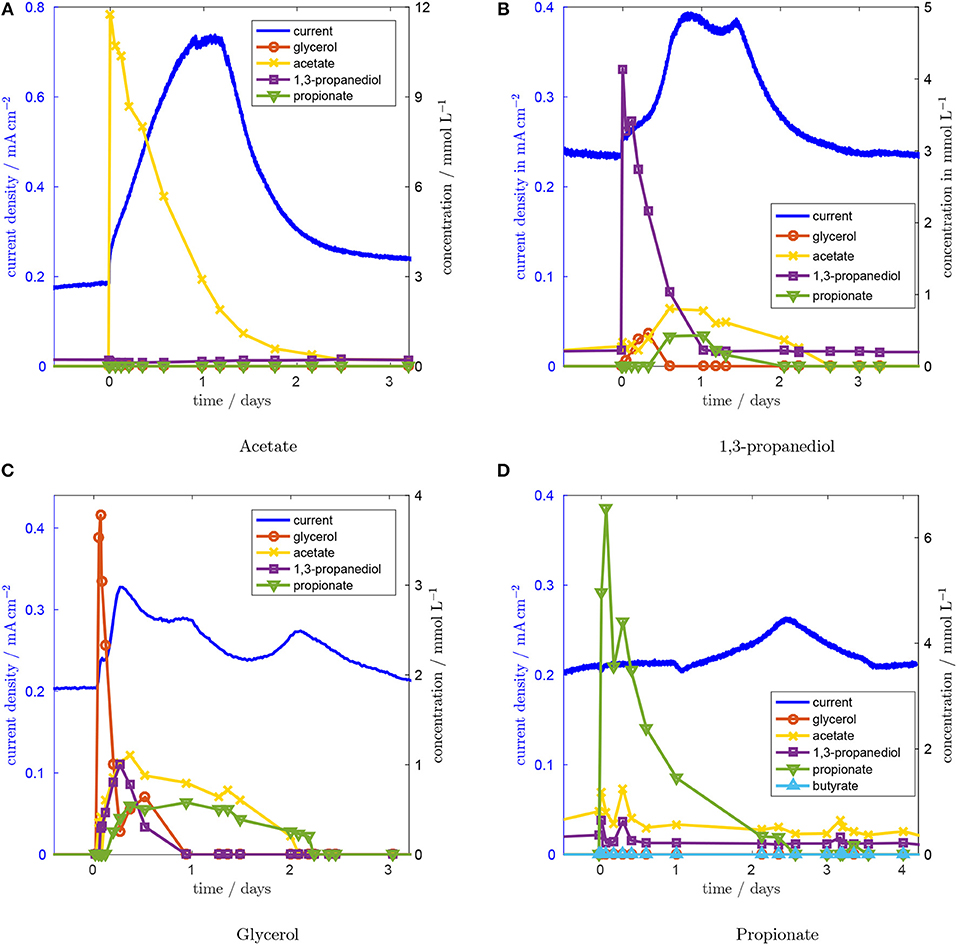
Figure 3. Concentration and current responses to an acetate (A), a 1,3-propanediol (B), a glycerol (C), and a proprionate (D) concentration pulse at t = 0. Residence time is 28.8 h, glycerol inlet concentration 1.8 mM, anode potential 0.2 V.
Next, the concentration pulse response for 1,3-propanediol was recorded (Figure 3B). The current density rises quickly after a short lag time and reaches 0.394 mA cm−2 at 21 h. After a short drop to 0.370 mA cm−2 , a second peak is reached 13.75 h after the first one. Subsequently, the current density approaches its original value again. The peaks in current density correspond to a period of high acetate concentration. From this we conclude that current production from 1,3-propanediol proceeds mainly via acetate. After the 1,3-propanediol pulse, glycerol concentration rises first, peaking after ~8 h. Acetate and propionate concentrations follow with a slight delay and reach their maxima ~14 h after the concentration pulse, which is consistent with the time of the maximum current. Thus, either 1,3-propanediol is converted to glycerol, which is then converted to acetate, or 1,3-propanediol inhibits glycerol metabolism, causing the concentration to rise because of the steady inflow of glycerol.
Similar effects can be seen after the glycerol concentration pulse in Figure 3C. After the pulse, concentrations of 1,3-propanediol, acetate and propionate all rise with a very small time delay. While acetate and propionate can be detected over a period of 36 h, the concentration of 1,3-propanediol diminishes more quickly. Glycerol concentration falls rapidly and reaches a local minimum of 0.26 mM L−1 5 h after the pulse. After this minimum, glycerol concentration increases again up to 0.64 mM L−1. This concentration increase goes along with the drop in 1,3-propanediol concentration, a similar interaction as was observed for the 1,3-propanediol pulse. At the same time, acetate and propionate concentrations do not fall significantly, rendering a reaction from 1,3-propanediol to glycerol as the more likely cause, compared to inhibition of glycerol degradation by 1,3-propanediol. This reaction has not been in the focus of previous work because glycerol fermentation to 1,3-propanediol is viable from an economic point of view, whereas the reverse reaction is not. The lack on literature data for this reaction necessitates further research to explain the observed conversion in detail. The glycerol concentration pulse was repeated to check whether the reactor history has an influence on the concentration pulse responses and thus whether the microbial consortium changed in its functionality. The repetition experiment (see Figure S2) indicates that this is not the case.
After the glycerol concentration pulse, the current density increases to 0.328 mA cm−2 after 5.3 h. This maximum coincides with the maximum acetate concentration. A second, lower peak appears after 21.1 h, while acetate concentration is still high. Forty nine hours after the pulse, a third peak with a height of 0.234 mA cm−2 appears, even though metabolite levels in the effluent are not elevated any more. This suggests that the charge released during the third current peak is stored in some intra-cellular intermediate that is not detected by HPLC. Such dynamics in the current production of electroactive biofilms resulting from the storage of intra-cellular intermediates have been reported previously (Kubannek et al., 2018).
The response to the propionate concentration pulse, which can be seen in Figure 3D, suggests that propionate might be involved in the pathway that causes the delayed increase in current. After injecting propionate, the current density remains unchanged for about 30 h. After that, the current density slowly rises to 0.265 mA cm−2 at hour 60 after the pulse. At the time of the maximum current density, no elevated intermediate concentration can be detected. Since the time delay and the shape of the peak are similar to the third peak from the glycerol concentration pulse, we believe that a similar mechanism causes this behavior. We assume that an intracellular metabolite is formed from propionate, which is either converted to current via acetate that is produced from propionate in a slow reaction, or oxidized directly after a slow adaptation of the biofilm. Both mechanisms have been described in literature: Kiely et al. (2011) reported good performance of a propionate-fed MFC in abscence of Geobacter spp. showing that a direct electrooxidation of proprionate is possible. On the other hand, Hari et al. (2016) suggested that current from propionate would be generated via acetate.
3.2. Concentration Pulse Responses Under Open-Circuit Conditions
The results discussed so far indicate that there is a clear division of labor between the planktonic phase and the biofilm. Fermentation of glycerol to acetate takes place in the planktonic phase and acetate is oxidized by anode respiring bacteria in the biofilm. To check how the fermentative pathway is influenced by the anode respiring bacteria, pulse experiments were repeated under open-circuit conditions. The flow rate and glycerol inlet concentration were at the same values as before. The pulse responses to 1,3-propanediol, glycerol and acetate under open-circuit conditions can be found in Figures S3–S5. Overall, the concentration transients match those under closed circuit conditions well, with the main exception of acetate. Acetate concentration rises by ~0.95 mmol L-1 after switching to open circuit conditions.
By Faraday's law it can be calculated that the concentration increase directly after switching to open-circuit conditions matches the current density under closed circuit conditions:
This confirms the findings from the concentration pulse experiments under closed circuit conditions: the oxidation of acetate to CO2 is the main electrochemical reaction and requires the anode as a terminal electron acceptor. All other reactions are chemical reactions and are not strongly influenced by the potential at the given conditions. The community analysis (see section 3.7) also supports this interpretation. We would like to point out that at higher organic loading rates, where accumulation of fermentation products inhibits a further substrate breakdown, different behavior may occur.
After 30 days under open-circuit operation, acetate concentration is only 0.3 mmol L-1, which probably results from adaptation of the bacterial community to the new conditions. A possible explanation would be the slow proliferation of methanogens, which are outcompeted by the anode respiring bacteria under closed circuit conditions.
The quantitative match between the drop in current density and the increase in acetate concentration also indicates that hydrogen recycling from the cathode to the anode does not contribute significantly to the observed current density, even though no special precautions were taken to prevent this effect.
3.3. Pathways Active in the Bioelectrical System
In the previous sections, we showed that current production mainly results from acetate electrooxidation. Since all pulsed substances resulted in a response of the current density, we assume that they are all partly converted to acetate via biochemical reactions. Furthermore, glycerol and 1,3-propanediol are directly linked. Thus, we conclude from the concentration pulse experiments and from literature studies that the pathways shown in Figure 4 dominate the processes in the BES. The substances in colored boxes were measured directly, the others are based on literature (Biebl et al., 1999; da Silva et al., 2009). Conversion of glycerol to 1,3-propanediol via 3-hydroxy-propionaldehyde does not result in current production directly, but a backward reaction to glycerol is triggered at higher 1,3-propanediol concentrations. Current production most likely proceeds via phosphoenolpyruvate, acetyl-coenzyme A (acetyl-CoA) and acetate. Acetate electrooxidation is the only part of the reaction scheme taking place in the biofilm, all other reactions are biochemical reactions taking place in the planktonic phase. Propionate is most likely produced in a pathway starting from phosphoenolpyruvate via succinate. The observed pathway from propionate to current that leads to a long delay of the current response in the propionate pulse remains unclear.
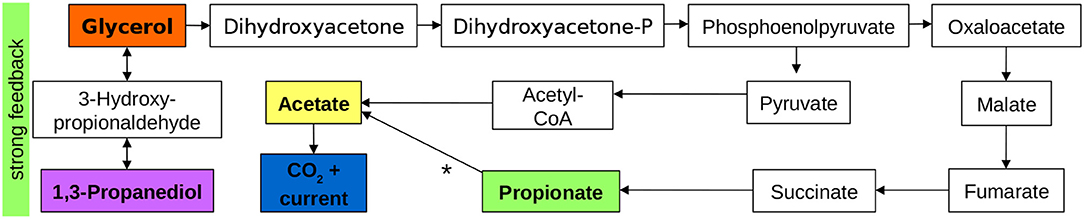
Figure 4. Main active pathways and interactions during glycerol electro-oxidation in an MFC. Substances in colored boxes were measured directly, intermediates are based on da Silva et al. (2009). The pathway from propionate to acetate, denoted by a * is unclear.
The presented pathway is valid for our experimental conditions. It is intended as an overview on the main active pathways in the glycerol BES at the given operating conditions and demonstrates the principle capability of the concentration pulse method. To draw general conclusions on pathways in certain bacterial species, defined cultures need to be used.
However, the concentration pulse responses allow to identify important interactions and dependencies in a running reactor without performing multiple batch experiments. In combination with literature, the analysis of the dynamic system response to concentration pulses allowed us to identify probable pathways.
3.4. Conversion Efficiencies
Apart from qualitative information, quantitative information can also be extracted from the pulse experiments. In Table 1, the values of the coulomb efficiency (CE), calculated according to Equation (1), are reported for each spiking experiment. Similarly to previous reports (Sharma et al., 2011), the injected amount is corrected for the charge flushed out with the effluent for CE calculation because the continuous flow lead to a large share of the injected substrate i being flushed out before it can be oxidized:
I is the current during a pulse experiment, I0 is the steady state current. Integration is performed in the time interval [0−tend] that ranges from the time of the pulse until concentrations and currents have returned to steady state. The integral in the denominator is thus the additional charge resulting from the concentration pulse which is transferred to the electrode above the steady state level. is the amount of substrate i injected during the pulse, zi is the number of electrons that would be freed by complete oxidation of the substrate to CO2, an F is the Faraday constant. Thus, the first term in the denominator is the maximum charge available from the concentration pulse. Fout is the outlet flow rate, the outlet concentration of substance j, is the outlet concentration of substance j in steady state. Thus the second term in the denominator accounts for the additional charge that is flushed out of the reactor above the steady state level and the current efficiency captures only the effects from the pulse, not the steady state. For comparison, the steady state current efficiency is reported in the last line of Table 1. It is calculated by Equation (2), considering an average 1,3-propanediol concentration of 0.1 mmol l-1, which is found in the effluent stream under closed circuit conditions:
We assume that the remaining carbon is either converted to biomass or methane which were not quantified. The good agreement between the CE of 26.7% from the glycerol concentration pulse and the CE of 28.4% in steady state indicates that the pathways and mechanisms active during the pulses were similar to those in steady state.
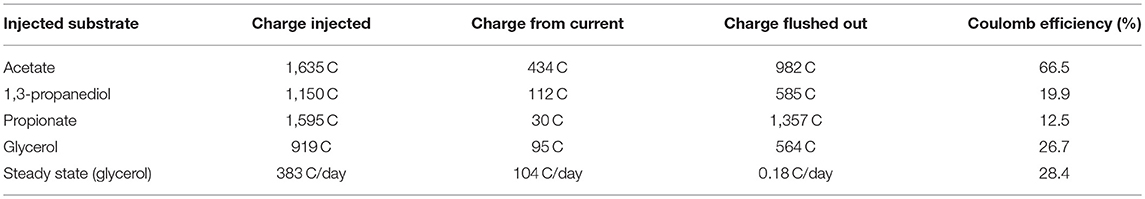
Table 1. Coulomb efficiencies for all concentration pulse responses and steady state glycerol operation.
In literature, a CE of 32–35% has been reported for a glycerol-fed MFC (Montpart et al., 2015). The conversion efficiency of 66% for acetate is comparable to values reported for batch MFC experiments using acetate as the sole carbon source (Chae et al., 2009), which confirms that the biofilm is highly adapted to acetate despite glycerol being supplied at the inflow.
3.5. Rate Constants in the Planktonic Phase
In the following section, we will demonstrate how quantitative information about the reaction rates of glycerol electrooxidation can be extracted from the pulse experiments. Rate constants for the substrate consumption in the liquid phase can be calculated when using the Monod equation
to describe the substrate consumption rate ri of substance i. Xj is the biomass in the biofilm (for acetate consumption) or in the planktonic phase, ci the substrate concentration, qmax, i the saturation rate constant and KS, i the half-saturation rate constant. For the time directly after a concentration pulse, we assume ci>>KS, i for the pulsed intermediate. Using this assumption, we described the concentration transients after the pulse by a simplified model according to Equation (4), with the reactor volume V, the flow rate Fout, and the concentration ci of the substance that was injected for the respective pulse experiment.
The differential equation was implemented and solved in the software Matlab. The maximal substrate utilization rate Xj·qmax, i was adjusted to fit the simulated concentration transients to the first three experimental concentration values after the pulse. The experimental and the simulated values, which are depicted in Figure S6, agree well for the time shortly after the concentration pulse. This agreement shows that the assumption ci>>KS, i is sound. The resulting values for Xj·qmax, i can be found in Table 2. The concentration transients for glycerol and 1,3-propanediol pulses, which were recorded under closed-circuit and open-circuit conditions, can be described by the same maximal substrate utilization rates. This again confirms that the reactions in the planktonic phase were largely independent of the electrode reactions within the limited time of operation at open-circuit conditions. The estimation of net rate constants for the total consumption in the planktonic phase cannot replace carefully designed kinetic experiments for the single reactants and yields quite large error ranges. As it can be seen in Figure S6, changing the rate constants by 20% still yields a reasonable fit. However, the possibility of obtaining approximate rate constants for various substances in a single continuously operated reactor is a clear advantage from a practical point of view. Efforts to model the dynamics of the pulse experiments to determine rate constants and interactions more thoroughly are currently under way in our group.
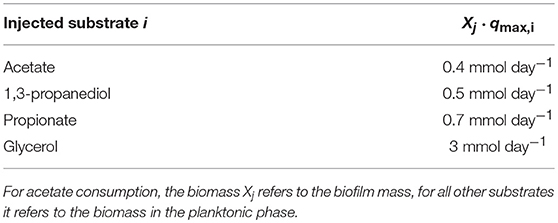
Table 2. Estimated maximal rates of substrate consumption directly after the concentration pulse, assuming ci>>KS, i using Equation 4.
3.6. Rate Constants in the Biofilm
Parameters for the electroactive biofilm can also be obtained from the pulse experiments, as we will show in this section. While pulse experiments have already been applied in anaerobic digestion (Pind et al., 2003), to the best of our knowledge, no rate constants for MFCs have been derived from pulse experiments yet. A common expression to calculate the current produced by a biofilm is the Nernst-Monod equation (Marcus et al., 2007):
With the maximal specific substrate turnover rate qmax, Ac, the active biomass Xbf of the biofilm, the concentration of the electron donor c, i.e., acetate, and the half-saturation rate constant KS. E−EKA is the difference between the electrode potential E and the potential EKA at which the reaction rate is 50% of the maximum value. In turnover CVs (see Figure S6), the current reaches a plateau far below the potential of 0.2 V applied in CA, showing that the potential dependent term is very close to one throughout all CA experiments. Directly after the concentration pulse, see Figure 3A, the concentration dependent term is also close to one because of the high acetate concentration. The fact that the current reaches a plateau 22 h after the pulse and remains nearly constant for seven hours despite of a continuously falling acetate concentration, is a further indicator that the biofilm current production is not significantly limited by acetate concentration during the whole growth phase that follows the concentration pulse. Therefore the increase in current density is attributed to an increase in qmax, AcXbf. From the current density directly after the concentration pulse, qmax, AcXbf = 0.164 mmol/d can be calculated by Faraday's law. From this value and qmax, AcXbf at the end of the growth phase, a rate for the increase of qmax, AcXbf over time can be calculated: , which corresponds to 933 mmol m-2 d-2. Even though the growth seems to proceed linearly, it is likely that the observable behavior results from a number of non-linear processes, including not only an increase in biomass, but also changes in gene expression and increasing transport resistances for substrate and protons in the thicker biofilm.
Approximately 1.5 days after the pulse, the current density begins to fall. In Figure S7, it is shown that this decline in current density can be described by a Monod-type relationship, I∝c/(c+Ks), with a half-saturation rate constant KS, D≈1.4 mmol L-1 for the biofilm after the growth phase. In literature, KS, D values of 0.674 mmol L-1 for a mixed culture biofilm and 0.126 mmol L-1 for a Geobacter sulfurreducens biofilm have been reported (Liu et al., 2015). Depending on the electron acceptor, KS, D values of 0.01 and 0.03 mmol L-1 have been reported for G. sulfurreducens in suspended cell culture (Esteve-Nunez et al., 2005). Such high deviations between reported values occur because the apparent half-saturation rate constant in a biofilm strongly depends on transport. The calculations above show that concentration pulse experiments yield information on concentration dependency and growth behavior of the biofilm. Of course, the parameters of interest will vary according to the biofilm model in use and the specific research question. In principle, concentration and time dependent models for biofilm performance using other relationships than the Nernst-Monod equation can also be parametrized by pulse experiments.
3.7. Microbial Community Analysis
In Figure 5, the results from a sequencing analysis are presented, which was conducted 2 months after the start of the experiment. The sequencing analysis provides only a snapshot of the community composition which might be changing over time. However, the fact that the repetition of the glycerol concentration pulse experiment shows the same distinct features as the first glycerol concentration pulse experiment indicates that at least the part of the community that dominates the observable fermentation in the planktonic phase and the current production in the biofilm was stable over time in our system. It can be seen in Figure 5 that there is a clear division between planktonic phase and biofilm: while the biofilm community is relatively homogeneous and dominated by species from the Geobacter genus, the planktonic phase is comparatively heterogeneous. In the biofilm, Geobacter spp. accounted for a share of 92.8%. No other single bacterial genus accounted for more than one percent of the reads. The high share of Geobacter spp. most likely results from the inoculation of the reactor with an acetate-grown secondary biofilm (Yates et al., 2012). It is remarkable though, that the population is stable after transfer into a glycerol-fed reactor and subsequent operation for 2 months. After taking the samples for sequencing, the reactor was sealed again, as explained in the experimental section. Following a brief recovery phase, the current density returned to the previous steady state value of ~0.2 mA/cm2.
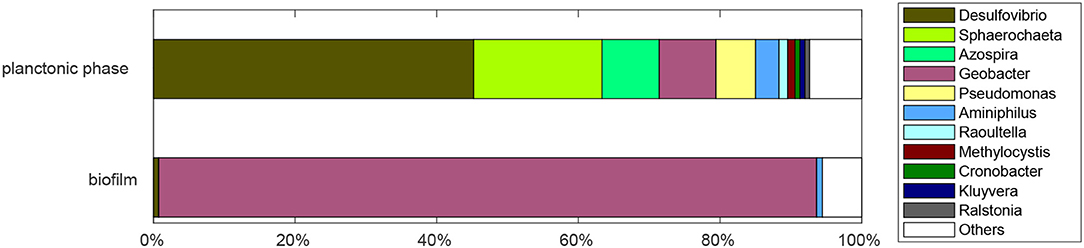
Figure 5. Relative abundance of bacterial genera found in biofilm and planktonic phase of the reactor after 2 months of continuous operation with 1.8 mM glycerol inlet concentration, an anode potential of 0.2 V, and a residence time of 28.8 h.
In the planktonic phase, members of the Desulfovibrio genus comprise the largest share (45.2%), followed by the genera Sphaerochaeta (18.1%), Azospira (8.1%), Geobacter (8%), and Pseudomonas (5.6%).
The presence of Geobacter spp. might result from biofilm abrasion. Desulfovibrio alcoholovorans and D. fructovorans can ferment glycerol to 3-hydroxypropionate and 1,3-propanediol in the absence of electron acceptors (Qatibi et al., 1991b) and to acetate in the presence of electron acceptors such as sulfate or methanogens (Qatibi et al., 1991a). D. alcoholovorans is also able to oxidize 1,3-propanediol to acetate in the presence of electron acceptors (Qatibi et al., 1991a,b). Also other species from the Desulfovibrio genus can produce acetate from complex substrates. For example, D. desulfuricans produces acetate from lactate (Lopes et al., 2006) or polyethylen glycol (Dwyer and Tiedje, 1986). The pathways identified from the concentration pulse experiments are thus consistent with literature results. Further investigations of the interactions between the species are necessary to explain the precise reason for the large share of Desulfovibrio spp. in our system.
Desulfovibrio was found by Parameswaran et al. (2011) in the planktonic phase of an MEC where it was assigned the role of homo-acetogenesis from hydrogen and CO2. In our case, the increase in acetate concentration under open circuit conditions, when compared to closed circuit conditions, is consistent with the decrease in current (see section 3.2). We conclude that homo-acetogenesis from hydrogen produced at the cathode did not contribute significantly to acetate production.
The other genera found in the reactor have also been observed previously in BES: Sphaerochaeta spp. were observed in a BES for the anaerobic digestion of molasses (De Vrieze et al., 2014) and closely related Spirochaeta spp. were found in MFCs running on wastewater (Lesnik and Liu, 2014). Pseudomonas spp. were found in BES running on acetate (Kiely et al., 2011), and Azospira spp. have been found in wastewater-fed BES (Pannell et al., 2016). But the role of these bacteria has not been clearly identified.
The low glycerol inlet concentration, in combination with the continuous flow operation, might have exercised a selective pressure that was not present in other studies, leading to a different microbial community. Additionally, the inoculum from an acetate acclimatized MFC might have lacked certain bacteria in the first place. However, these conditions did not negatively affect the coulombic efficiency as discussed above.
The community analysis confirms the division of labor principle that was already visible in the concentration pulse experiments and suggests that Desulfovibrio spp. species might be interesting candidates for designing syntropic communities for BES utilizing glycerol.
4. Conclusions
We presented a fast and analytically simple method for identifying reaction pathways in continuously operated glycerol-fed BES under chemostatic conditions by applying concentration pulses. It was found that glycerol is first fermented by planktonic bacteria to acetate, which is then oxidized electrochemically by the anode respiring bacteria in the biofilm. Additionally, rate constants for the metabolism of various intermediates, as well as kinetic parameters for the biofilm, were obtained. Community analysis results agreed with the conclusions from the pulse experiments and confirm the division of labor principle between biofilm and planktonic phase. The presented concentration pulse method can be used to identify reactor behavior and even evaluate kinetics without community analysis and without a need for starting numerous batch experiments.
The presented method can also be applied to other BES metabolizing complex substrates with undefined bacterial cultures to obtain qualitative and quantitative information on system behavior.
Author Contributions
FK performed the experiments, analyzed the data and wrote the manuscript. CM contributed to planning the reactor setup and took samples for the sequencing analysis. KH performed the sequencing analysis and wrote the experimental section on sequencing. JO, US, and UK supervised the research. All authors discussed the results and commented on the manuscript before submission.
Funding
CM acknowledges financial support from the state of Lower Saxony within the ElektroBak project.
Conflict of Interest Statement
The authors declare that the research was conducted in the absence of any commercial or financial relationships that could be construed as a potential conflict of interest.
Acknowledgments
The authors would like to thank Barabara Dziobek, Joana Kühne, and Hans Klesser for supporting the experimental work, and Waldemar Sauter for performing the HPLC analyses.
Supplementary Material
The Supplementary Material for this article can be found online at: https://www.frontiersin.org/articles/10.3389/fenrg.2018.00125/full#supplementary-material
References
Aronesty, E. (2013). Comparison of Sequencing Utility Programs. Open Bioinformat. J. 7, 1–8. doi: 10.2174/1875036201307010001
Balch, W. E., Fox, G. E., Magrum, L. J., Woese, C. R., and Wolfe, R. S. (1979). Methanogens: reevaluation of a unique biological group. Microbiol. Rev. 43, 260–296.
Bartram, A. K., Lynch, M. D. J., Stearns, J. C., Moreno-Hagelsieb, G., and Neufeld, J. D. (2011). Generation of multimillion-sequence 16S rRNA gene libraries from complex microbial communities by assembling paired-end illumina reads. Appl. Environ. Microbiol. 77, 3846–3852. doi: 10.1128/AEM.02772-10
Biebl, H., Menzel, K., Zeng, A.-P., and Deckwer, W.-D. (1999). Microbial production of 1,3-propanediol. Appl. Microbiol. Biotechnol. 52, 289–297. doi: 10.1007/s002530051523
Chae, K.-J., Choi, M.-J., Lee, J.-W., Kim, K.-Y., and Kim, I. S. (2009). Effect of different substrates on the performance, bacterial diversity, and bacterial viability in microbial fuel cells. Bioresource Technol. 100, 3518–3525. doi: 10.1016/j.biortech.2009.02.065
Chignell, J. F., and Liu, H. (2011). “Biohydrogen production from glycerol in microbial electrolysis cells and prospects for energy recovery from biodiesel wastes,” in Proceedings of the ASME 2011 International Manufacturing Science and Engineering Conference, MSEC2011-50274, 693–701. doi: 10.1115/MSEC2011-50274
Chookaew, T., Prasertsan, P., and Ren, Z. J. (2014). Two-stage conversion of crude glycerol to energy using dark fermentation linked with microbial fuel cell or microbial electrolysis cell. New Biotechnol. 31, 179–184. doi: 10.1016/j.nbt.2013.12.004
Cole, J. R., Wang, Q., Fish, J. A., Chai, B., McGarrell, D. M., Sun, Y., et al. (2014). Ribosomal Database Project: data and tools for high throughput rRNA analysis. Nucl. Acids Res. 42, D633–D642. doi: 10.1093/nar/gkt1244
da Silva, G. P., Mack, M., and Contiero, J. (2009). Glycerol: a promising and abundant carbon source for industrial microbiology. Biotechnol. Adv. 27, 30–39. doi: 10.1016/j.biotechadv.2008.07.006
De Vrieze, J., Gildemyn, S., Arends, J. B., Vanwonterghem, I., Verbeken, K., Boon, N., et al. (2014). Biomass retention on electrodes rather than electrical current enhances stability in anaerobic digestion. Water Res. 54, 211–221. doi: 10.1016/j.watres.2014.01.044
Donoso-Bravo, A., Mailier, J., Martin, C., Rodríguez, J., Aceves-Lara, C. A., and Wouwer, A. V. (2011). Model selection, identification and validation in anaerobic digestion: a review. Water Res. 45, 5347–5364. doi: 10.1016/j.watres.2011.08.059
Dwyer, D. F., and Tiedje, J. M. (1986). Metabolism of polyethylene glycol by two anaerobic bacteria, Desulfovibrio desulfuricans and a Bacteroides sp. Appl. Environ. Microbiol. 52, 852–856.
Edgar, R. C., Haas, B. J., Clemente, J. C., Quince, C., and Knight, R. (2011). UCHIME improves sensitivity and speed of chimera detection. Bioinformatics 27, 2194–2200. doi: 10.1093/bioinformatics/btr381
Escapa, A., Manuel, M.-F., Morán, A., Gómez, X., Guiot, S. R., and Tartakovsky, B. (2009). Hydrogen production from glycerol in a membraneless microbial electrolysis cell. Energy Fuels 23, 4612–4618. doi: 10.1021/ef900357y
Esteve-Nunez, A., Rothermich, M., Sharma, M., and Lovley, D. (2005). Growth of Geobacter sulfurreducens under nutrient-limiting conditions in continuous culture. Environ. Microbiol. 7, 641–648. doi: 10.1111/j.1462-2920.2005.00731.x
Feng, Y., Yang, Q., Wang, X., Liu, Y., Lee, H., and Ren, N. (2011). Treatment of biodiesel production wastes with simultaneous electricity generation using a single-chamber microbial fuel cell. Bioresource Technol. 102, 411–415. doi: 10.1016/j.biortech.2010.05.059
Garlapati, V. K., Shankar, U., and Budhiraja, A. (2016). Bioconversion technologies of crude glycerol to value added industrial products. Biotechnol. Rep. 9, 9–14. doi: 10.1016/j.btre.2015.11.002
Hari, A. R., Katuri, K. P., Logan, B. E., and Saikaly, P. E. (2016). Set anode potentials affect the electron fluxes and microbial community structure in propionate-fed microbial electrolysis cells. Sci. Rep. 6:38690. doi: 10.1038/srep38690
Harnisch, F., and Rabaey, K. (2012). The diversity of techniques to study electrochemically active biofilms highlights the need for standardization. ChemSusChem 5, 1027–1038. doi: 10.1002/cssc.201100817
Kalfas, H., Skiadas, I., Gavala, H., Stamatelatou, K., and Lyberatos, G. (2006). Application of ADM1 for the simulation of anaerobic digestion of olive pulp under mesophilic and thermophilic conditions. Water Sci. Technol. 54:149. doi: 10.2166/wst.2006.536
Kiely, P. D., Regan, J. M., and Logan, B. E. (2011). The electric picnic: synergistic requirements for exoelectrogenic microbial communities. Curr. Opin. Biotechnol. 22, 378–385. doi: 10.1016/j.copbio.2011.03.003
Kim, C., Song, Y. E., Lee, C. R., Jeon, B.-H., and Kim, J. R. (2016). Glycerol-fed microbial fuel cell with a co-culture of Shewanella oneidensis MR-1 and Klebsiella pneumonae J2B. J. Indust. Microbiol. Biotechnol. 43, 1397–1403. doi: 10.1007/s10295-016-1807-x
Kim, J. R., Min, B., and Logan, B. E. (2005). Evaluation of procedures to acclimate a microbial fuel cell for electricity production. Appl. Microbiol. Biotechnol. 68, 23–30. doi: 10.1007/s00253-004-1845-6
Krewer, U., Christov, M., Vidakovic, T., and Sundmacher, K. (2006). Impedance spectroscopic analysis of the electrochemical methanol oxidation kinetics. J. Electroanalyt. Chem. 589, 148–159. doi: 10.1016/j.jelechem.2006.01.027
Krewer, U., Kamat, A., and Sundmacher, K. (2007a). Understanding the dynamic behaviour of direct methanol fuel cells: response to step changes in cell current. J. Electroanalyt. Chem. 609, 105–119. doi: 10.1016/j.jelechem.2007.06.015
Krewer, U., Pfafferodt, M., Kamat, a., Menendez, D. F., and Sundmacher, K. (2007b). Hydrodynamic characterisation and modelling of anode flow fields of Direct Methanol Fuel Cells. Chem. Eng. J. 126, 87–102. doi: 10.1016/j.cej.2006.09.001
Kubannek, F., Schröder, U., and Krewer, U. (2018). Revealing metabolic storage processes in electrode respiring bacteria by differential electrochemical mass spectrometry. Bioelectrochemistry 121, 160–168. doi: 10.1016/j.bioelechem.2018.01.014
Kumar, R., and Venugopalan, V. P. (2015). Development of self-sustaining phototrophic granular biomass for bioremediation applications. Curr. Sci. 108, 1653–1661. Available online at: http://www.currentscience.ac.in/Volumes/108/09/1653.pdf
Lesnik, K. L., and Liu, H. (2014). Establishing a core microbiome in acetate-fed microbial fuel cells. Appl. Microbiol. Biotechnol. 98, 4187–4196. doi: 10.1007/s00253-013-5502-9
Liu, Y., Deng, D., and Lan, X. (2015). A highly Efficient mixed-culture biofilm as anodic catalyst and insights into its enhancement through electrochemistry by comparison with G. sulfurreducens. Electrochim. Acta 155, 327–334. doi: 10.1016/j.electacta.2014.12.152
Lopes, F. A., Morin, P., Oliveira, R., and Melo, L. F. (2006). Interaction of Desulfovibrio desulfuricans biofilms with stainless steel surface and its impact on bacterial metabolism. J. Appl. Microbiol. 101, 1087–1095. doi: 10.1111/j.1365-2672.2006.03001.x
Lueders, T., Manefield, M., and Friedrich, M. W. (2003). Enhanced sensitivity of DNA- and rRNA-based stable isotope probing by fractionation and quantitative analysis of isopycnic centrifugation gradients. Environ. Microbiol. 6, 73–78. doi: 10.1046/j.1462-2920.2003.00536.x
Mahmoud, M., Parameswaran, P., Torres, C. I., and Rittmann, B. E. (2016). Relieving the fermentation inhibition enables high electron recovery from landfill leachate in a microbial electrolysis cell. RSC Adv. 6, 6658–6664. doi: 10.1039/C5RA25918E
Mao, Q., and Krewer, U. (2013). Total harmonic distortion analysis of oxygen reduction reaction in proton exchange membrane fuel cells. Electrochimica Acta 103, 188–198. doi: 10.1016/j.electacta.2013.03.194
Marchetti, J., Miguel, V., and Errazu, A. (2007). Possible methods for biodiesel production. Renew. Sustain. Energy Rev. 11, 1300–1311. doi: 10.1016/j.rser.2005.08.006
Marcus, A. K., Torres, C. I., Rittmann, B. E., Kato Marcus, A., Torres, C. I., and Rittmann, B. E. (2007). Conduction-based modeling of the biofilm anode of a microbial fuel cell. Biotechnol. Bioeng. 98, 1171–1182. doi: 10.1002/bit.21533
Montpart, N., Rago, L., Baeza, J. A., and Guisasola, A. (2015). Hydrogen production in single chamber microbial electrolysis cells with different complex substrates. Water Res. 68, 601–615. doi: 10.1016/j.watres.2014.10.026
Moscoviz, R., de Fouchécour, F., Santa-Catalina, G., Bernet, N., and Trably, E. (2017). Cooperative growth of Geobacter sulfurreducens and Clostridium pasteurianum with subsequent metabolic shift in glycerol fermentation. Sci. Rep. 7:44334. doi: 10.1038/srep44334
Moscoviz, R., Trably, E., and Bernet, N. (2016). Consistent 1,3-propanediol production from glycerol in mixed culture fermentation over a wide range of pH. Biotechnol. Biofuels 9:32. doi: 10.1186/s13068-016-0447-8
Nimje, V. R., Chen, C.-Y., Chen, C.-C., Chen, H.-R., Tseng, M.-J., Jean, J.-S., et al. (2011). Glycerol degradation in single-chamber microbial fuel cells. Bioresource Technol. 102, 2629–2634. doi: 10.1016/j.biortech.2010.10.062
Pannell, T. C., Goud, R. K., Schell, D. J., and Borole, A. P. (2016). Effect of fed-batch vs. continuous mode of operation on microbial fuel cell performance treating biorefinery wastewater. Biochem. Eng. J. 116, 85–94. doi: 10.1016/j.bej.2016.04.029
Parameswaran, P., Torres, C. I., Lee, H.-S., Krajmalnik-Brown, R., and Rittmann, B. E. (2009). Syntrophic interactions among anode respiring bacteria (ARB) and Non-ARB in a biofilm anode: electron balances. Biotechnol. Bioeng. 103, 513–523. doi: 10.1002/bit.22267
Parameswaran, P., Torres, C. I., Lee, H.-S., Rittmann, B. E., and Krajmalnik-Brown, R. (2011). Hydrogen consumption in microbial electrochemical systems (MXCs): the role of homo-acetogenic bacteria. Bioresource Technol. 102, 263–271. doi: 10.1016/j.biortech.2010.03.133
Pind, P. F., Angelidaki, I., and Ahring, B. K. (2003). Dynamics of the anaerobic process: effects of volatile fatty acids. Biotechnol. Bioeng. 82, 791–801. doi: 10.1002/bit.10628
Qatibi, A. I., Cayol, J., and Garcia, J. (1991a). Glycerol and propanediols degradation by Desulfovibrio alcoholovorans in pure culture in the presence of sulfate, or in syntrophic association with Methanospirillum hungatei. FEMS Microbiol. Lett. 85, 233–240. doi: 10.1111/j.1574-6968.1991.tb04729.x
Qatibi, A. I., Nivière, V., and Garcia, J. L. (1991b). Desulfovibrio alcoholovorans sp. nov., a sulfate-reducing bacterium able to grow on glycerol, 1,2- and 1,3-propanediol. Arch. Microbiol. 155, 143–148. doi: 10.1007/BF00248608
Riedl, S., Brown, R. K., Klöckner, S., Huber, K. J., Bunk, B., Overmann, J., et al. (2017). Successive conditioning in complex artificial wastewater increases the performance of electrochemically active biofilms treating real wastewater. ChemElectroChem 4, 3081–3090. doi: 10.1002/celc.201700929
Selembo, P. A., Perez, J. M., Lloyd, W. A., and Logan, B. E. (2009). High hydrogen production from glycerol or glucose by electrohydrogenesis using microbial electrolysis cells. Int. J. Hydrogen Energy 34, 5373–5381. doi: 10.1016/j.ijhydene.2009.05.002
Sharma, Y., Parnas, R., and Li, B. (2011). Bioenergy production from glycerol in hydrogen producing bioreactors (HPBs) and microbial fuel cells (MFCs). Int. J. Hydrogen Energy 36, 3853–3861. doi: 10.1016/j.ijhydene.2010.12.040
Tremouli, A., Vlassis, T., Antonopoulou, G., and Lyberatos, G. (2016). Anaerobic degradation of pure glycerol for electricity generation using a MFC: the effect of substrate concentration. Waste Biomass Valorizat. 7, 1339–1347. doi: 10.1007/s12649-016-9498-0
Wang, Q., Garrity, G. M., Tiedje, J. M., and Cole, J. R. (2007). Naive Bayesian classifier for rapid assignment of rRNA sequences into the new bacterial taxonomy. Appl. Environ. Microbiol. 73, 5261–5267. doi: 10.1128/AEM.00062-07
Wang, V. B., Sivakumar, K., Yang, L., Zhang, Q., Kjelleberg, S., Loo, S. C. J., et al. (2015). Metabolite-enabled mutualistic interaction between Shewanella oneidensis and Escherichia coli in a co-culture using an electrode as electron acceptor. Sci. Rep. 5:11222. doi: 10.1038/srep11222
Yates, M. D., Kiely, P. D., Call, D. F., Rismani-Yazdi, H., Bibby, K., Peccia, J., et al. (2012). Convergent development of anodic bacterial communities in microbial fuel cells. ISME J. 6, 2002–2013. doi: 10.1038/ismej.2012.42
Yazdani, S. S., and Gonzalez, R. (2007). Anaerobic fermentation of glycerol: a path to economic viability for the biofuels industry. Curr. Opin. Biotechnol. 18, 213–219. doi: 10.1016/j.copbio.2007.05.002
Keywords: concentration pulse method, bioelectrochemical system, microbial fuel cell, biofilm kinetics, anaerobic digestion, glycerol utilization
Citation: Kubannek F, Moß C, Huber K, Overmann J, Schröder U and Krewer U (2018) Concentration Pulse Method for the Investigation of Transformation Pathways in a Glycerol-Fed Bioelectrochemical System. Front. Energy Res. 6:125. doi: 10.3389/fenrg.2018.00125
Received: 27 August 2018; Accepted: 06 November 2018;
Published: 27 November 2018.
Edited by:
Boris Tartakovsky, National Research Council Canada (NRC-CNRC), CanadaReviewed by:
Miriam A. Rosenbaum, Leibniz-Institut für Naturstoff-Forschung und Infektionsbiologie, Hans Knöll Institut, GermanyYong Xu, Nanjing Forestry University, China
Copyright © 2018 Kubannek, Moß, Huber, Overmann, Schröder and Krewer. This is an open-access article distributed under the terms of the Creative Commons Attribution License (CC BY). The use, distribution or reproduction in other forums is permitted, provided the original author(s) and the copyright owner(s) are credited and that the original publication in this journal is cited, in accordance with accepted academic practice. No use, distribution or reproduction is permitted which does not comply with these terms.
*Correspondence: Ulrike Krewer, u.krewer@tu-braunschweig.de