Elaboration of PCBM Coated P3HT Nanoparticles: Understanding the Shell Formation
 Abigail Palacio Valera1
  Christophe Schatz2 Emmanuel Ibarboure2
  Takaya Kubo3
  Hiroshi Segawa3
  Sylvain Chambon1*
- 1IMS, CNRS, UMR 5218, Bordeaux INP, ENSCBP, Univ. Bordeaux, Talence, France
- 2LCPO, CNRS, UMR 5629, Bordeaux INP, ENSCBP, Univ. Bordeaux, Talence, France
- 3Research Center for Advanced Science and Technology RCAST, University of Tokyo, Tokyo, Japan
Solvent displacement, or nanoprecipitation, is a well-known process to develop colloidal dispersions in water. Using two successive and selective nanoprecipitation steps, we developed a method to generate [6,6]-phenyl-C61-butyric acid methyl ester (PCBM) shell on poly(3-hexylthiophene) (P3HT) core nanoparticles (P3HT@PCBM). We report herein on the understanding of the shell formation during this process. Using several techniques (dynamic light scattering, zeta-potential, photoluminescence), we evidenced that after the first solvent displacement with dimethyl sulfoxide (DMSO), the PCBM molecules still dissolved in the medium are already in close interaction with the P3HT nanoparticles (NP). Such proximity of the P3HT core with PCBM molecules in the DMSO dispersion explains why PCBM aggregates around the nanoparticles during the second solvent displacement with water. A fast electron transfer from P3HT to PCBM was identified by transient absorption spectroscopy, confirming the core-shell morphology even for low PCBM concentration. This study opens the route for the development of well-defined nano-objects dispersed in water for fabrication of organic photovoltaic devices with eco-friendly processes.
Introduction
Organic photovoltaic devices present numerous advantages which make them useful for specific markets: flexibility and light weight for portable applications; semi-transparency and shape tuning for integration in building and aesthetic feature (Berny et al., 2015). The development of new chemical structure for both donor and acceptor lead to power conversion efficiencies up to 13% for single-junction solar cells (Zhao et al., 2017; Baran et al., 2018). Organic photovoltaic modules present also interesting properties in terms of impact on the eco-systems such as a short energy pay-back time (Espinosa et al., 2011) and low carbon footprint (Lizin et al., 2013).
However, this technology still requires aromatic and/or chlorinated solvents in the organic semi-conductors ink formulations to get high performances. Although an improvement on the environmental impact is achieved by the substitution of chlorinated solvents by xylene (Schmidt-Hansberg et al., 2012; Czolk et al., 2016) the use of such aromatic solvents still present a non-negligible impact on the working conditions and the environment.
An alternative to those solvent is the formulation of water-based colloidal inks for organic photovoltaics. Kietzke, Landfester et al. started developing this strategy in 2002 (Landfester et al., 2002; Kietzke et al., 2003, 2004). In these studies, the mini-emulsion technique was adapted and optimized to generated different kind of colloidal solutions of organic semi-conductors. A donor polymer PFB (poly(9,9-dioctylfluorene-co-N,N-bis(4-butylphenyl)-N,N-diphenyl-1,4-phenylenediamine)) and an acceptor polymer F8BT(poly(9,9-dioctylfluorene-co-benzothiadiazole)) were used to form the bulkheterojunction (BHJ). Although the devices fabricated presented low performances (up to 4% at 380 nm in the external quantum efficiency; Kietzke et al., 2004), they developed the first organic photovoltaic device using water-based colloidal inks. Since then, the several groups continued working on this idea and 2 and 2.5% were achieved in 2013–2014 using P3HT:PCBM (Gehan et al., 2014) and P3HT:ICBA (indene-C60 bisadduct) (Ulum et al., 2013) donor-acceptor active layer, respectively. This technique was recently applied to other donor materials (Holmes et al., 2016) and an efficiency as high as 3.8% was obtained with low band-gap donor copolymer PBDTTPD (poly[(benzo[1,2-b:4,5-b']dithiophene)-alt-(4H-thieno[3,4-c]pyr- role-4,6(5H)-dione)]) using such water based inks (D'Olieslaeger et al., 2016). The solvent-displacement method also known as nanoprecipitation is another technique to prepare colloidal inks dispersed in aqueous or alcoholic media. It consists of mixing a solvent containing a solute with a large quantity of anti-solvent for the solute. The solvent and the anti-solvent need to be miscible and, depending on the mixing conditions (solvent/anti-solvent ratio, concentration, mixing time), this procedure, based on the supersaturation principle, can generate nanoparticles with monomodal size distribution (Ganachaud and Katz, 2005; Aubry et al., 2009; Couto et al., 2015). The formation of nanoparticles results from a nucleation and growth process where the nucleation rate is determined by the level of supersaturation. Once the nuclei reached a critical size determined by the balance between the free energy required to form the solid-liquid interface and the free energy released by creating a new volume, they can grow through capture of nearby solute molecules. A nucleation and aggregation mechanism has been also proposed under high supersaturation conditions (Aubry et al., 2009). The aggregation rate depends on the frequency of collision of nanoparticles and their stability (Lince et al., 2008). The nanoprecipitation has the advantage of developing surfactant-free colloidal dispersions. In 2014, Gartner et al. developed an organic photovoltaic device with 4% power conversion efficiency (PCE) using P3HT and ICBA as donor and acceptor, respectively. The active layer was cast on the substrate from a P3HT:ICBA colloidal dispersion in in alcoholic medium (ethanol or methanol) and an optimized thermal treatment was applied to allow the nanoparticle to merge. This fabrication step was shown to be necessary in order to form a dense active layer and to achieve high performances (Gärtner et al., 2014; Sankaran et al., 2016). This literature survey show the importance of the morphology control on the performances of nanoparticulate organic photovoltaic (NPOPV).
With the aim of controlling precisely the morphology of the nanoparticles generated by nanoprecipitation, we applied in a previous study the solvent displacement method to form P3HT@PCBM core-shell nanoparticles in two successive steps (Chambon et al., 2014). We showed that the addition of a large volume of DMSO in a tetrahydrofuran (THF) solution containing P3HT and PCBM allowed the nucleation and growth of P3HT nanoparticles while PCBM remained dissolved in the solvent mixture (DMSO:THF 9:1 v/v ratio). Then, the addition of water, an anti-solvent for both P3HT and PCBM, led to the precipitation of PCBM. Interestingly, we proved that the PCBM nucleated on the P3HT nano-particles during this fast process, generating a core-shell P3HT-PCBM nanostructure.
This article aims to investigate in more details the mechanism of formation of the PCBM shell. Using various techniques, we analyzed the nanoparticles at the different steps of formation of the shell. In order to study the growth of the shell, we used different concentrations of PCBM in a P3HT solution. The colloidal state of the nanoparticles was studied by dynamic light scattering (DLS) and zeta potential after the first and second solvent displacement. The photo-spectroscopic properties of the particles were also analyzed by steady-state photo-luminescence (PL), UV-visible spectroscopy and transient absorption spectroscopy (TAS) at different PBCM contents.
Materials and Methods
Materials
Regio-regular P3HT was provided by Solaris Chem Inc. A weight-average molecular weight (Mw) of 40.104 g/mol with a polydispersity index of 1.7 was determined by gel permeation chromatography calibrated with polystyrene standards. The regio-regularity was determined by H-NMR at 95%. PCBM was provided by Solaris Chem Inc. (purity: 99.5%).
Solvent Displacement Procedures
P3HT or P3HT:PCBM were first dissolved in THF and stirred for 24 h at 50°C in nitrogen filled glove box (O2 and H2O < 2 ppm). The concentration of P3HT (CP3HT) was kept constant at 0.5 mg. mL−1 while the PCBM concentration (CPCBM) was varied from 0.005 to 2 mg.mL−1. For the first solvent displacement (1st SD), 0.5 mL of the P3HT or P3HT:PCBM solution was transferred to a 6 mL vial and stirred at 50°C at 250 rpm for 5 min and then 4.5 mL of DMSO were rapidly injected with a 5 mL micropipette. For the second solvent displacement with water (2nd SD), 0.5 mL of the first dispersion generated with DMSO was transferred to a 6 mL vial, heated at 50°C and stirred at 250 rpm for 5 min. Then 4.5 mL of deionized water were rapidly injected with a 5 mL micropipette. For TAS experiments (see below), the second solvent displacement was performed in a 60 mL vial and inserting 45 mL of water in 5 mL of DMSO dispersion. The ultra-filtration technique using a regenerated cellulose membrane filter of 10 kDa was applied to concentrate the final dispersion in water and obtain sufficiently high optical densities for TAS experiments. Composite P3HT:PCBM nanoparticles were also generated from a single solvent displacement. P3HT and PCBM were dissolved in THF at a concentration of 0.5 mg mL−1 each. 0.5 mL of the THF solution was transferred into a 6 mL vial, stirred at 50°C at 250 rpm for 5 min and then 4.5 mL of deionized water were rapidly added with a 5 mL micropipette.
UV-Visible Spectroscopy
The dispersions were analyzed with a UV-visible spectrophotometer (SAFAS UV mc2) in double beam mode. Quartz cuvettes with 0.1 cm optical path were used for DMSO dispersions and 1 cm optical path for water dispersions. Spectra were recorded from 200 to 800 nm in steps of 2 nm and using an integration time of 1 s.
Photoluminescence Spectroscopy
Steady-state photoluminescence experiments were performed on a PTI (Photon Technology International) Quantmaster 40 setup with a Xenon arc lamp coupled with a monochromator for excitation and a photomultiplier detection system (Model 810/814). The excitation wavelength was set at 510 nm and emission spectra were recorded at 90° from 525 to 900 nm by step of 1 nm and using an integration time of 1 s. The excitation and emission slits were all set at 2 mm corresponding to a spectral resolution of 8 nm. Four-sided Quartz cuvettes with 1 cm optical path were used for these PL experiments. The different dispersions were diluted with their respective solvent (DMSO or water) to reach an optical density of 0.1 at 510 nm.
Size and Zeta-Potential Measurements
Hydrodynamic diameters of the nanoparticles were determined by dynamic light scattering using a Zetasizer Nano ZS from Malvern Instruments at a detection angle of 173°. Autocorrelation curves were averaged from 10 to 15 acquisitions depending on the intensity of the scattered signal. The cumulants method was used to determine the Z-average hydrodynamic diameter and the polydispersity index width (PDI width). Three measurements were performed for each sample.
Zeta potentials were determined with the same instrument using a dip cell for DMSO dispersions and clear disposable zeta cells for water dispersions. As the dispersions of the nanoparticles were in DMSO or water rich media, the Smoluchowski approximation was applied to derive the zeta potentials from electrophoretic mobilities. The temperature of the dispersion was set at 25°C. The refractive index and viscosity values of water:DMSO mixtures were taken from literature (LeBel and Goring, 1962). For THF:DMSO mixtures, the refractive indexes were calculated using the following equation:
where n1, n2, and n12 are the refractive index of solvent 1, solvent 2 and the mixture, respectively and ϕ1 and ϕ2 their volume fractions (Mehra, 2003).
Viscosities of THF:DMSO mixtures were calculated according to the Arrhenius equation:
where η1, η2, and η12 are the viscosity of solvent 1, solvent 2, and the mixture, respectively and x1 and x2 their mole fractions. For the determination of the zeta potential, the dielectric constant of the main solvent (90% in volume) was used: 46.4 for DMSO dispersions and 78.2 for water dispersions.
Atomic Force Miscroscopy (AFM)
AFM measurements were performed at room temperature in a dry state using a Multimode 8™ microscope (Veeco Instruments Inc.). Both topographic and phase images of individual particles were obtained in Tapping Mode using rectangular silicon cantilever (AC 160-TS, Atomic Force, Germany) with a spring constant of 26 N m−1, a resonance frequency lying in the 270–320 kHz range and a radius of curvature of <10 nm. Samples were prepared by casting at ambient temperature a drop (4 μL) of nanoparticle dispersions in water (prepared after the second solvent displacement). The dispersion was deposited onto freshly cleaved mica and allowed to dry under nitrogen flow during several minutes. The analysis of the sizes and shape (diameter, height, profile extraction) of the nanoparticles was performed using Gwyddion software (version 2.31).
Transient Absorption Spectroscopy (TAS)
Transient absorption (TA) measurements were carried out by a pump & probe method. The transient absorption spectra were measured on an optical cell made up of two quartz substrates separated by a 0.4 mm thick spacer, the entire inner space of which was filled with the colloidal dispersion. The optical cell was installed in a rotating cell holder. Pump laser pulses (wavelength: 550 nm) were generated with an OPA system (Light Conversion TOPAS-C) excited by 800 nm subpicosecond laser pulses (a pulse width of ~120 fs) from an amplified Ti:sapphire laser system (Spectra Physics Hurricane), whose repetition rate is 1.0 kHz, and a pump beam intensity was kept as low as 50 mWcm−2 to avoid sample degradation. Probe white light continuum (WLC) pulses were generated by focusing the 800 nm laser pulses onto a 3 mm thick sapphire crystal plate. The probe WLC beam was split into two beams by using a beam splitter, and focused onto the cell. One of which was excited by the pump laser pulses, the other one was used as a reference. The transmitted probe (Ipump) and reference (Iref) beams were dispersed using a monochromator (f = 250 mm, an entrance slit width = 0.5 mm) installed with a holographic grating (150 grs/mm, λblaze = 700 nm), and were detected with a 1,024-pixel InGaAs CCD array detector. The optical density change, ΔOD, is calculated by −log[Tpump(λ)/Tno−pump(λ)], where Tpump(λ) (= Ipump(λ)/Iref(λ)) and Tno−pump(λ) (= Ipump(λ)/Iref(λ)) are the transmitted probe beam signals obtained with pump beam excitation and without excitation, respectively. An instrument response function of the TAS system is ~250 fs. Optical Kerr effect of a methanol solution filled in the optical cell was measured with the TAS system, and no noticeable chirp effect was observed in the wavelength region ranging from 900 to 1,350 nm. Therefore, no chirp correction was performed on all the TA spectra.
Results and Discussions
First Solvent Displacement With DMSO: Generation of the Core
Eight solutions of P3HT in THF at 0.5 mg.mL−1 with PCBM concentrations varying from 0 to 2 mg.mL−1 were prepared. A first solvent displacement (SD) was performed by addition of DMSO in the THF solutions and dynamic light scattering (DLS) was used to characterize the resulting nanoparticle dispersions. The Z-average hydrodynamic diameter, zeta-potential and PDI width values are reported in Table 1.
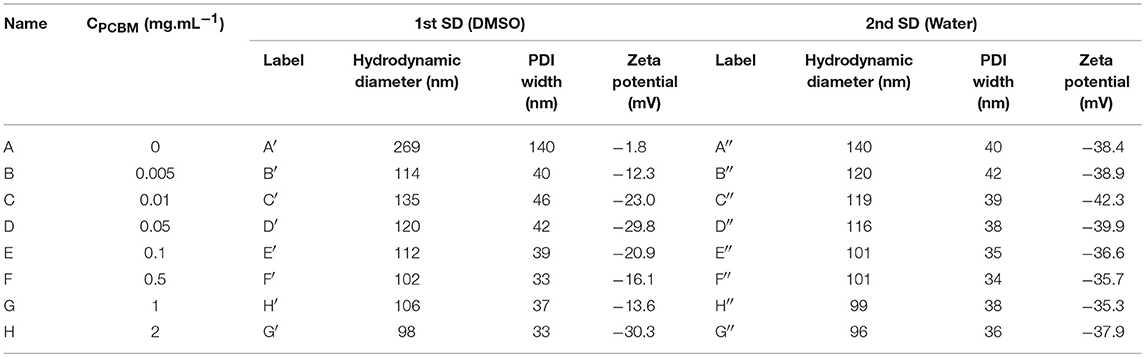
Table 1. Average hydrodynamic diameters, PDI width, and zeta potentials of the P3HT/PCBM dispersions obtained after the first solvent displacement (SD) with DMSO and after the second SD with water.
When PCBM is absent from the initial THF solution (A), we observe that the nanoparticle dispersion is not very stable after the first SD with DMSO. The average hydrodynamic diameter of the particles generated is around 269 nm and the zeta potential is close to zero (−1.8 mV). The PDI width is high, around 140 nm, indicating that the size distribution in the colloidal dispersion A is large. No charge is present at the surface of the nanoparticles which explains the poor stability of the dispersion over time. This result is somewhat expected as the P3HT is neutral and that there is no ion in the solvent mixture to provide stabilization. Hence, the large diameter and PDI width can be explained by the aggregation of several P3HT NPs.
When PCBM is added to the initial THF solution, even in very small quantity compared to P3HT (B: PCBM/P3HT 1/100 w/w ratio), the dispersion behaves differently after the 1st SD with DMSO. The average hydrodynamic diameter of the particles in B′ is around 114 nm and the PDI width decreases down to 40 nm. We observe that the dispersion is also more stable over time and a zeta potential of −12.3 mV is measured. These results indicate that the NPs become charged under these conditions and that the electrostatic repulsion is sufficient to stabilize the dispersion. The low PDI width confirms the absence of any aggregation phenomena. By increasing the PCBM concentration (dispersions C′ to H′, Table 1), the zeta potential decreases down to −30 mV and then varies between −14 and −30 mV. The average diameter of the NP remains stable between 98 and 135 nm and the PDI width between 33 and 46 nm. The further increase of the PCBM concentration in the solution does not change significantly the zeta potential, the average size and size distribution of the NPs and the dispersions are stable over time.
In order investigate the proximity of P3HT and PCBM in the different DMSO dispersions, we studied them by UV-visible and fluorescence spectroscopy. As expected, the UV-visible spectra of the different dispersions in DMSO (Supplementary Figure 1) show an increasing absorption of PCBM (centered at 330 nm) with increasing PCBM concentration. The photoluminescence (PL) spectra of the different dispersions in DMSO are presented in Figure 1A. When PCBM is absent, the maximum PL yield is around 1.2 × 10⁶ counts per second (cps) at 650 nm. By increasing the concentration of PCBM up to 0.5 mg.mL−1 (P3HT:PCBM 1:1 w/w ratio), the PL intensity does not decrease and remains between 1.15 × 10⁶ and 1.4 × 10⁶ cps (Table 2 and Figure 1C). No fluorescence quenching is observed for such compositions (A′, B′, C′, D′, E′, and F′) indicating that no charge transfer occur between the P3HT and the PCBM. It indicates that the PCBM was not trapped in the P3HT NPs during the SD with DMSO and that it remains mostly dissolved in the solvent mixture when PCBM concentration stays below 0.5 mg.mL−1. This phenomenon can be explained by considering the solubility of PCBM in THF:DMSO (1:9) mixture. Indeed, in our previous report, a pure PCBM solution in THF was prepared and a solvent displacement with DMSO was performed. For the concentration used (up to 0.5 mg.mL−1), no nanoparticle formation was evidenced by DLS which means that the PCBM molecules are still soluble in this condition (Chambon et al., 2014).
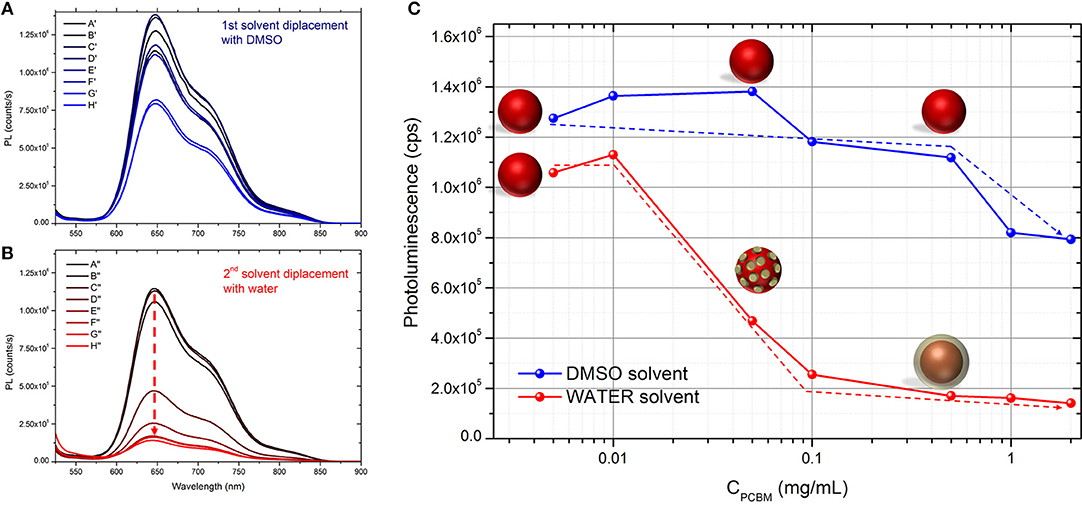
Figure 1. Photoluminescence of the different dispersions generated (A) after the first solvent displacement with DMSO and (B) after the second solvent displacement with water. (C) Evolution of the PL yield at 650 nm upon increasing the concentration of PCBM in the initial solution. Schematic representation of the morphology of the nanoparticles. The dashed arrows serve as guideline to illustrate the quenching rate of the photoluminescence in the different conditions.
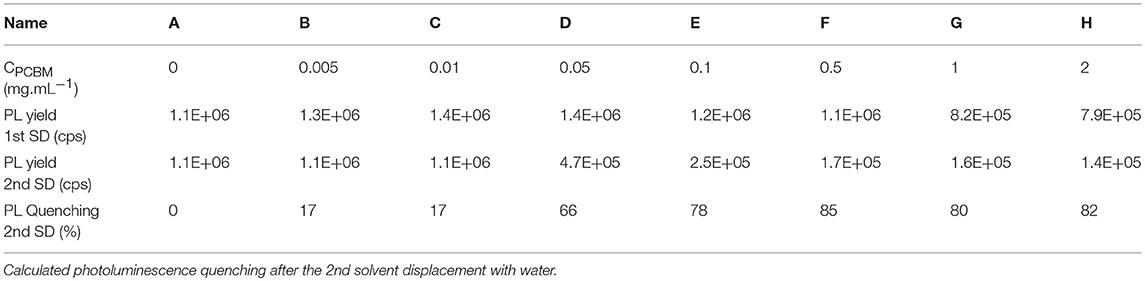
Table 2. Photoluminescence yield at 650 nm of the different dispersions after the 1st and the 2nd solvent displacements in counts per second (cps).
By increasing PCBM concentration further (G′ and H′), the quenching of fluorescence (~25%) of P3HT suggests that some PCBM molecules were trapped leading to P3HT:PCBM composite particles. In this range of concentration (0.1 and 0.2 mg.mL−1 in DMSO:THF mixture), the PCBM is approaching its solubility limit in DMSO (0.2 mg.mL−1) (Machui et al., 2012) which then becomes an anti-solvent. This can explain that some of the PCBM molecules have probably aggregated during the 1st solvent displacement and found themselves trapped in the P3HT NPs (Vitale and Katz, 2003).
The formation of charges at the NP surface at increasing PCBM concentrations cannot be explained by the presence of PCBM inside the P3HT nanoparticles and the formation of composite P3HT:PCBM particles. Nevertheless, the presence of dissolved PCBM in the media (DMSO:THF, 9:1 v/v) is at the origin of the presence of charges at the surface of P3HT NPs. This result suggests that PCBM interacts with the P3HT dispersion in the DMSO. One can suggest that PCBM molecules are adsorbed at the surface of the P3HT NP but they are not close enough for the fast electron transfer from P3HT to PCBM to occur. However, an acid-base-like reaction is likely to occur between the P3HT particle surface and the surrounding PCBM molecules, resulting in a charge transfer. Such charging phenomenon in apolar solvent has already been observed in polystyrene (PS) and poly(methyl methacrylate) (PMMA) dispersions with non-ionic surfactant like Span 85 (Guo et al., 2013). Not only these results show that PCBM is able to stabilize the dispersion such as a surfactant, but it also indicates that even before the 2nd solvent displacement with water PCBM molecules are in close interaction with the P3HT nanoparticles.
Second Solvent Displacement With Water: Generation of the Shell
After the second SD with deionized water, the zeta potential of the NPs lies in the same range of values, between −35 and −43 mV for all PCBM concentrations. These values are high enough to enable strong repulsion between the particles and give rise to a stable dispersion. The appearance of charges at the particles surfaces probably arises from the specific adsorption of hydroxide ions through dipolar or hydrogen bonding interaction with the atoms of hydrogen of the highly ordered interfacial water (Gacek and Berg, 2015). In water, the dispersion based on P3HT only (A″) is found to be stable and the average hydrodynamic diameter considerably decreases compared to A′ (Table 1). Such a decrease in size can be explained by the breaking of nanoparticle aggregates, as evidenced by the decrease of the PDI width down to 40 nm. Indeed, as mentioned previously, neither steric nor electrostatic mechanism can take place for P3HT nanoparticles in DMSO (A′). When the DMSO is replaced by water during the second solvent displacement, the appearance of charges at the surface of the NPs causes their repulsion and their de-aggregation. As a consequence, the average diameter and PDI width decrease.
The UV-visible and photoluminescence spectra of the different dispersions after the 2nd SD were acquired (Supplementary Figure 1 and Figure 1B, respectively). As expected, the PL of dispersion A″ (P3HT only) is identical to A′ indicating that the solvent displacement (from DMSO to water) does not change the PL of the pure P3HT-based particles (Table 2). The evolution of the photoluminescence yield at 650 nm against the concentration of PCBM is represented in the Figure 1C. At low PCBM concentrations (B″ and C″), one can observe a slight quenching of the PL, about 17% indicating that the PCBM is close enough to the P3HT surface to enable a low but still significant the electron transfer from P3HT to PCBM thus evidencing that the PCBM has aggregated to some extent around the P3HT NPs. By further increasing the PCBM concentration, D″ and E″, the quenching is stronger, 66 and 78%, respectively. For dispersions F″, G″, and H″ the fluorescence quenching stabilizes between 80 and 85%. Based on these results it is possible to determine that a PCBM concentration of 0.1 mg.mL−1 is high enough to achieve the highest quenching of fluorescence. This concentration probably corresponds to a full coverage of the P3HT NPs by a layer of PCBM. The PL quenching of dispersion D″ (10:1 P3HT:PCBM ratio) is intermediate (66%) which indicates that the PCBM shell may not cover entirely the P3HT NPs at such low PCBM concentration (0.05 mg.mL−1). AFM images were recorded for two representative dispersions: A″ corresponding to pure P3HT NPs in water and E” corresponding to P3HT-PCBM NPs prepared with a PCBM concentration of 0.1 mg/mL (Figure 2). For the dispersion A″, AFM images reveal that P3HT NPs have a rather homogeneous spherical morphology. In the case of dispersion E″, the core-shell morphology of the nanoparticles is clearly identified. One can clearly observe the outer shell in the AFM topographic image as well as on the extracted profile (Figure 2b). These results confirm that P3HT@PCBM core-shell morphology was successfully achieved using successive and selective solvent displacements. A schematic representation of the evolution of the nanoparticles in the different dispersions is proposed on Figure 1C.
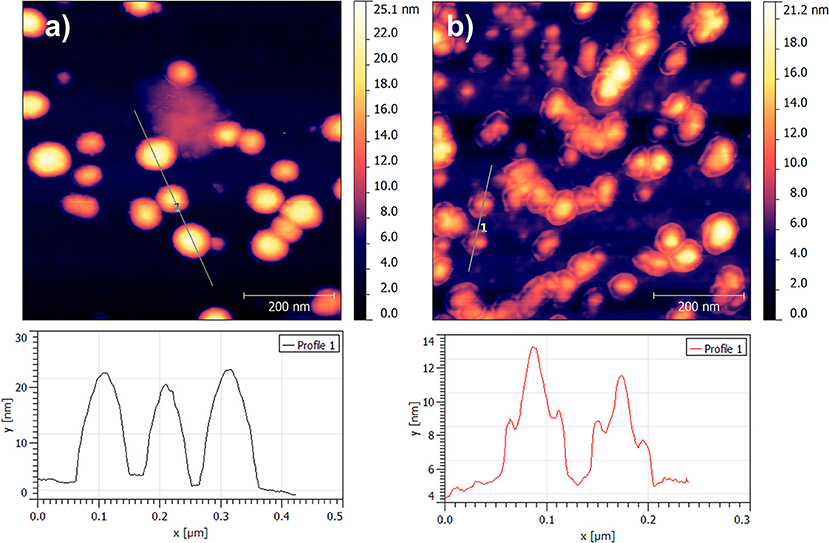
Figure 2. AFM topographic images 700 × 700 nm2 of nanoparticles issued from dispersion A″ (a) and dispersion E″ (b).
It is interesting to notice that the particle size is significantly decreased from the dispersion A″ (140 nm) to the dispersion H″ (96 nm) which emphasizes that a higher PCBM concentration does not lead to a thicker shell but rather it improves the overall colloidal stability (Table 1). The formation of PCBM around P3HT NPs is in agreement with a nucleation and growth mechanism as described by Vitale and Katz on liquid-liquid nucleation and spontaneous generation of nanoparticles, i.e., nanoprecipitation (Vitale and Katz, 2003) When THF/DMSO mixtures containing P3HT NPs and PCBM become supersaturated with water, PBCM nuclei can form and grow by capturing the nearest nuclei and/or solute molecules. One can suggest that during this process, the PCBM aggregates around the P3HT NPs which act as nucleation points as well as separately during the nucleation step. As soon as the PCBM shell is formed, the specific adsorption of hydroxide ions by the PCBM probably creates some charges at the surface of the nanoparticles thus impeding further growth of the shell. As a matter of fact, we showed in our previous study that the precipitation of pure PCBM in water from DMSO solution lead to very small nanoparticles (49 nm of diameter), thus emphasizing that PCBM/liquid interface is well-stabilized in DMSO:water mixture (Chambon et al., 2014). As a result, increasing the PCBM concentration in the solution does not lead to thicker PCBM shell around P3HT NPs but to stable dispersions containing both P3HT@PCBM core-shell NP and probably also some pure PCBM NPs, especially at high PCBM concentrations.
Transient Absorption Experiments on P3HT and P3HT:PCBM Nanoparticles
In order to correlate the morphology of the nanoparticles to the charge transfer dynamics, three dispersions were analyzed using transient absorption spectroscopy: dispersion A″ with only P3HT nanoparticles (P3HT), dispersion D″ with intermediate PL quenching (66%, P3HT@PCBM 10:1) and dispersion F″ with maximum PL quenching (85%, P3HT@PCBM 1:1). Additionally, we generated mixed P3HT:PCBM nanoparticles as a control (P3HT:PCBM). Such dispersion was fabricated using a single solvent displacement from THF to water and a 1:1 P3HT:PCBM ratio (See experimental section for details). An average diameter was determined around 96 nm and a photoluminescence quenching of 80% compared to P3HT. Guesquiere et al. showed that this fabrication method lead to composite particles which include crystalline nanodomains from both type: P3HT and PCBM (Hu et al., 2010). The remaining photoluminescence indicates that some domains are larger than the exciton diffusion length in P3HT (8–12 nm) (Shaw et al., 2008).
Figure 3 shows the photo-induced absorption (PIA) spectra of the fours dispersions just after photo-excitation (0ps). In the case of pure P3HT NP (Figure 3A, red), the photo-excitation leads to rapid formation of a broad band with main contributions at 1000, 1100, and 1200 nm. It has been reported in the literature that the singlet excitons and polarons in regio-regular P3HT absorb at 1,200 and 1,000 nm, respectively (Guo et al., 2009). The P3HT singlet exciton band seems to be blue-shifted (100 nm) compared to the value reported in the literature and appears to absorb mainly at 1,100 nm. This band can be shifted depending on the crystallinity of the P3HT films and purely amorphous P3HT (regio-random) shows an absorption band centered at 1,000 nm (Guo et al., 2009). The UV-visible spectra (Supplementary Figure 2) show that the vibronic bands of the P3HT in the particles are not as prominent as in thin films. Such result suggests that the P3HT crystallinity is lower in P3HT nanoparticles generated by nanoprecipitation than in thin films and can explain such shift. The P3HT positive polaron band (P3HT+, 1,000 nm) seems to be preferentially formed compared to the singlet exciton (P3HT*, 1,100 nm). Such effect has been observed when the excitation pulse intensity increases. At such high density of photons, the singlet exciton-exciton annihilation process can occur and lead to the formation of the two polarons P3HT+ and P3HT− (Guo et al., 2009).
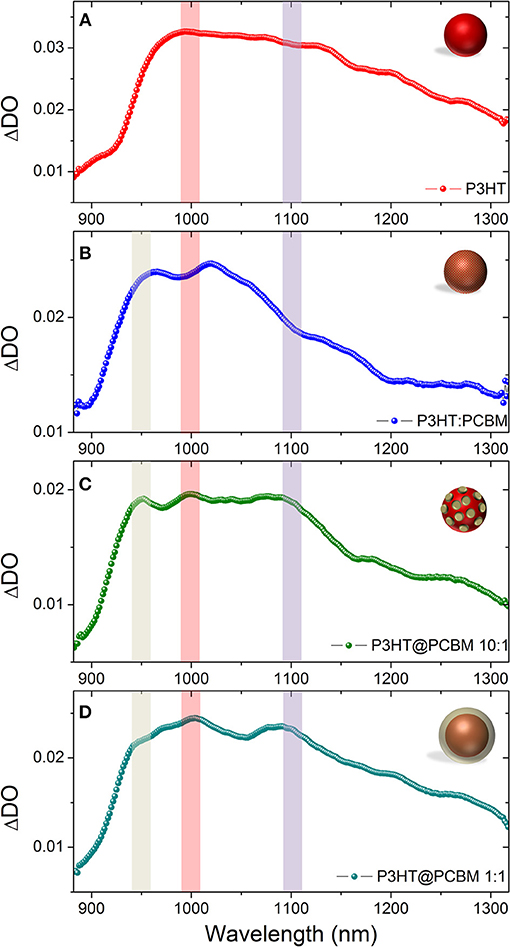
Figure 3. Photo-induced absorption spectrum (PIA) recorded just after photoexcitation (0 ps) for P3HT NP (A), composite P3HT:PCBM NP (B), core-shell P3HT@PCBM 10:1 (C), and core-shell P3HT@PCBM 1:1 (D). For easier visualization of the position of the absorption of the different transient species, we put guidelines for the eyes: PCBM− (gray), P3HT+ (red), and P3HT singlet exciton (purple).
For composite P3HT:PCBM nanoparticles (Figure 3B, blue), the PIA spectrum is different just after photo-excitation. As for P3HT NP, it shows a broad band centered at 1,000 nm. However, the P3HT singlet exciton band (1,100–1,200 nm) is not as intense as for P3HT NP and the main contribution comes from P3HT positive polaron (1,000 nm). The spectrum at 0ps presents also another band centered at 960 nm. This signal can be attributed to PCBM anion (PCBM−). In the literature such transient specie is generally observed at around 1,020 nm (Ohkita and Ito, 2011). The 60 nm blue-shift observed in our case can be attributed to the confinement and/or degree of aggregation of PCBM. These result indicate that, within the first picosecond after photo-excitation, an efficient charge transfer from P3HT to PCBM has occurred giving rise to the strong contribution of P3HT+ (1,000 nm) and PCBM− (960 nm). The P3HT:PCBM nanoparticle prepared by one step nanoprecipitation seems to generate a morphology in which P3HT and PCBM are in close interaction as the charge transfer occurs within the first picosecond. With these two kinds of dispersions (P3HT NP and composite P3HT:PCBM NP), the signatures of P3HT singlet excitons and polarons as well as PCBM anion have been clearly identified and the spectra of the P3HT@PCBM core-shell NP at the different stage of formation of the PCBM shell will be compared to those signatures.
For both P3HT@PCBM core-shell NP (Figures 3C,D), the spectra just after photo-excitation present the three contributions described previously: PCBM anion (960 nm), P3HT positive polaron (1,000 nm) and P3HT singlet exciton (1,100 nm). The presence of PCBM anion band indicates that efficient charge transfer has occurred, confirming the proximity of P3HT and PCBM. However, contrary to P3HT:PCBM composite NP, the contribution of the P3HT singlet exciton is still clearly visible. It indicates that the morphology is not as intimate as in P3HT:PCBM composite NP which is expected from a core-shell structure. It is interesting to note that, even at such low concentration of PCBM (Figure 3D), the PCBM molecules have aggregated around P3HT NP during the second solvent displacement as the PCBM anion signal is already observable. This result confirms that, in the DMSO solution, PCBM molecules must already be in close vicinity of P3HT NP.
Figure 4 shows the evolution of the PIA from 1 to 600 ps. The evolutions of the absorption bands corresponding to the PCBM− (960 nm) and to the P3HT singlet exciton (1,100 nm) were fitted using multiexponentional decay (See Supplementary Figures 3–6). In all cases, three time constants were extracted (Table 3).
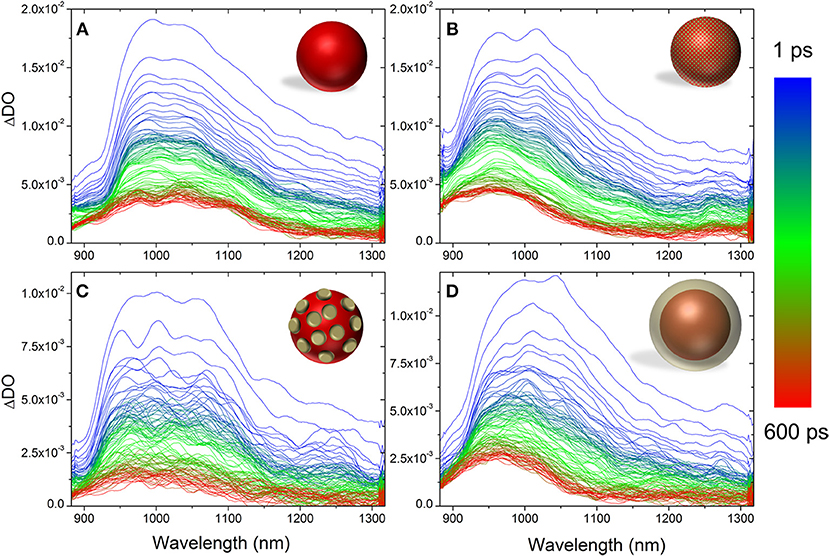
Figure 4. Evolution of the photo-induced absorption spectrum from 1 to 600 ps for P3HT NP (A), composite P3HT:PCBM NP (B), core-shell P3HT@PCBM 10:1 (C), and core-shell P3HT@PCBM 1:1 (D).
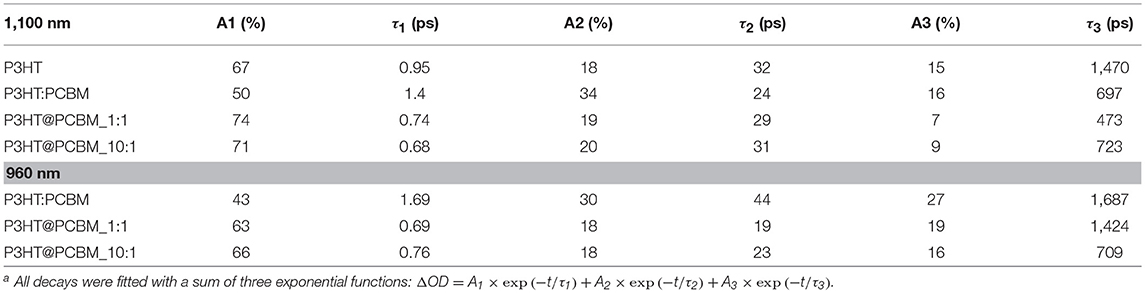
Table 3. Fitting parameters for transient absorption decays of P3HT, P3HT:PCBM, P3HT@PCBM 10:1 and P3HT:PCBM 1:1 at 1,100 and 960 nm (except for P3HT) a.
For pure P3HT NP (Figure 4A), the singlet exciton band decays quickly (τ1 = 0.95 ps), within the first picoseconds, which can be due to singlet-singlet annihilation process. After 50 ps, 30% of the initial absorbance is still detected and the time constants extracted are longer (τ2 = 32 ps, τ3 = 1,470 ps) suggesting that the singlet excitons are not in close proximity for the annihilation process to take place. Concerning the shape of the signals, one can notice that it does not evolve significantly from 1 to 600 ps. After 600 ps, one can still clearly observe the contribution of the P3HT singlet exciton (1,100 nm) and P3HT+ polaron (1,000 nm).
The evolution of the PIA spectrum of P3HT:PCBM composite particles is different (Figure 4B). The initial signals, from P3HT singlet exciton and PCBM anion, decay also in the first picoseconds with time constants of 1.4 and 1.69 ps, respectively. This first decay can also be attributed to the singlet-singlet annihilation process. After this initial decay, the transient absorption spectrum evolves differently from P3HT NP. From 1 to 600 ps, one can clearly observe the total disappearance of the singlet exciton signal at 1,100 nm and a remaining signal centered at 960 nm, which includes PCBM anion and P3HT positive polaron. Such result indicates that there is an efficient charge transfer from P3HT singlet state to PCBM, confirming the 80% photoluminescence quenching observed for P3HT:PCBM composite NP.
The PIA spectra of core-shell P3HT@PCBM 10:1 (Figure 4C) and 1:1 (Figure 4D) were also recorded up to 600 ps. Both samples present a very fast and strong decay of the signals within the first picoseconds (τ1 = 0.6–0.7 ps, Table 3) as for P3HT and P3HT:PCBM due to singlet-singlet annihilation process. In the case of P3HT@PCBM 1:1, the PIA signal evolves similarly to P3HT:PCBM composite NP. After 600 ps, the P3HT singlet exciton signal has totally vanished and one can only observe a remaining signal centered at 960 nm and corresponding to PCBM− and P3HT+. This signal present a long time constant (τ3 = 1,474 ps) suggesting that the positive and negative charges are delocalized and that their recombination is slow. This result suggests that the P3HT and PCBM domains are large enough which is in accordance with core-shell morphology.
For core-shell P3HT@PCBM 10:1, the evolution is slightly different. Although the three contributions (PCBM−, P3HT+, and P3HT*) were detected initially, they decay differently from P3HT@PCBM 1:1. When considering the P3HT singlet exciton signal, the longer time constant τ3 was determined around 723 ps for P3HT@PCBM 10:1 while it was slightly lower for P3HT@PCBM 1:1, about 473 ps. P3HT singlet exciton has not totally vanished after 600 ps, indicating that some exciton formed in the P3HT core did not find P3HT/PCBM interface to undergo electron transfer. The PCBM− signal (960 nm) presents also a shorter τ3 in P3HT@PCBM 10:1 than in P3HT@PCBM 1:1, 709 and 1424 ps, respectively. Such result suggests that the negative charge is not sufficiently delocalized and that the recombination of the negative and positive charges is faster than for P3HT@PCBM 1:1. Such result can be an indication that the PCBM shell around P3HT core is not continuous enough for the negative charge to be delocalized. Those results confirm the partial covering of the P3HT core by PCBM already suggested by the observation of a non-optimal quenching of the P3HT fluorescence.
Conclusions
Using multiple analysis techniques, we studied the mechanism of formation of PCBM shell during the two successive solvent displacements. The study of the zeta-potential of the P3HT NPs (core) in the DMSO showed that some charges appear at the surface while PCBM is still dissolved. It indicates that an interaction between the P3HT core and PCBM molecules exists in the DMSO dispersions. Such interaction stabilizes the NP dispersions. During the second solvent displacement with water, PCBM molecules aggregate around the P3HT core due to the initial proximity of the nanoparticles and the PCBM molecules, forming therefore the shell. Photoluminescence experiments showed that the transition from the P3HT core to the fully covered P3HT@PCBM NPs occurs even at low PCBM concentration (CPCBM = 0.1 mg mL−1, CP3HT = 0.5 mg mL−1). Transient absorption experiments evidenced that an efficient electron transfer occurs from the P3HT core to the PCBM shell with the identification of PCBM anion and P3HT positive polaron in the P3HT@PCBM at 1:1 mass ratio, confirming the core-shell morphology. Interestingly, such transient species are also detected for lower concentration of PCBM (CPCBM = 0.05 mg mL−1, CP3HT = 0.5 mg mL−1), highlighting that the PCBM aggregates around the P3HT core even at very low concentration. These results confirm that PCBM molecules are in close interaction with P3HT core in the DMSO dispersion. This study highlights that the nanoprecipitation performed in successive steps is a powerful method to design organic semi-conductor nanoparticles with specific shapes. It opens some new possibility to develop colloidal water-based inks with well-defined nanoparticle morphologies for organic photovoltaics.
Author Contributions
SC and CS designed the study. AP prepared the different colloidal dispersions. AP and CS characterized the colloidal dispersions by dynamic light scattering and zeta-potential. AP and SC performed the photoluminescence experiments. AFM imaging of NPs was performed by EI. SC and TK performed the Transient Absorption Spectroscopy experiments under the supervision of HS. SC coordinated the study. All the authors contributed to the manuscript.
Funding
This work was supported by Univ. Bordeaux, Idex and CNRS through PEPS NPcoreshell no. 130409.A80 project. We would also like to acknowledge CNRS and RCAST (University of Tokyo) for the LIA NextPV through which this project was developed. SC traveling grant to Japan was supported by LabEx AMADEus (ANR-10-LABX-42) in the framework of IdEx Bordeaux (ANR-10-IDEX-03-02)—the Investissements d'Avenir programme of the French Government, managed by the French National Research Agency (Agence Nationale de la Recherche). This work was also supported as part of the International Joint Research Program for Innovative Energy Technology funded by the Ministry of Economy, Trade and Industry (METI), Japan.
Conflict of Interest Statement
The authors declare that the research was conducted in the absence of any commercial or financial relationships that could be construed as a potential conflict of interest.
Acknowledgments
We would like to specially thank Dr. Jean-François Guillemoles and Pr. Yoshitaka Okada for the coordination of the LIA NextPV.
Supplementary Material
The Supplementary Material for this article can be found online at: https://www.frontiersin.org/articles/10.3389/fenrg.2018.00146/full#supplementary-material
References
Aubry, J., Ganachaud, F., Cohen Addad, J.-P., and Cabane, B. (2009). Nanoprecipitation of polymethylmethacrylate by solvent shifting:1. Boundar. Langmuir 25, 1970–1979. doi: 10.1021/la803000e
Baran, D., Gasparini, N., Wadsworth, A., Tan, C. H., Wehbe, N., Song, X., et al. (2018). Robust nonfullerene solar cells approaching unity external quantum efficiency enabled by suppression of geminate recombination. Nat. Commun. 9:2059. doi: 10.1038/s41467-018-04502-3
Berny, S., Blouin, N., Distler, A., Egelhaaf, H.-J., Krompiac, M., Lohr, A., et al. (2015). Solar trees: first large-scale demonstration of fully solution coated, semi-transparent, flexible organic photovoltaic modules. Adv. Sci. 3, 1–7. doi: 10.1002/advs.201500342
Chambon, S., Schatz, C., Sébire, V., Pavageau, B., Wantz, G., and Hirsch, L. (2014). Organic semiconductor core–shell nanoparticles designed through successive solvent displacements. Mater. Horiz. 1, 431–438. doi: 10.1039/C4MH00021H
Couto, R., Chambon, S., Aymonier, C., Mignard, E., Pavageau, B., Erriguible, A., et al. (2015). Microfluidic supercritical antisolvent continuous processing and direct spray-coating of poly(3-hexylthiophene) nanoparticles For OFET devices. Chem. Commun. 51, 1008–1011. doi: 10.1039/C4CC07878K
Czolk, J., Landerer, D., Koppitz, M., Nass, D., and Colsmann, A. (2016). Highly efficient, mechanically flexible, semi-transparent organic solar cells doctor bladed from non-halogenated solvents. Adv. Mater. Technol. 1:1600184. doi: 10.1002/admt.201600184
D'Olieslaeger, L., Pirotte, G., Cardinaletti, I., D'Haen, J., Manca, J., Vanderzande, D., et al. (2016). Eco-friendly fabrication Of PBDTTPD:PC71BM solar cells reaching A PCE Of 3.8% using water-based nanoparticle dispersions. Org. Electron. 42, 42–46. doi: 10.1016/j.orgel.2016.12.018
Espinosa, N., García-Valverde, R., Urbina, A., and Krebs, F. C. (2011). A life cycle analysis of polymer solar cell modules prepared using roll-to-roll methods under ambient conditions. Solar Energy Mater. Solar Cell 95, 1293–1302. doi: 10.1016/j.solmat.2010.08.020
Gacek, M. M., and Berg, J. C. (2015). The role of acid–base effects on particle charging in apolar media Adv. Colloid Interface Sci. 220, 108–123. doi: 10.1016/j.cis.2015.03.004
Ganachaud, F., and Katz, J. L. (2005). Nanoparticles and nanocapsules created using the ouzo effect: spontaneous emulsification as an alternative to ultrasonic and high-shear devices. ChemPhysChem 6, 209–216. doi: 10.1002/cphc.200400527
Gärtner, S., Christmann, M., Sankaran, S., Röhm, H., Prinz, E.-M., Penth, F., et al. (2014). Eco-friendly fabrication of 4% efficient organic solar cells from surfactant-free P3HT:ICBA nanoparticle dispersions. Adv. Mater. 26, 6653–6657. doi: 10.1002/adma.201402360
Gehan, T. S., Bag, M., Renna, L., A, Shen, X., Algaier, D. D., Lahti, P. M., et al. (2014). Multiscale active layer morphologies for organic photovoltaics through self-assembly of nanospheres. Nano Lett. 14, 5238–5243. doi: 10.1021/nl502209s
Guo, J., Ohkita, H., Benten, H., and Ito, S. (2009). Near-IR femtosecond transient absorption spectroscopy of ultrafast polaron and triplet exciton formation in polythiophene films with different regioregularities. J. Am. Chem. Soc. 131, 16869–16880. doi: 10.1021/ja906621a
Guo, Q., Lee, J., Singh, V., and Behrens, S. H. (2013). Surfactant mediated charging of polymer particles in a nonpolar liquid. J. Colloid Interface Sci. 392, 83–89. doi: 10.1016/j.jcis.2012.09.070
Holmes, N. P., Marks, M., Kumar, P., Kroon, R., Barr, M. G., Nicolaidis, N., et al. (2016). Nano-pathways: bridging the divide between water-processable nanoparticulate and bulk heterojunction organic photovoltaics. Nano Energy 19, 495–510. doi: 10.1016/j.nanoen.2015.11.021
Hu, Z., Tenery, D., Bonner, M. S., and Gesquiere, A. J. (2010). Correlation between spectroscopic and morphological properties of composite P3HT/PCBM nanoparticles studied by single particle spectroscopy. J. Luminescen. 130, 771–780. doi: 10.1016/j.jlumin.2009.11.031
Kietzke, T., Neher, D., Kumke, M., Montenegro, R., Landfester, K., and Scherf, U. (2004). A nanoparticle approach to control the phase separation in polyfluorene photovoltaic devices Macromolecules 37, 4882–4890. doi: 10.1021/ma049625y
Kietzke, T., Neher, D., Landfester, K., Montenegro, R., Güntner, R., and Scherf, U. (2003). Novel approaches to polymer blends based on polymer nanoparticles. Nat. Mater. 2, 408–412. doi: 10.1038/nmat889
Landfester, K., Montenegro, R., Scherf, U., Güntner, R., Asawapirom, U., Patil, S., et al. (2002). Semiconducting polymer nanospheres in aqueous dispersion prepared by a miniemulsion process Adv. Mater. 14, 651–655. doi: 10.1002/1521-4095(20020503)14:9<651::AID-ADMA651>3.0.CO;2-V
LeBel, R. G., and Goring, D. A. I. (1962). Density, viscosity, refractive index, and hygroscopicity of mixtures of water and dimethyl sulfoxide. J. Chem. Eng. Data 7, 100–101. doi: 10.1021/je60012a032
Lince, F., Marchisio, D. L., and Barresi, A. A. (2008). Strategies to control the particle size distribution of poly-ε-caprolactone nanoparticles for pharmaceutical applications. J. Colloid Interface Sci. 322, 505–515. doi: 10.1016/j.jcis.2008.03.033
Lizin, S., Van Passel, S., De Schepper, E., Maes, W., Lutsen, L., Manca, J., et al. (2013). Life cycle analyses of organic photovoltaics: a review. Energ. Environ. Sci. 6, 3136–3149. doi: 10.1039/c3ee42653j
Machui, F., Langner, S., Zhu, X., Abbott, S., and Brabec, C. J. (2012). Determination of the P3HT:PCBM solubility parameters via A binary solvent gradient method: impact of solubility on the photovoltaic performance. Solar Energy Mater. Solar Cell 100, 138–146. doi: 10.1016/j.solmat.2012.01.005
Mehra, R. (2003). Application of refractive index mixing rules in binary systems of hexadecane and heptadecane withn-alkanols at different temperatures. J. Chem. Sci. 115, 147–154. doi: 10.1007/BF02716982
Ohkita, H., and Ito, S. (2011). Transient absorption spectroscopy of polymer-based thin-film solar cells Polymer 52, 4397–4417. doi: 10.1016/j.polymer.2011.06.061
Sankaran, S., Glaser, K., Gärtner, S., Rödlmeier, T., Sudau, K., Hernandez-Sosa, G., et al. (2016). Fabrication of polymer solar cells from organic nanoparticle dispersions by doctor blading or ink-jet printing. Org. Electron. 28, 118–122. doi: 10.1016/j.orgel.2015.10.011
Schmidt-Hansberg, B., Sanyal, M., Grossiord, N., Galagan, Y., Baunach, M., Klein, M. F. G., et al. (2012). Investigation of non-halogenated solvent mixtures for high throughput fabrication of polymer–fullerene solar cells. Solar Energy Mater Solar Cell 96, 195–201. doi: 10.1016/j.solmat.2011.09.059
Shaw, P. E., Ruseckas, A., and Samuel, I. D. W. (2008). Exciton diffusion measurements in poly(3-hexylthiophene). Adv Mater. 20, 3516–3520. doi: 10.1002/adma.200800982
Ulum, S., Holmes, N., Barr, M., Kilcoyne, A. L. D., Gong, B. B., Z.hou, X., et al. (2013). The role of miscibility in polymer: fullerene nanoparticulate organic photovoltaic devices. Nano Energy 2, 897–905. doi: 10.1016/j.nanoen.2013.03.009
Vitale, S. A., and Katz, J. L. (2003). Liquid droplet dispersions formed by homogeneous liquid–liquid nucleation: “the ouzo effect”. Langmuir 19, 4105–4110. doi: 10.1021/la026842o
Keywords: organic photovoltaic, nanoprecipitation, core-shell, solvent displacement, transient absorption spectroscopy, dynamic light scattering, zeta potential
Citation: Palacio Valera A, Schatz C, Ibarboure E, Kubo T, Segawa H and Chambon S (2019) Elaboration of PCBM Coated P3HT Nanoparticles: Understanding the Shell Formation. Front. Energy Res. 6:146. doi: 10.3389/fenrg.2018.00146
Received: 02 August 2018; Accepted: 19 December 2018;
Published: 21 January 2019.
Edited by:
Amlan J. Pal, Indian Association for the Cultivation of Science, IndiaReviewed by:
S. Sundar Kumar Iyer, Indian Institute of Technology Kanpur, IndiaFurong Zhu, Hong Kong Baptist University, Hong Kong
Copyright © 2019 Palacio Valera, Schatz, Ibarboure, Kubo, Segawa and Chambon. This is an open-access article distributed under the terms of the Creative Commons Attribution License (CC BY). The use, distribution or reproduction in other forums is permitted, provided the original author(s) and the copyright owner(s) are credited and that the original publication in this journal is cited, in accordance with accepted academic practice. No use, distribution or reproduction is permitted which does not comply with these terms.
*Correspondence: Sylvain Chambon, sylvain.chambon@ims-bordeaux.fr