Is Bitcoin the Only Problem? A Scenario Model for the Power Demand of Blockchains
 Michel Zade
 Jonas Myklebost
 Peter Tzscheutschler
 Ulrich Wagner
- Chair of Energy Economy and Application Technology, Department of Electrical and Computer Engineering, Technical University of Munich, Munich, Germany
When an author under the pseudonym Satoshi Nakamoto published the paper “Bitcoin: A Peer-to-Peer Electronic Cash System” in 2008, the first cryptocurrency using the new blockchain technology was introduced. Over the last decade, more than 1,000 different cryptocurrencies, such as Ethereum, Ripple, and Litecoin were developed and Bitcoin's currency had almost reached an equivalent value of 20,000 $/BTC. After recognizing the disrupting momentum that the blockchain technology generated, scientists started to develop blockchain use cases for the energy sector. However, the scientific literature so far offers only rough and incomplete estimations when questions about the current and future energy consumption of the Bitcoin network are raised. This paper introduces a new scenario model to estimate the mining power demand of the Bitcoin and Ethereum network. Six scenarios are developed on the basis of mining hardware efficiency and network parameter data. The results show that an increase of the mining hardware efficiency will only have a limited impact on the overall power demand of blockchain networks. Furthermore, the current power demand of the Ethereum network is in the range from 0.6 to 3 GW and therefore, is similar to the one of Bitcoin. In case of linear growth of the block difficulty and sigmoidal increase of the hardware efficiency until the year of 2025, the mining power demand for the Bitcoin blockchain will be approximately 8 GW. Furthermore, the model and the scenarios are adaptable to other cryptocurrencies that use the proof-of-work consensus algorithm to create scenarios for their future power demand.
1. Introduction
In 2008, an author under the pseudonym Satoshi Nakamoto published the idea of a decentralized cryptocurrency based on the blockchain technology (Nakamoto, 2008). The idea became reality in 2009 when the Bitcoin network was launched. Since then, and especially in 2017, when the Bitcoin price nearly reached 20,000 $/BTC, the blockchain technology witnessed an immense growth of attention. Many research papers have so far focused on the usability of the blockchain technology on the peer-to-peer (P2P) level, and in micro-grid energy markets (Sabounchi and Wei, 2017; Wang et al., 2017; Mengelkamp et al., 2018). However, since 2017, the public raises questions about the current, and future energy consumption, and environmental impact of the Bitcoin blockchain and other cryptocurrencies (altcoins) (DiChristopher, 2017; Popper, 2018). The scientific literature currently offers few, and incomplete models to answer these questions.
Economical models to estimate the energy consumption of blockchains were introduced in 2015. Hayes presented the first model that estimated the energy consumption of the Bitcoin network based on the marginal product and costs. The break-even points are based on the market prices, the difficulty of the network (an indicator for the computing power in the blockchain), and an average price for electricity (see Hayes, 2015). Vries argues that Hayes' model does not cover the investment costs of the mining hardware and concludes that only 60 % of the marginal product is used to cover the electricity demand (de Vries, 2018b). The latter approach is used on the website of the Digiconomist (de Vries, 2018a). At the end of 2017, the Bitcoin market price fluctuated heavily, whereas the Bitcoin block difficulty grew steadily (see Figure 1). As a result of this development, the aforementioned economical approaches can only offer an upper bound of the overall energy consumption of the network.
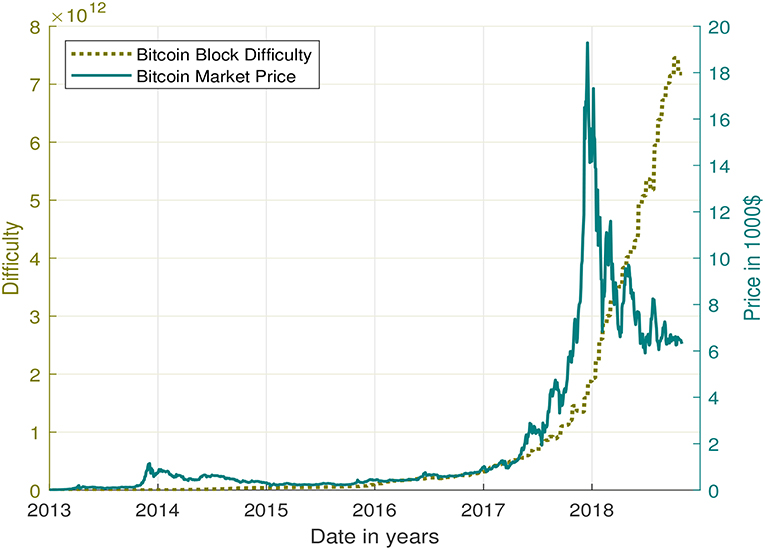
Figure 1. Development of the Bitcoin block difficulty and the market price from January 2013 until October 2018 (Blockchain Luxembourg S.A., 2018).
Hashrate-based, bottom-up models were first introduced by Malone and O'Dwyer (2014). The calculation of the Bitcoin power demand considered the Bitcoin block difficulty and the efficiency of the mining hardware (Malone and O'Dwyer, 2014). Malone et al. calculated only lower and upper bounds of the mining power demand with the most and least efficient hardware available in 2014 because of an unknown combination of the actual operating hardware. Mora et al. used the equations developed in the aforementioned model (Mora et al., 2018). However, the researchers picked for each mined block in 2017 an arbitrary hardware efficiency to calculate the power demand. The procedure was repeated 1,000 times, in order to reduce the impact of the randomness (Mora et al., 2018). Unfortunately, the latter approach does not consider the release date and the profitability of the randomly picked mining hardware. Therefore, the estimate for the power demand and the resulting CO2 emissions is most likely unrealistically high for 2017. Krause et al. presented a model that estimates the annual average power demand of Bitcoin, Ethereum, Litecoin, and Monero for the years of 2016, 2017, and partially 2018 by multiplying an average hardware efficiency to the network's hashrate (Krause et al., 2018). The network's hashrate is calculated by dividing the block difficulty by the mining rate.
Models, that estimate the future power demand of blockchains, have for the first time been introduced in 2018. Vries proposed the idea to forecast the future power demand by analyzing the supply chain of hardware manufacturers such as Bitmain (de Vries, 2018b). This approach relies on business secrets that are publicly not accessible and therefore, can hardly be objectively verified. Mora et al. fit a logistic curve to the adoption rates of 40 different technologies and use random samples of the 2017 mined blocks to estimate the future CO2 emissions (Mora et al., 2018). This approach neglects any future improvements of mining hardware. Furthermore, Mora et al. consider mining hardware that is uneconomic already in 2017, and fit the adoption rate of Bitcoin to household appliances that offer insufficient parallels.
In 2017 Vranken, and Giungato et al. published reviews summarizing the previously mentioned approaches but did not introduce new methods (Giungato et al., 2017; Vranken, 2017). Other estimates presented on the Internet claiming to estimate the energy consumption of blockchains often are not reproducible, and therefore are excluded from this scientific discussion.
In conclusion, a reliable hashrate-based scenario model for the future power demand of blockchains is a research gap in the scientific literature (de Vries, 2018b).
This paper presents a new hashrate-based, bottom-up model that allows the creation of scenarios for the future mining power demand of the Bitcoin, and Ethereum blockchain. The model is based on the past development of the mining hardware efficiency, and mining difficulty of the network and is applicable to other blockchains, that use the proof-of-work (POW) consensus algorithm. Section 2 describes the analysis of the network difficulty, mining hardware efficiency, and the setup of the scenarios. In section 3, the results of the model are presented and finally discussed in section 4.
2. Methods
This section describes the scenario model for the future mining power demand of the Bitcoin and Ethereum blockchain. The first subsection covers the block difficulty, and the second one the mining hardware efficiency. Each subsection is split in two parts: (a) a brief summary of the past evolution and (b) the created scenarios. The final subsection describes the combination of the two isolated scenarios into the final model for the future mining power demand.
2.1. Block Difficulty
The block difficulty is a network parameter in the Bitcoin and Ethereum blockchain that automatically adapts its value to the recent block mining rates of the blockchain. Therefore, the block difficulty can be used as an indicator for the computational power of the blockchain network. In order to create reasonable scenarios, it is crucial to understand the way the block difficulty changes.
2.1.1. Bitcoin Protocol
According to the Bitcoin protocol, the block mining rate shall stay constant at TBTC = 10 min/block. Every 2016 blocks TBTC,Adjust,Period = 2016 block, the block difficulty is automatically adjusted to make up for the deviations from the intended block mining rate of TBTC. Equation (1) shows the adjustment formula.
The block difficulty (dBTC) is calculated by multiplying the previous difficulty (dBTC,prev) with a correction factor. The correction factor is the quotient of the scheduled time TBTC × TBTC,Adjust,Period and the actual time to mine the last 2016 blocks tBTC,2016,blocks. Therefore, the block difficulty increases when the actual time tBTC,2016,blocks is smaller than the intended time TBTC × TBTC,Adapt,Period to mine the last 2016 blocks. Furthermore, the correction factor is limited to not fall below 25 %, and to not exceed 400% (Nakamoto and The Bitcoin Developers, 2012).
Figure 1 visualizes the development of the Bitcoin block difficulty and the market price from January 2013 to October 2018. Since the beginning of 2014 until October 2018, the difficulty shows an exponential growth. This growth correlated with the development of the Bitcoin price until December 2017. However, since January 2018 the Bitcoin price shows great fluctuations, whereas the network difficulty constantly rises (see Figure 1). Considering the adjustment formula of the mining difficulty in Equation (1) it can be concluded that the computing power added to the Bitcoin network has been exponentially growing since 2014.
While preparing this article from November 2018 until the end of December 2018, the Bitcoin block difficulty decreased for four consecutive 2-week-periods for the first time in Bitcoin history. This decrease coincides to a significant price drop from 6,400 to 3,200$ as of December 16, 2018. However in January 2019, the block difficulty has again increased for two consecutive 2-week-periods. These fluctuations make it difficult to foresee, and extrapolate future developments of the Bitcoin block difficulty. Therefore, a range of possible scenarios are presented in the next section.
2.1.2. Bitcoin Scenarios
Considering the exponential growth of the block difficulty in Figure 1, three basic scenarios for the difficulty are employed that seem most convenient. The first one is assuming a continuous exponential increase of the difficulty with a least-squares fit. One data point per day has been used for the fitting. The second scenario is a linear interpolation of the difficulty from January 1st, 2013 and October 31st, 2018. The third scenario is considering a stagnating difficulty. Figure 2 shows the three chosen scenarios.
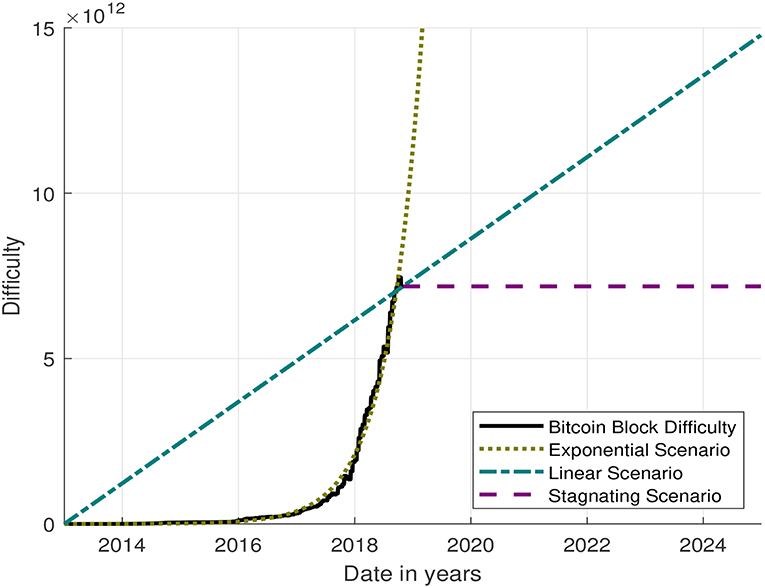
Figure 2. Exponential, linear, and stagnating scenario for the future development of the Bitcoin block difficulty fitted to the past difficulty. Data for the Bitcoin block difficulty from Blockchain Luxembourg S.A. (2018).
The next sections focus on the Ethereum protocol and the scenarios for the Ethereum block difficulty.
2.1.3. Ethereum Protocol
The Ethereum network is designed to offer a “more secure, trustworthy and globally accessible internet,” and will undergo multiple development phases and versions to reach this goal (Buterin, 2015b). Those updates had in the past and likely will in the future continue to have direct impact on the calculation of the block difficulty. In the original implementation of 2015, the Ethereum block difficulty (dETH) was calculated from the previous block difficulty (dETH,prev) and two additional arithmetic expressions (see Equation 2).
The first expression is a correction factor, including the spend time to mine the previous block. If the calculated time is shorter or longer than 13 s a correction factor is added or subtracted from the difficulty of the previously mined block. The second expression is called the difficulty bomb. Every 100,000 blocks this expression grows exponentially, starting at block 300,000. The difficulty bomb was implemented to move toward an “ice age” with the POW algorithm, in order to pressure the transition to proof-of-stake (POS), an alternative consensus algorithm. Double dashes symbolize an integer division, curtailing the remainder (Buterin, 2015a).
Equation (3) shows the updated adjustment formula for the block difficulty after the Homestead release, which was the second version of the Ethereum platform and included multiple protocol and network changes (Jeffrey Wilcke, 2016).
In the Homestead update released in March 2016, the difficulty formula was adjusted in such a way that the difficulty does not change when the time necessary to mine a block stays in the range from 10 to 19 s. The block difficulty increases whenever the time drops below the range, and when it exceeds the range it decreases. The difficulty bomb was not altered in the Homestead update (Buterin, 2015a).
Equations (4–6) show the updated adjustment formula and current state of the Ethereum protocol for the block difficulty after the Byzantium and Constantinople hard forks, which are updates of the Ethereum protocol (Schoedon and Buterin, 2017; Schoedon, 2018). The Byzantium and Constantinople hard forks are part of the Metropolis release, which is the third version of the Ethereum platform. The Byzantium hard fork happened in October 2017 and Constantinople is planned for early 2019 (Foundation, Ethereum, 2018).
With the introduction of the adjustment factor (adj) the existence of uncles is factored in the calculation of the block difficulty. Uncles are blocks that are correctly mined but are not included into the blockchain, and were not considered until the Byzantium hard fork. Furthermore, the range in which the block difficulty stays constant was altered from 9 to 18 s (Buterin, 2016). Figure 3 visualizes the evolution of the Ethereum block difficulty from March 2015 to October 2018 with a solid black line.
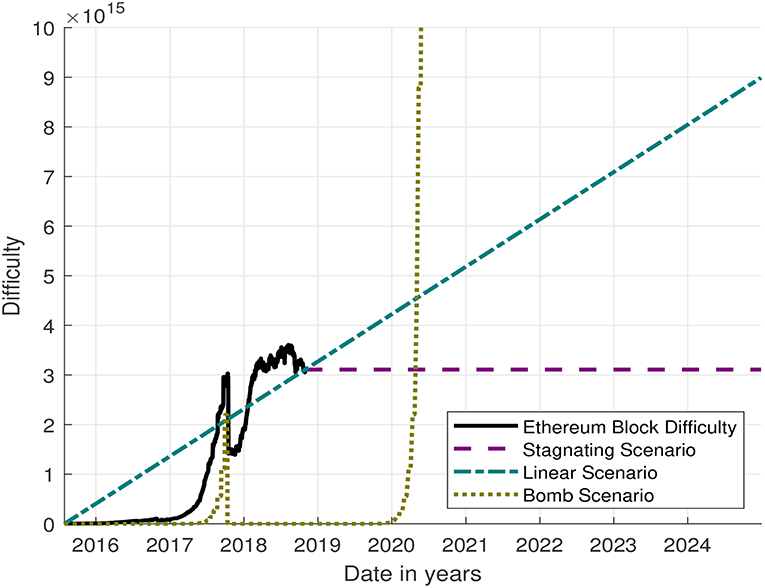
Figure 3. Past Ethereum block difficulty development according to Etherscan (2018) and exponential, linear, and stagnating scenarios for the future.
Until the beginning of 2017, the graph shows a steady and continuous growth of the block difficulty. Especially in mid-2017, an increasing impact of the difficulty bomb becomes visible from the exponential steps towards the Byzantium update. In October 2017, the difficulty drops from 3 × 10¹⁵ to 1.5 × 10¹⁵, due to the reset of the difficulty bomb in the Byzantium update, by 3,000,000 blocks (Schoedon and Buterin, 2017). Since the Byzantium update, the block difficulty exponentially rose again after reaching a level of saturation at approximately 3 × 10¹⁵. For the Constantinople release, the Ethereum developers already agreed on delaying the difficulty bomb for another 2,000,000 blocks (Schoedon, 2018), resulting in a total delay of 5,000,000 blocks Equation (6). Therefore, the impact of the difficulty bomb will not be visible before 2020 assuming an average mining rate of 15.9 s (see Figure 3).
2.1.4. Ethereum Scenarios
Three scenarios for the future development of the Ethereum block difficulty are presented in Figure 3. The first scenario is the development of the difficulty bomb only, according to Equations (4–6). The second scenario is a linear interpolation of the block difficulty on October 31, 2018 and the initial block difficulty in 2015. The last scenario is a stagnating block difficulty. Stagnation of the block difficulty is only realistic if the Ethereum community agrees to further delay the difficulty bomb.
2.2. Mining Hardware
This section summarizes the development of the efficiency of the currently available mining hardware and describes the creation of the efficiency scenarios for Bitcoin and Ethereum. A pessimistic, and an optimistic scenario for each the Bitcoin and the Ethereum mining hardware efficiency is shown until 2025.
2.2.1. Evolution of Bitcoin Hardware
Bitcoin mining hardware witnessed many advancements in the past decade. In the first years of the Bitcoin network, mining was still possible with conventional computers and laptops (Bitcoin Forum, 2012; Bitcoin Wiki, 2018). As Bitcoin became more popular and the price increased, field programmable gate arrays (FPGA) and then application specific integrated circuits (ASIC) were developed (Bitcoin Wiki, 2018). In 2018, the most powerful ASIC calculates up to 16 Th/s (Shivam Chawla, 2017).
The investigation of the development of the hardware efficiency requires a data set, that contains information about the energy consumption, the hashrate, and the release date of the mining hardware. The data, used in this paper, is available in Zade and Myklebost (2018). Figure 4 visualizes the efficiency of the mining hardware as crosses at the date corresponding to their release date or the date the information of the hardware was originally retrieved. The data starts in 2013 because beforehand Bitcoin mining was mostly done on personal computers (PC) and graphical processing units (GPU). Around 2013, FPGAs were introduced to mine Bitcoins, however were quickly outrun by ASICs. Since 2013, the efficiency of the mining hardware grows steadily.
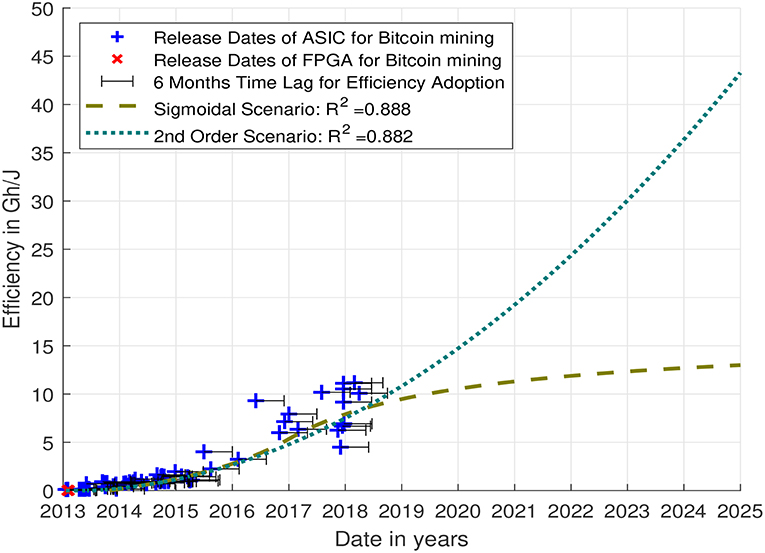
Figure 4. Quadratic and sigmoid scenario for the development of the Bitcoin mining hardware efficiency fitted to the past development. Data for the hardware release dates from Zade and Myklebost (2018).
2.2.2. Efficiency Scenarios for Bitcoin Hardware
In order to create reasonable scenarios of the hardware efficiency of the Bitcoin network, it is necessary to consider a certain time lag until the network adopts the newly released hardware. In Figure 4, a 6 months time lag, which is equivalent to 1/4 of the duration of use, has been added to the release dates to make up for the adoption time (see de Vries, 2018b). The scenarios are then created with one pessimistic and one optimistic least-squares fits. The data that has been fitted are the release dates in Zade and Myklebost (2018) delayed by the time lag and the corresponding efficiency (see Figure 4). In the fitting, one data point per release date was used.
The first one, is a standardized second order polynomial fit, and returns the parameters in Equation (7).
The second fitting curve is a sigmoid curve, which was derived from Equation (8).
Equation (9) is a modification of Equation (8), so that it is applicable to the data with UNIX timestamps. Therefore, additional parameters are introduced.
A variation of the parameter A results in an amplification of the function values. Altering B causes a shift on the x-axis and C affects the gradient of the curve. Finally, the parameter D creates a shift on the y-axis. A least-square curve fitting function fitted the parameters. The initial parameters, the lower and the upper bounds and the optimized values are summarized in Table 1.
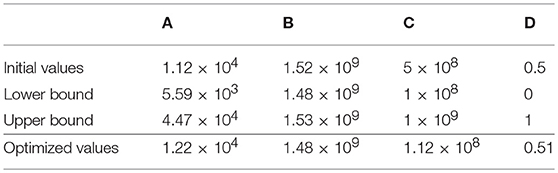
Table 1. The parameters used to fit the hardware mining data to a sigmoid curve [see Equation (9)].
Figure 4 displays the results of the two fitting functions. The curves are congruent until the last data point. The quadratic curve indicates a scenario in which the hardware efficiency will increase to approximately 45 Gh/J in 2025. The sigmoid curve shows a rather pessimistic scenario in which the hardware efficiency reaches a saturation at approximately 13 Gh/J in 2025. The actual development of the hardware efficiency will most probably be in between the proposed scenarios, as long as no breakthrough technology is developed for Bitcoin mining (see Figure 4).
2.2.3. Evolution of Ethereum Hardware
The mining process in the Ethereum network was built to be ASIC-resistant, in order to keep mining profitable for ordinary computers (Ethereum Wiki, 2018). This ASIC-resistance was originally implemented by the Dagger-Hashimoto algorithm and currently is used in the Ethash implementation. Ethash forces full clients to create a 1 GB dataset which is updated every 30,000 blocks, grows linearly over time, and has to be stored. Mining is only possible, if random parts of the dataset can be accessed, combined with the block data, and altogether hashed. Therefore, a GPU is the best mining hardware, due to its built-in memory and high access rate (Ethereum Wiki, 2017).
Analogous to the hardware evolution analysis for Bitcoin, a data set for the Ethereum mining hardware was needed that includes information about the energy consumption, hashrate, and release date. However, manufacturers of GPUs do not normally state the reachable hashes per second nor the hashes per joule in the technical data, because mining Ethers is a new field of application. Therefore, the energy consumption of GPUs are from technical data sheets, whereas the hashrates are from different websites that offer test results (Zade and Myklebost, 2018).
Figure 5 shows the evolution of the mining hardware efficiency over time in Mh/J. The displayed data starts in 2012, since already earlier produced GPUs are likely to be used for mining Ethers. Unlike the hardware to mine Bitcoins, the development of the Ethereum mining hardware is widely spread. This is most probably due to the fact, that GPUs are not primarily developed to mine Ethers, but instead to enable advanced computer gaming, image processing, and artificial intelligence applications (Karpištšenko, 2017).
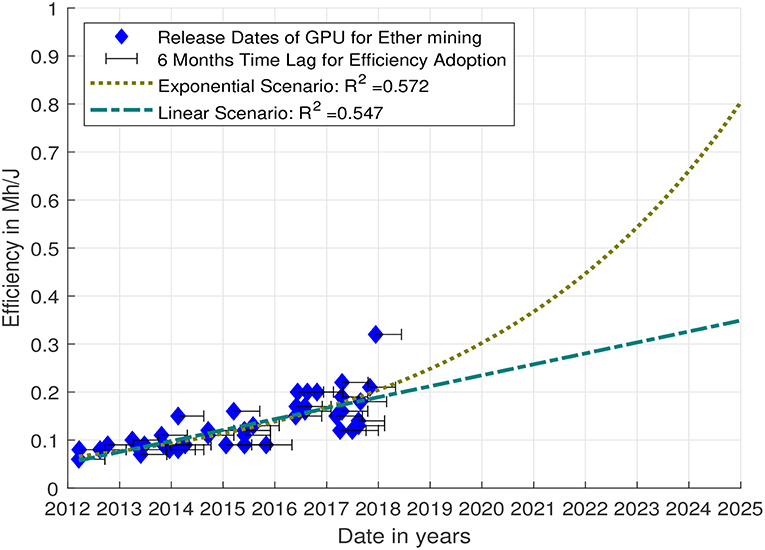
Figure 5. Exponential and linear scenario for the development of the Ethereum hardware efficiency fitted to the past development. Data for the hardware release dates from Zade and Myklebost (2018).
2.2.4. Efficiency Scenarios for Ethereum Hardware
Analogous to Bitcoin, it is reasonable to consider a certain time lag until the network adopts the newly released hardware. Therefore, the release dates in Figure 4 indicate a 6 months time lag, which is equivalent to 1/4 of the duration of use (see de Vries, 2018b). The scenarios are then created with one pessimistic and one optimistic least-squares fit. The data that has been fitted are the release dates from Zade and Myklebost (2018) delayed by the time lag and the corresponding efficiency (see Figure 4). In the fitting, one data point per release date was used.
Figure 5 shows the results of the two least-squares fits. First, the historical data shows, that GPUs are primarily not optimized or developed to increase the mining efficiency. Secondly, manufacturers of GPUs will have limited interest in optimizing their processing units for mining Ethers, when Ethereum developers want to shift toward a less computational expensive protocol with POS. Therefore, the first scenario for the development of the Ethereum mining hardware efficiency is rather pessimistic and follows a linear trend. The second scenario assumes an optimistic exponential evolution of the hardware efficiency. The second scenario would propose a mining efficiency of 0.8 Mh/J in 2025.
2.3. Future Mining Power
This section describes the calculation of the future power demand for Bitcoin and Ether mining. The formula for the Bitcoin mining power demand is shown in Equation (10) (Malone and O'Dwyer, 2014).
PBTC_mining represents the power demand for Bitcoin mining, nminer the number of miners within the network, PHW the power demand of a certain mining hardware, DBTC the difficulty of the Bitcoin network, Δt the preset time to mine a block (for Bitcoin 10 min), and RHW the hashrate. The hashrate and the power demand can be summarized in the mining efficiency ηHW.
Equation (11) calculates the network-wide power demand to mine Ethers. The main difference is the absence of the lower bound factor 232.
Section 3 displays the results of the different scenarios.
3. Results
This section presents the results of the scenario model for the power demand of the Bitcoin and Ethereum blockchain.
3.1. Bitcoin Mining Power Demand Scenarios
Six scenarios are investigated for the Bitcoin blockchain, in order to analyze the future mining power demand. The development of the scenarios is described in section 2. Table 2 lists the combinations of the hardware efficiency and block difficulty for each scenario.
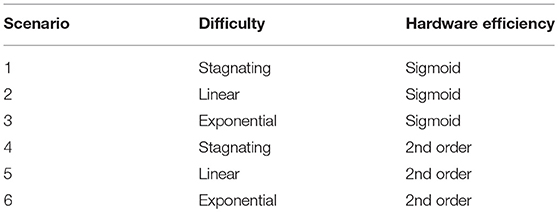
Table 2. Block difficulty and hardware efficiency combination for each scenario for the Bitcoin network.
Figure 6 visualizes three results:
1. How much power the Bitcoin blockchain demanded in the past, if the entire mining process would have followed the fitted curves in section 2.
2. How much power the Bitcoin blockchain demanded in the past, if the entire mining process would have been done on one of the selected hardware.
3. How much power the Bitcoin blockchain will demand, if one of the scenarios from Table 2 materializes.
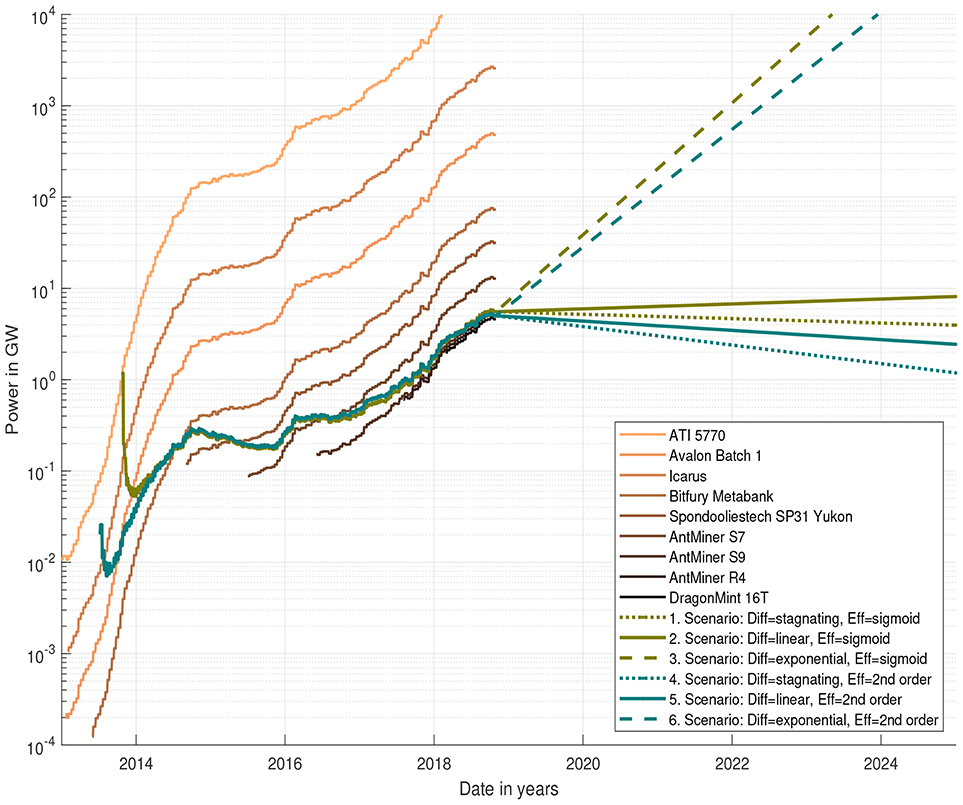
Figure 6. Power demand for Bitcoin mining until October 2018 if only one hardware was used throughout the network and scenarios 1–6 until 2025 for the future development of the power demand. Bitcoin hardware data from Zade and Myklebost (2018).
Even though the Bitcoin network went live in 2009, the data starts in 2013, because mining was done on conventional CPUs beforehand, and the release of Bitcoin specific hardware started in 2013 (Malone and O'Dwyer, 2014).
The y-axis is a logarithmic scale, in order to show the vast range of mining power demand. The curves of the hardware start at their release date or at the time, when the information about the hardware was first made available. For a better visualization, only a selection of 9 hardware mining machines are shown in Figure 6. In 2013, the first data points are FPGAs (e.g., Icarus) and were quickly followed by ASICs (e.g., Antminer). The mining power demand approximately was in the range from 0.1 MW to 10 MW in 2013. With the releases of the first ASICs in 2014, the mining power demand rose drastically to the range from 0.01 GW to 5 GW. In the beginning of 2018, the range of the mining power demand was already from 1.5 GW to more than 5,000 GW. The power demand approximately is at 5 GW, if Bitcoin mining was done in October 2018 with a mix of the three most efficient, displayed ASICs. In 2018, the mining power demand could be higher than 10,000 GW, if mining was entirely done with the FPGAs that were released in 2013.
The curves for the six scenarios indicate the potential development of the power demand of the Bitcoin and Ethereum blockchain. Green curves show sigmoidal, and turquoise curves exponential scenarios for the hardware efficiency of the Bitcoin mining hardware. Dashed lines indicate the exponential increase, solid lines a linear rise, and dotted lines the effect of a stagnating block difficulty.
The curves for scenario 1–3 and 4–6 are congruent to each other from 2014 until the beginning of 2018. The congruence of the curves is a result of the usage of the historical block difficulty data that was for all scenarios the same. Furthermore, the hardware efficiency only show slight deviations between the sigmoidal and exponential fit between 2014 and the beginning of 2018. In 2013, the differences of the curves are caused by the deviating scenarios for the hardware efficiency in Figure 4. Differences from mid-2018 onwards are a result of the deviating scenarios for the hardware efficiency and block difficulty.
In 2025, the power demand of the Bitcoin network will be greater than 10,000 GW, if the block difficulty continues to rise exponentially and the hardware efficiency either follows a sigmoidal or an exponential growth. Considering the worldwide installed generation capacity for electricity of 6,300 GW in 2015, these two scenarios are highly unlikely (Central Intelligence Agency, 2018). In the case of a linear growth of the block difficulty, the expected power demand of the Bitcoin network is in the range from 2.5 to 8 GW. A stagnating difficulty results in an overall power demand in the range from 1.2 to 4 GW in 2025.
Conclusively, Figure 6 shows that the greatest impact results from the development of the block difficulty and that the Bitcoin power demand can potentially decrease, if the block difficulty stagnates or even decreases. Improvements in the hardware efficiency will have limited influence on the power demand of the Bitcoin network.
3.2. Ethereum Mining Power Demand Scenarios
Six scenarios are investigated for the future mining power demand of the Ethereum blockchain. Table 3 shows the combinations of the hardware efficiency and block difficulty within each scenario.
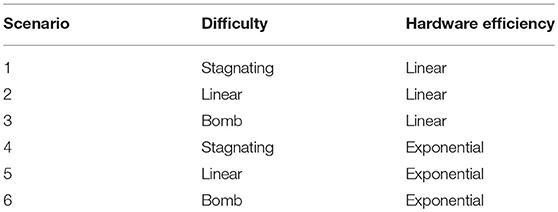
Table 3. Block difficulty and hardware efficiency variations for each scenario for the Ethereum network.
Figure 7 shows three results:
1. How much power the Ethereum blockchain demanded in the past, if the entire mining process would have followed the fitted curves in section 2.
2. How much power the Ethereum blockchain demanded, if the entire mining process would have been performed using the same hardware.
3. How much power the Ethereum blockchain will demand, if one of the scenarios from Table 3 materializes.
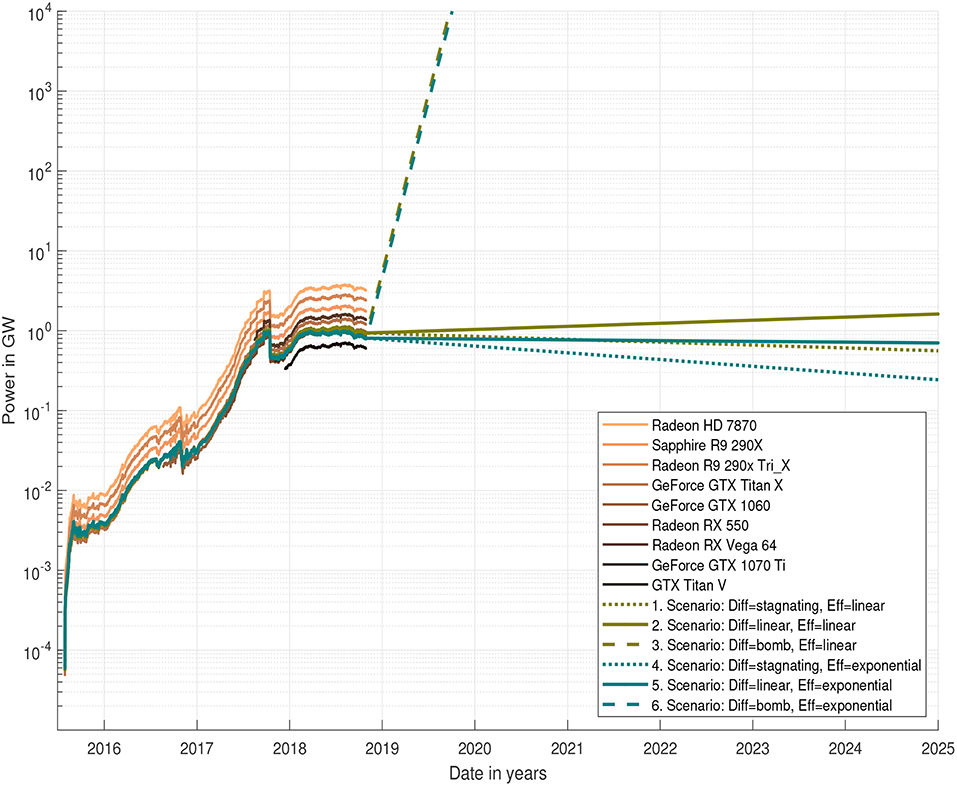
Figure 7. Mining power demand of the Ethereum blockchain until October 2018 if only one hardware was used throughout the network and scenarios 1–6 until 2025 for the future development of the power demand. Ethereum hardware data from Zade and Myklebost (2018).
calculated mining power demand of the Ethereum blockchain for the researched data in Zade and Myklebost (2018) and the above mentioned six scenarios.
For a better visualization, only 10 of the 45 listed mining machines are visualized, in order to display the full range of the power demand in Figure 6 (Zade and Myklebost, 2018). The x-axis starts at the beginning of the Ethereum network in July 2015, and ends with the forecast in 2025. The curves of the hardware start at their release date. In January 2016, the mining power demand ranged from 3 to 9 MW. In January 2017, the mining power demand was in the range from 25 to 90 MW. After the Byzantium update in October 2017, the demand dropped shortly to a range from 0.45 to 1.5 GW but increased again until January 2018 up to 0.5 to 2 GW.
The mining power demand of the Ethereum blockchain would have been at approximately 0.9 GW on October 31st, 2018, if the network used a mixture of the five most efficient GPUs to mine Ethers. This estimate and the one in section 3.1 about a similar mixture for the Bitcoin network conclude that the mining power demand of the Bitcoin and the Ethereum blockchain are in similar ranges.
The two dashed lines show the development of the power demand when the block difficulty grows according to the difficulty bomb and the hardware efficiency either increases linearly (dashed brown line) or exponentially (dashed green line). The average power demand of the scenarios 1 and 4 would exceed 10,000 GW before the beginning of 2020. These scenarios seem, from the energy system's perspective highly unlikely, considering the worldwide installed generation capacity for electricity of 6,300 GW in 2015 (Central Intelligence Agency, 2018). The green, and turquoise solid lines show the mining power demand if the block difficulty rises linearly. The average power demand in 2025 of the scenarios 2 and 5 would be at 1.4 GW. The dotted lines represent the scenarios 3 and 6 in which the difficulty stagnates at the level of the October 31, 2018 and the hardware efficiency increases exponentially or linearly. The average power demand would be in 0.4 GW in 2025. Therefore, a stagnating block difficulty will result in a mining power demand by 2025 of less than half compared to the scenarios with an linearly increasing block difficulty.
Similarly to section 3.1, the scenarios for the Ethereum blockchain indicate that the future power demand most significantly depends on the block difficulty. The hardware efficiency has a limited impact.
4. Discussion
This paper presents a scenario model that estimates the future mining power demand of the Bitcoin and Ethereum blockchain. This section discusses the selected model's input scenarios, limitations, results, and compares them with the scientific literature.
The model creates scenarios for the efficiency of mining machines, based on release dates and efficiencies of hardware from the last decade. The chosen scenarios follow the trend of processor efficiencies described in (Hasler and Marr, 2013; Marr et al., 2013; Rupp, 2013). However, they do not assume any breakthrough technology that would improve the efficiency of mining hardware by more than 400% in 2025 compared to October 2018. This method allows the creation of efficiency scenarios for mining hardware, which can also be applied to other technologies.
In the Bitcoin blockchain, the block difficulty only depends on the block mining rate. In the Ethereum network, the block difficulty also is affected by the difficulty bomb. The different influences on the block difficulty were analyzed, extrapolated, and fitted with multiple functions, in order to create reasonable scenarios for the future. The developed scenarios offer a wide range of possible developments, because the computing power in a blockchain is amongst others dependent on the market price which is hard to predict. Furthermore, this method cannot cover the impact of protocol changes, such as in the Byzantium and Constantinople release. However, the creation of scenarios for the block difficulty based on the past development appears to be the most appropriate approach.
Large mining farms that were built to pool the computing power of multiple thousands of mining machines require extra cooling elements (de Vries, 2018b). However, the analyzed hardware does only consider on-board cooling elements. Moreover, the power demand of the GPU's auxiliary equipment is not considered. Therefore, the results presented in this paper are a lower bound of the power demand of the Bitcoin and Ethereum blockchain. The investigation of the cooling demand requires further research.
In consideration of the aforementioned limitations, this model calculates the power demand of the Bitcoin and Ethereum blockchain, and provides the following answers:
1. Mining efficiency has increased significantly over the past years. Today's mining would result in a power demand of more than 1,000 GW in 2018 if mining was done on a mix of hardware that was released in 2013.
2. Future hardware efficiency improvements will have only a limited impact on the total power demand of the Bitcoin and Ethereum blockchain if the block difficulty follows similar growth patterns as in the past decade.
3. The power demands of the Bitcoin and Ethereum blockchain are expected to decrease if the block difficulty stagnates. However, the demand will stay constant if the block difficulty only grows linearly.
4. The power demands of the Bitcoin and Ethereum blockchain are estimated to be in similar ranges, at least 5 and 0.9 GW, respectively as of October 2018.
For comparison and verification of the presented model, Table 4 shows the average annual power demand of the Bitcoin and Ethereum blockchain from the scientific literature and the presented scenario model for the years from 2014 to 2018.
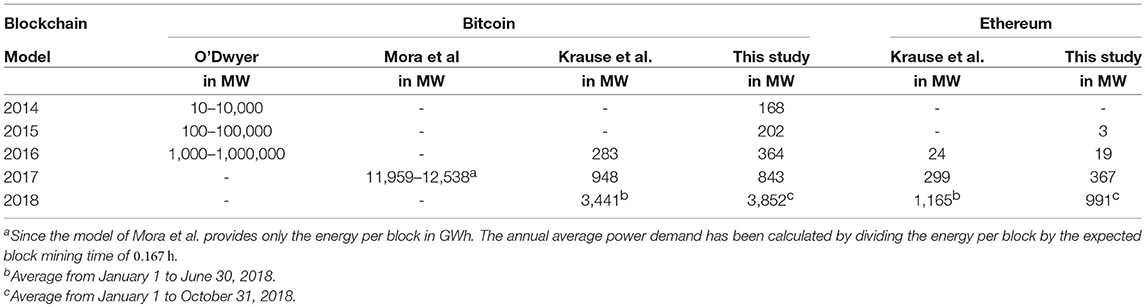
Table 4. Annual average powerdemand of bitcoin and ethereum.
For the years 2014 and 2015, the model calculates power demands for Bitcoin that correspond to the results presented in O'Dwyer (2017). For 2016, 2017, and 2018, the model's results for Bitcoin are in similar ranges as the results presented by Krause et al. (2018). The scenario model does not match the results of O'Dwyer in 2016 because the hardware selection in O'Dwyer (2017) was not updated from the author's original selection from 2014 and therefore calculated with less efficient hardware a higher power demand range for 2016 (see Malone and O'Dwyer, 2014). For 2017, the scenario model calculates an annual average power demand for Bitcoin of 843 MW and for Ethereum of 367 MW. Mora et al. (2018) published a model that calculates a power demand for Bitcoin in the range from 11,959 to 12,538 MW. The reason behind this high power demand can be explained with the random selection of hardware that was already uneconomic and out-dated in 2017 (see section 1). In summary, the comparison of the results in Table 4 verifies the output of the scenario model and provides explanations for deviations to other scientific models for the years from 2014 to 2018.
5. Conclusion
This paper presented a new hashrate-based model for the creation of scenarios for the future mining power demand of the Bitcoin and Ethereum blockchain. Hence, providing an alternative to economical models that require business secrets, or technical models that use unrelated adoption rates. The developments of the block difficulty and the hardware efficiency of the last decade provided the basis for the developed scenarios. The investigation of six scenarios until 2025 revealed that the hardware improvements will have only a limited impact on the total power demand of the Bitcoin and Ethereum blockchain, and that the mining power demand of the Ethereum network is in a similar range as the one of Bitcoin. Furthermore, the presented methodology can be applied to create scenarios for the power demand of any other blockchain that uses the POW consensus algorithm by adjusting the formulas to the network's characteristics.
Future research shall investigate the impact of the market price on the block difficulty and the consideration of cooling equipment in the overall power demand of the Bitcoin and Ethereum blockchain.
Data Availability
The datasets analyzed for this study can be found in Zade and Myklebost (2018), Etherscan (2018), and Blockchain Luxembourg S.A. (2018).
Author Contributions
JM, PT, and MZ contributed conception and design of the study. JM and MZ organized the database. JM performed the statistical analysis. MZ wrote the first draft of the manuscript. All authors contributed to manuscript revision, read and approved the submitted version.
Conflict of Interest Statement
The authors declare that the research was conducted in the absence of any commercial or financial relationships that could be construed as a potential conflict of interest.
References
Bitcoin Forum (2012). The First Miners. Available online at: https://bitcointalk.org/index.php?topic=99265.0 (Accessed February 14, 2018).
Bitcoin Wiki (2018). Mining. Available online at: https://en.bitcoin.it/wiki/Mining (Accessed February 14, 2018).
Blockchain Luxembourg S.A. (2018). Bitcoin Charts & Graphs - Blockchain. Available online at: https://www.blockchain.com/charts (Accessed November 18, 2018).
Buterin, V. (2015a). Eip 2: Homestead Hard-Fork Changes. Repository. Available online at: https://github.com/ethereum/EIPs/blob/master/EIPS/eip-2.md (Accessed May 16, 2018).
Buterin, V. (2015b). The Evolution of Ethereum. Available online at: https://blog.ethereum.org/2015/09/28/the-evolution-of-ethereum/ (Accessed November 29, 2018).
Buterin, V. (2016). Eip 100: Change Difficulty Adjustment to Target Mean Block Time Including Uncles. Available online at: https://github.com/ethereum/EIPs/blob/984cf5de90bbf5fbe7e49be227b0c2f9567e661e/EIPS/eip-100.md (Accessed May 16, 2018).
Central Intelligence Agency (2018). The world factbook: Electricity - Installed Generating Capacity (kw). Available Online at: https://www.cia.gov/library/publications/the-world-factbook/fields/2236.html#xx (Accessed May 16, 2018).
de Vries, A. (2018a). Bitcoin Energy Consumption Index. Available online at: https://digiconomist.net/bitcoin-energy-consumption (Accessed November 20, 2018).
de Vries, A. (2018b). Bitcoin's growing energy problem.c Joule 2, 801–805. doi: 10.1016/j.joule.2018.04.016
DiChristopher, T. (2017). No, Bitcoin Isn't Likely to Consume All the World's Electricity in 2020. Available online at: https://www.cnbc.com/2017/12/21/no-bitcoin-is-likely-not-going-to-consume-all-the-worlds-energy-in-2020.html (Accessed April 4, 2018).
Ethereum Wiki (2017). Ethash. Repository. Available online at: https://github.com/ethereum/wiki/wiki/Ethash (Accessed February 14, 2018).
Ethereum Wiki (2018). Dagger Hashimoto. Repository. Available online at: https://github.com/ethereum/wiki/blob/master/Dagger-Hashimoto.md (Accessed February 14, 2018).
Etherscan (2018). Ethereum Block Difficulty Growth Chart. Available Online at: https://etherscan.io/chart/difficulty (Accessed November 18, 2018).
Foundation, Ethereum. (2018). Byzantium hf Announcement. Available online at: https://blog.ethereum.org/2017/10/12/byzantium-hf-announcement/ (Accessed November 27, 2018).
Giungato, P., Rana, R., Tarabella, A., and Tricase, C. (2017). Current trends in sustainability of bitcoins and related blockchain technology. Sustainability 9:2214. doi: 10.3390/su9122214
Hasler, J., and Marr, B. (2013). Finding a roadmap to achieve large neuromorphic hardware systems. Front. Neurosci. 7:118. doi: 10.3389/fnins.2013.00118
Jeffrey Wilcke (2016). Homestead Release. Available online at: https://blog.ethereum.org/2016/02/29/homestead-release/ (Accessed November 18, 2018).
Karpištšenko, A. (2017). Use of graphics processing units on the rise – future tech – medium. Available online at: https://medium.com/futuretech/use-of-graphics-processing-units-on-the-rise-390696fd8d8 (Accessed February 22, 2019).
Krause, M. J., Tolaymat, T., (2018). Quantification of energy and carbon costs for mining cryptocurrencies. Nat. Sustain. 1, 711–718. doi: 10.1038/s41893-018-0152-7
Malone, D., and O'Dwyer, K. J. (2014). “Bitcoin mining and its energy footprint,” in 25th IET Irish Signals & Systems Conference 2014 and 2014 China-Ireland International Conference on Information and Communities Technologies (ISSC 2014/CIICT 2014) (Limerick: Institution of Engineering and Technology), 280–285.
Marr, B., Degnan, B., Hasler, P., and Anderson, D. (2013). Scaling energy per operation via an asynchronous pipeline. IEEE Trans. Very Large Scale Integr. Syst. 21, 147–151. doi: 10.1109/TVLSI.2011.2178126
Mengelkamp, E., Gärttner, J., Rock, K., Kessler, S., Orsini, L., and Weinhardt, C. (2018). Designing microgrid energy markets. Appl. Ener. 210, 870–880. doi: 10.1016/j.apenergy.2017.06.054
Mora, C., Rollins, R. L., Taladay, K., Kantar, M. B., Chock, M. K., Shimada, M., et al. (2018). Bitcoin emissions alone could push global warming above 2° c. Nat. Clim. Change 8, 931–933. doi: 10.1038/s41558-018-0321-8
Nakamoto, S. (2008). Bitcoin: A Peer-to-Peer Electronic Cash System. Available Online at: https://bitcoin.org/bitcoin.pdf (Accessed May 5, 2018).
Nakamoto, S., and The Bitcoin Developers (2012). main.cpp: Getnextworkrequired(). Available Online at: https://github.com/bitcoin/bitcoin/blob/d62a1947be5350ed60066ccacc7aba43bbdf48fb/src/main.cpp#L865 (Accessed January 30, 2019).
O'Dwyer, K. (2017). Topics in Power Usage in Network Services. Dissertation, National University of Ireland Maynooth.
Popper, N. (2018). There Is Nothing Virtual About Bitcoin's Energy Appetite. New York Times. Available online at: https://www.nytimes.com/2018/01/21/technology/bitcoin-mining-energy-consumption.html (Accessed April 4, 2018).
Rupp, K. (2013). CPU GPU and MIC Hardware Characteristics Over Time. Available at: https://www.karlrupp.net/2013/06/cpu-gpu-and-mic-hardware-characteristics-over-time/ (Accessed April 4, 2018).
Sabounchi, M., and Wei, J. (2017). Towards Resilient Networked Microgrids: Blockchain-Enabled Peer-to-Peer Electricity Trading Mechanism. IEEE. Available online at: https://ieeexplore-ieee-org.eaccess.ub.tum.de/document/8245449/
Schoedon, A. (2018). Eip 1234: Constantinople Difficulty Bomb Delay and Block Reward Adjustment. Repository. Available online at: https://github.com/ethereum/EIPs/blob/master/EIPS/eip-1234.md (Accessed November 27, 2018).
Schoedon, A., and Buterin, V. (2017). Eip 649: Metropolis Difficulty Bomb Delay and Block Reward Reduction. Repository. Available online at: https://github.com/ethereum/EIPs/blob/abcf1153ae3939fab9dd30fae8a94c26c9d18db6/EIPS/eip-649.md (Accessed May 5, 2018).
Shivam Chawla (2017). Dragonmint 16t: Halongmining Releases Competitor to Bitmain. Online. Available online at: https://blockchaind.net/dragonmint-halongmining-releases-competitor-bitmain/ (Accessed December 17, 2018).
Vranken, H. (2017). Sustainability of bitcoin and blockchains. Curr. Opin. Environ. Sustain. 28, 1–9. doi: 10.1016/j.cosust.2017.04.011
Wang, J., Wang, Q., Zhou, N., and Chi, Y. (2017). A novel electricity transaction mode of microgrids based on blockchain and continuous double auction. Energies 10:1971. doi: 10.3390/en10121971
Keywords: blockchain, bitcoin, ethereum, mining power demand, scenario, block difficulty, hardware efficiency
Citation: Zade M, Myklebost J, Tzscheutschler P and Wagner U (2019) Is Bitcoin the Only Problem? A Scenario Model for the Power Demand of Blockchains. Front. Energy Res. 7:21. doi: 10.3389/fenrg.2019.00021
Received: 03 January 2019; Accepted: 13 February 2019;
Published: 13 March 2019.
Edited by:
Sonia Yeh, Chalmers University of Technology, SwedenReviewed by:
Eric Hittinger, Rochester Institute of Technology, United StatesDavid Malone, Maynooth University, Ireland
Copyright © 2019 Zade, Myklebost, Tzscheutschler and Wagner. This is an open-access article distributed under the terms of the Creative Commons Attribution License (CC BY). The use, distribution or reproduction in other forums is permitted, provided the original author(s) and the copyright owner(s) are credited and that the original publication in this journal is cited, in accordance with accepted academic practice. No use, distribution or reproduction is permitted which does not comply with these terms.
*Correspondence: Michel Zade, michel.zade@tum.de