Geographically Parameterized Residential Sector Energy and Service Profile
 Raluca Suciu
 Ivan Kantor
 Hür Bütün
 François Maréchal
- Industrial Process and Energy Systems Engineering, École Polytechnique Fédérale de Lausanne, Sion, Switzerland
The large share of energy consumption in the residential sector has necessitated better understanding and evaluation of its energy needs, with the objective of identifying possible pathways for improvement. This work uses heat signature models and climate data to build a parameterized residential sector profile for different climatic zones in Europe. The sector profile is validated using Rotterdam, NL as a case study and the results show variations from the real energy demand profile of less than 10%, primarily caused by cultural and climatic differences between Rotterdam and the rest of Western Europe. The energy and service profile constructed herein is well-suited for exploring the best technologies for supplying residential requirements, drawing from the domain of process integration. This work demonstrates the usefulness of the residential profile by applying process integration techniques within a mixed integer linear programming formulation to evaluate optimal energy conversion technologies for different district energy networks and potential waste heat recovery from industrial plants located in the vicinity of the residential area. The results show that switching to a fully electric energy providing system can lead to operating cost savings of 48% and CO2 emission savings up to 100%, depending on the mix of electricity generation. The utilization of the sector profile is also exemplified using the city of Rotterdam, where it is shown that industrial waste heat recovery can lead to operating cost and environmental impact savings of 9% and 20%, respectively.
1. Introduction
Rapid growth in world energy use is raising concerns over exhaustion of energy resources, heavy environmental impacts (ozone layer depletion, global warming, climate change, etc.) and supply difficulties. The International Energy Agency has published alarming data on energy consumption trends, showing that both primary energy and CO2 emissions have increased by 56% during the last fifteen years (1990–2015) (International Energy Agency 2018; Figure 1A).
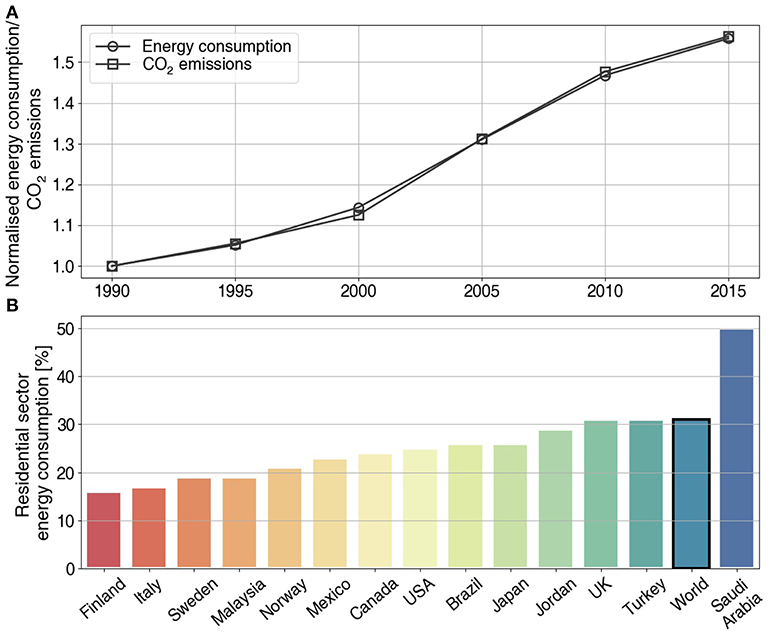
Figure 1. World energy consumption and CO2 emissions, normalized to 1990 (International energy agency, 2018) (A), Residential sector energy consumption by country (B).
Population growth, improvement of building services and comfort levels, and increased time spent inside buildings have led to a significant rise in building energy consumption. More specifically, energy consumption in the residential sector represents between 16 and 50% of national totals, varying by country, and averages 30% worldwide (Kamal, 1997; Almeida et al., 2001; Morelli, 2001; Meyers et al., 2003; Boardman, 2004; Lenzen et al., 2006; Ueno et al., 2006 Figure 1B). Given the large share of energy consumption in the residential sector and energy policies implemented worldwide in the past decades (e.g., Europe 20-20-20, da Graça Carvalho, 2012), a better understanding of the defining characteristics of residential energy consumption is clearly required.
Energy systems in buildings are very complex, especially given the variety of energy demands and building types. The energy demands typically considered are heating, cooling, hot water and electricity consumption and the main building types are administrative, residential and industrial (Zhao and Magoulès, 2012). Size and location are also key factors for energy consumption in the residential sector, for example small flats require less energy since they have less heat transfer area and fewer occupants. The amount and type of energy used in this sector are also related to weather conditions, architectural design, energy systems used, economic level and occupants. For instance, energy consumption in OECD countries is much greater than in emerging economies and forecasts show continued growth caused by installation of new appliances, such as air conditioners or computers (Pérez-Lombard et al., 2008).
Given the complexity of these energy systems, accurately predicting consumption is very difficult. A variety of approaches have been proposed for energy demand forecasting, varying from building sub-systems to regional or national models, which are reviewed in more detail in the following section.
The worldwide trend to reduce CO2 emissions has also driven countries to quantify and valorize their industrial waste heat (Miró et al., 2015). Industrial waste heat can be recovered or reused in other processes on site (e.g., for preheating) or converted into cold, electricity, or heat at different temperatures, which can be used for other applications such as residential district heating systems.
This paper proposes a geographically-parameterized energy profile for urban settlements in four European climate zones, and exemplifies its utilization to find the best-suited energy conversion technologies and study integration potentials for typical industries in the surrounding. Section 2 gives an overview of the approaches currently used in the literature for energy demand prediction and the main databases used to build up the different models, section 3 describes the inputs required for the sector profile, the model behind the sector profile, the case studies considered and the mathematical formulation of the problem. Section 4 presents the results and the conclusions are drawn in section 5.
2. State of the Art
Estimates of residential sector energy consumption are typically published by governments, which compile values from energy providers (U.S. Energy Information Administration, 2011); however, these values may be inaccurate as they do not account for on-site generation. Methods which provide more detailed information are desirable, conducting house surveys (Department for Communities and Local Government, 2010) for example, but also have limitations such as data collection difficulties and cost. Billing data and surveys have been used to develop the residential sector consumption profiles, but they highly depend on the purpose of the model. The main approaches for residential energy demand models can be classified as top-down and bottom-up (Haas and Schipper, 1998). Table 1 describes the advantages and limitations of bottom-up and top-down approaches.
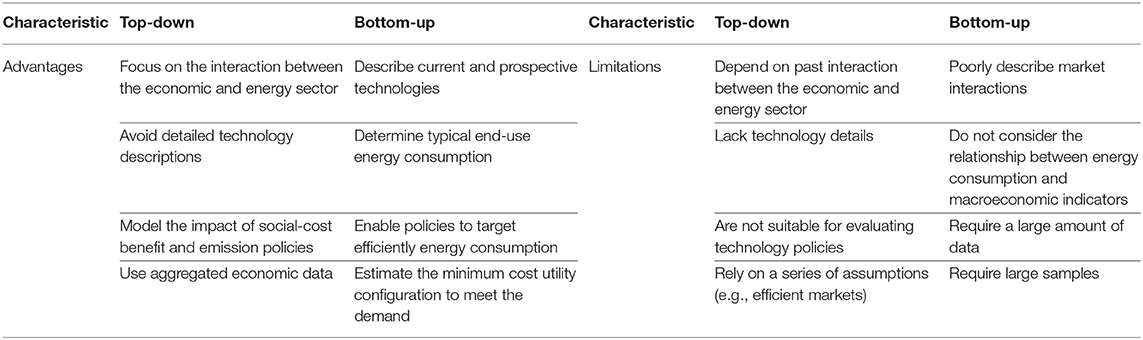
Table 1. Advantages and limitations of bottom-up and top-down approaches.
Top-down approaches generally aim at fitting data such as national energy consumption or CO2 emissions. They are typically used to investigate the connection between the energy and economic sectors and can be categorized as econometric or technological (Kavgic et al., 2010). Econometric models evaluate energy consumption using variables such as income, gross domestic product or fuel prices and lack details on existing or future technologies, since their aim is to study macroeconomic trends rather than individual building characteristics (Miller et al., 2004). The reliance on past energy consumption data might also cause problems when dealing with climate change scenarios, where social, economic and environmental factors are completely different from those experienced in the past. Technological top-down approaches include other factors which impact energy consumption, such as technological progress or structural changes (Shorrock and Dunster, 1997).
An econometric top-down model was used to evaluate annual household energy consumption in the UK based on average temperatures and inflation adjusted energy prices (Summerfield et al., 2010). The aim of the model was to allow the public to determine if energy consumption stayed within the model predicted values, given the inputs considered. Zhang (2004) developed a top-down approach to examine residential unit energy consumption in China and compared it with the ones of Japan, Canada and the United States of America (USA). Haas and Schipper (1998) created a model to quantify the consumer response to the rise in energy prices and in the energy efficiency of different technologies. To summarize, top-down approaches do not distinguish energy consumption of individual users. The information used in these models typically uses macroeconomic indicators, house construction/demolition rates, or climatic conditions. They use data which are widely available and relatively simple, but lack of detail regarding individual user consumption reduces the ability of the model to identify key areas where reductions in energy consumption can be achieved.
Bottom-up models are often seen as ways to identify the most economic options to achieve carbon emission targets given the current technologies and processes (Rivers and Jaccard, 2005). Based on the input data and the structure of the model, they are typically classified in statistical and physics-based models (Swan and Ugursal, 2009). Statistical models are generally based on regression techniques (Fung, 2003; Swan and Ugursal, 2009) and an extended review of these models can be found in Swan and Ugursal (2009). One example is the Princeton score-keeping method (PRISM), a linear regression model using a year of monthly billing data to create an index of consumption (Fels, 1986), which has been used by the US government and research organizations to study building refurbishment potentials.
Building physics models require a series of input data, such as efficiency and characteristics of heating systems, building characteristics (walls, floors, windows, doors, and their corresponding heat transfer coefficients), energy consumption of appliances, ventilation rates, occupancy levels, outdoor temperatures, etc. Ghedamsi et al. (2016) used such an approach to model and forecast the energy consumption in residential buildings until 2040. Fischer et al. (2016) presented a modeling approach based on coupling behavioral and energy balance models with stochastic modeling to generate realistic and consistent load profiles for end user demand and Girardin et al. (2010) introduced a linear model to determine the thermal power requirements of buildings based on the outdoor temperature and on the heating and cooling threshold temperatures. Bottom-up approaches are thus summarized as those using data from single users, single houses, or groups of houses and extrapolate the data to reach regional or national energy consumption totals. The usual parameters used in these models include building properties, climate properties, occupancy levels and equipment use. The primary drawback of these approaches is the lack of available data and the large number of input parameters, which makes the models complex, and therefore more difficult to solve.
Due to the trade-off between the difficulties of data collection and model complexity, hybrid methods have emerged. This work uses such a method to build a residential sector profile, which provides an estimate of demand for different energy requirements. The time-dependent formulation of the heating and cooling demands is based on (Girardin et al., 2010), while the domestic hot water profile is modeled from demand data of a city. Electricity, refrigeration, mobility and waste treatment are considered constant throughout the year. Parameterized data are provided for all four climate zones in Europe, allowing the sector profile to be applied to any European city. The resulting profile is intended for use in an optimization framework to determine the best utility mix to satisfy the energy demand of a city.
2.1. Industrial Waste Heat Integration With District Heating Networks
Large quantities of industrial heat are currently discharged into the environment (Zhang and Akiyama, 2009), exemplified by 20–50% of energy lost as waste heat in the US mineral manufacturing (Johnson et al., 2008) and 51% of process heat discharged to the environment in Turkish cement plants (Söğüt et al., 2010). The potential for increased excess heat deliveries from industries is high, especially in regions where industries are located close to cities. This type of energy integration has both economic and environmental benefits since energy resources are used in a more efficient way, resulting in decreased consumption of expensive fuels and reduced exhausts from combustion. Various researchers have focused on heat recovery within the industrial sector (Becker and Maréchal, 2012; Bendig et al., 2013; Bungener et al., 2015). Waste heat can be recovered within the process to increase the overall energy efficiency and take advantage of simple improvements such as air preheating (Karamarković et al., 2013), water desalination (González-Bravo et al., 2017), or power generation (Cunningham, 2002). However, recovering waste heat below 200°C within industrial processes is technically and economically difficult, related to its low exergy content (Cunningham, 2002).
Low-temperature heat can potentially be valorized in the residential and service sector, providing possibilities for district heating. Previous studies support potential cooperation between industries and energy providers. Sundberg and Sjödin (2003) and Gebremedhin and Moshfegh (2004) show the economic advantages of heat integration between a mechanical pulp mill and municipally owned utilities. The economic benefits and CO2 emission reductions of a similar case study have been shown in Karlsson and Wolf (2008) and Wolf and Karlsson (2008). Ajah et al. (2008) and Ajah et al. (2007) evaluated the technical, economic and environmental feasibility of integrating waste heat from the pharmaceutical industry with a DH network in The Netherlands, while Svensson et al. (2008) evaluated the trade-offs for utilization of excess heat from a pulp mill to supply internal units and external consumers (DH).
Nevertheless, few of the studies propose an integrated method in which different equipment can be used to recover waste heat at different temperature levels and in an efficient way. Moreover, very few of these studies present a detailed full-scale implementation, combining system design, economics and environmental impact assessments. This work studies the usefulness of the proposed sector profile by integrating industrial waste heat recovery to provide district heating services, and studies the economic and environmental impact feasibility by accounting for the location of industrial facilities and the expected heat losses.
3. Materials and Methods
The residential sector profile consists of district energy and service demands such as space heating, domestic hot water, refrigeration, air cooling, electricity for utilities, mobility and waste treatment. Some of the demand (e.g., electricity) is assumed to be constant throughout a year while heat-related demand is estimated as a function of outdoor air temperature. The profile is parameterized to require only climate zone, building distribution and population. The sector profile is intended for application in European cities. The method of its construction could be applied to other residential settings, provided climatic and demand data are available; however, this is not further addressed in this work. Additionally, this approach is intended for developed settings where supply and demand profiles are unlikely to change significantly, with the intention of finding the best approach to provide the requirements of the urban center. The usability is demonstrated within an MILP framework to find the optimal utility configuration and integration of industrial waste heat to satisfy the district demand.
3.1. Service Energy Demand
The sector profile can be used in different regions, requiring only:
• the population;
• the climate zone: this works considers four climate zones in Europe;
• the building distribution: share of building types (residential and service) and renovation stages (existing, new and renovated of a reference city.
Among the service energy demands estimated, heating and cooling are built using heat signature models, while domestic hot water follows the real demand of a reference city and electricity, refrigeration, mobility and waste treatment are considered constant throughout the year.
The climate zones are obtained using a classification for net zero energy buildings (Nobatek, 2016) based on the Kppen-Geiger classification and on the European heating and cooling indices (EHI, ECI). The European heating and cooling indices are normalized indices, where 100 represents an average European condition. EHI normalization uses 2,600 degree-days, corresponding to an annual average outdoor temperature just above 10°C and the ECI is constructed based on similar principles (Power, 2015). This classification states that there are four prevailing climatic zones in Europe:
• Csa (Zone 1 & 2): temperate with dry, hot summer
• Cfb (Zone 3): temperate without dry season and warm summer
• Dfb (Zone 4): temperate continental/humid continental without dry season and with warm summer
• Dfc (Zone 5): cold, without dry season and with cold summer
In this work, the European zones are referred to as South (1&2), Central East (CEast, 3), Central West (CWest, 4), and North (5) (Figure 2). The geographic parametrization is based on existing literature; possible variations within the defined climatic zones are not addressed in this work.
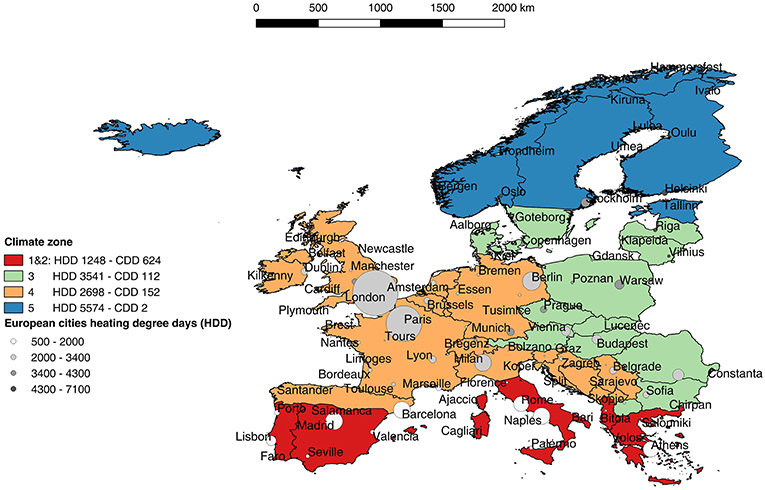
Figure 2. European climate zones.
The second input required for the model is building distribution. Urban centers are considered to include residential and service buildings, where the latter includes administrative, commercial, education, healthcare, hostel, industrial and other non-residential uses. Three renovation stages are considered for both types, namely:
• existing (built before 2005 and not renovated)
• new (built after 2005)
• renovated
A typical urban center building distribution (from the city of Geneva) is used as a reference (Figure 3; Suciu et al., 2018a).
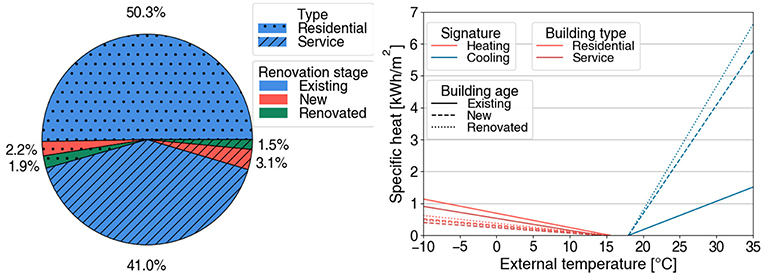
Figure 3. Building distribution of a typical urban center (Left), Heating signatures for different building types and ages (Right).
A series of service energy demands are included in the current sector profile: space heating (SH), domestic hot water (DHW), refrigeration (REF), air cooling (AC), electricity (for utilities) (EL), mobility (Mob), and waste treatment (WT). A heating signature model of a typical urban center is used to evaluate the specific space heating and air conditioning demands (qv, EZ, v = SH/AC [kWh/m2]) (Girardin et al., 2010). However, these demands do not fully represent the demands of an urban center so domestic hot water, electricity, mobility and waste treatment were added to express a more comprehensive list of demands. The model relies on input data for external temperature (Tamb) and two linear regression coefficients (k1 and k2):
with
and
where HDD/CDD represent the number of heating/cooling degree days (Nobatek, 2016) and and the specific heating and cooling demands (SITG, 2018a) and threshold heating/cooling temperatures (Girardin et al., 2010) for the typical urban center and building distribution considered (Geneva, CH) (Figure 3). The values of all parameters are given in Table 2 and the heating and cooling signatures of the different building types and ages are represented in Figure 3.
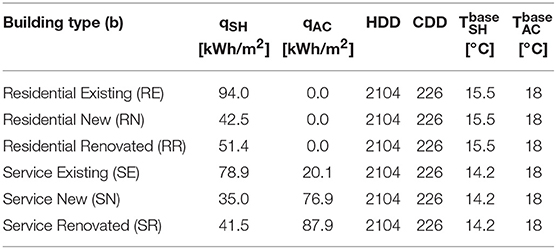
Table 2. Heating signature parameters for typical urban center.
The supply and return temperature calculations for space heating and air cooling are detailed in Supplementary Material section 1. The demand profile for domestic hot water in each time step t requires the specific demand in each European zone (qDHW, EZ [kWh/m2]) (Database, 2017). Real consumption data from a typical urban center ( [kW]) (Swiss Federal Energy, 2015) were used to calibrate Equation (4).
The supply and return temperature for domestic hot water are assumed constant, at C and C (Girardin et al., 2010). A constant consumption profile throughout the year is assumed for refrigeration and electricity (Not including the air conditioning load), and the specific demands (qREF/EL, EZ [kWh/m2]) are considered according to Database (2017). The supply and return temperatures for refrigeration are assumed constant, at C and C (SIA, 2015). The demands per capita ( [kW/cap]) are computed using specific demands (qEZ, b(t) [kWh/m2]), total floor area (Ab [m2], SITG, 2018b), ratio of the different building types (rb [%], SITG, 2018b) and population (Ncap [cap]) of a typical urban center and the number of operating hours (Nhours(t) [h]):
The value of the different parameters are given in Table 3. The mix of building types and ages can be changed, best on data availability.
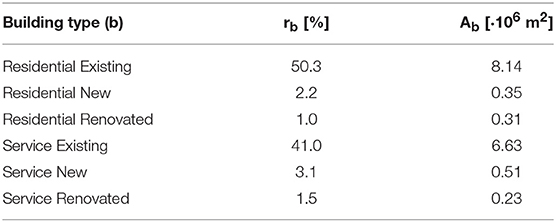
Table 3. Building parameters for a typical urban center.
An average distance (dEZ [km/(cap · y)]) (Database, 2017) is used to assess the energy requirement for mobility. The waste production (mWT, EZ [kg/(cap · y)]) (Hoornweg and Bhada-Tata, 2012) is also provided and a constant profile over the year is assumed. For domestic hot water, refrigeration, electricity, waste treatment and mobility the data sources provide values for all the European countries considered. The values for the different European zones are obtained by averaging the entries of the countries in each respective zone.
The sector profile, the annual average of the demands per capita for different building types, services, and European zones can be found in Table 4 and the composite curves (CCs) for the months of December and July for different European zones are shown in Figures 4A,B. The CCs depict the thermal demands provided by the sector profile, such as the variation in the amount and temperature level of thermal energy demands across the climatic zones.
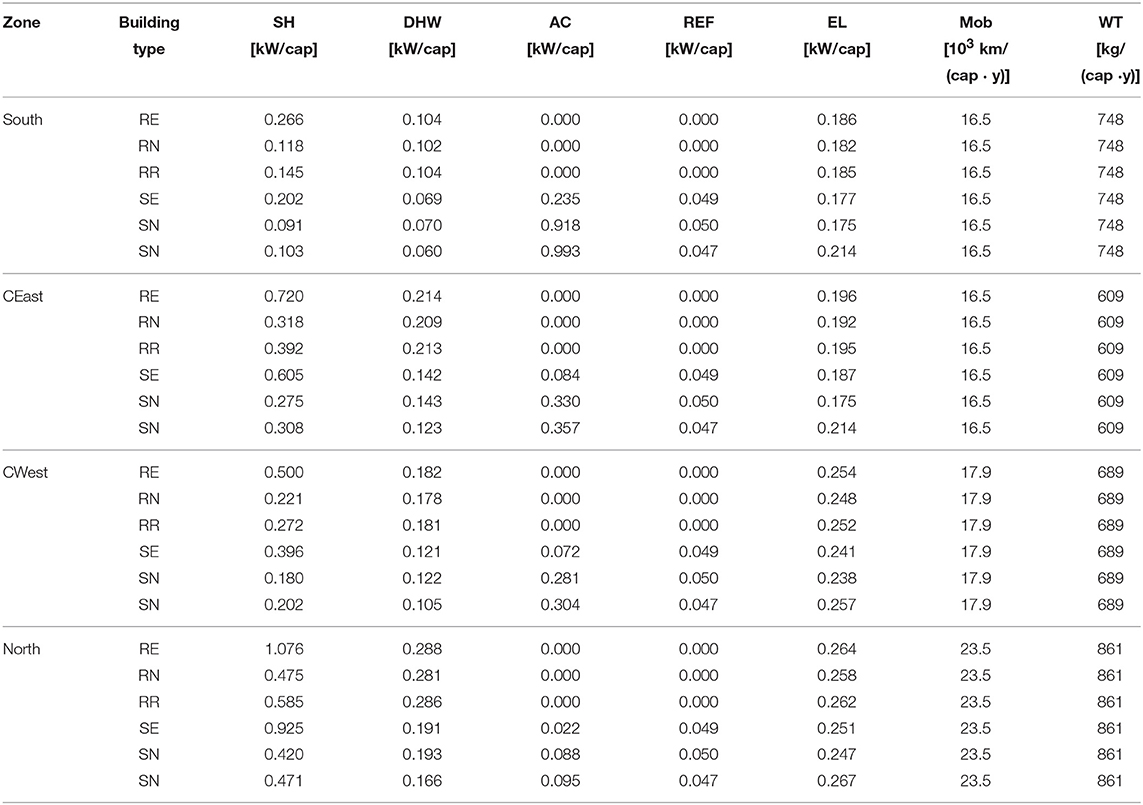
Table 4. Energy demand per capita for different European zones.
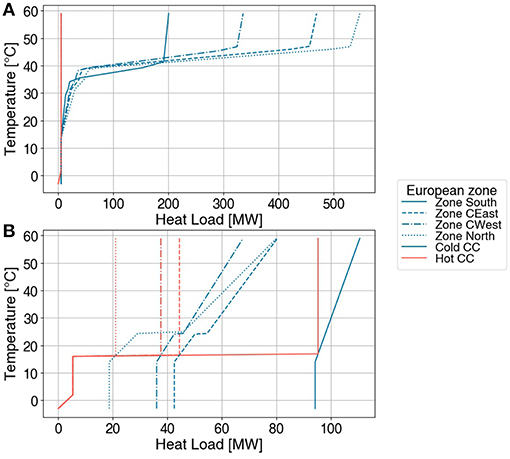
Figure 4. Composite curves (heating and cooling demand) for different European zones. (A) December, (B) July.
3.2. Sector Profile Validation
The residential sector profile presented in section 3 must first be validated before utilization in process integration problems. Validation was previously completed using the city of Geneva, CH (Suciu et al., 2018b), but should be performed for other cities as well to ensure broad applicability and replicability. Thus, validation is also completed here for the city of Rotterdam, NL, which is the location of the case study for this work. Such validation requires the real energy demand of Rotterdam from Ministry of Infrastructure and Water Monitor Climate (2018) to compare well with the demand obtained using the sector profile. Figure 5 displays the quantities of resources consumed for each energy service (e.g., heating, utilities, mobility) based on data gathered from Rotterdam, while Figure 5 shows the corresponding results obtained using the sector profile. The Sankey diagrams show service demands on the right and the supply for these services on the left; thus, the current demand for heating in Rotterdam is 5077 MWh annually and is supplied by natural gas, oil, central heating and electricity according to the source mix shown in Figure 5. Overall, the energy service profile obtained using the proposed sector profile is very similar to the real energy consumption profile of Rotterdam (Ministry of Infrastructure and Water Monitor Climate, 2018). Deviations for different services vary between 3% for electricity and 8% for mobility using monthly aggregated data. The real consumption profile shows lower energy consumption for mobility since the average distance per inhabitant per year is 16,666 km (Centraal Bureau voor de Statistiek, 2016) in Rotterdam, compared to the average western European value of approximately 18,000 km. The real consumption profile also shows higher energy consumption for heating, which is attributed to the average ambient temperature of Rotterdam being lower than the western European average. The profile is therefore validated using monthly aggregate values, hourly or daily variations require finer data resolution which were not available, but will be considered for future work in the event that such data are made available.
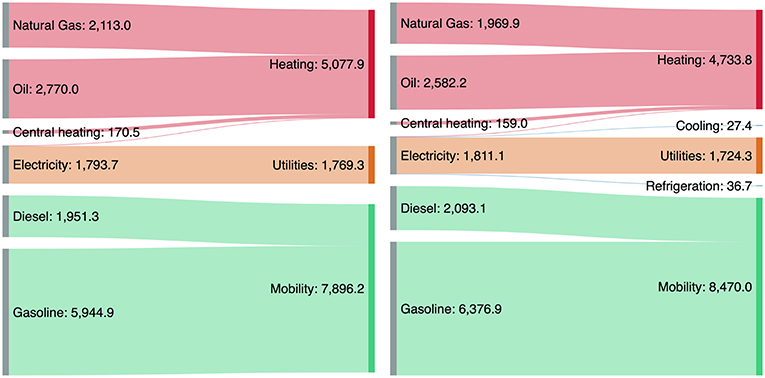
Figure 5. Real profile resource consumption in Rotterdam [MWh] (Left), Sector profile resource consumption in Rotterdam [MWh] (Right).
3.3. MILP Formulation
The profile is suited for finding the best energy technologies to supply the required services. This can be achieved using process integration techniques based on a mixed-integer linear programming (MILP) formulation (Maréchal and Kalitventzeff, 1998).
3.3.1. Definition of sets
The problem is defined using discrete monthly time intervals, t ∈ T = {1, 2, .., 12} ,related to the data availability for city of Rotterdam. Provided finer-resolution data, the temporal aspects of the model are easily adapted. The system to be optimized is represented through a number of units, belonging to the set U. The units are grouped in two subsets: the set of utility units (UU = {e.g., boilers, refrigeration cycles, electrical heaters, heat pumps, heat exchangers, CHPs, PV panels, ST panels}) and the set of process units (PU = {urban demands: space heating, domestic hot water, air cooling, refrigeration, electricity for utilities, mobility, waste treatment; industrial processes: oil refinery, cement production, beer production}). The process units represent production demands and hence have a fixed size, while the utility units are technologies which satisfy the demand, with variable sizes, which are to be optimized. Units supply, demand, or convert resources (r ∈ R) (electricity and material) and heat (at different temperature intervals k ∈ K).
3.3.2. Objective function and constraints
The problem uses different objective functions, such as minimization of operating cost (Equation 6), minimization of investment cost (Equation 7) or minimization of environmental impact (Equation 8). Economic calculations account for fixed () and variable () operating costs, investment costs and environmental impacts. The environmental impact indicator considered in this work is overall greenhouse gas emissions. Emissions are based on background databases for the resources which satisfy energy demands of the city and industrial sites (i.e., electricity and fossil fuels). The additional terms involved in the objective functions are the integer (yu,t, yu) variables which dictate the usage of each unit, the continuous variables (fu,t, fu) which determine the size of a unit in each time step t, and the operating time parameter ().
ϵ-constraints (Haimes, 1971) on operating cost (Equation 9), investment cost (Equation 10) and environmental impact (Equation 11) are used to systematically generate multiple solutions to the integration problem.
The main constraints of the problem include the energy conversion technology sizing and selection. Equations (12a) and (12b) set the size of the unit in each time smaller than the purchase size of the equipment. Equation (12c) ensures that the purchase size of the equipment is between the minimum and maximum boundaries set (), and Equations (12d) and (12e) fix the size of the process units (pu).
The heat cascade equations ensure that heat is transferred from higher temperature intervals to lower temperature intervals and close the energy balance in each temperature interval k (Equation 13a). This is achieved using the residual heat , which cascades excess heat from higher temperature intervals (k) to lower temperature intervals (k − 1). The minimum residual heat is zero, where heat cannot be transferred from the corresponding temperature interval to lower ones (Equation 13b). Similarly, residual heat in the first interval () is zero, as lower temperature intervals do not exist to accept a transfer of heat. Logically, heat cannot be cascaded to the kth interval as it is the highest, so is also zero (Equation 13c). represents the reference heat load of a unit u in time step t and temperature interval k.
For each unit u, the supply and the demand of a specific resource r ∈ R are computed (Equation 14a, 14b) and the balance of each resource is closed for each time step t (Equation 14c).
Where and are the reference supply and demand flows of the unit. The modifications which arise in the MILP formulation when considering heat losses due to heat exchange between industrial plants and the urban district network are presented in Supplementary Material section 2.
3.4. City Service Optimization Scenarios
The sector profile is validated using a typical European urban center, namely the city of Rotterdam (Ncap= 630,000, climate zone: Central West), using a monthly resolution. The utilization of the sector profile is exemplified using:
• Scenario 1: the existing water/air-based district energy network;
• Scenario 2: an improved water/air-based network;
• Scenario 3: a potential low-temperature, refrigerant-based DHC network;
• Scenario 4: an improved refrigerant-based network.
The first scenario assesses the current system using water and air as the main heat transfer fluids. In this case, two independent loops are used: a water loop for heating at 90°C and an air loop for cooling at 25°C. This network uses a mix of natural gas boilers, oil boilers, electrical heaters, and centralized district heating to provide heating services, refrigeration cycles to provide cooling services, and a mix of diesel and gasoline for mobility (Figure 6).
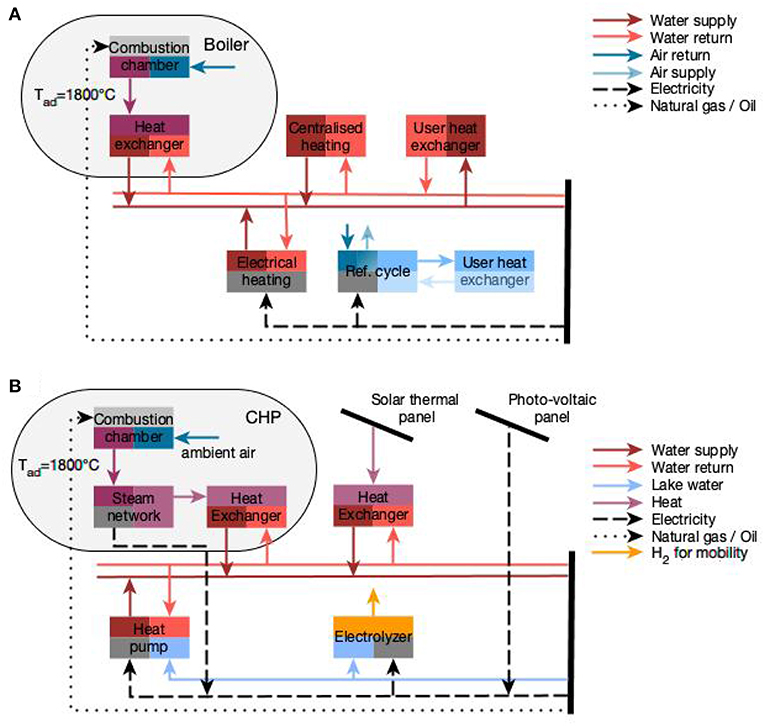
Figure 6. Schematic description scenario 1 (A) and scenario 2 (B).
The second scenario is also based on the current system, using water and air as the main heat transfer fluids. It includes all utilities present in the first scenario, but optional additional technologies such as heat and power co-generation (CHP) units, heat pumps (HPs) using lake water as a heat source, solar thermal (ST) panels, photovoltaic (PV) panels and electrolyzers which produce hydrogen for mobility. The additional utilities are represented schematically in Figure 6.
The third scenario includes a potential future district energy network using CO2 as the principle heat transfer fluid. This network has a single loop: a vapor line at 15°C and a liquid line at 13°C. Unlike water-based networks, CO2 networks use phase change to realize heat transfer, and allow cooling applications to provide heating which cannot be accomplished with independent loops. Weber and Favrat (Weber and Favrat, 2010) introduced the idea of distributing CO2 in district energy networks at an intermediate temperature, below the critical pressure of 74 bar. A pressure of 50 bar is selected for the system to stay in the saturation temperature range of 12–18°C, as the system can take advantage of the small pressure difference between phases to provide cooling services using gas expansion. CO2 networks use on-location heat pumps to provide heating services, heat exchangers (HEs) for cooling, and vapor compression chillers for refrigeration (see Figure 7).
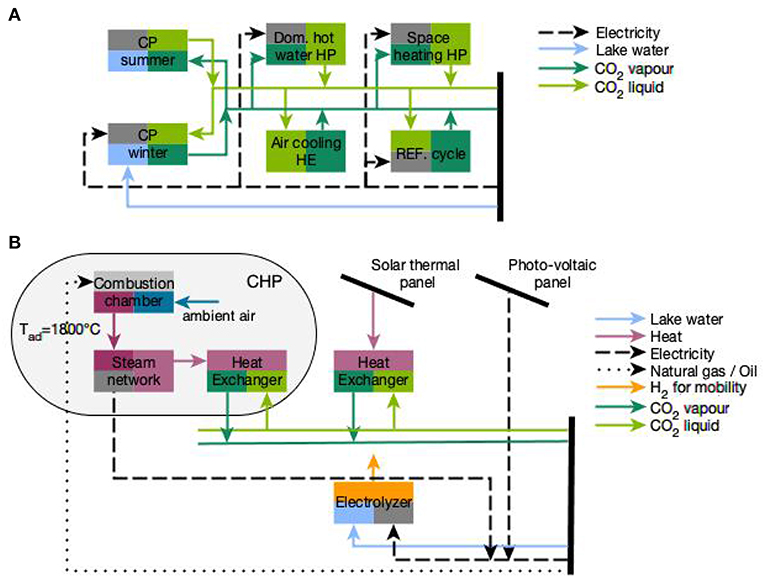
Figure 7. Schematic description scenario 3 (A) and scenario 4 (B).
The fourth scenario is also based on a CO2 district energy network. It comprises all the utilities present in the third scenario, with the addition of technology options discussed for Scenario 2 (solar thermal panels, PV panels and electrolyzers which produce hydrogen for mobility). This scenario is the most flexible representation of potential future energy systems discussed in this work. The additional utilities are represented schematically in Figure 7.
The main assumptions made for the water network are listed in Table 5. Details on the model parameters and efficiencies are given in the Supplementary Material section 3. The price of natural gas and oil are considered according to Swiss Federal Office of Statistics (2015b), the price of central heating and electricity according to Henchoz (2016) and the price of diesel and gasoline according to Swiss Federal Office of Statistics (2015a). The CO2 emissions of the different resources are taken from IPCC (2005).
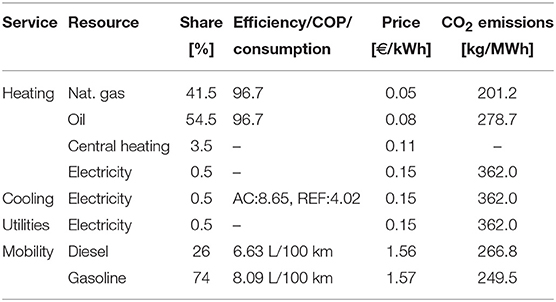
Table 5. Parameters for energy consumption, economic, and environmental analysis.
The CO2 network consumes electricity, with a buying price of 0.15 €/kWh (Henchoz, 2016) and CO2 emissions of 362 kg/MWh (IPCC, 2005). For both networks, a waste boiler is used to incinerate municipal solid waste, and a steam network is integrated to recover the heat of the boiler, produce electricity and deliver heat at lower temperatures. This can be used to provide heating services or vaporize CO2, which is needed for heating in the case of the refrigerant-based network (see Figure S1). Costs related to disruption of service are not included in this work.
3.5. Integration With Industry
The sector profile also encourages exploration of integration opportunities for new technologies and between residential services while also introducing interfaces with external providers such as industrial processes to provide district heating. The case study considered is the city of Rotterdam, Europe's largest port. Its pivotal location in Europe, maritime access, wide range of service providers and excellent connection by inland waterways, rail and road make Rotterdam the port of choice for the world's leading (petro-) chemical and energy companies. Among the industries present in the port, this work considers oil refineries, cement manufacturing and breweries; additionally, studying their integration with the district energy network of the city.
Crude oil refining represents a basic, energy intensive process. Refinery processes require heating to encourage component separation in distillation columns or to provide reactor heating. In parallel, they require cooling to condense vapor streams from distillation columns and cool reactors and product streams. Most refineries use combined heat and power plants to distribute heat to the plant through a steam network, while co-generating electricity (which is used by other on-site equipment). Four refineries from the port of Rotterdam are taken into account, namely Shell, Esso, Gunvor and BP Raffinaderj. Their annual flows (Port of Rotterdam Authority, 2016) and Manhattan distance (i.e., the sum of the vertical and horizontal distances between two points) from the district are given in Table 6. The thermal profiles of the refineries were considered according to Kantor et al. (2018) and a sample one (the profiles scale with the production rate) is displayed in Figure 8A.
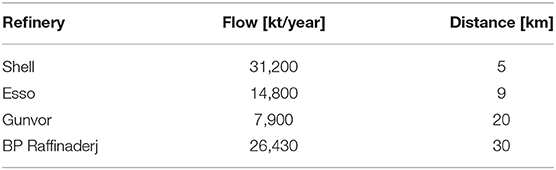
Table 6. Refinery yearly flow and distance from the district.
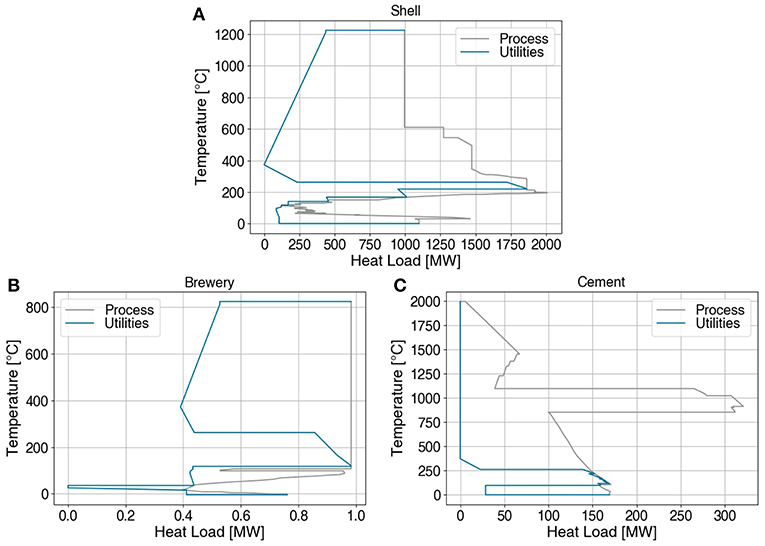
Figure 8. Integrated composite curves of the Shell refinery (A), brewery (B), and cement (C) plants.
The main process in cement production is the production of clinker, typically consisting of two processes, namely pre-calcination and pyro-processing. The former implies heating the raw material from 50°C to 850°C, the temperature at which the calcination reaction takes place. The latter consists of further heating the calcined material to 1450°C where a chemical reaction transforms the material into clinker. The thermal requirement of the processes is generally satisfied using external fuels, such as coal, dry sewage sludge, or by-products coming from municipal or industrial waste. Cement plants also require electricity to drive the kiln, mills and blowers. The heat profile of the plant was taken from Kantor et al. (2018) and the cement flow according to AG (2017) (four cement plants are considered, one at each location where a refinery exists). As seen in Figure 8B, large quantities of waste heat are available, which provide opportunities for process integration and symbiosis between plants and with the nearby district.
Beer production converts a mixture of grains, water and hops (raw materials) into beer (product) through a series of sub-processes, such as cooking, filtering, and fermentation. The sub-processes require heat for cooking and cooling for fermentation and conditioning. The temperature-enthalpy profile of the beer production process is taken from Klemes (2013) and represented in Figure 8C for a production rate of 70 L/(cap · year) (The Brewers of Europe, 2017). Since brewing has a low process pinch temperature, it can receive heat from the other industrial plants; therefore, the brewery competes with other low-temperature demands, such as the district, to obtain excess heat from the other industries.
Figure 9 schematically represents the location of the industrial plants considered and the interaction between the different industries and the district energy network of the city. The figure also depicts allowable heat transfers, taking one location with a refinery and cement plant as an example. For the scenarios considered here, cement plants may transfer heat to any heat consumer, refineries can transfer heat to the brewery and/or district while the brewery and district cannot transfer heat to any of the other plants. As observed in Figure 9, the industrial plants are not always in close proximity to the city, the consequences of which (i.e., resulting heat losses and profitability of heat transfer between locations) are also analyzed in this paper.
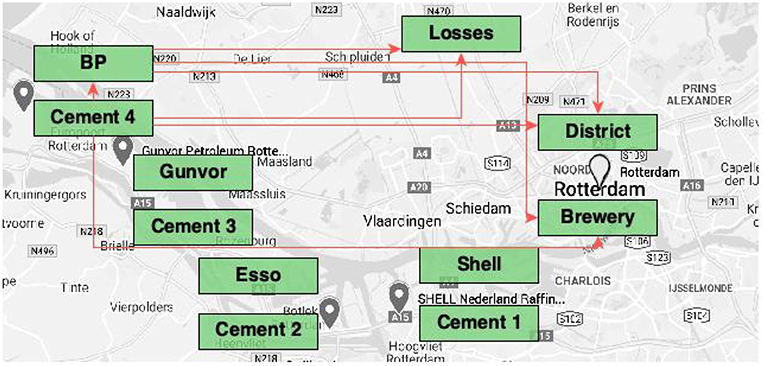
Figure 9. Schematic description of brewery and cement plants interaction with DHC network.
4. Results and Discussion
4.1. Single-Objective Optimization of City Service Provision
The single-objective optimization is performed in order to compare different scenarios and study the impact of sequentially adding new technologies, i.e., advanced water network technologies, base case and advanced CO2 network technologies. With the demand values obtained using the validated sector profile model, utility integration was performed using process integration techniques.
First, total cost optimization is performed in each scenario (Figure 10). The second set of utilities causes the system to shift toward electrical consumption, investing partially in air-water heat pumps for heating and electrolyzers for mobility, reducing both CO2 emissions and operating cost. Investments are not made for PV panels, since the savings in operating cost do not compensate for the investment cost. In the third scenario, the heating/cooling services are provided by the CO2 DHC network, while the mobility demand is satisfied using diesel and gasoline. The operating cost and environmental impact of this scenario are lower compared to the baseline, but the operating cost is higher than in the second scenario. Finally, in the last scenario, the best system includes investments in CO2 heat pumps for heating/cooling and electrolyzers for mobility. This scenario leads to reductions in operating cost and CO2 emissions of 48% and 29%, respectively, compared to the first scenario and has an internal rate of return (Alchian, 1955) of 36% and a net present value (Ross, 1995) of 6625 M€, showing the economic profitability of this scenario.
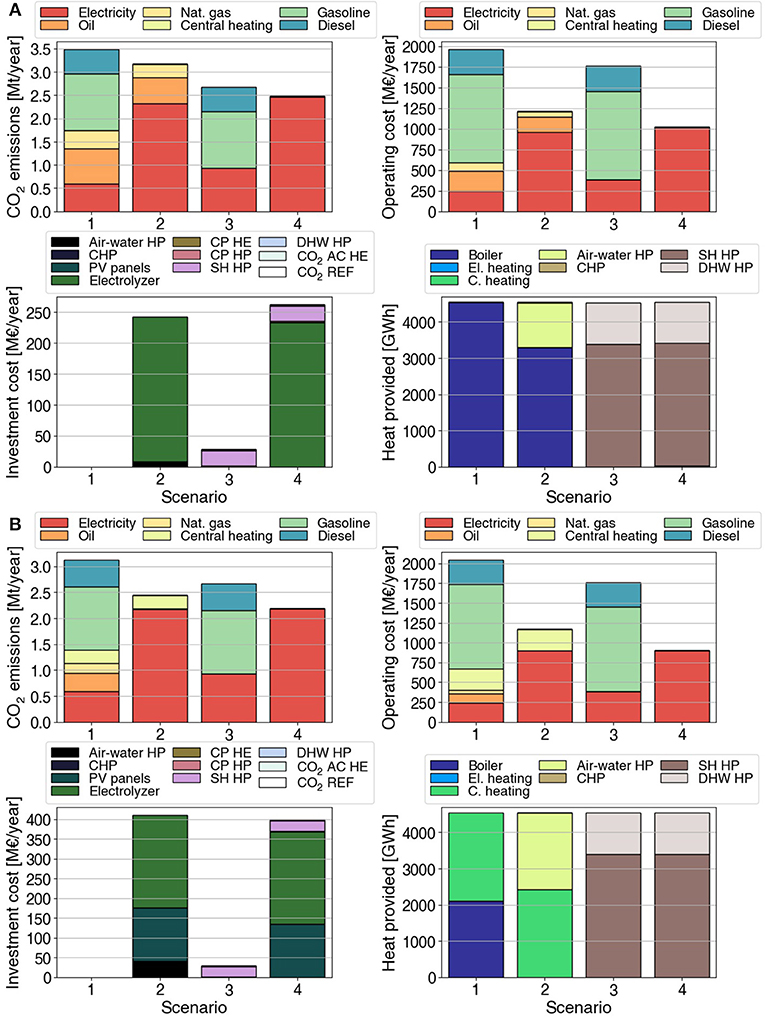
Figure 10. Total cost optimization for different scenarios (A), Environmental impact optimization for different scenarios (B).
Next, an environmental impact optimization is performed (Figure 10). The main distinctions from the previous case are that the system invests in PV panels and that central heating emerges as a preferred way of providing heating services, due to its low environmental impact, since it consists mainly of waste heat available in the district area. The most economic scenario is still scenario 4, with an internal rate of return of 29% and a net present value of 7256 M€.
4.2. Optimal Solutions for Multiple Objectives
Although single-objective optimization provides a single, best solution for a given problem, this optimal solution might not be practically feasible since mathematical formulations overlook some constraints related to implementation. Hence, parametric optimization with constraints (ϵ-constraints) on investment cost and CO2 emissions is used to systematically create a set of optimal solutions and therefore provide insight into the cost of reducing emissions, and in parallel, providing the best environmental impact reduction solutions with various cost limits. The objective function in the case of the environmental impact ϵ-constraints is the minimization of the investment cost. In this case, as the CO2 emissions are allowed to increase, the system gradually shifts from a fully electric CO2 network and electrolyzer-based system to diesel and gasoline mobility, central heating and finally natural gas and oil boilers (Figure 11).
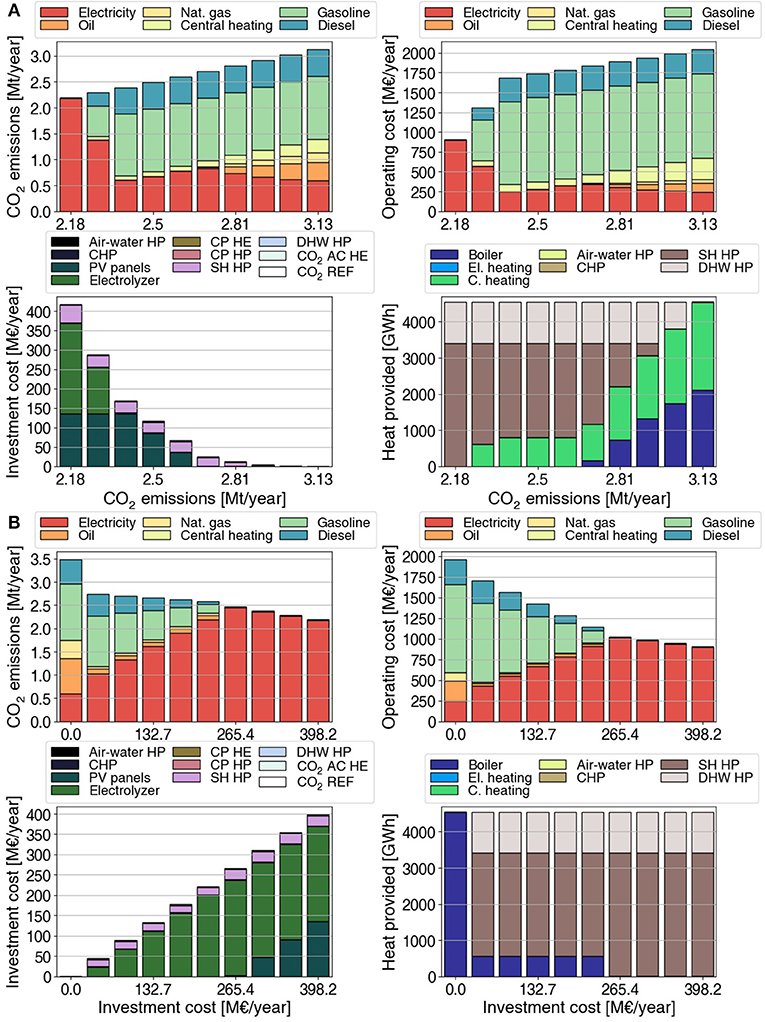
Figure 11. Key performance indicators for CO2 emission ϵ-constraints (A) and for investment cost ϵ-constraints (B).
With investment cost ϵ-constraints, the objective function was minimization of operating cost. As observed in Figure 11, as the investment cost increases, the best solutions are to invest in CO2 heat pumps, electrolyzers for hydrogen mobility and PV panels. The switch to full electrical mobility is more gradual than with environmental impact ϵ-constraints and central heating is not favored in this case, since it is not advantageous from the operating cost perspective.
Finally, a double ϵ-constraint optimization is performed. The constraints are applied on operating cost and environmental impact and the objective function is minimum investment cost. As observed in Figure 12, low investment cost and high operating cost solutions lead to a high environmental impact, while high investment cost and low operating cost solutions have a low environmental impact. Additionally, it is observed that with only 25% of the maximum investment, the operating cost and environmental impact can be reduced by more than 15%.
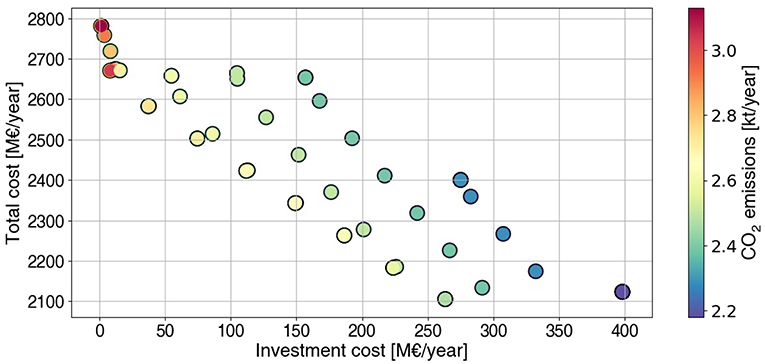
Figure 12. Key performance indicators for operating cost and environmental impact ϵ-constraints.
4.3. Industrial Symbiosis and District Heating
This section assesses integration between the district heating and cooling network with various nearby industrial plants. The integration was first studied by individually considering the plants at each location and their integration with the brewery and district. Figure 13 schematically shows the location of each refinery/cement plant couple and the heat flows between them, the DHC network and the brewery. Figure 14 displays the integrated composite curves of each process for the different cases. The amount of heat transferred is also shown in more detail in Figure S5. For the first two locations (closest to the city), heat is transferred from the refinery and cement plant to the district, while for the last two locations (furthest from the city), heat integration is principally observed between the refinery and cement plant due to heat losses over longer distances. Since the industrial price of natural gas is lower, heat is not transferred to the brewery and the priority is given to the district to achieve the largest reduction in operating cost.
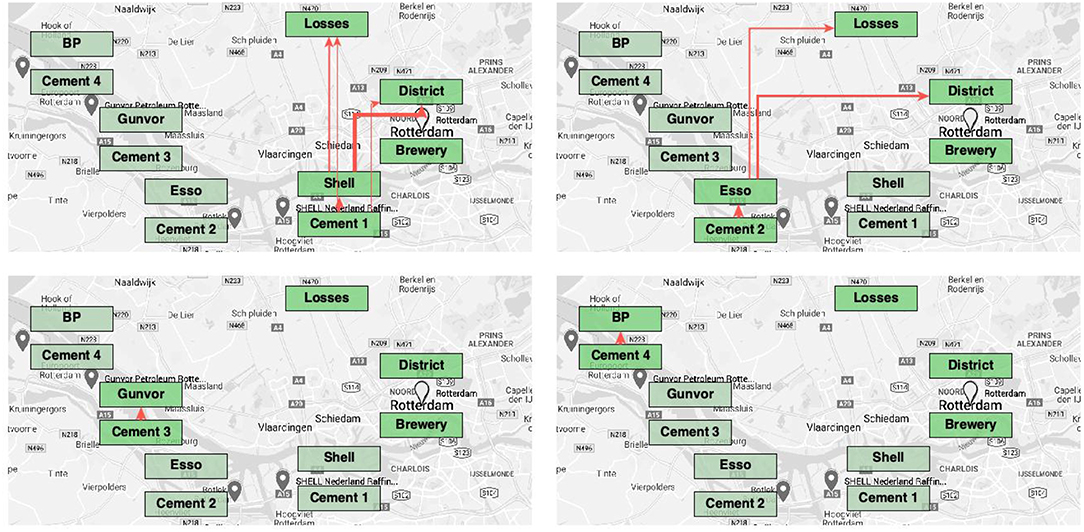
Figure 13. Heat transfer and losses, refinery/cement plant couples considered individually.
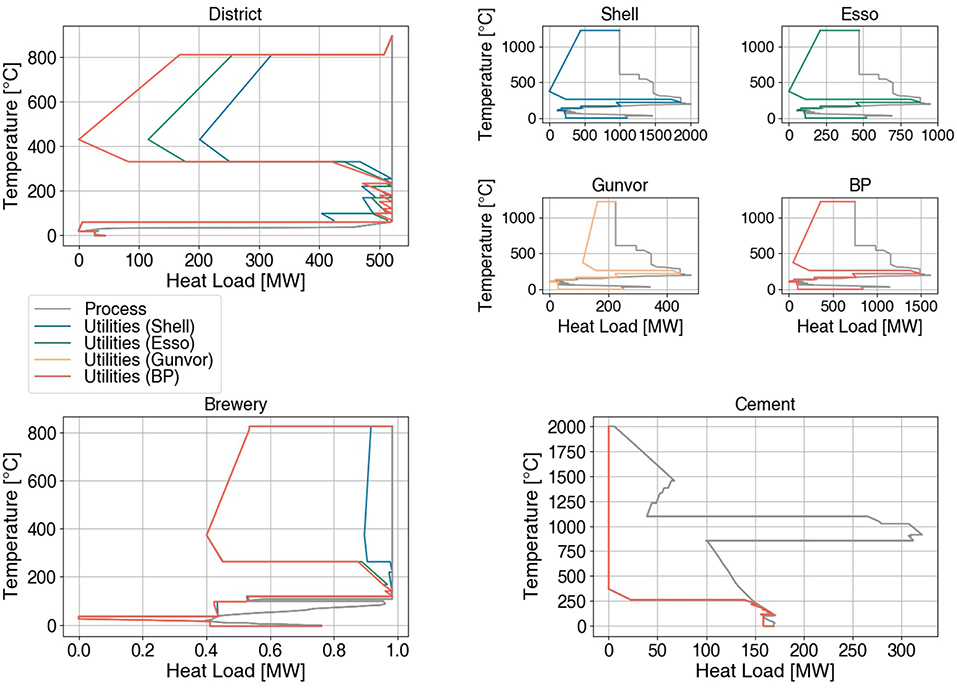
Figure 14. Integrated composite curve of the processes considered, refinery/cement plant couples considered individually.
The impact of heat integration on the operating cost and environmental impact of the district is shown in Figure 15. 1 bar steam generation from waste heat is activated on the Shell and Esoo refinery sites to share heat with the district. The integration with the Shell refinery leads to operating cost and CO2 emission reductions of 4% and 8%, respectively; integration with the Esso refinery leads to operating cost and CO2 emission reductions of 6% and 13%, respectively; the last two locations have almost no heat integration with the district and thus yield no improvement.
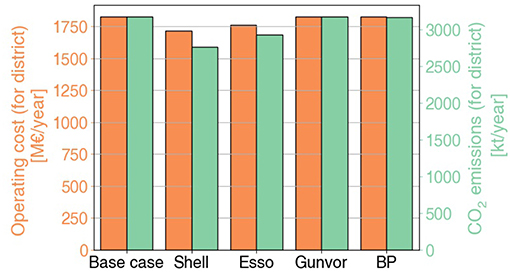
Figure 15. Operating cost and CO2 emissions, refinery/cement plant couples considered individually.
To assess the impact of expanding the system boundary, the refineries and cement plants were added sequentially, starting with the closest and ending with all four plants included in the optimization problem. The detailed results are shown in Supplementary Material section 4. Also in this case, the cement and refinery plants located closest to the district transfer more heat to the district and to the brewery, while those located further away mostly exchange heat within the location.
Overall, industrial waste heat recovery for district heating is advantageous, especially when the industrial plants are located close to the city. However, an analysis which includes piping cost and pumping electricity is needed in order to have a full picture of the maximum distance between industry and district which makes heat integration profitable.
5. Conclusions
This paper aims at providing a residential energy and service sector profile for any city in Europe, which gives an estimate of demands for heating in the form of space heating and domestic hot water, cooling in the form of air conditioning and refrigeration, mobility, waste treatment, and electricity for utilities. The sector profile is thus purpose-built for analysing the best set of technologies to provide services required by urban populations.
The profile is validated using a typical European city, the city of Rotterdam. Deviations between the real demand and proposed profile vary between 3 and 8% for the different services, showing the differences between the Dutch energy consumption profile and the western European average. The functionality and effectiveness of the profile is illustrated comparing an existing water/air based district energy network, an advanced water/air-based network, a potential low-temperature CO2-based DHC network and an advanced low-temperature CO2-based network. Changing objectives yields different solutions for providing urban services, though consistent results show good performance with a fully electrical system both for heating and for mobility, potentially reaching zero CO2 emissions, given a renewable electricity mix. The proffered scenario is also the most economically profitable, with an internal rate of return of 36% and a net present value of 6625 M€.
Utilization of the residential sector profile for integrating new technologies and finding the best energy technologies is also exemplified by performing parametric optimization on the system. These results show that significant operating cost and environmental impact reductions of 15% can be achieved with only 25% of the investment required for maximum emission reductions.
Finally, the residential sector profile was used to assess integration opportunities between an urban center and typical industries in the surroundings. A brewery and four refinery/cement plant couples in the area were integrated for this purpose. The results show that industries located at 5 km and 9 km transfer heat to the district energy network, reducing its operating cost by as much as 9% and environmental impact by up to 20%, while industrial plants located further afield only integrate with each other, as heat losses are too large over long distances for profitable exchanges.
Further steps include a sensitivity analysis of the results on input parameters, such as buying/selling price of electricity and natural gas and investment cost parameters of the technologies. Further investigation which accounts for pumping electricity and piping cost is also needed to assess the details of industrial heat integration with district heating networks. Building similar sector profiles for all energy-intensive sectors would provide a complete set of tools for future modeling of energy efficient cities/countries.
Data Availability
All datasets generated for this study are included in the manuscript and/or the Supplementary Files.
Author Contributions
RS, IK,HB, and FM: conceptualization and visualization. RS: data curation and writing - original draft. RS and HB: formal analysis and software. FM: funding acquisition, project administration, and resources. RS, IK, and HB: investigation, methodology, validation, and writing - review and editing. IK, HB, and FM: supervision.
Funding
This project is carried out with the financial support of the Swiss Innovation Agency (Innosuisse - SCCER program) and EOS Holding. This project has received funding from the European Union's Horizon 2020 research and innovation programme under grant agreement No. 679386. This work was supported by the Swiss State Secretariat for Education, Research and Innovation (SERI) under contract number 15.0217.
Conflict of Interest Statement
The authors declare that the research was conducted in the absence of any commercial or financial relationships that could be construed as a potential conflict of interest.
Acknowledgments
This project is carried out within the frame of the Swiss Centre for Competence in Energy Research on the Future Swiss Electrical Infrastructure (SCCER-FURIES) with the financial support of the Swiss Innovation Agency (Innosuisse - SCCER program). The authors would also like to acknowledge the financial support from EOS Holding and thank Mr. Ton Wurth from Stedin.net, part of Stedin Group, NL for the data provided on Rotterdam for the sector profile validation.
Supplementary Material
The Supplementary Material for this article can be found online at: https://www.frontiersin.org/articles/10.3389/fenrg.2019.00069/full#supplementary-material
References
Ajah, A., Mesbah, A., Grievink, J., Herder, P., Falcao, P., and Wennekes, S. (2008). On the robustness, effectiveness and reliability of chemical and mechanical heat pumps for low-temperature heat source district heating: a comparative simulation-based analysis and evaluation. Energy 33, 908–929. doi: 10.1016/j.energy.2007.12.003
Ajah, A. N., Patil, A. C., Herder, P. M., and Grievink, J. (2007). Integrated conceptual design of a robust and reliable waste-heat district heating system. Appl. Ther. Eng. 27, 1158–1164. doi: 10.1016/j.applthermaleng.2006.02.039
Alchian, A. A. (1955). The rate of interest, fisher's rate of return over costs and keynes' internal rate of return. Am. Econ. Rev. 45, 938–943.
Almeida, M. A., Schaeffer, R., and La Rovere, E. L. (2001). The potential for electricity conservation and peak load reduction in the residential sector of brazil. Energy 26, 413–429. doi: 10.1016/S0360-5442(00)00071-2
Becker, H., and Maréchal, F. (2012). Energy integration of industrial sites with heat exchange restrictions. Comput. Chem. Eng. 37, 104–118. doi: 10.1016/j.compchemeng.2011.09.014
Bendig, M., Maréchal, F., and Favrat, D. (2013). Defining “waste heat” for industrial processes. Appl. Ther. Eng. 61, 134–142. doi: 10.1016/j.applthermaleng.2013.03.020
Boardman, B. (2004). Achieving energy efficiency through product policy: the uk experience. Environ. Sci. Policy 7, 165–176. doi: 10.1016/j.envsci.2004.03.002
Bungener, S., Hackl, R., Van Eetvelde, G., Harvey, S., and Marechal, F. (2015). Multi-period analysis of heat integration measures in industrial clusters. Energy 93, 220–234. doi: 10.1016/j.energy.2015.09.023
Cunningham, P. (2002). Waste heat/cogen opportunities in the cement industry. Cogenerat. Compet. Power J. 17, 31–51. doi: 10.1092/BJMW-P3Q1-GHRF-YAB3
da Graça Carvalho, M. (2012). EU energy and climate change strategy. Energy 40, 19–22. doi: 10.1016/j.energy.2012.01.012
Department for Communities and Local Government (2010). English House Condition Survey 2007: Technical Report. Department for Communities and Local Government. OCLC: 912938925.
Fels, M. F. (1986). Prism: an introduction. Energy Build. 9, 5–18. doi: 10.1016/0378-7788(86)90003-4
Fischer, D., Wolf, T., Scherer, J., and Wille-Haussmann, B. (2016). A stochastic bottom-up model for space heating and domestic hot water load profiles for german households. Energy Build. 124, 120–128. doi: 10.1016/j.enbuild.2016.04.069
Fung, A. S. L. (2003). Modeling of national and regional residential energy consumption (PhD thesis). Dalhousie University, Halifax, NS, Canada.
Gebremedhin, A., and Moshfegh, B. (2004). Modelling and optimization of district heating and industrial energy system an approach to a locally deregulated heat market. Int. J. Energy Res. 28, 411–422. doi: 10.1002/er.973
Ghedamsi, R., Settou, N., Gouareh, A., Khamouli, A., Saifi, N., Recioui, B., et al. (2016). Modeling and forecasting energy consumption for residential buildings in algeria using bottom-up approach. Energy Build. 121, 309–317. doi: 10.1016/j.enbuild.2015.12.030
Girardin, L., Marechal, F., Dubuis, M., Calame-Darbellay, N., and Favrat, D. (2010). EnerGis: a geographical information based system for the evaluation of integrated energy conversion systems in urban areas. Energy 35, 830–840. doi: 10.1016/j.energy.2009.08.018
González-Bravo, R., Ponce-Ortega, J. M., and El-Halwagi, M. M. (2017). Optimal design of water desalination systems involving waste heat recovery. Indust. Eng. Chem. Res. 56, 1834–1847. doi: 10.1021/acs.iecr.6b04725
Haas, R., and Schipper, L. (1998). Residential energy demand in OECD-countries and the role of irreversible efficiency improvements. Energy Econ. 20, 421–442. doi: 10.1016/S0140-9883(98)00003-6
Haimes, Y. (1971). On a bicriterion formulation of the problems of integrated system identification and system optimization. IEEE Trans. Syst. Man Cybern. 1, 296–297. doi: 10.1109/TSMC.1971.4308298
Henchoz, S. (2016). Potential of refrigerant based district heating and cooling networks (PhD thesis). Ecole Polytechnique Federale de Lausanne, Lausanne, Switzerland.
Hoornweg, D., and Bhada-Tata, P. (2012). What a Waste: A Global Review of Solid Waste Management, Urban Development Series, Knowledge Papers no. 15. Washington, DC: World Bank. Available online at: https://openknowledge.worldbank.org/handle/10986/17388
International Energy Agency (2018). World Energy Balances 2018. Organization for Economic. OCLC: 1054217453.
IPCC (2005). Safeguarding the Ozone Layer and the Global Climate System: Issues Related to Hydrofluorocarbons and Perfluorocarbons, IPCC/TEAP Special Report. Technical report.
Johnson, I., Choat, B., and Dillich, S. (2008). Waste Heat Recovery: Opportunities and Challenges. Minerals. New Orleans, LA: Metals and Materials Society.
Kamal, W. (1997). Improving energy efficiency–the cost-effective way to mitigate global warming. Energy Conver. Manag. 38, 39–59. doi: 10.1016/0196-8904(96)00012-X
Kantor, I., Wallerand, A. S., Kermani, M., Bütün, H., Santecchia, A., Norbert, R., et al. (2018). “Impact of Energy Systems, Guimaraes, Portugal, 2018. Presented at: 31st International Conference on Efficiency, Cost, Optimization, Simulation and Environmental Impact of Energy Systems (Guimaraes).
Karamarković, V., Marašević, M., Karamarković, R., and Karamarković, M. (2013). Recuperator for waste heat recovery from rotary kilns. Appl. Ther. Eng. 54, 470–480. doi: 10.1016/j.applthermaleng.2013.02.027
Karlsson, M., and Wolf, A. (2008). Using an optimization model to evaluate the economic benefits of industrial symbiosis in the forest industry. J. Clean. Product. 16, 1536–1544. doi: 10.1016/j.jclepro.2007.08.017
Kavgic, M., Mavrogianni, A., Mumovic, D., Summerfield, A., Stevanovic, Z., and Djurovic-Petrovic, M. (2010). A review of bottom-up building stock models for energy consumption in the residential sector. Build. Environ. 45, 1683–1697. doi: 10.1016/j.buildenv.2010.01.021
Klemes, J. J. (ed.). (2013). Handbook of Process Integration (PI): Minimisation of Energy and Water Use, Waste and Emissions. Number number 61 in Woodhead publishing series in energy. Oxford; Cambridge; Philadelphia, PA; New Delhi: Woodhead Publishing.
Lenzen, M., Wier, M., Cohen, C., Hayami, H., Pachauri, S., and Schaeffer, R. (2006). A comparative multivariate analysis of household energy requirements in australia, brazil, denmark, india and japan. Energy 31, 181–207. doi: 10.1016/j.energy.2005.01.009
Maréchal, F., and Kalitventzeff, B. (1998). Process integration: selection of the optimal utility system. Comput. Chem. Eng. 22, S149–S156. doi: 10.1016/S0098-1354(98)00049-0
Meyers, S., McMahon, J. E., McNeil, M., and Liu, X. (2003). Impacts of us federal energy efficiency standards for residential appliances. Energy 28, 755–767. doi: 10.1016/S0360-5442(02)00188-3
Miller, E. J., Hunt, J. D., Abraham, J. E., and Salvini, P. A. (2004). Microsimulating urban systems. Comput. Environ. Urban Syst. 28, 9–44. doi: 10.1016/S0198-9715(02)00044-3
Ministry of Infrastructure and Water Monitor Climate (2018). Climate Monitor Databank Netherlands. Technical report.
Miró, L., Brueckner, S., and Cabeza, L. F. (2015). Mapping and discussing industrial waste heat (iwh) potentials for different countries. Renewable Sustain. Energy Rev. 51, 847–855. doi: 10.1016/j.rser.2015.06.035
Morelli, N. (2001). Technical innovation and resource efficiency. A model for australian household appliances. J. Sustain. Product Design 1, 3–17. doi: 10.1023/A:1014417826656
Pérez-Lombard, L., Ortiz, J., and Pout, C. (2008). A review on buildings energy consumption information. Energy Build. 40, 394–398. doi: 10.1016/j.enbuild.2007.03.007
Port of Rotterdam Authority (2016). Over 120 Industrial Companies. One Powerful Cluster. Make It Happen. Technical report.
Power, E. (2015). ECOHEATCOOL, Work Package 1, the European Cold Market, Final Report. Technical report.
Rivers, N., and Jaccard, M. (2005). Combining top-down and bottom-up approaches to energy-economy modeling using discrete choice methods. Energy J. 26, 83–106. doi: 10.5547/ISSN0195-6574-EJ-Vol26-No1-4
Ross, S. A. (1995). Uses, abuses, and alternatives to the net-present-value rule. Finan. Manag. 24, 96–102. doi: 10.2307/3665561
Shorrock, L., and Dunster, J. (1997). The physically-based model brehomes and its use in deriving scenarios for the energy use and carbon dioxide emissions of the uk housing stock. Energy Policy 25, 1027–1037. doi: 10.1016/S0301-4215(97)00130-4
SIA (2015). Données d'Utilisation des Locaux Pour l'énergie et les Installations du bâtiment (sia 2024). Technical report.
Söğüt, Z., Oktay, Z., and Karakoç, H. (2010). Mathematical modeling of heat recovery from a rotary kiln. Appl. Ther. Eng. 30, 817–825. doi: 10.1016/j.applthermaleng.2009.12.009
Suciu, R., Girardin, L., and Maréchal, F. (2018a). Energy integration of CO2 networks and power to gas for emerging energy autonomous cities in europe. Energy 157, 830–842. doi: 10.1016/j.energy.2018.05.083
Suciu, R., Kantor, I., Butun, H., Girardin, L., and Marechal, F. (2018b). Geographically parameterized residential sector energy and service profile. Chem. Eng. Trans. 70, 709–714.
Summerfield, A. J., Lowe, R. J., and Oreszczyn, T. (2010). Two models for benchmarking UK domestic delivered energy. Build. Res. Informat. 38, 12–24. doi: 10.1080/09613210903399025
Sundberg, G., and Sjödin, J. (2003). Project financing consequences on cogeneration: industrial plant and municipal utility co-operation in sweden. Energy Policy 31, 491–503. doi: 10.1016/S0301-4215(02)00074-5
Svensson, I.-L., Jönsson, J., Berntsson, T., and Moshfegh, B. (2008). Excess heat from kraft pulp mills: trade-offs between internal and external use in the case of sweden part 1: methodology. Energy Policy 36, 4178–4185. doi: 10.1016/j.enpol.2008.07.017
Swan, L. G., and Ugursal, V. I. (2009). Modeling of end-use energy consumption in the residential sector: a review of modeling techniques. Renew. Sustain. Energy Rev. 13, 1819–1835. doi: 10.1016/j.rser.2008.09.033
Swiss Federal Energy (2015). SmartGrid Polysun: Design Tool for Local Load Management. Final Report. Technical report.
Swiss Federal Office of Statistics (2015a). Indice des prix à la Consommation, Carburants - Prix Moyens par Litre en Francs. Technical report.
Swiss Federal Office of Statistics (2015b). Indice des Prix à la Production et à l'Importation. Technical report.
U.S. Energy Information Administration (2011). Annual Energy Review 2011 DOE/EIA-0384(2011). Technical report.
Ueno, T., Sano, F., Saeki, O., and Tsuji, K. (2006). Effectiveness of an energy-consumption information system on energy savings in residential houses based on monitored data. Appl. Energy 83, 166–183. doi: 10.1016/j.apenergy.2005.02.002
Weber, C., and Favrat, D. (2010). Conventional and advanced CO2 based district energy systems. Energy 35, 5070–5081. doi: 10.1016/j.energy.2010.08.008
Wolf, A., and Karlsson, M. (2008). Evaluating the environmental benefits of industrial symbiosis: discussion and demonstration of a new approach. Prog. Indust. Ecol. Int. J. 5:502. doi: 10.1504/PIE.2008.023413
Zhang, L., and Akiyama, T. (2009). How to recuperate industrial waste heat beyond time and space. Int. J. Exergy 6, 214–227. doi: 10.1504/IJEX.2009.023999
Zhang, Q. (2004). Residential energy consumption in china and its comparison with japan, canada, and USA. Energy Build. 36, 1217–1225. doi: 10.1016/j.enbuild.2003.08.002
Keywords: residential, sector profile, district energy service, CO2 network, heat recovery, process integration, industrial symbiosis, optimization
Citation: Suciu R, Kantor I, Bütün H and Maréchal F (2019) Geographically Parameterized Residential Sector Energy and Service Profile. Front. Energy Res. 7:69. doi: 10.3389/fenrg.2019.00069
Received: 12 March 2019; Accepted: 11 July 2019;
Published: 30 July 2019.
Edited by:
Rangan Banerjee, Indian Institute of Technology Bombay, IndiaReviewed by:
Athanasios I. Papadopoulos, Centre for Research and Technology Hellas, GreeceJeffrey Richard Seay, University of Kentucky, United States
Copyright © 2019 Suciu, Kantor, Bütün and Maréchal. This is an open-access article distributed under the terms of the Creative Commons Attribution License (CC BY). The use, distribution or reproduction in other forums is permitted, provided the original author(s) and the copyright owner(s) are credited and that the original publication in this journal is cited, in accordance with accepted academic practice. No use, distribution or reproduction is permitted which does not comply with these terms.
*Correspondence: Raluca Suciu, raluca-ancuta.suciu@epfl.ch