Blue Urea: Fertilizer With Reduced Environmental Impact
 Justin G. Driver1
  Rhodri E. Owen1
  Terence Makanyire1
  Janice A. Lake2
  James McGregor1
  Peter Styring1*
- 1Department of Chemical and Biological Engineering, UK Centre for Carbon Dioxide Utilization, The University of Sheffield, Sheffield, United Kingdom
- 2Department of Animal and Plant Sciences, The University of Sheffield, Sheffield, United Kingdom
Synthetic nitrogen fertilizers such as urea are a necessity for food production, making them invaluable toward achieving global food security. Conventional manufacture of urea is conducted in centralized production plants at an enormous scale, with the subsequent prilled urea product distributed to the point-of-use. Despite consuming carbon dioxide in the synthesis, the overall process is carbon positive due to the use of fossil feedstocks, resulting in significant net emissions. Blue Urea could be produced using attenuated reaction conditions and hydrogen derived from renewable-powered electrolysis to produce a reduced-carbon alternative. This paper demonstrates the intensified production of urea and ammonium nitrate fertilizers from sustainable feedstocks, namely water, nitrogen, and carbon dioxide. Critically, the process can be scaled-down such that equipment can be housed in a standardized ISO container deployed at the point-of-use, delocalizing production and eliminating costs, and emissions associated with transportation. The urea and ammonium nitrate were synthesized in a semi-continuous process under considerably milder conditions to produce aqueous fertilizers suitable for direct soil application, eliminating the financial and energetic costs associated with drying and prilling. The composition of the fertilizers from this process were found to be free from contaminants, making them ideal for application. In growth studies, the synthesized urea and ammonium nitrate were applied under controlled conditions and found to perform comparably to a commercial fertilizer (Nitram). Crucially, both the synthesized fertilizers enhanced biomass growth, nitrogen uptake and leaf chlorophylls (even in depleted soils), strongly suggesting they would be effective toward improving crop yields and agricultural output. The Blue Urea concept is proposed for installation in ISO containers and deployment on farms, offering a turnkey solution for point-of-need production of nitrogen fertilizers.
Introduction
Nitrogen Fertilizers and Food Security
Synthetic fertilizers are a vital component of intensive agriculture and a necessity for global food production. Removal of nutrients by crops during growth necessitates the use of fertilizers to accelerate soil replenishment and so maintain the productivity of intensive agriculture. Of these, nitrogen fertilizers are especially important since available nitrogen is typically the limiting nutrient that inhibits soils from sustaining intensive crop growth (Yara, 2017). Without such synthetic fertilizers, it has been estimated that food production would only be sufficient to support half the global population (as of 2011) (Dawson and Hilton, 2011). With population growth predicted to continue in the medium- to long-term future (World Bank, 2018), food production is similarly expected to have to increase output. Simultaneously, the economic growth of less developed countries is resulting in more varied and calorie dense diets, similarly demanding higher productivity (Stewart and Roberts, 2012). Because of these challenges, the continued use of synthetic fertilizers within agriculture is expected for the foreseeable future.
Carbon Capture and Utilization
Continued fertilizer demand has further implications since practically all synthetic fertilizers are derived from fossil fuels. Processing of these fuels results in emission of greenhouse gases (GHGs) such as carbon dioxide (CO2), methane (CH4) and nitrous oxide (N2O). Elevated atmospheric concentrations of GHGs have long been of serious concern. Their emission is a major cause of anthropogenic climate change phenomena (such as global warming), leading to environmental catastrophes such as droughts, glacial melting, rising sea levels, ocean acidification, etc. In the case of CO2, for example, current average global concentration is in excess of 410 ppm and, without abatement, is predicted to reach 750 ppm by 2100 (IPCC, 2018), leading to disastrous environmental effects. For this reason, there has been considerable motivation toward the widespread implementation of abatement strategies, including Carbon Capture and Storage (CCS) and Carbon Capture and Utilization (CCU). For CCS, CO2 is captured and stored in geological structures (e.g., depleted oil wells, gas fields, saline aquifers), potentially allowing expedient removal of large amounts of CO2 from the atmosphere (Leung et al., 2014). In contrast, for CCU the captured CO2 is processed into a variety of commercial products (e.g., methane, methanol, formaldehyde, polyurethanes, etc.) that offer an alternative to their fossil-derived equivalents (Styring and Jansen, 2011). Moving forward, it is believed that combined deployment of CCS and CCU (CCUS) (Mission Innovation, 2017) will be essential in order to achieve meaningful CO2 reductions within a sufficiently short timeframe to prevent irreversible damage due to climate change.
Fossil-Derived Urea Fertilizer
Urea occupies an interesting position at the intersection of the points discussed above. It is the most used synthetic nitrogen fertilizer (accounting for more than 70% of worldwide fertilizer usage) (IFA, 2018) and its synthesis consumes CO2 (with production being a well-established CCU process). Conventional manufacture typically occurs in large centralized plants (Meessen, 2010) adjacent to natural gas production facilities, wherein steam reformation of methane produces a syngas composed of hydrogen (H2) and carbon monoxide (CO) (Equation 1), followed by upgrading to increase the yield of H2 and to form CO2 (Equation 2). Following removal of the CO2, the H2 is subsequently reacted with N2 (derived from air separation) to afford ammonia (NH3) (Equation 3) via the Haber-Bosch process (Appl, 2011). Next, NH3 and the previously removed CO2 are reacted to form ammonium carbamate (H2NCOONH4) (Equation 4) which proceeds to form urea (CO(NH2)2) and water (Equation 5) via the Bosch-Meiser process (Meessen, 2010). Finally, this urea product is dried and prilled in order to reduce transportation weight and improve stability during long-term storage. These processes require intensive conditions and whilst heat integration can reduce thermal demand, a portion of the fossil fuel feedstock is typically combusted to provide the deficit. Thus, despite being consumed in the formation of urea, the overall process results in significant net CO2 emissions, as well as CH4 emissions from methane slip during combustion/reformation.
These processes are technologically mature and have undergone decades of optimization to result in accordingly minimized CAPEX and OPEX. Moreover, they further benefit from economy-of-scale effects since production is typically on an enormous scale. Importantly however, an OPEX analysis of 116 ammonia plants by Boulamanti and Moya (2017) found the cost of the fossil fuel feedstock was the single largest factor contributing to total production cost. This is disconcerting since reserves of fossil fuels are both finite and geographically limited, and gradual depletion is certain to decrease security of supply (e.g., decreasing availability, increasing cost, price instability and geopolitical insecurity). This poses a worrying scenario for the future of agriculture, since such concerns will negatively affect production of synthetic fertilizers and thereby endanger food production capacity.
Sustainable Urea Fertilizer
These concerns could be allayed by decoupling fertilizer production from fossil feedstocks, and instead integrating sustainable inputs and renewable energy. Substitution of traditional reformation (Equations 1, 2) processes with electrolysis (Equation 6) powered by surplus renewable energy could generate H2 with neither the fossil feedstocks nor the associated CO2 emissions. After onward processing of this H−2 to NH3, reaction with externally sourced CO2 (Equations 4, 5) conceptually allows the production of urea that is reduced-carbon or even carbon-neutral. Furthermore, whilst the reaction conditions for industrial urea production (Meessen, 2010) are severe (170–220°C, 150 bar) (Barzagli et al., 2011), report a synthetic route with comparatively mild conditions. Their initial step is the co-bubbling NH3 and CO2 through solution at near-ambient conditions (0°C, 1 bar) with their aqueous reaction forming an ammonium carbamate precipitate. This carbamate is then collected and subsequently reacted at relatively attenuated conditions (140°C, 14 bar) to form the urea product with significantly less energetic demand. Combining renewable-powered electrolysis and the synthetic route reported by Barzagli et al. (2011) could produce a urea fertilizer with reduced energetic, financial and environmental costs, referred to herein as “Blue Urea” (owing to the electrolytic origins of the H2).
Since this Blue Urea concept utilizes sustainable inputs (i.e., H-2O, N2 and CO2) the process is less geographically constrained meaning production could instead be distributed across a wider area. Furthermore, production could occur on a reduced-scale sufficient to meet local requirements, with all processing equipment fitted in bespoke ISO containers. The specific scenario considered in this research was a wind turbine located within an agricultural community, which powered on-site production of Blue Urea fertilizer for local farming. Situation of the process within a container and adjacent to the point-of-use theoretically eliminates the financial and environmental costs associated with transportation. Moreover, removal of water weight for transportation is no longer relevant and the urea product can be produced in solution, removing costs associated with prilling. Evidentially, an initial life cycle assessment was conducted on the Blue Urea concept (Villa Zaragoza, 2018), which evaluated the environmental impact relative to conventional production. Owing to the complexity of the problem, this assessment will be presented in a separate publication. Nevertheless, the ultimate finding was that a Blue Urea process conducted with renewable energy and point-source CO2 capture could reduce emissions by approximately 21% compared to the conventional case (or 17% when conducted with direct air capture). From an environmental perspective, this finding validated the Blue Urea concept as a means to reducing GHG emissions from fertilizer production. Indeed, studies of similar systems (particularly for the production of NH3) have generally indicated the possibility of reduced emissions (Morgan et al., 2014; Tallaksen et al., 2015; Bicer et al., 2016; Frattini et al., 2016; Reese et al., 2016).
Research Scope
However, the same studies above also highlight the need for further development in order to improve the technical and economic viability of such processes. Similarly, even with numerous apparent benefits the Blue Urea concept is nevertheless challenged by several limitations. Principal amongst these is the high energy demand of the constituent processes and in particular the electrolytic generation of H2. Despite the integration of renewable energy offering reduced GHG emissions, the increased energy cost means Blue Urea struggles to financially compete with conventional fossil-derived urea. This is compounded by the reduced scale of the Blue Urea process, which does not benefit from economy-of-scale effects like commercial production. Furthermore, the intermittency of renewable power makes integration difficult without the added cost of energy storage systems, necessitating that the processes be highly responsive to input changes. In light of this, the scope of this research was the conceptual demonstration of Blue Urea, encompassing the entire synthetic pathway through to its end-use application as a synthetic nitrogen fertilizer. As such, experiments were conducted to show the technical feasibility of the constituent ammonia, ammonium carbamate and urea syntheses toward a Blue Urea product (with particular emphasis on demonstrating these syntheses at attenuated conditions). Subsequently, the efficacy of this Blue Urea as a fertilizer was tested in controlled growth studies where it was compared to other fertilizers and a control.
Experimental
Materials and Methods
Gases used during experimentation included N2 (>99.998%), H2 (>99.99%), CO2 (>99.8%) and anhydrous, liquefied NH-3 (100%) which were used from cylinders supplied by BOC Group. A high activity industrial ammonia synthesis catalyst (KATALCO™ 74-1R, Size Grade A) was used as provided from Johnson Matthey. All other chemicals were purchased from Sigma-Aldrich. This included ethanol (EtOH, 96%), propanol (n-PrOH, 99%), isopropanol (i-PrOH, 99%), pentanol (n-PeOH, 99%) and octanol (n-OcOH, 99%) solvents, which were dried overnight prior to use with 3 Å molecular sieves. Acids used included sulphuric (H2SO4, 98%) and nitric (HNO3, 68%) acids, typically alongside a phenolphthalein indicator (1% in EtOH) solution. Other feedstock and/or reference materials included ammonium carbamate (99%), urea (98%), and biuret (97%).
Regarding compositional analysis, quantitative carbon nuclear magnetic resonance measurements (13C-NMR) were made with a Bruker AVIII operating at 400 MHz and samples dissolved in deuterium oxide (D2O, 99%). These experiments were performed by Sandra van Meurs (Department of Chemistry, University of Sheffield). Fourier-transformed infrared spectroscopy (FTIR) was done with a spectrophotometer (Shimadzu, IRAffinity-1S) operating in attenuated total reflectance (ATR) configuration. Measurements were in the 4,000–400 cm−1 wavenumber range, performed over 64 scans with a resolution of 1 cm−1. All other experimental methods are discussed individually herein.
Synthesis of Ammonia
The experimental configuration discussed below can be seen in Figure 1. For expedience, this work used gas cylinders as electrolytic H2 was to be supplied by an external supplier (ITM Power) using proprietary technologies. Hence, H2 and N2 feed gases were supplied at 40 bar to respective mass flow controllers (F-112AC and F-201AV, Bronkhorst), allowing control of the flowrates and H2:N2 molar ratio. These gases were then passed through an inline static mixer (FMX, Omega) before being supplied to a gas booster (AGD-30, Haskel) driven by on-site compressed air (4 bar). The gas booster allowed pressurization to the desired pressure (<200 bar), which was set using a back-pressure regulator (H3P, Equilibar). The pressurized feed gases then flowed through a tube furnace (GVA 12/900, Carbolite) and were heated to the desired temperature (<400°C) before entering the synthesis reactor. The tubular reactor was constructed from stainless steel compression fittings with an inner tube of dimensions 9.4 mm inner diameter (Di) by 1.5 m length (L), which was packed with catalyst (240 g) and retained by filters. This tube was contained within an outer tube to form a cooling jacket, which was supplied with mains water. Upon leaving the catalyst bed, the reaction gases passed through a cooler of similar construction with dimensions 9.4 mm (Di) by 1 m (L), also supplied with mains water. The cooled gases were then depressurized (1 bar) by passing through the back-pressure regulator, and a sample continuously analyzed for NH3 concentration by a non-dispersive infrared sensor. The unsampled gases were bubbled through two glass scrubber vessels (<5 L) containing dilute H2SO4 or HNO3 with phenolphthalein indicator. Whilst unreacted H2 and N2 gases bubbled out of solution to vent, the NH3 component reacted to form ammonium sulfate [(NH4)2SO4, AS] or nitrate (NH4NO3, AN), respectively (which were evaporated and retained after experimentation). Instrumental readings included temperatures, pressures, feed gas flowrates and outlet concentration, continuously measured with thermocouples (Type K, RS), pressure transducers (PXM309, Omega) and the aforementioned mass flow controllers and gas analyzer respectively. The data were continuously compiled using data acquisition equipment (OMB-DAQ-2416, Omega).
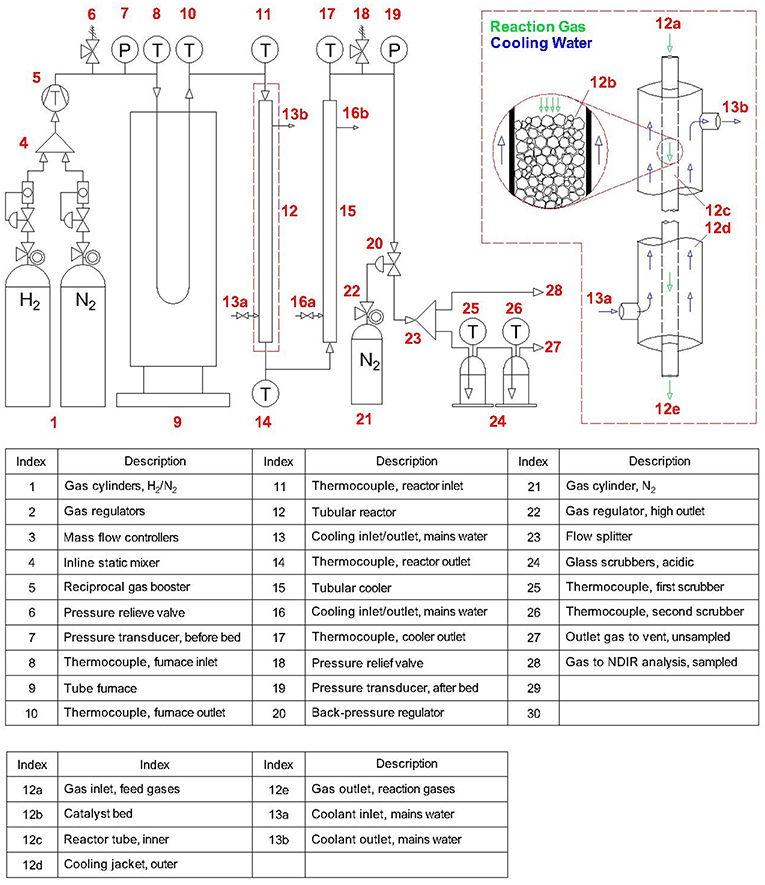
Figure 1. Experimental configuration used throughout synthesis of ammonia.
Experiments studied the above reactor design to thoroughly characterize the performance of a single-tube reactor with the specified dimensions. Increasing production is then simply a matter of adding parallel tubes of the same specifications to produce a multi-tube reactor, where each tube performs identically to the one already experimentally validated. Thus, rather than traditional scale-up of equipment (involving costly equipment redesign) this process can instead undergo “scale-out,” enabling a modular design that allows flexible production across a wide operational range. This is ideal for the Blue Urea concept since it allows output to be matched to both renewable energy availability and downstream demand. Additionally, whilst the above single-pass arrangement was sufficient for experimentation, the inclusion of a recycle loop would be required to achieve acceptable conversion efficiencies. A multi-tube reactor of such design with a capacity of 150 kg/day been built and is in the process of on-site commissioning, the results from which will be reported once the system is operational.
Synthesis of Ammonium Carbamate
Subsequently, the next step toward Blue Urea is the formation of ammonium carbamate, the experimental configuration for which is illustrated in Figure 2. For expedience, the NH3 produced in the aforementioned process was not used as a feedstock for these experiments and instead a commercial cylinder of NH3 was used. Synthesis of the carbamate was conducted in a similar manner to Barzagli et al. (2011) by co-bubbling of NH3 and CO2 gases through solvent within a glass reactor of dimensions 40 mm (Di) by 500 mm (L). The reactor also contained evenly spaced baffles positioned axially along the reactor to increase mixing and contact time between the bubbles and solvent. Respective flowmeters (SUPELCO) controlled the flowrates of NH3 and CO2, which were bubbled into solution through separate sintered-glass spargers. Initially, only CO2 was flowed to purge the system, after which NH3 was introduced and the formation of a white precipitate observed. Unreacted gases that bubbled out of solution were passed through dilute H2SO4 and phenolphthalein indicator to remove unreacted NH3 and prevent backflow of air into the reactor. The white precipitate was removed from solution by continuous solvent filtration using a peristaltic pump (PLP 330, Behr Laboratory) connected to an inline filtration unit (Whatmann Grade 5, 2.5 μm). Separate experiments were conducted to assess the filtration of carbamate from i-PrOH, as seen in the Supplementary Information. The filtrate was then returned to the reactor, forming a solvent recycle loop. After the reaction duration, the NH3/CO2 flows were stopped and the continuous solvent filtration run for a short duration to remove remaining precipitate. Subsequently, the filtered solids were dried under a flow of CO2 for 10 min, washed with diethyl ether, and further dried under CO2 for 10 min. The dried solids were then weighed and the conversion evaluated assuming the isolated solids were entirely composed of ammonium carbamate (Equation 7).
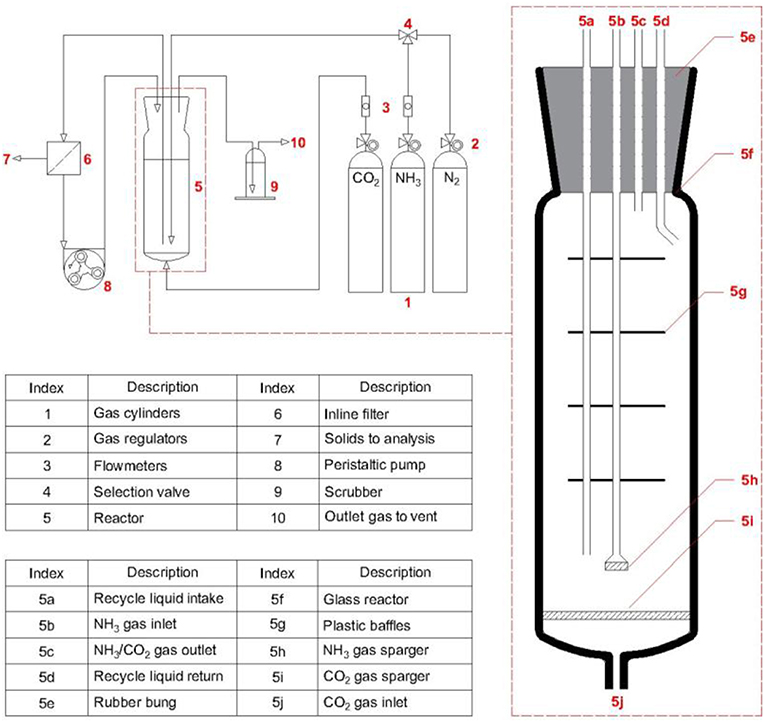
Figure 2. Experimental configuration used throughout synthesis of ammonium carbamate.
Synthesis of Urea
The final step toward production of Blue Urea is conversion of ammonium carbamate to urea. These experiments were conducted in a 0.3 L hastelloy autoclave reactor (Parr Instrument Company) with removable glass liner, into which carbamate was weighed and a magnetic stirrer added. Commercial carbamate was used as a standardized feedstock to eliminate material variability, although a select few experiments used synthesized carbamate from the previous experiments. The reactor was then sealed and pressurized to an initial pressure (<40 bar) with either CO2 or a NH3/CO2 mixture from respective cylinders. The pressurized reactor was then heated on a stirrer hotplate and brought to temperature (<200°C) in a short duration (<20 min). During heating, the pressure within the reactor increased to the final value due to autothermal pressurization. Upon reaching the reaction conditions, a timer was commenced and the reaction conducted for the desired duration. After the reaction time had elapsed, the reactor was rapidly cooled to room temperature by submersion in water, effectively quenching the internal reaction. The reactor was then depressurized and the glass liner containing the reaction mixture removed. This glass liner was then weighed on a mass balance, before being heated in an oven at 85°C and regularly re-weighed until a constant mass was observed. In this way, the unreacted ammonium carbamate was thermally decomposed and water evaporated, with the constant mass achieved assigned to the urea product allowing calculation of the conversion (Equation 8).
Application of Blue urea Fertilizer
The Blue Urea synthesized above was then studied as a nitrogen fertilizer in growth studies. The plant species used were perennial rye grass (Lolium perenne) and creeping fescue (Festuca rubra) in a mixed pasture turf typical for dairy cow grazing. To standardize soil quality, these were sown at Week 0 with a density of 35 g/m2 into John Innes No 2. (JI no. 2) compost prepared into trays (of 700 cm2 and 4.5 L area and volume, respectively). Further experiments examined degraded agricultural soils (DS), collected from Spen Farm (operated by University of Leeds, UK). This soil has been characterized as loamy, calcareous brown earth from the Aberford series of Calcaric Endoleptic Cambisols (Cranfield University., 2018), occurring extensively across the UK on gently sloping Permian and Jurassic limestone. The field has typical depths of 50–90 cm, and has been under conventional till for 20 years resulting in mechanical damage to the soil (Berdini, pers. comm.). Samples of DS were collected 32 and 64 m from the field edge, homogenized in a cement mixer, and stored for one year prior to experimentation.
Establishment and growth were conducted in a greenhouse, where diurnal temperature was between 15/20°C. A day length of 16 h was achieved with supplementary lighting (CDM-TP MW 315W/942, Philips Lighting) to achieve a total light level of 240 ± 50 μmol m−2 s−1 as evaluated with a photometer (Licor Inc.). Relative humidity within the greenhouse was not controlled during growth, but was measured as 36 ± 5% throughout. As an additional precaution, trays were rotated once a week to control for any localized variation in conditions. Following establishment and four cuts to thicken the turf, each replicate was given a fertilizer treatment at Week 5. Treatments were applied to turfs by dissolution of fertilizer in tap water (1 L) placed into individual, bottom-fed standing trays. After 2 h, additional water (1 L) was applied, and thereafter the turfs were watered regularly to avoid water deficit. The turfs were then harvested at Week 7 (when turf height exceeded 150 mm) for measurement of; biomass, chlorophyll content, and nitrogen (N) and carbon (C) content of leaves.
Chlorophyll content was measured by adding biomass (300 mg) to a universal tube (10 mL) containing 80 vol% acetone balanced with distilled water (5 mL). This was covered with aluminum foil (to avoid photodegradation of chlorophylls) and mixed for 30 min, refrigerated overnight at 4°C and finally mixed again for 30 min. The tube was then centrifuged (3000 RPM, 15 min) and the supernatant transferred to cuvettes (1 cm). Subsequent measurements by spectrophotometry (Jenway 6320D, SLS) evaluated the chlorophyll absorbance compared to a blank consisting of 80 vol% acetone. Concentrations for chlorophyll A, B and A+B (mg/g), denoted Ca, Cb and Ca+b respectively, were calculated (Equations 9–11) where A = absorbance wavelength, V = volume of the extract (mL) and W = mass of biomass (g) according to the assay by Ni et al. (2009). The nitrogen (%N) and carbon (%C) contents of the biomass was evaluated using elemental analysis. Leaves were collected (3 g) and dried (70°C, 7 days) before grinding by pestle and mortar. For subsamples (0.1 mg), measurements were by combustion coupled to a 20–20 continuous flow mass spectrometer with preparation module and 20–20 stable isotope analyser (ANCA-GSL, PDZ Europa, Sercon Ltd.). Additionally, soil pH was measured by taking representative samples which were mixed and added to water (50 mL), which was shaken prior to measurement with a pH meter (Jenway 3520, SLS).
The null hypotheses of the growth studies included the following:
(i) No difference in effectiveness between Blue Urea, AN and Nitram on grass turf, for treatments applied at equivalent N application in standardized soil (JI no. 2).
(ii) No difference in effectiveness between Blue Urea, AN and Nitram on grass turf, for treatments applied at equivalent N application in degraded soil (DS).
(iii) No difference in effectiveness of additional N afforded by Blue Urea on grass turf, for treatments in standardized soil (JI no. 2) at equivalent N application compared to the same mass application rate (w/w) based on current agricultural practice.
Results and Discussion
Synthesis of Ammonia
Experiments were conducted to characterize the performance of the aforementioned single-tube reactor design, such that “scale-out” to a multi-tube system could be rigorously validated. A typical synthesis can be seen in Figure 3, showing continuous measurements for reactor temperatures (TR), reactor pressures (PR), feed gas flowrates (Vx), scrubber temperatures (TS), and ammonia outlet concentration ([NH3]) over the course of time (t). The steady-state values for each parameter have been indicated on the figure, excluding those for scrubber temperatures which show the values upon first neutralization. For context, the specific experiment shown involved initial purging and heating, followed by pressurization to an intermediate pressure (t = 0.1 h). Upon stabilization of the reactor temperatures, pressurization was completed and the feed gases incrementally adjusted to a 2.8:1 molar ratio of H2:N2, commencing the formation of NH3 (t = 0.8 h). Thereafter conditions were fixed and steady-state soon established (t = 2 h) until the experiment was halted (t = 6 h). A table summarizing a selection of experiments has been provided in the Supplementary Information.
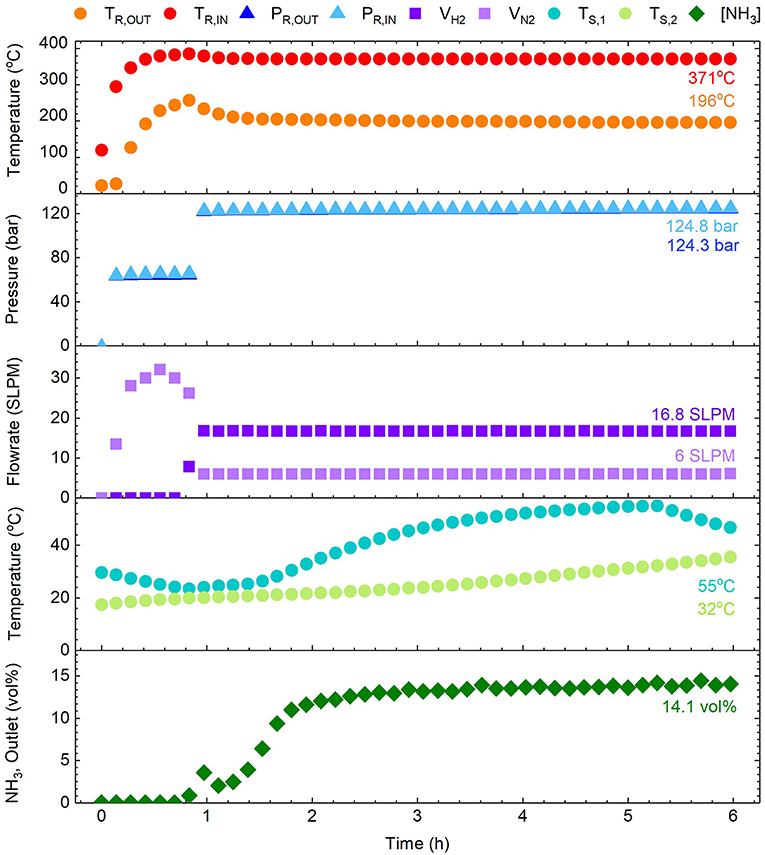
Figure 3. Example ammonia synthesis experiment showing parameters such as the reactor temperatures (TR,IN and TR,OUT), pressures (PR,IN and PR,OUT), feed gas flowrates (VH2 and VN2), scrubber temperatures (TS,1 and TS,2), and the ammonia concentration in the outlet gas ([NH3]). Note that the PR,IN and PR,OUT data points are almost coincidental on the plot (ΔP ≈ 0.5 bar).
The ammonia synthesis reaction (Equation 3) is known to occur in equilibrium. Whilst the position of equilibrium is favorable at low temperatures, the reaction kinetics are prohibitive and higher temperatures are required to increase the rate of formation. Thus, the reactor temperature was anticipated to be a critical for achieving synthesis, with the catalyzed reaction reported to occur between 250 and 400°C (Appl, 2011). The results in Figure 3 showed the steady-state reactor inlet and outlet temperatures to be 371 and 196°C respectively, highlighting a considerable thermal gradient along the reactor. This gradient was consistent throughout experimentation, and was a consequence of the heating arrangement (as seen in Figure 1). Suspension of the reactor within the tube furnace for direct heating was not possible due to the dimensions, and furthermore whilst such an arrangement is experimentally convenient, it is poorly representative of a larger process where indirect heating is a practical necessity. Nevertheless, the temperatures achieved were demonstrably sufficient for formation of NH3 as discussed later. The second critical synthesis condition is pressure, which favorably shifts the position of equilibrium at elevated values. In this regard, the system was highly responsive and maintained a steady-state reactor inlet value of 124 bar (for a set-point of 120 bar). During start-up, the pressure drop (ΔP) across the catalyst bed fluctuated considerably with a maximum of 1.55 bar, but at steady-state the system was stable with a modest pressure drop of 0.5 bar. Similarly, the arrangement of mass flow controllers, inline mixer and gas booster offered precise control and delivery of the H2/N2 feed gases. Based on experience from initial trials, the flowrates used were 16.8 and 6 SLPM for H2 and N2 respectively, effecting the aforementioned 2.8:1 molar ratio of H2:N2.
Under these conditions, the production of NH3 was successfully demonstrated, as seen in Figure 3. Initial introduction of H2 to the system prompted a rapid increase in outlet NH3 concentration to 3.9 mol%. This was presumed to be due to the relative abundance of adsorbed N on the catalyst surface from initial heating under N2. Since the rate-limiting step of this synthesis is normally accepted as the dissociation of N2, this initially allowed rapid reaction before depletion of these species slowed the rate. As the amount of adsorbed N and H equilibrated, the formation of NH3 correspondingly increased to a steady-state value measured at 14.1 mol%, corresponding to a calculated conversion of 24.7%. A coincidental response was observed in the first scrubber temperature, which was attributed to the exothermic formation of NH4NO3 (AN), which was collected for application as a fertilizer in subsequent growth studies. Promisingly, the above conversion was in close proximity to those typically achieved by industrial reactors (reportedly between 25 and 35% per pass) (Appl, 2011), despite the relatively attenuated conditions. However, based on conditions at the reactor inlet, the equilibrium NH3 concentration was anticipated to be approximately 29 mol% (Appl, 2011), indicating the reaction was still far from equilibrium. Nevertheless, the reactor design showed conversion comparable to commercial equivalents, with considerable scope for further improvement. For instance, resolution of the aforementioned thermal gradient should assist the reaction toward equilibrium, and the addition of a recycle loop would greatly improve overall efficiency. Importantly, these experiments demonstrated that production of NH3 in this system reaches steady-state within ~2 h. This is advantageous for the Blue Urea concept due to the transience of renewable energy (e.g., wind power) meaning this process can be operated flexibly based on the availability of renewable energy.
Synthesis of Ammonium Carbamate
Initially the performance of the reaction in various solvents was studied. At room temperature, the reaction was conducted for 30 min with a 2:1 molar ratio of NH3:CO2 at 125 mL/min and 62.5 mL/min of NH3 and CO2 respectively (having assumed ideal gases) in 300 mL of solvent. The alcoholic solvents studied included EtOH, n-PrOH, i-PrOH, n-PeOH, and n-OcOH, the results of which are seen in Figure 4A. The lighter alcohols were observed to produce excellent conversions, namely 96, 99, and 83% for EtOH, i-PrOH, and n-PrOH respectively. Conversely, heavier alcohols were observed to offer definitively worse conversions, likely due to the reduced solubility of NH3 in these solvents. Moreover, the high boiling points of these solvents (138 and 188°C for n-PeOH and n-OcOH, respectively) mean residual solvent is likely to have persisted within the carbamate, falsely raising the measured value. Considering the superior performance demonstrated by dried i-PrOH, this solvent was used throughout further experimentation.
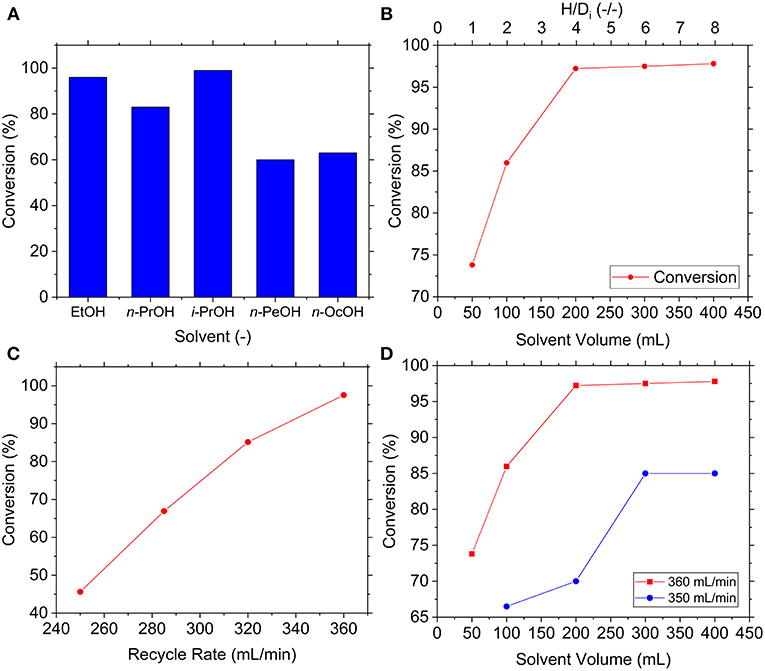
Figure 4. Effect of various reaction conditions on synthesis of ammonium carbamate namely (A) solvent, (B) solvent volume, (C) recycle rate, and (D) solvent volume at reduced recycle rate.
Dissolution of the gases into solution was anticipated to be highly important and solvent volume a critical variable thereof. Conceivably, low volume would mean insufficient solvent height within the reactor, shortening contact time between the gases and solvent (and thereby allowing them to bubble out of solution without reaction). Hence, the influence of solvent volume was investigated with experiments using slightly adjusted flowrates of 116 and 60 mL/min for NH3 and CO2, respectively, as well as continuous solvent filtration with recycle flowrate of 360 mL/min. The results in Figure 4B appeared to confirm the above since initial increases in volume (<200 mL) improved conversion to a maximum of 97%, after which conversion was unaffected by volume. This suggested initial mass transfer limitations from dissolution of CO2 and/or NH3 into i-PrOH, such that the reaction initially benefitted from additional contact time. After sufficient contact time was established, these mass transfer limitations were alleviated and conversion thereafter unaffected by volume, with the reaction presumed to be kinetically limited. Reactor geometry was accounted for by the dimensionless parameter (H/Di) based on the internal diameter (Di) and solvent height (H), suggesting the reaction was mass transfer limited at H/Di < 4. This result provides valuable information for future research and reactor design, although will undoubtedly be affected by a multitude of other variables (e.g., gas flowrates, solubility, bubble size, etc.).
A plausible explanation for this mass transfer limitation was the saturation of i-PrOH with ammonium (), carbamate (NH2), bicarbonate () and carbonate () species that inhibit further dissolution. If this is the case, the limitation might be overcome by increasing filtration of precipitates from solution to promote further precipitation and dissolution. To explore this, experiments were conducted with a variety of solvent recycle rates with 300 mL of solvent, the results of which are shown in Figure 4C. The results indicated increased solvent recycle rate consistently improved conversion throughout the examined range, growing from 46% at 250 mL/min to 98% at 360 mL/min. The effect of better mass transfer from forced convection was discredited by reexamining the effect of solvent volume at a reduced recycle flowrate, as seen in Figure 4D. The Reynolds number was estimated at 6.33 × 10⁴ and 6.16 × 10⁴ for 360 and 350 mL/min respectively, which indicated similar mixing within the turbulent regime. Despite this, slower recycle rates achieved lower conversions and exhibited more persistent mass transfer limitations, indicated by operation at 350 mL/min being limited until H/Di < 6). This strongly evidenced the theory that the origin of the mass transfer issues was saturation of the i-PrOH by high precipitate concentrations, highlighting that overall conversion can be improved by rapid removal of precipitate from solution.
Furthermore, reducing the temperature of the reaction was anticipated to increase conversion. Since the synthesis reaction is exothermic (Equation 4) the removal of heat could achieve higher conversions by shifting the equilibrium toward the formation of carbamate. Additionally, reduced temperatures may increase solubility of NH3 and CO2 in i-PrOH, conceivably leading to faster dissolution and higher saturation concentrations (potentially counteracting aforementioned mass transfer limitations). To explore the effect of temperature, experiments were conducted as above but with the reactor cooled to 0°C by an external cooling jacket. Results showed the reaction at 0°C affected a conversion of 87% as opposed to 97% at 20°C, an observation contrary to predictions. From this, it was concluded that the lower temperature slowed the reaction kinetics enough to offset any supposed improvements to dissolution, solubility and/or equilibrium. This finding has positive implications for scale-up, since it indicates the reaction can be operated at ambient temperature without the financial and energetic cost associated with substantial cooling.
For expedience, conversion was thus far assessed assuming the reaction exclusively formed ammonium carbamate. Despite this, the reaction has been known to produce a mixture of ammonium carbamate, bicarbonate and carbonate species. Hence, it was decided to analyze the precipitate composition formed at the optimal conditions. The isolated precipitate was analyzed by quantitative 13C-NMR analysis and the resulting spectrum shown in Figure 5, which exhibited three distinct peaks at chemical shifts δ = 165.6, 162.4, and 64.1 ppm. These peaks were assigned to ammonium (bi)carbonate (referring to bicarbonate and carbonate, which are practically indistinguishable by 13C-NMR), ammonium carbamate, and residual i-PrOH solvent, respectively. Integration of the product peaks evaluated the composition to be 43% carbamate and 57% (bi)carbonate. This result was somewhat unexpected since (bi)carbonate formation is reportedly enhanced at elevated CO2 levels (<2:1 of NH3:CO2) and high water concentrations, whereas this work used a stoichiometric ratio (2:1 for NH3:CO2) and dried i-PrOH. The reaction of dissolved with is believed to generate water which could explain formation of (bi)carbonate in the precipitate. Alternatively, this may be due to interaction with atmospheric moisture prior to 13C-NMR analysis despite sample storage under CO2. As carbamate is the key intermediate toward urea its selective formation was highly desirable. Nevertheless, reaction of bicarbonate to form carbamate is well-reported, meaning formation of (bi)carbonate does not eliminate the possibility of efficient onward conversion to urea.
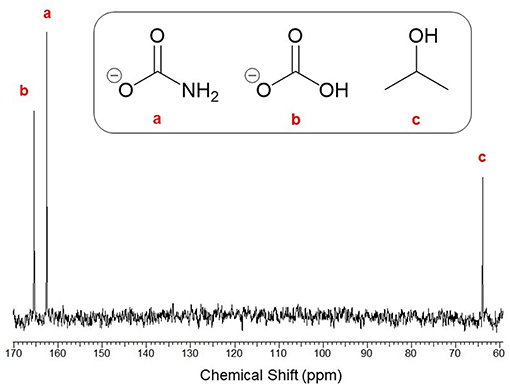
Figure 5. 13C-NMR (400 MHz, D2O) spectrum of the isolated solids with respective assignments of (a) ammonium carbamate [δ = 162.4], (b) ammonium (bi)carbonate [δ = 165.6], and (c) residual i-PrOH solvent [δ = 64.1].
Synthesis of Urea
The subsequent formation of urea from carbamate is reportedly governed by the equilibria between respective decomposition and synthesis reactions (Equations 4, 5). The influence of pressure was anticipated to be crucial for favoring the forward reaction whilst preventing the backward. Experiments examined the reaction of 0.25 g/mL of feedstock at 170°C for 4 h under several initial pressures of CO2, as seen in Figure 6A. Results confirmed the importance of pressure, since absence of initial pressurization resulted in effectively zero conversion, whereas even modest pressurization to 5 bar achieved conversion of 34% and gradual increase to 38% at 40 bar. In comparison (Meessen, 2010), reported equilibrium conversion at similar conditions to be approximately 40%, suggesting the reaction was operating near equilibrium. This evidenced that carbamate decomposition dominates until released gases generate sufficient overhead pressure to push the equilibrium forward, after which formation of urea will commence. It was also conceived that pressurizing with an NH3:CO2 mixture instead of exclusively CO2 would further shift the equilibrium forward, since in the latter case the relative excess of CO2 would favor decomposition to equilibrate the NH3:CO2 ratio. This was tested by pressurizing the reactor to approximately 5 bar with a 2:1 molar ratio of NH3:CO2 which resulted in a conversion of 37%, compared to 34% from solely CO2. These results conveyed considerable practical advantages. Firstly, conversions near to equilibrium can be achieved using relatively low initial pressures (<40 bar) meaning less pressurization costs. Secondly, pressurization with a 2:1 mixture of NH3:CO2 means unreacted gases can be recycled to the preceding carbamate synthesis process in the correct stoichiometric ratio without the need for separation.
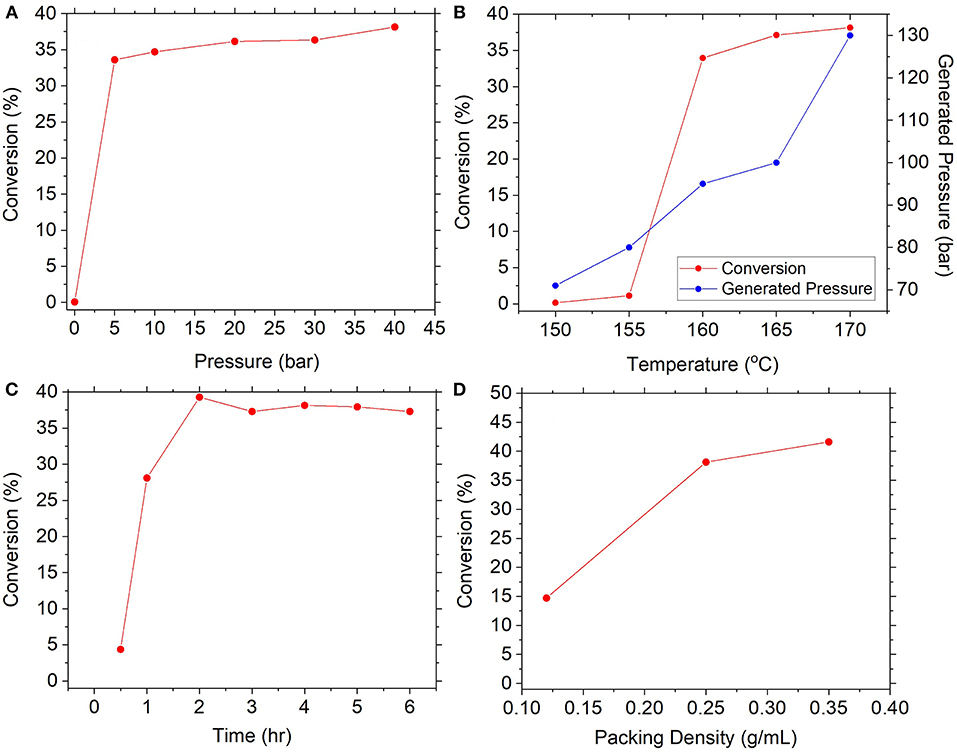
Figure 6. Effect of various reaction conditions on conversion of ammonium carbamate, namely (A) pressure, (B) temperature, (C) reaction time, and (D) carbamate packing density.
Equally important is the influence of temperature due to the endothermic nature of the urea synthesis reaction (Equation 5). This was investigated at above conditions and initial pressurization to 40 bar with CO2, as seen in Figure 6B. Results showed conversion was effectively zero at lower temperatures (≤155°C), before rapidly increasing to 34% then gradually to 38% at 170°C. Conflation by autothermal pressure was discredited due to the dissimilar trend and the diminishing effect of elevated pressures highlighted in Figure 6A. These results point toward kinetic limitations at <155°C and exceedingly slow rates of reaction, an observation supported by Barzagli et al. (2011) who reported a conversion of merely 3% at 130°C over 3 days. Nevertheless, upon reaching a threshold temperature between 155 and 160°C, sufficient activation energy was provided to drive the endothermic reaction forward. The optimal temperature found in this work is in good agreement with that used by Barzagli et al. (2016). Subsequently, the reaction kinetics at the optimal temperature were explored as shown in Figure 6C. At 170°C, the reaction rapidly achieved conversions of 39% within 1 h, which was thereafter stable at 38% until 24 h. Meessen (2010) report equilibrium conversion at this temperature to be ~40%, suggesting the reaction had reached equilibrium within around 1 h of reaction. This is greatly beneficial for the Blue Urea concept which requires constituent processes to be responsive to variable energy input from renewable sources (e.g., wind power). This result indicates carbamate conversion to urea is complete within just 1 h, meaning less heating time and lower energy demand, as well as greater throughput and processing turnover.
Similar kinetic experiments by Barzagli et al. (2016) reported conversion of 49% within 90 min at 165°C and 38 bar, presenting a sizable inconsistency to the above results. The difference between the above result and that by Barzagli et al. (2016) was suspected to be due to packing density. The density employed by those authors was calculated to be 0.5 g/mL, as opposed to the 0.25 g/mL used above which was advised by filter cakes produced during carbamate filtration studies (see Supplementary Information). It was presumed that larger compressible volumes are a byproduct of lower packing densities and require relatively more gas to effect pressure increases. As such, a greater proportion of carbamate is decomposed before the equilibrium is favorably shifted toward urea synthesis (in an identical manner to discussion of Figure 6A above). To explore this, experiments examined packing densities of 0.12, 0.25, and 0.40 g/mL at the same conditions, as seen in Figure 6D. The results showed a positive correlation between density and conversion with measured values of 15, 38, and 42% respectively, confirming the positive effect of larger packing densities. This underscores the importance of filtration in the preceding process, where filter cake density should be maximized to ensure high packing density in subsequent urea synthesis.
Crucially, for successful application as fertilizer, urea needs to be sufficiently free from contaminants that could exhibit damaging herbicidal effects such as carbamate and biuret (a byproduct formed at high temperatures). To test for the presence of unwanted species in Blue Urea, carbamate synthesized by the above process (see Figure 5) was reacted at the above optimal conditions, before being heated at 85°C to decompose unreacted carbamate and/or (bi)carbonate. The remaining product was then analyzed by FTIR alongside commercial reference materials for urea, ammonium carbamate and biuret (as seen in Figure 7). As can be seen, Blue Urea showed exceptional similarity to reference urea as well as the complete absence of contaminant and unexplained bands. This confirmed the chemical composition of the Blue Urea and suggested it was free from impurities that might inhibit its use as a nitrogen fertilizer.
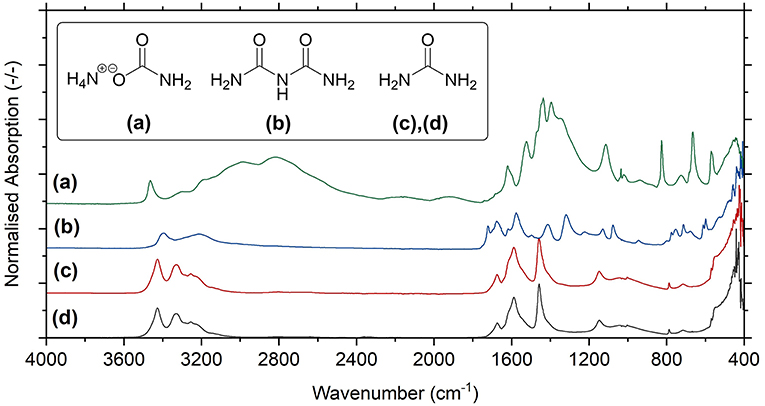
Figure 7. FTIR-ATR spectra for reference materials of (a) ammonium carbamate, (b) biuret, and (c) urea in comparison to the spectrum for (d) synthesized Blue Urea.
Application of Blue urea Fertilizer
Controlled testing of Blue Urea against both laboratory synthesized AN and Nitram (a commercially available fertilizer) was conducted to assess effectiveness toward pastures representative of dairy farming. Table 1 shows the nitrogen (N) application rate used, which were equivalent to standard UK practice for dairy pastures. The results in Figure 8A show the accumulated biomass for treatments in JI no. 2, whereas those in Figure 8B compare final biomass growths in JI no. 2 and degraded soil (DS). From Figure 8A shows treatments in Weeks 2 and 5 (prior to fertilizer application) were statistically indifferent from the JI no. 2 control. Following respective fertilizer treatments and further growth, the biomass of the JI no. 2 control turf biomass was observed to be significantly lower than all treated turfs, with reductions of 18, 16, and 17% compared to AN, Nitram and Urea, respectively. A similar trend was observed in DS although accumulated biomass was lower throughout growth relative to JI no. 2. For growths on DS, the reduction between control and treated turfs was greater than that for JI no. 2, with values of 20%, 26% and 24% for AN, Nitram and Urea respectively. This was presumed due to lower initial N available in DS, as well as its inferior physical properties, which negatively affected germination and turf density. Nevertheless, all fertilizer treatments were observed to significantly increase the mean biomass by 64 to 70% between Weeks 5 and 7 compared to the JI no. 2 control (which itself increased by 44%) as seen in Table 2. Specifically examining Figure 8B for differences between the treatments, all fertilizers resulted in biomass growth that was statistically indifferent in both JI no. 2 and DS, showing comparable performance between AN, Nitram and Blue Urea. Furthermore, with regard to the influence of soil, Figure 8B showed mechanically damaged soil reduced turf productivity by between 70 and 74%. Mechanized practices produce severe compaction, leading to poor seedling establishment, lack of root penetration, reduced water availability to crops and increased loss of available nitrogen to the atmosphere. Overall compacted soils are estimated to cost the UK economy £0.42 bn per year for England and Wales (Graves et al., 2015).
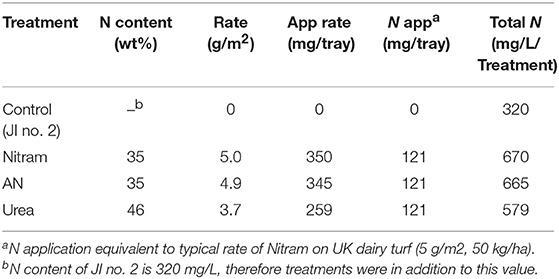
Table 1. Nitrogen content of each fertilizer treatment for equivalent nitrogen application rate.
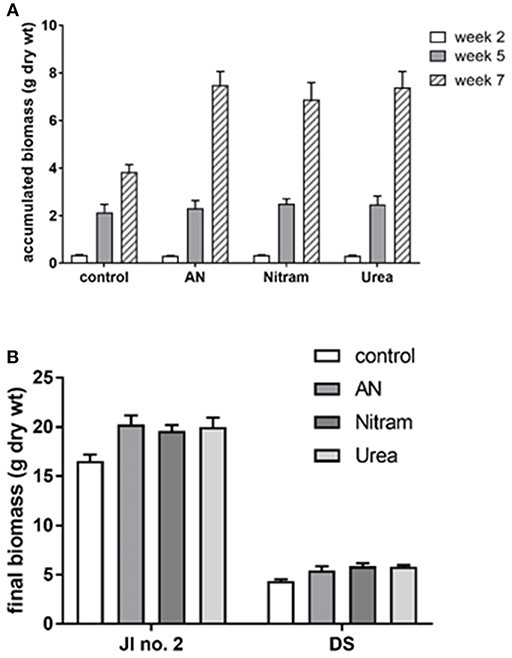
Figure 8. Accumulated biomass of a grass turf treated with AN, Nitram, Blue Urea, and non-treated control. (A) JI no. 2 standardized compost; (B) comparison of JI no. 2 with degraded soils (DS) (bar = SEmean, n = 5 JI no. 2, n = 3 DS).
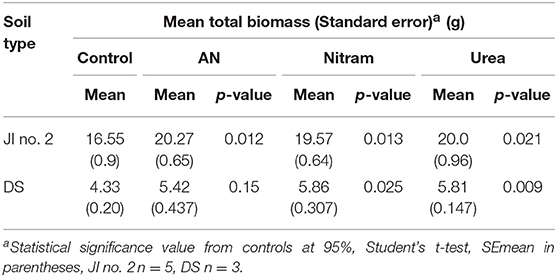
Table 2. Mean final biomass and significance from controls at 95% of turfs grown in JI no. 2 and degraded soil (DS).
The availability of N to plant leaves is critical for overall productivity. To test the availability of N from fertilizers, %N was measured in the leaves of turfs grown in JI no. 2, as well as the soil, roots and leaves for turfs grown in DS (Figures 9A,B, Table 3). Additionally, for each instance chlorophyll concentrations were also measured. The results from these measurements are shown in Figures 9A–D. Regarding measurement of %N, results in Figures 9A,B confirm the availability of N (from soil, through roots to leaves) in both JI no. 2 and DS soils, with all fertilizer treatments performing similarly in both soils (despite the reduction in final biomass discussed above). Considering the lower final biomass achieved in DS, it was hypothesized that the N available from treatments was sufficient to maintain N levels in the fewer leaves present. Examining Figure 9B, for growth in DS the mean concentration of N in leaves increased by 30, 32, and 39% for AN, Nitram and Urea respectively compared to controls. This result highlighted how treatment with Blue Urea was statistically higher than that for AN (Student's t-test, p = 0.047) (Table 3).
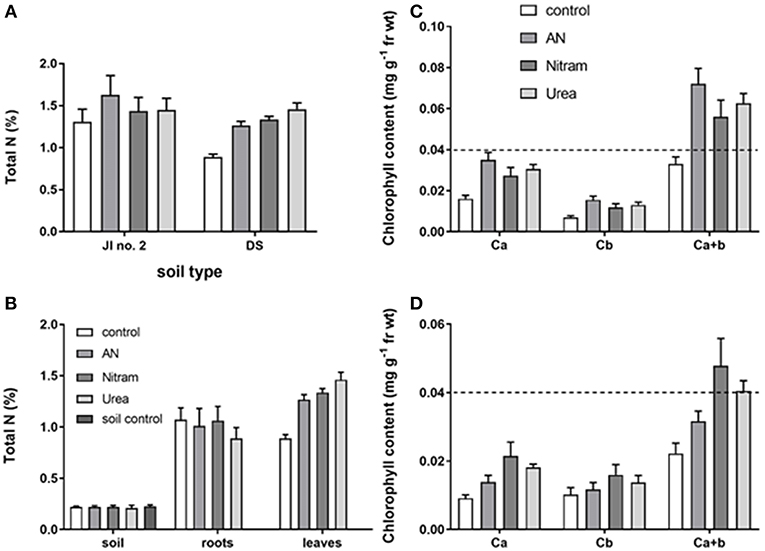
Figure 9. Total leaf N in plants grown in JI no. 2 under different fertilizer treatments (A); Total soil, root and Leaf N of plants grown in DS, together with a soil only control (B); corresponding leaf chlorophyll content of plants in JI no. 2 (C) and DS (D). (Statistics in Table 3 and Supplementary Information). Dashed line shows equivalent position on y axis for comparison.
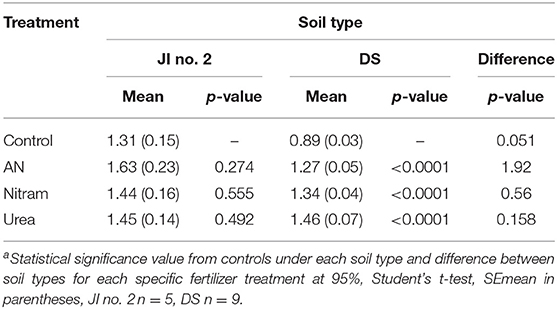
Table 3. Mean % total nitrogen in leaves grown in JI no. 2 and degraded soil (DS)a.
With regard to chlorophyll, increased concentration within the leaves of crops correlates to increased production. This is due to the fundamental role of chlorophyll in photosynthesis, with elevated chlorophyll content in leaves therefore determining the upper limit of productivity in crops. Measurements of leaf chlorophylls (Ca, Cb, and Ca+b) can be seen in Figures 9C,D for JI no. 2 and DS respectively. The results showed that leaf chlorophylls were all significantly higher in crops that had been treated with fertilizer, with the notable exception of Cb, which was not statistically different from the control in DS (as seen in the Supplementary Information). The relationship between chlorophyll and N is well-known (Evans, 1989), as N is a structural element of chlorophyll synthesis. The effect however on productivity is modified via the carbon-fixing compound RUBISCO, the most abundant protein in leaves and accounting for 20–30% of total leaf nitrogen (Sage et al., 1987). Measurement of leaf chlorophyll content provides evidence that the available N is targeted to crop productivity. Chlorophylls were significantly enhanced in JI no. 2 by an average of 35% compared to the respective control. In DS controls, severe chlorosis (yellowing of the leaf due to a lack of chlorophyll) was visible by Week 7 clearly indicating the effect of N on chlorophyll and subsequent productivity. From the data gathered, the link between N and chlorophyll was further verified by linear regression analysis, which was maintained in both soil types for all treatments (as seen in Figure 10A) in agreement with previous findings (Evans, 1989).
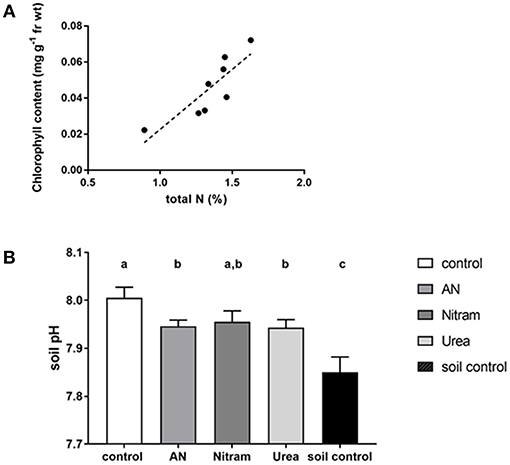
Figure 10. (A) Linear regression analysis for %N and chlorophyll a+b. (linear regression R2 = 0.717, p = 0.008, Pearson's correlation coefficient = 0.847, n = 8, df: 1, 6, F = 15.19). (B) Soil pH measured at the end of 8 weeks using DS. An additional soil control (without plants) was included. Letters denote significant difference [AN and Urea treatments are significantly lower than control (Student's t-tests AN p = 0.036, Urea p = 0.04), Nitram is not significantly different from control (p = 0.14). Soil control is significantly lower that all other treatments (p ≤ 0.005), n = 9).
In addition to the above, soil acidification is a major cause of soil degradation as a result of natural processes over time. Importantly however, this acidification also occurs through application of nitrogen fertilizers (Holland et al., 2018). Thus, the soil pH was measured after application of the fertilizer treatments, as seen in Figure 10B. The results showed an elevated pH value above 7.0, which reflected the soil composition as calcareous loam. Fertilizer treatments slightly reduced the soil pH compared to the control, indicating the occurrence of acidification, however all treatments exhibited pH values above that of soil control (exclusively measuring the soil). It was concluded that application of fertilizers did not result in any deleterious effects on soil pH.
Finally, as urea has a higher N content by weight than AN or Nitram (as shown in Table 1), a final experiment was conducted to investigate whether the extra N afforded by urea increased crop yield when applied at an equivalent mass application rate (as opposed to equivalent N application). In these experiments, urea was applied at 3.7 g/m2 (low N) and 5 g/m2 (high N) in JI no. 2 and allowed to grow as before, followed by biomass and chlorophyll were measured. Regarding biomass, the final mean values before and after treatment were not significantly different for each application level. Measurements for Ca, Cb, and Ca+b were also not significantly different and equated to levels in JI no. 2 (both of which have been provided in the Supplementary Information). The dashed line is equivalent to Figure 9C, which showed a consistent response for this fertilizer under laboratory test conditions.
Conclusions
In conclusion, the long-term sustainability of conventional production of urea fertilizer is challenged by the use of fossil feedstocks. This challenge could be circumvented by integration of surplus renewable energy to power the electrolytic generation of H2. After onward reaction to form NH3, aqueous reaction with externally captured CO2 (i.e., direct air capture or from a point source emitter) could enable a more sustainable route to so-called Blue Urea fertilizer, which could be reduced-carbon or even carbon-neutral. This research successfully demonstrated the Blue Urea concept, showing the technical feasibility of the production process as well as the efficacy of the urea product as a synthetic nitrogen fertilizer. Production of NH3 from a feed gas consisting of H2 and N2 was shown to be effective with the configuration used, achieving steady-state outlet concentrations of 14 vol% NH3 (corresponding to a conversion of 23.6%) within approximately 2 h from start-up. This study used cylinders of H2 to expedite process development, as electrolytic H2 was to be supplied by an external supplier (ITM Power) using proprietary technologies. Further research is needed to demonstrate the process with the inclusion of a recycle loop for unreacted H2/N2 (as opposed to the single-pass arrangement used). Separately, the aqueous reaction of NH3 with CO2 to precipitate ammonium carbamate was characterized. Dried i-PrOH was found to be an excellent solvent that effected near-quantitative conversions of NH3. Several other process parameters were studied for their effect on the reaction, before the precipitate composition at the optimal conditions was analyzed by 13C-NMR and found to contain 43% ammonium carbamate and 57% ammonium (bi)carbonate. The conversion of carbamate to afford urea was also separately explored under a variety of reaction conditions, and optimum conditions were reported. Subsequently, the carbamate/(bi)carbonate precipitate produced previously was reacted at these optimal conditions to form Blue Urea. Following further processing this product was analyzed by FTIR and found to be free from contaminants, evidencing the chemical purity of the Blue Urea synthesized under these conditions. This Blue Urea was then applied in growth studies to test its efficacy as a nitrogen fertilizer and, following experimentation, the three (i, ii, and iii) null hypotheses were accepted. Overall, studies showed Blue Urea performed comparably to synthesized AN and commercial Nitram fertilizers under the growth conditions applied Preliminary data suggested application of Blue Urea would be effective at delivering nitrogen that is available for uptake by crops. However, these studies were conducted under controlled conditions within a closed-system, and it is recognized that interactions between soil, crops and fertilizers are complicated by outdoor conditions (e.g., soil type, crop type, fluctuating meteorological parameters, etc.). Thus, field testing of Blue Urea is recommended to assess its performance in outdoor and uncontrolled conditions.
Data Availability
All datasets generated for this study are included in the manuscript and/or the Supplementary Files.
Author Contributions
JD, RO, TM, JM, and PS were responsible for their individual contributions regarding the production and characterization of the synthesized fertilizer materials. JL contributed toward the application of these fertilizers and characterizing their effects on plant growth.
Funding
This work was jointly funded by Biotechnology and Biological Sciences Research Council (BBSRC) and the Engineering and Physical Sciences Research Council (EPSRC) under respective grant numbers BB/M011917/1 and EP/K007947/1, EP/H035702/1.
Conflict of Interest Statement
The authors declare that the research was conducted in the absence of any commercial or financial relationships that could be construed as a potential conflict of interest.
Acknowledgments
This work gratefully acknowledges the joint financial support of BBSRC and EPSRC. The authors would also like to thank Johnson Matthey for providing the ammonia synthesis catalyst used in experimentation. Finally, thanks are due to Sandra van Meurs (Department of Chemistry, The University of Sheffield) for her expertise in performing the 13C-NMR measurements.
Supplementary Material
The Supplementary Material for this article can be found online at: https://www.frontiersin.org/articles/10.3389/fenrg.2019.00088/full#supplementary-material
References
Appl, M. (2011). Ammonia, 2. Uhlmann's Encyclopedia of Industrial Chemistry. Weinheim: Wiley-VCH Verlag CmbH & Co. KGaA. doi: 10.1002/14356007.o02_o11
Barzagli, F., Mani, F., and Peruzzini, M. (2011). From greenhouse gas to feedstock: formation of ammonium carbamate from CO2 and NH3 in organic solvents and its catalytic conversion into urea under mild conditions. Green Chem. 13:1267–1274. doi: 10.1039/c0gc00674b
Barzagli, F., Mani, F., and Peruzzini, M. (2016). Carbon dioxide uptake as ammonia and amine carbamates and their efficient conversion into urea and 1,3-disubstituted ureas. J. CO2 Util. 13, 81–89. doi: 10.1016/j.jcou.2015.12.006
Bicer, Y., Dincer, I., Zamfirescu, C., Vezina, G., and Raso, F. (2016). Comparative life cycle assessment of various ammonia production methods. J. Clean. Prod. 135, 1379–1395. doi: 10.1016/j.jclepro.2016.07.023
Boulamanti, A., and Moya, J. A. (2017). Production costs of the chemical industry in the EU and other countries: ammonia, methanol and light olefins. Renew. Sust. Energy Rev. 68, 1205–1212. doi: 10.1016/j.rser.2016.02.021
Cranfield University. (2018). The Soils Guide. Available online at: www.landis.org.uk (accessed July 11, 2018).
Dawson, C. J., and Hilton, J. (2011). Fertilizer availability in a resource-limited world: Production and recycling of nitrogen and phosphorous. Food Policy 36, 14–22. doi: 10.1016/j.foodpol.2010.11.012
Evans, J. R. (1989). Photosynthesis and nitrogen relationships in leaves of C3 plants. Oecologia 78, 9–19. doi: 10.1007/BF00377192
Frattini, D., Cinti, G., Bidini, G., Desideri, U., Cioffi, R., and Jannelli, E. (2016). A system approach in energy evaluation of different renewable energies sources integration in ammonia production plants. Renew. Energy 99, 472–482. doi: 10.1016/j.renene.2016.07.040
Graves, A. R., Morris, J., Deeks, L. K., Rickson, R. J., Kibblewhite, M. G., Harris, J. A., et al. (2015). The total costs of soil degradation in England and Wales. Ecol. Econ. 119, 399–413. doi: 10.1016/j.ecolecon.2015.07.026
Holland, J. E., Bennett, A. E., Newton, A. C., White, P. J., McKenzie, B. M., George, T. S., et al. (2018). Liming impacts on soils, crops and biodiversity in the UK: a review. Sci. Total Environ. 610–611, 316–332. doi: 10.1016/j.scitotenv.2017.08.020
IFA (2018). International Fertilizer Association (IFA), Statistics: Production & International Trade. Available online at: https://www.ifastat.org/ (accessed February 27, 2019).
IPCC (2018). Special Report: Global Warming of 1.5oC. Available online at: https://www.ipcc.ch/sr15/ (accessed March 01, 2019).
Leung, D. Y. C., Caramanna, G., and Mercedes Maroto-Valer, M. (2014). An overview of current status of carbon dioxide capture and storage technologies. Renew. Sust. Energy Rev. 39, 426–443. doi: 10.1016/j.rser.2014.07.093
Meessen, J. (2010). Urea, Uhlmann's Encyclopedia of Industrial Chemistry. Weinheim: Wiley-VCH Verlag CmbH & Co. KGaA.
Mission Innovation (2017). Accelerating Breakthrough Innovation in Carbon Capture, Utilization, and Storage. Report of the Mission Innovation Carbon Capture, Utilization, and Storage Experts' Workshop. Available online at: https://www.energy.gov/fe/downloads/accelerating-breakthrough-innovation-carbon-capture-utilization-and-storage (accessed March 01, 2019).
Morgan, E., Manwell, J., and McGowan, J. (2014). Wind-powered ammonia fuel production for remote islands: a case study. Renew. Energy 72, 51–61. doi: 10.1016/j.renene.2014.06.034
Ni, Z., Kim, E. D., and Chen, J. (2009). Chlorophyll and starch assays. Protoc. Exch. doi: 10.1038/nprot.2009.12
Reese, M., Marquart, C., Malmali, M., Wagner, K., Buchanan, E., McCormick, A., et al. (2016). Performance of a small-scale Haber process. Ind. Eng. Chem. Res. 55, 3742–3750. doi: 10.1021/acs.iecr.5b04909
Sage, R. F., Pearcy, R. W., and Seemann, J. R. (1987). The nitrogen use efficiency of C3 and C4 plants. Plant Physiol. 85, 355–359. doi: 10.1104/pp.85.2.355
Stewart, W. M., and Roberts, T. L. (2012). Food security and the role of fertilizers in supporting it. Proc. Eng. 46, 76–82. doi: 10.1016/j.proeng.2012.09.448
Styring, P., and Jansen, D. (2011). Carbon Capture and Utilization in the Green Economy. York: Centre for Low Carbon Futures.
Tallaksen, J., Bauer, F., Helteberg, C., Reese, M., and Ahlgren, S. (2015). Nitrogen fertilizers manufactured using wind power: greenhouse gas and energy balance of community-scale ammonia production. J. Clean. Prod. 107, 626–635. doi: 10.1016/j.jclepro.2015.05.130
Villa Zaragoza, A. P. (2018). A Framework for Environmental Impact Assessment of Carbon Dioxide Utilisation Processes. PhD Doctoral Thesis, The University of Sheffield, UK. Available online at: http://etheses.whiterose.ac.uk/21037/ (accessed May 28, 2019).
World Bank (2018). Population Estimates and Predictions. Available online at: https://datacatalog.worldbank.org/dataset/population-estimates-and-projections (accessed February 27, 2019).
Yara (2017). Yara Fertilizer Industry Handbook. Available online at: https://www.yara.com/siteassets/investors/057-reports-and-presentations/other/2017/fertilizer-industry-handbook_2017_slides_only.pdf/ (accessed February 27, 2019).
Keywords: carbon dioxide, CCU, nitrogen fertilizer, urea, sustainability, low-carbon
Citation: Driver JG, Owen RE, Makanyire T, Lake JA, McGregor J and Styring P (2019) Blue Urea: Fertilizer With Reduced Environmental Impact. Front. Energy Res. 7:88. doi: 10.3389/fenrg.2019.00088
Received: 13 March 2019; Accepted: 13 August 2019;
Published: 28 August 2019.
Edited by:
Claudio Mota, Federal University of Rio de Janeiro, BrazilReviewed by:
James Landon, University of Kentucky, United StatesJoshuah K. Stolaroff, Lawrence Livermore National Laboratory, United States Department of Energy (DOE), United States
Copyright © 2019 Driver, Owen, Makanyire, Lake, McGregor and Styring. This is an open-access article distributed under the terms of the Creative Commons Attribution License (CC BY). The use, distribution or reproduction in other forums is permitted, provided the original author(s) and the copyright owner(s) are credited and that the original publication in this journal is cited, in accordance with accepted academic practice. No use, distribution or reproduction is permitted which does not comply with these terms.
*Correspondence: Peter Styring, p.styring@sheffield.ac.uk