Influence of Mild-Ozone Assisted Disperser Pretreatment on the Enhanced Biogas Generation and Biodegradability of Green Marine Macroalgae
 Karuppiah Tamilarasan
 J. Rajesh Banu
 M. Dinesh Kumar
 G. Sakthinathan3
  Jeong-Hoon Park
- 1Department of Civil Engineering, Vel Tech Rangarajan Dr. Sagunthala R&D Institute of Science and Technology, Chennai, India
- 2Department of Civil Engineering, Anna University Regional Campus, Tirunelveli, India
- 3Department of Automobile Engineering, Madras Institute of Technology, Anna University, Chennai, India
- 4Clean Innovation Technology Group, Korea Institute of Industrial Technology (KITECH), Jeju-si, South Korea
This study illustrated the participation of marine macroalgae biomass (MAB) (Chaetomorphaantennina) in the liquefaction process for bioenergy production. The proposed work intended to investigate the role of disperser pretreatment (DP) and ozone disperser pretreatment (ODP) of MAB for energy efficient biogas generation. The disperser G-force of 1,613 g, pretreatment time 30 min and ozone dosage 0.00049 g O3/g Total solids (TS) was preferred as an optimum conditions for profitable and energy efficient liquefaction in term of soluble COD (Chemical oxygen demand) organic release. On comparing DP and ODP, the MAB liquefaction and methane production potential was much higher (20.5%, 0.20 g COD/g COD) in ODP when compared to DP (11.9%, 0.11 g COD/g COD). Therefore, the ODP essentially improve the anaerobic biodegradability of MAB. The economic assessment showed that the ODP was found to have a higher net profit of 71 United states dollar (USD)/ton of MAB compared to DP (4 USD/ton of MAB).
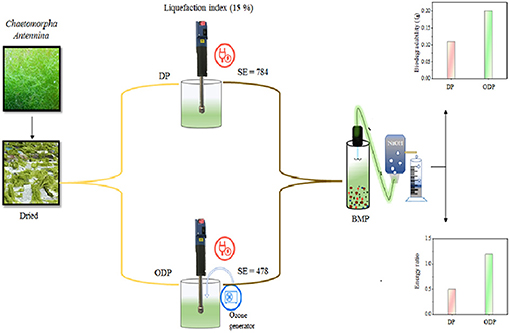
Graphical Abstract. Ozone assisted Disperser Pretreatment (ODP) for biogas production from macroalgal biomass.
Highlights
- A novel attempt to reduce energy demand of disperser pretreatment through mild ozone dosage.
- This futuristic approach induces liquefaction at disperser specific energy of 478 kJ/kg Total solids (TS)
- 0.00049 g O3/g TS ozone was found to be an optimum dosage for ozone disperser pretreatment.
- Biodegradability rate constant 0.21 day−1 was achieved for combined pretreatment.
- Net profit of 71 United states dollar (USD)/ton of MAB was achieved in ozone disperser pretreatment.
Introduction
The imminent scarcity of energy had initiated the investigation in renewable and energy efficient biofuels production using sustainable carbon sources in the form of different organic feedstocks (Kumar et al., 2018). Among biofuels, biomethane was considered to be the most prominent resource due to its combustion ability and its utility in the field of transportation and power production (Ren et al., 2016). Biofuel production from MAB (macroalgae biomass) is recognized as 3rd generation biofuels, to discriminate 1st and 2nd generation biofuels derived from terrestrial plants which has less sustainable yield (Allen et al., 2014). Macroalgae is photosynthetic biomass growing in marine regions and it can be easily biodegradable (Demirbas, 2010). At present, macroalgal biomass has received more attention in biofuel production when compared with other feedstocks (Jung et al., 2011). Many researchers have been reported that usage of macroalgae as substrate in biofuel production have more significant benefits than the other substrates because of its more productivity, less challenging typical agricultural biomasses with high proteins, carbohydrates, and fewer amount of lignin (Premalatha et al., 2011; Ward et al., 2014). Availability of high biopolymers promotes MAB as a best alternative substrate for biomethane production (Dinesh Kumar et al., 2018).
Anaerobic digestion (AD) is the most widely practiced method for many organic biomass treatments to degrade and recover the bioenergy (Gallipoli et al., 2014). In this AD process, there found a major limitation in the disintegration of organic matter i.e., not easily hydrolyzed due to the presence of alginates. To overcome the above complexity, pretreatment has been applied to enhance the biodegradability of MAB (Pham et al., 2013). Several pretreatments such as mechanical, chemical, thermal and bacterial have been used to liquefy the MAB (Lee et al., 2013). Among them, mechanical pretreatment [disperser pretreatment (DP)] has an advantage of competently collapses the algal cell walls and enhance the soluble organic matter release in aqueous medium which accelerate the anaerobic digestion (Rodriguez et al., 2015). But, it has main drawback of high power consumption. To overwhelm the above drawback, coupling of mechanical pretreatment with other process was chosen to be an apt way to enhance the release of soluble organics.
As per the literature survey, addition of a chemical (ozone) is considered as the most powerful technique and greater disintegration ability of complex organic substances (Kannah et al., 2017). Ozone strikes the biomass cell wall and converts the solid fragments into simpler end products (Yang et al., 2013). Due to its strong oxidizing capacity and great liquefaction efficiency, ozone was chosen to coupled with mechanical pretreatment for enhancing the liquefaction process. However, the impact of ozone combined with disperser pretreatment on MAB has not been reported up to now. An attempt of ozone assisted disperser pretreatment (ODP) to liquefy MAB has been incorporated as a novel approach in this research (Graphical Abstract). The conventional pretreatment process consumes more energy and imparts less liquefaction of about 12–14% which in turn reduce bioenergy output during biomethanation (Tamilarasan et al., 2017). In case of combined disperser pretreatment high liquefaction of more than 20% was achieved (Banu et al., 2019). Hence, it has an significant role in improving methane generation using the released disintegrated organics (Sharmila et al., 2017). The core objective of the research is (1) to analyze the potency of disperser pretreatment (DP) in liquefaction process; (2) to fix the solids concentration for efficacious DP and minimize the input energy; (3) to study the significant effect in coupling the ozone with DP for MAB liquefaction; (4) to estimate the influence of ODP in anaerobic fermentation process; and (5) to assess the impact of ODP on biomethane generation.
Materials and Methods
Marine Macroalgae Biomass (MAB)
MAB sample was collected from the southern coastal area near Tuticorin (8°22′39″N, 78°3′8″E), Tamilnadu, India. The raw biomass includes sand particles and shell debris was soaked thrice with tap water and finally shade dried for a couple of days.
Disperser Pretreatment (DP)
DP was done by a disperser (IKA T25 ultra Turrax Disinter homogenizer) assembled with a cleaving tool (S 25, N25, GST). A series of study were analyzed at various g force (403–2,867 g) with 5 g/250 ml of MAB taken in 1 L beakers.
Ozone Disperser Pretreatment (ODP)
ODP was carried out in a cylindrical container having a capacity of 1.2 L with 1 L of working volume, diameter - 5.8 cm and height - 45 cm. Ozone generator developed ozone gas from pure oxygen (Faraday's ozone; L10G) and the gas flow was monitored by a gas flow meter (1LPM). The surplus ozone gas passing through potassium iodide (KI) traps. The optimized DP conditions were applied to different ozone dosage from (0.00016–0.00066 g O3/g TS) based on the flow rates from 0.05 to 0.2 L/min.
Bioacidogenic Experiment
Bioacidification experiment was carried out to investigate about the effect of samples (control, DP, ODP) based on the work of Ushani et al. (2017). The fermentation experiment was performed for 3 days, the substrates and slurry were supplied at a 9:1 ratio. The samples were maintained at 102°C for 30 min. To suppress the methane formation in each bottle by adding 2-bromoethane sulfonic acid (50 mM). All bottle was purged with N2 gas to get rid of the oxygen content and were kept in a shaker at 120 rpm (35°C). Then the substrates were analyzed at 0 and 72 h.
Biomethane Potential (BMP) Experiment
A BMP experiment was carried out by following the procedure entitled in Tamilarasan et al. (2018). In this study, the sample (control, DP, ODP) to inoculum (bovine fluid) ratio was taken as 3:1. To maintain the anaerobic conditions in each sample by purging nitrogen gas and the samples were placed at the shaker (Digital IKA KS 130) at 150 rpm. The methane component in the biogas was evaluated through gas chromatograph. The outcome of BMP was modeled by applying based on the following first order kinetics:
Where M(t)—biomethane yield (g COD/g COD), M(fd)—conversion of organic matter into biomethane (g COD/g COD), k—rate constant (day−1), t—digestion periods (days).The modeling was executed with the help of Matlab (2012a version). Parameters with 95% confidence region were simulated based on Ushani et al. (2017).
Analytical Methods
Total chemical oxygen demand (TCOD), soluble chemical oxygen demand (SCOD), and volatile fatty acids (VFA) were analyzed using standard methods (American Public Health Association, 2005). The biopolymers such as protein and carbohydrates were analyzed based on Kavitha et al. (2015). Lipids were estimated by Griffiths and Harrison (2009).
Energetic Analysis
Energetic analysis was calculated based on the energy consumed during treatment and energy produced as biogas. The outcome of this study was used to establish a realistic approach of ODP of MAB. The energy balance analysis was executed for both DP and ODP samples. One ton of MAB was taken into consideration for energy analysis. Table 1 summarizes the input parameters for energy and economic analysis. The energy parameters that were taken into consideration were expressed as follows.
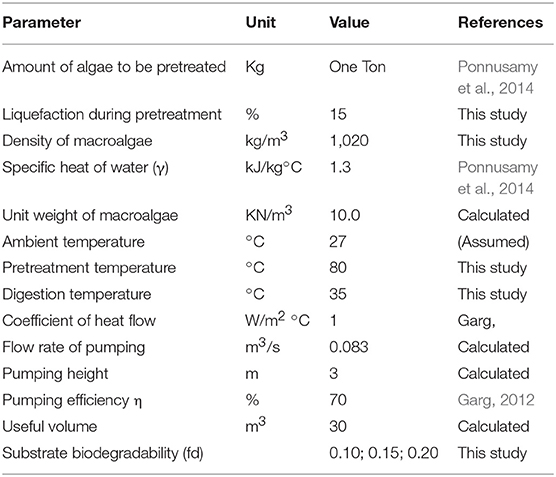
Table 1. Energy analysis parameters.
Input Energy (IEnergy)
The input energy was calculated based on the energy required for DP and ODP process, pumping of MAB, biogas purification, stirring during AD, and maintenance of heat loss.
Disperser specific energy
Specific energy (SE) is a crucial parameter for the estimation of MAB disintegration. SE was analyzed based on the following equation:
Where
SE—Specific energy (kJ/kg TS)
P—power consumed by the disperser,
t—pretreatment time (min),
v—volume (L),
TS—total solid concentration (gL−1).
Ozone specific energy
Specific energy consumed during ozone disaggregation of MAB. The ozone specific energy was carried out as per the equation:
Where
SE, Specific energy (kJ/kg TS)
P, power consumed by ozone generator (kW/min),
T, pretreatment time (min),
V, volume of the sample (L),
C, total solid concentration (mg/L).
Energy spent for pumping
The energy applied for pumping shows the pumping of algal biomass to the digester from the pretreated tank. The energy applied for pumping was analyzed by the following equations:
Where,
PE, Energy applied during pumping (kWh),
PT, Time required for pumping (h),
PR, Required power,
γ, Unit weight of the algae biomass (KN/m3),
Q, Capacity of the pump (m3/S),
L, Pumping height (m),
η, Pumping efficiency (%).
Energy spent for stirring during AD
The energy applied for mixing in AD process was analyzed based on the following equation:
Where,
SEnergy, Energy required for stirring in AD,
RPower, Power demand (kW),
V, Useful volume (m3).
Energy spent for heat loss during AD
The energy needed to maintain the heat loss at walls of the reactor was calculated based on the following equation:
Where,
HLEnergy, Energy spent for heat loss
HFC, Heat flow coefficient (J/m2/h/°C),
SA, Surface area (m2),
ΔT, Temperature difference between the reactor and biomass temperature (°C).
Equations (4–7) were derived as per Metcalf and Eddy (2003).
Output Energy (OEnergy)
The biomethane amount was calculated from the COD consumed, that depends on the biodegradability of the MAB through the following equation:
Output energy is the energy recovered in the form of biomethane, and it was analyzed using a method described by Ferrer et al. (2009). Biodegradability index(BIndex) was calculated as described by Allen et al. (2014).
Energy Ratio (ERatio)
Energy ratio was determined by dividing the output energy by input energy as follows:
Where, OEnergy, Output energy
IEnergy, Input energy.
Results and Discussion
Impact of DP on Soluble Organic Release (SOR)
Figure 1A depicts the impact of disperser g force (403–2,867 g) and treatment time (0–60 min) on the release of soluble organics during DP of MAB substrates. The disperser rod works based on the rotor-stator effect. During the DP method, breakdown of MAB was stretched dynamically to the disperser teeth and forced into the cleave present in the rotor-stator setup. The higher mechanical shear force, agitation, and cavitation enhances the disintegration of MAB substrates (Kavitha et al., 2016). From the figure, it was noticed that disperser g force from (403–2,867 g), the release of soluble organics more rapidly up to 30 min of the treatment time. Further increase in treatment time, there is no enhanced release insoluble organic matters. For example, at 403 g, higher the soluble organic release (830 mg/L) was achieved within the pretreatment time of 30 min. Beyond 30 min, very meager organic release of 870 mg/L was found upto 60 min. The same trend of high organic release was seen for all disperser g forces up to 30 min. Many researcher have also recorded the similar SOR pattern during disperser aided biomass disintegration (Poornima et al., 2014; Karray et al., 2015). This indicates that most of the soluble organic components were released within the pretreatment time of 30 min. Hence, pretreatment time of 30 min was concluded as an optimum for the DP method.
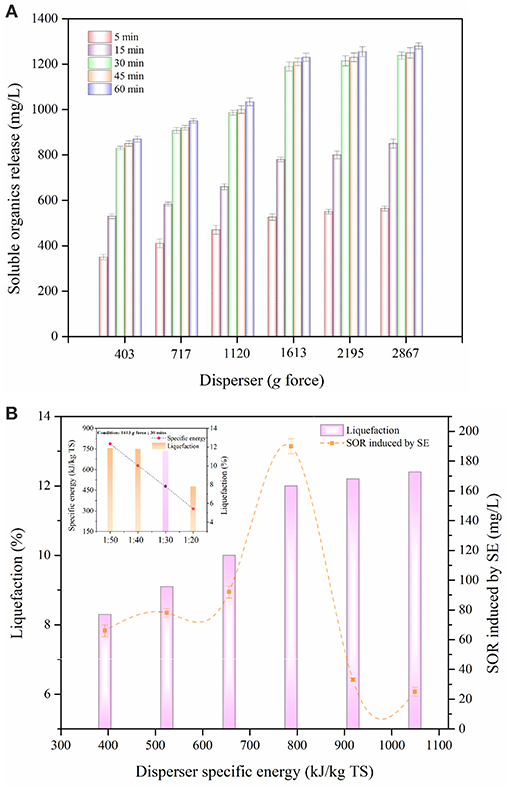
Figure 1. (A) Effect of disperser G force on liquefaction of MAB. (B) Effect of disperser specific energy on liquefaction of MAB.
Optimization of disperser g force during pretreatment had an significant effect in enhancing the liquefaction. Since, the disperser g force has a direct impact insoluble organic components release (Dinesh Kumar et al., 2018). On evaluating the release pattern of soluble organics with respect to disperser g force (Figure 1A), the organic release was quite low between the g force from 403 to 1,120 g, which reveals anonly half portion of the MAB substrates were disintegrated. Based on the poor disintegration of disperser g force from 403 to 1,120 g was not considered for future work, when the disperser g force was increased from 1,120 to 1,613 g, a substantial improvement in SOR was noted (986–1,190 mg/L). This suggests that the disperser g force 1 613 g is more capable to enhance the disintegration of MAB substrates. Beyond the disperser g force of 1,613 g could not cause any major impact to disintegrate the MAB substrates. At the maximum applied disperser g force of 2,867 g, the SOR was recorded to be 1,238 mg/L. The disperser g force from 1,613 to 2,867 g cause insignificance increase in SOR from 1,190–1,238 mg/L and thus can be neglected. Figure 1B depicts the effect of disperser specific energy on liquefaction of MAB with respect to SOR induced by the specific energy at an optimal pretreatment time of 30 min. From the figure, it was evident that the pattern of liquefaction falls under three phases of organic release i.e., slower liquefaction phase (393–656 kJ/kg TS), rapid liquefaction phase (656–787 kJ/kg TS), and stable liquefaction phase (787–1,049 kJ/kg TS). In slower liquefaction phase, the liquefaction occurs gradually from 8.3 to 10% during the disperser specific energy increment from 393 to 656 kJ/kg TS. This phase induces less SOR of about 66–92 mg/L. However, the rapid phase shows a substantial improvement in liquefaction from 10 to 12% with the disperser specific energy increment from 656 to 787 kJ/kg TS. The maximum SOR induced of 190 mg/L is found in this phase which is twice higher than slower liquefaction phase. In stable liquefaction phase, there is no much remarkable increment in liquefaction (12–12.4%) compared with the other two phases. From this phase, the SOR induced by the specific energy was found to be minimum (33–25 mg/L). These above results indicate, a pretreatment time of 30 min and g force 1,613 g was considered as an optimum for DP. In mechanical pretreatment, the solid concentration plays a major role in liquefaction efficiency of the biomass and specific energy input (Rodriguez et al., 2015). Based on the optimum condition of the DP method (disperser g force 1,613 g, time – 30 min) was applied to various solids concentrations from (1:50 to 1:20). As shown in Figure 1B, the liquefaction of MAB substrate ratios 1:50, 1:40, and 1:30 were merely the same and it was found to be 11.9, 11.8, and 11.6%, respectively. At the same time, in energy point of view, the specific energy was reduced gradually from (787 to 478 kJ/kg TS) while increasing the substrate concentration from 1:50 to 1:30. From the above, specific energy could be saved almost two times at 1:30 substrates ratio. Further, increasing the substrate concentration to 1:20, the liquefaction 7.8% was reduced drastically. This decrement only due to more solids concentration and minimum aqueous level which leads to reduce the efficiency of rotor-stator speed by clogging. Given the above, the solids concentration ratio of 1:30 has been concluded and proceed for further studies.
Impact of ODP on SOR
Ozone is a highly energetic oxidant which can be helped to enhance the efficiency of pretreatment for all carbonaceous organic substrates (Zheng et al., 2014). In ODP method, MAB substrates were performed under different ozone concentration (0.00016–0.00066 g O3/g TS) at an optimum DP condition (1,613 g) for pretreatment time of 30 min. The impact of ODP substrates on SOR was shown in Figure 2. The effect of ozone on MAB can be listed on the following two modes of actions. Primarily, ozone pierces through the MAB complex cell structure, collapse it and discharges the soluble organics into water medium. In the second stage, excess ozone strikes the dispersed organics and mineralizes it (Zhang et al., 2009; Kannah et al., 2017). From the figure, the soluble organics release pattern can be distinguished into two different phases (phase I and phase II) for all the ozone concentration from (0.00016 to 0.00066 g O3/g TS). The phase I specifies the organic release and phase II specifies the organic mineralization. At initial ozone concentration of 0.00016 g O3/g TS, a maximum SOR of 1,400 mg/L recorded at 22 min. Beyond that organic release starts to decrease due to mineralization effect. However, after adding ozone concentration of 0.00033 g O3/g TS, a maximum organic release (1,850 mg/L) was achieved at 18 min beyond that duration the organic release tends to decrease. Further, applying the ozone dosage to 0.00049 g O3/g TS, a maximum organic release (2,050 mg/L) was achieved within 10 min of the treatment time. This was two-fold time higher soluble organics release than DP (1,190 mg/L) pretreatment. Moreover, pretreatment time required to attain maximum SOR for the ozone dosage of 0.00016 and 0.00033 g O3/g TS was much higher than 0.00049 g O3/g TS of ozone dosage. The higher soluble organics release was found in phase I was mainly due to the collapse of MAB cell membrane produced by the combinative effect of disperser rotor—stator shear force and ozone radicals. From this release trend, the first mode of action performed well at 0.00049 g O3/g TS of ozone dosage. After applying the ozone concentration of 0.00066 g O3/g TS, a sudden decrement was found in SOR (1,000 mg/L) due to mineralization. From the above results, the ozone concentration 0.00049 g O3/g TS was considered as an optimum for effective liquefaction when combined with DP.
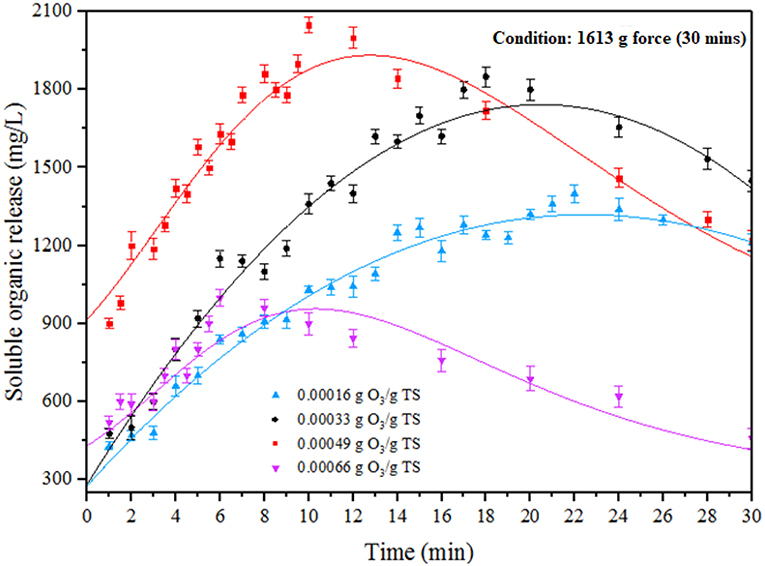
Figure 2. Effect of ozone disperser pretreatment (ODP) on organic matter release.
Impact of ODP on Biopolymers Release
Biopolymers are the most important intracellular components of MAB (Barbot et al., 2015; Banu et al., 2019). In addition, Lipids also has high impact in promoting liquefaction of MAB (Murugaiyan et al., 2012). Presence of these components in the aqueous phase increases the potential of biomethane generation during AD process (Debowski et al., 2013). The biopolymers (protein, carbohydrate, and lipid) release of DP and ODP was compared based on the results and were displayed in Figure 3. At initial ozone concentration of 0.00016 g O3/g TS, the release of protein, carbohydrate, and lipid were recorded as 560, 350, and 210 mg/L, respectively. The maximum protein, carbohydrate and lipid concentration were found to be 769, 526, and 430 mg/L, respectively were released at an ozone dosage of 0.00049 g O3/g TS. This could be attributed to the dispersion of MAB substance which allows the ozone very easily to disintegrate the MAB substrates during ODP. Further, increasing the ozone dosage from 0.00049 to 0.00066 g O3/g TS, at which concentration of protein, carbohydrates and lipids were declines drastically from 769 to 420 mg/L, 526 to 260 mg/L, and 430 to 110 mg/L, respectively. This decrement mainly due to the excess ozone concentration can be converted the released biopolymers into amino acids, peptones and simple sugar molecules (Zhang et al., 2009). Comparing the results of biopolymers release at various ozone dosages, 0.00049 g O3/g TS can be disintegrating the MAB cell walls effectively along with the help of disperser shear force. On comparing the outcome of DP and optimized ODP (0.00049 g O3/g TS) sample, DP showed very low in protein (400 mg/L), carbohydrate (250 mg/L), and lipid (100 mg/L) release. An ozone dosage 0.00049 g O3/g TS of ODP sample showed about nearly three times increases in total biopolymers release (1,725 mg/L) when compared to DP (750 mg/L). This indicates that the dual mode action were performed by ODP that might brought about greater liquefaction of MAB. However, in this study released protein and carbohydrate concentration were comparatively higher than lipids because the release of two major components in MAB liquefaction always depends on the group and chemical content of the biomass. These changes in biopolymers release have been due to the impact of pretreatment varies with the species type (Pham et al., 2013).
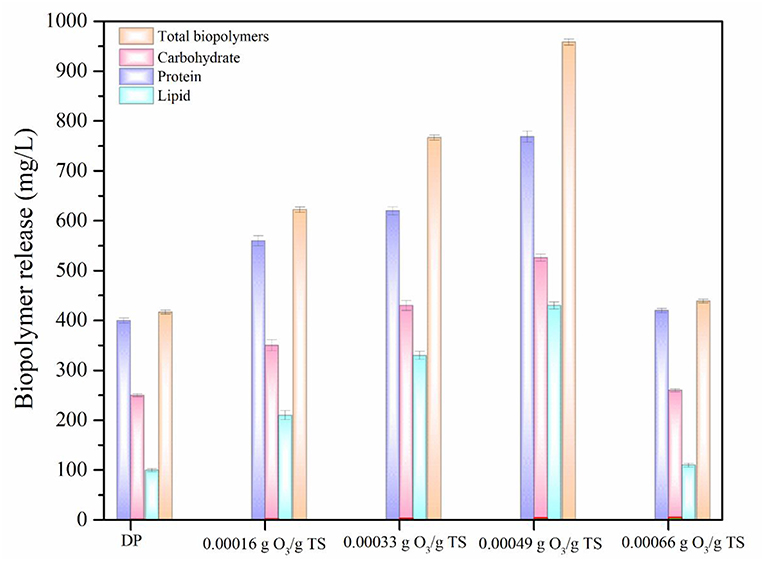
Figure 3. Effect of ozone disperser pretreatment (ODP) on biopolymer release.
Effect of DP and ODP on Bioacidogenic Experiment
During the AD process, the major soluble biopolymers such as proteins and carbohydrates were hydrolyzed into amino acids and sugar molecules by fermentative bacteria. During this fermentation study, the soluble compounds can be transformed into VFA by the acetogenic microbes (Yi et al., 2013; Dinesh Kumar et al., 2018). The higher consumption of biopolymers from MAB substrate leads to more VFA accumulation (Jiang et al., 2007). Figure 4 shows the effect of control, DP and ODP substrates on bioacidogenic experiments. In control, the release rate of protein and carbohydrates were gradually increased from 99 to 202 mg/L and 28 to 50 mg/L, respectively intimates the domination of hydrolysis against fermentation. Moreover, in DP substrate, from 0 to 72 h the concentration of protein (400–170 mg/L) and carbohydrates (250–44 mg/L) was decreased. The same pattern was noticed for protein (769–143 mg/L) and carbohydrates (526–30 mg/L) in ODP substrate. At the end of bioacidogenic experiments, the reduction in the concentration of both the samples (DP and ODP), indicates the efficient consumption of soluble biopolymers by fermentative bacteria. During bioacidogenic phase, the most important component to be observed is the accumulation of VFAs for enhancing the fermentation experiment (Kuglarz et al., 2013). In ODP sample, the high VFA of 950 mg/L was produced when compared to DP (366 mg/L) and control (57 mg/L) substrates. In combined pretreatment, more VFA was mainly obtained due to the energetic utilization and conversion of substrate to final products by fermentative bacteria. This outcome confirms that ODP can improve the bioacidogenic potential for achieving effectual fermention than DP.
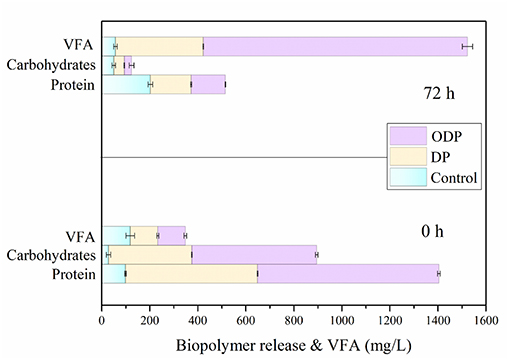
Figure 4. Effect of ozone disperser pretreatment (ODP) on anaerobic fermentation.
Biomethane Potential Assay
Specific methane yield for control, DP and ODP samples over a time period of 25 days is depicted in Figure 5A. At the beginning, biomethane production was observed to be minimum in control, DP and ODP samples (0.016, 0.068, and 0.116 g COD/g COD, respectively). This minimum biomethane production was mainly due to the acclimatization time required for methanogenic bacteria to adopt in a new environment (Kavitha et al., 2016; Tamilarasan et al., 2017). Later in lag phase, the digestion period starts from the 5th day, and biomethane production starts to increase rapidly up to 15th day. Hence, noted that ODP sample achieved greater biomethane production (0.20 g COD/g COD) than DP sample (0.112 g COD/g COD). This happens because of more hydrolysis and effective fermentation by methanogenic bacteria in ODP, which leads to achieve more biomethane production. In contrary, the control sample can be produced only 0.028 g COD/g COD methane, which indicates that unbroken MAB cell walls require more days to degrade (Ding et al., 2016). The biomethane production between 15 and 25 days remains stable, this due to most of the available substrates was degraded within 15 days of digestion period. The correlation coefficient (R2) lies between 0.98 and 0.99 reveals that the modeled data exactly fitted with actual data. The ODP sample exposed a higher biodegradability than others (Figure 5B). The kinetic parameters were estimated and compiled in Table 2. The biodegradability limit of DP and ODP were 0.11 and 0.20 g COD/g COD with narrow confidence area which reveals more assurance (Ushani et al., 2017). In control, the biodegradability limit was achieved 0.035 g COD/g COD with wider confidence area, which indicates less assurance. The hydrolysis constant (Khyd) outcome for control, DP and ODP samples were found to be 0.11, 0.17, and 0.21 day−1, respectively. Thus, the outcome of the results of BMP assay concludes, ODP achieve enhanced biodegradability and biomethane production than DP.
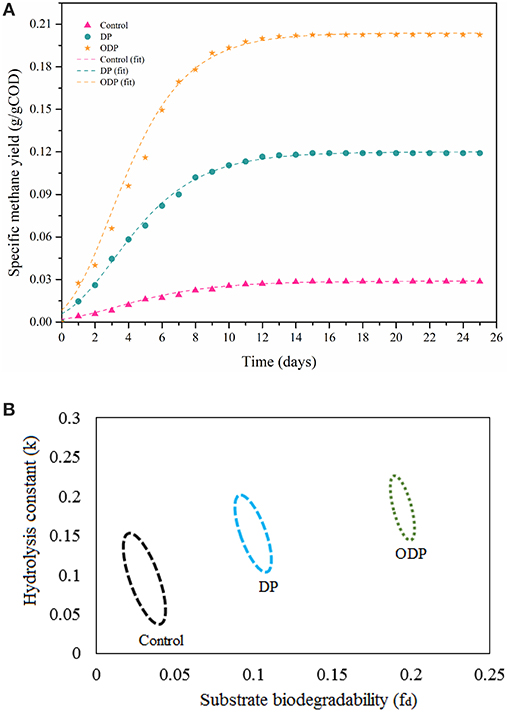
Figure 5. (A) Plot showing methane production potential of different MAB samples. (B) Plot showing confidence regions of substrate biodegradability vs. hydrolysis constant for different MAB samples.
Table 2. Modeling using non-linear regression for various MAB samples.
Energy Analysis and Cost Estimation
The cost assessment of DP and ODP substrates were calculated based on the energy output as biomethane and the specific energy required for effective disintegration of MAB. Figure 6 shows the energy analysis and cost estimation of DP and ODP samples. In addition, the total applied energy must be counteracted by net energy production. The overall applied energy includes energy applied for MAB liquefaction, AD process, purification, pumping, compression and heat loss. In this study, MAB liquefaction of 15% was selected as an index to evaluate the cost and energy balance of this current research. DP requires an overall input energy of 473 kWh to attain 15% of liquefaction. But, ODP consumes only 184 kWh to achieve the same amount of liquefaction i.e., DP consumes nearly 3 times more input energy than ODP. This signifies that implementation of ODP pretreatment can conserve sufficient amount of energy and provide better energy efficient liquefaction of MAB. In addition, methane yield and disposal of reduced solids are considered as an another two main aspects in cost analysis. The net energy production of DP and ODP was computed to be −253 and 41 kWh, respectively. On comparing, ODP achieved profitable energy production than DP sample. Also, energy ratio achieved was more than 1 indicates proficient energetic methane yield since <1 shows that high input energy consumption which exceeds the output energy (Ferrer et al., 2009; Passos et al., 2014). The energy ratio was achieved to be 0.5 and 1.2 for DP and ODP samples, respectively. High energy ratio of ODP indicates better workability and feasiblilty in large scale. Though ozone specific energy was included in ODP, it does not produce any major impact on treatment cost (Kannah et al., 2017). Based on the above findings, the calculated energy cost for ODP achieved positive (11 USD/ton of MAB) than DP (-55 USD/ton of MAB). Analyzing the net profit for obtaining 15% liquefaction, ODP earned more profit (71 USD/ton of MAB) when compared to DP sample (4 USD/ton of MAB). From the above, energy and cost required very minimum in ODP than DP process. From the above results, ODP was concluded to be more profitable and to be implemented on the field.
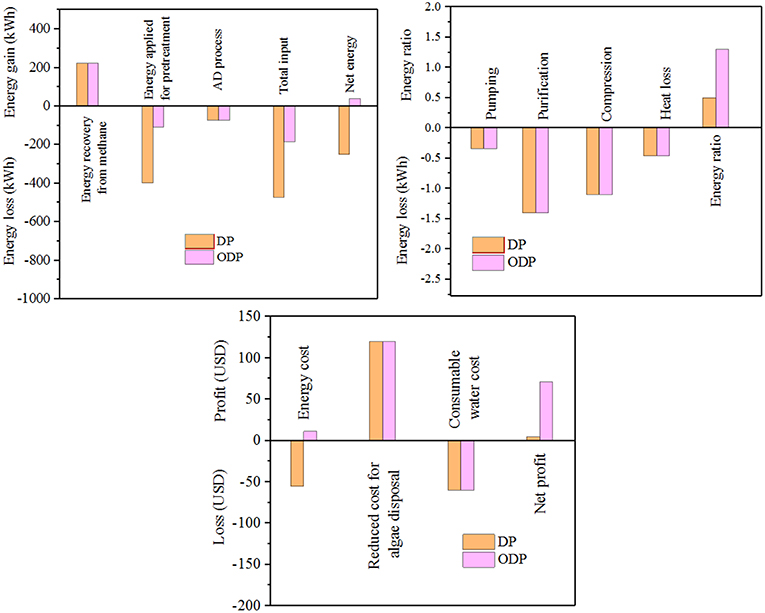
Figure 6. Effect of DP, ODP samples on energy balance, and cost assessment.
Conclusion
The present study highlights the effect of ODP on macroalgal biomass over DP in terms of greater liquefaction (15%), biodegradation (0.20 g COD/g COD) and lesser energy consumption (478 kJ/kg TS COD). By taking the profitability of process into account, ODP process at disperser g force 1,613 g, treatment time 30 min with ozone dosage of 0.00049 g O3/g TS was considered to be energetically and economically sustainable. Based on the economic analysis, a net profit of 71 USD/ton of MAB with energy ratio of 1.2 was achieved in ODP and was found to be beneficial when compared to DP process (4 USD/ton of MAB) with the energy ratio of 0.5.
Data Availability
The datasets generated for this study are available on request to the corresponding author.
Author Contributions
KT did the work and was helped by MK. JB supervised the work. GS helped in energy and cost analysis. J-HP validated the finding and shared idea.
Conflict of Interest Statement
The authors declare that the research was conducted in the absence of any commercial or financial relationships that could be construed as a potential conflict of interest.
References
Allen, E., Wall, D. M., Herrmann, C., and Murphy, J. D. (2014). Investigation of the optimal percentage of green seaweed that may be co-digested with dairy slurry to produce gaseous biofuel. Bioresour. Technol. 170, 436–444. doi: 10.1016/j.biortech.2014.08.005
American Public Health Association (2005). Standard Methods for the Examination of Water and Wastewater, 21st Edn. Washington, DC: American Public Health Association/American Water Works Association/Water Environment Federation.
Banu, J. R., Tamilarasan, K., Uma Rani, R., Cho, S. K., Almuhtasebala Gunasekaran, M., and Kumar, G. (2019). Dispersion aided tenside disintegration of seagrass syringodiumisoetifolium: towards biomethanation, kinetics, energy exploration and evaluation. Bioresour. Technol. 277, 62–67. doi: 10.1016/j.biortech.2019.01.026
Barbot, Y. N., Thomsen, L., and Benz, R. (2015). Thermo-acidic pretreatment of beach macroalgae from rugento optimize biomethane production—double benefit withsimultaneous bioenergy production and improvement of local beach and waste management. Mar. Drugs. 13, 5681–5705. doi: 10.3390/md13095681
Debowski, M., Zielinski, M., Grala, A., and Dudek, M. (2013). Algae biomass as an alternative substrate in biogas production technologies—review. Renew. Sust. Energy Rev. 27, 596–604. doi: 10.1016/j.rser.2013.07.029
Demirbas, A. (2010). Use of algae as biofuel sources. Energy Convers. Manage. 51, 2738–2749. doi: 10.1016/j.enconman.2010.06.010
Dinesh Kumar, M., Tamilarasan, K., Kaliappan, S., Banu, J. R., Rajkumar, M., and Kim, S. H. (2018). Surfactant assisted disperser pretreatment on the liquefaction of ulva reticulata and evaluation of biodegradability for energy efficient biofuel production through nonlinear regression modelling. Bioresour. Technol. 255, 116–122. doi: 10.1016/j.biortech.2018.01.116
Ding, L., Cheng, J., Xia, A., Jacob, A., Voelklein, M., and Jerry, D. (2016). Co-generation of biohydrogen and biomethane through two-stage batch co-fermentation of macro- and micro-algal biomass murphy. Bioresour. Technol. 218, 224–231. doi: 10.1016/j.biortech.2016.06.092
Ferrer, I., Serrano, E., Ponsa, S., Vazquez, F., and Font, X. (2009). Enhancement of thermophilic anaerobic sludge digestion by 70°C pretreatment: energy considerations. J. Res. Sci. Technol. 6, 11–18.
Gallipoli, A., Gianico, A., Gagliano, M. C., and Braguglia, C. M. (2014). Potential of high-frequency ultrasounds to improve sludge anaerobic conversion and surfactants removalat different food/inoculum ratio. Bioresour. Technol. 159, 207–214. doi: 10.1016/j.biortech.2014.02.084
Griffiths, M., and Harrison, T. (2009). Lipid productivity as a key characteristic for choosing algal species for biodiesel production. J. App.Phycol. 21, 493–507. doi: 10.1007/s10811-008-9392-7
Jiang, S., Chen, Y., Zhou, Q., and Gu, G. (2007). Biological short-chain fatty acids (SCFAs) production from waste-activated sludge affected by surfactant. Water Res. 41, 3112–3120. doi: 10.1016/j.watres.2007.03.039
Jung, K. W., Kim, D. H., and Shin, H. S. (2011). Fermentative hydrogen production from Laminaria japonica and optimization of thermal pretreatment conditions. Bioresour.Technol. 102, 2745–2750. doi: 10.1016/j.biortech.2010.11.042
Kannah, R. Y., Kavitha, S., Banu, J. R., Karthikeyan, O. K., and Sivashanmugham, P. (2017). Dispersion induced ozone pretreatment of waste activated biosolids: arriving biomethanation modelling parameters, energetic and cost assessment. Bioresour. Technol. 244, 679–687. doi: 10.1016/j.biortech.2017.08.001
Karray, R., Hamza, M., and Sayadi, S. (2015). Evaluation of ultrasonic, acid, thermoalkaline and enzymatic pre-treatments on anaerobic digestion of Ulva rigida for biogas production. Bioresour. Technol. 187, 205–213. doi: 10.1016/j.biortech.2015.03.108
Kavitha, S., Banu, J. R., Kumar, J. V., and Rajkumar, M. (2016). Improving the biogas production performance of municipal waste activated sludge via disperser induced microwave disintegration. Bioresour. Technol. 217, 21–27. doi: 10.1016/j.biortech.2016.02.034
Kavitha, S., Kannah, R. Y., Yeom, I. T., Do, K. U., and Banu, J. R. (2015). Combined thermo-chemo-sonic disintegration of waste activated sludge for biogas production. Bioresour. Technol. 197, 383–392. doi: 10.1016/j.biortech.2015.08.131
Kuglarz, M., Karakashev, D., and Angelidaki, I. (2013). Microwave and thermal pretreatment as methods for increasing the biogas potential of secondary sludge from municipal wastewater treatment plants. Bioresour. Technol. 134, 290–297. doi: 10.1016/j.biortech.2013.02.001
Kumar, G., Shobana, S., Nagarajan, D., Lee, D. J., Lee, K. S., Lin, C. Y., et al. (2018). Biomass based hydrogen production by dark fermentation — recent trends and opportunities for greener processes. Curr. Opin. Biotechnol. 50, 136–145. doi: 10.1016/j.copbio.2017.12.024
Lee, J. Y., Li, P., Lee, J., Ryu, H. J., and Oh, K. K. (2013). Ethanol production from Saccharina japonica using an extremely low acid pretreatment followed by simultaneous saccharification and fermentation. Bioresour. Technol. 127, 119–125. doi: 10.1016/j.biortech.2012.09.122
Metcalf., and Eddy, Inc. (2003). Wastewater Engineering: Treatment Disposal and Reuse. New York, NY: McGraw-Hill.
Murugaiyan, K., Narasimman, S., and Anatharaman, P. (2012). Proximate composition of marine macro algae from seeniappadharka, gulf of mannar region, Tamilnadu. Int. J. Res. Marine Sci. 1, 1–3.
Passos, F., Hernandez-Marine, M., Garcia, J., and Ferrer, I. (2014). Long-term anaerobic digestion of microalgae grown in HRAP for wastewater treatment. Effect of microwave pretreatment. Water Res. 49, 351–359. doi: 10.1016/j.watres.2013.10.013
Pham, T. N., Um, Y., and Yoon, H. H. (2013). Pretreatment of macroalgae for volatile fatty acid production. Bioresour. Technol. 146, 754–757. doi: 10.1016/j.biortech.2013.07.080
Ponnusamy, S., Reddy, H. K., Muppaneni, T., Downes, C. M., and Deng, S. (2014). Life cycle assessment of biodiesel production from algal bio-crude oils extracted under subcritical water conditions. Bioresour. Technol. 170, 454–461. doi: 10.1016/j.biortech.2014.07.072
Poornima, D. T., Ebenezer, A. V., Kumar, S. A., Kaliappan, S., and Banu, J. R. (2014). Effect of deflocculation on the efficiency of disperser induced dairy waste activated sludge disintegration and treatment cost. Bioresour. Technol. 167, 151–158. doi: 10.1016/j.biortech.2014.06.004
Premalatha, M., Dhasarathan, P., and Theriappan, P. (2011). Phytochemical characterization and antimicrobial efficiency of seaweed samples, Ulva fasciata and Chaetomorpha antennina. Int. J. Pharma. Bio Sci. 2, 288–293.
Ren, N. Q., Zhao, L., Chen, C., Guo, W. Q., and Cao, G. L. (2016). A review on bioconversion of lignocellulosic biomass to H2: key challenges and new insights. Bioresour. Technol. 215, 92–99. doi: 10.1016/j.biortech.2016.03.124
Rodriguez, C., Alaswad, A., Mooney, J., Prescott, T., and Olabi, A. G. (2015). Pre-treatment techniques used for anaerobic digestion of algae. Fuel Process.Technol. 138, 765–779. doi: 10.1016/j.fuproc.2015.06.027
Sharmila, V. G., Dhanalakshmi, P., Banu, J. R., Kavitha, S., and Gunasekaran, M. (2017). Effect of deflocculation on photo induced thin layer titanium dioxide disintegration of dairy waste activated sludge for cost and energy efficient methane production. Bioresour. Technol. 244, 776–784. doi: 10.1016/j.biortech.2017.08.030
Tamilarasan, K., Arulazhagan, P., Rani, R. U., Kaliappan, S., and Banu, J. R. (2018). Synergistic impact of sonic-tenside on biomass disintegration potential: acidogenic and methane potential studies, kinetics and cost analytics. Bioresour. Technol. 253, 256–261. doi: 10.1016/j.biortech.2018.01.028
Tamilarasan, K., Kavitha, S., Rajesh Banu, J., Arulazhagan, P., and Yeom, I. T. (2017). Energy efficient methane production from macroalgal biomass through chemo disperser liquefaction. Bioresour. Technol. 228, 156–163. doi: 10.1016/j.biortech.2016.12.102
Ushani, U., Banu, J. R., Tamilarasan, K., Kavitha, S., and Yeom, I. T. (2017). Surfactant coupled sonic pretreatment of waste activated sludge for energetically positive biogas generation. Bioresour. Technol. 241, 710–719. doi: 10.1016/j.biortech.2017.05.201
Ward, A. J., Lewis, D. M., and Green, F. B. (2014). Anaerobic digestion of algae biomass: a review. Algal Res. 5, 204–214. doi: 10.1016/j.algal.2014.02.001
Yang, S. S., Guo, W. Q., Meng, Z. H., Zhou, X. J., Feng, X. C., and Zheng, H. S. (2013). Characterizing the fluorescent products of waste activated sludge in dissolved organic matter following ultrasound assisted ozone pretreatments. Bioresour. Technol. 131, 560–563. doi: 10.1016/j.biortech.2013.01.024
Yi, X., Luo, K., Yang, Q., Li, X. M., Deng, W. G., Cheng, H. B., et al. (2013). Enhanced hydrolysis and acidification of waste activated sludge by biosurfactant rhamnolipid. Appl. Biochem. Biotechnol. 171, 1416–1428. doi: 10.1007/s12010-013-0439-0
Zhang, G., Yang, J., Liu, H., and Zhang, J. (2009). Sludge ozonation: disintegration,supernatant changes and mechanisms. Bioresour. Technol. 100, 1505–1509. doi: 10.1016/j.biortech.2008.08.041
Keywords: liquefaction, biopolymers, energy ratio, pretreatment, hydrolysis
Citation: Tamilarasan K, Banu JR, Kumar MD, Sakthinathan G and Park J-H (2019) Influence of Mild-Ozone Assisted Disperser Pretreatment on the Enhanced Biogas Generation and Biodegradability of Green Marine Macroalgae. Front. Energy Res. 7:89. doi: 10.3389/fenrg.2019.00089
Received: 24 June 2019; Accepted: 14 August 2019;
Published: 18 September 2019.
Edited by:
Abdul-Sattar Nizami, King Abdulaziz University, Saudi ArabiaReviewed by:
Su Shiung Lam, Universiti Malaysia Terengganu, MalaysiaVivekanand Vivekanand, Malaviya National Institute of Technology, India
Mukesh Kumar Awasthi, College of Natural Resources and Environment, Northwest A&F University, China
Copyright © 2019 Tamilarasan, Banu, Kumar, Sakthinathan and Park. This is an open-access article distributed under the terms of the Creative Commons Attribution License (CC BY). The use, distribution or reproduction in other forums is permitted, provided the original author(s) and the copyright owner(s) are credited and that the original publication in this journal is cited, in accordance with accepted academic practice. No use, distribution or reproduction is permitted which does not comply with these terms.
*Correspondence: J. Rajesh Banu, rajeshces@gmail.com