Energy and Water Monitoring for a Large Social Housing Intervention in Northern Italy
 Marco Filippi1
  Elisa Sirombo2*
- 1Energy Department, Politecnico di Torino, Turin, Italy
- 2GET srl, Turin, Italy
In recent years, the awareness of the problem of the performance gap and rebound effect extends the interest in assessing the real operation of buildings, in assessing how buildings match users' needs once they are occupied, and in understanding how occupants' behavior affects the actual building performance. The paper discusses the case study and presents the results of a monitoring campaign of 2 years of occupancy of a large social housing intervention recently built near Milan, for a total of 152 flats. Data about the thermal energy consumption for heating and cooling, the domestic hot and cold water use, and the occupants' intervention on controlling devices are assessed and presented. The case study is representative of the actual design and construction of high-performing multi-family buildings in Italy. All the buildings are class A rated, very highly insulated, and ventilated with centralized mechanical ventilation systems with thermodynamic heat recovery. Centralized water-to-water heat pumps supply hot and refrigerated water for heating and cooling and domestic hot water as well. A building monitoring system is installed, able to track energy and water consumption, factors influencing the energy consumption not related to the building characteristics (weather data, operational setting) as well as the overall building performance data. The results show unexpected high energy and water consumption and moreover a large variability of the energy and water consumption pattern among the dwellings and between the years due to the significant influence of the occupants' behavior and habits.
Introduction
Considering the strict path established in the 2030 climate and energy framework at the European level for reaching a 40% below 1990 level of CO2 reduction by 2030, strong efforts are needed into the adoption of actions for understanding the complexities related to the building's actual operation. According to recent estimations, in Europe, the residential sector accounts for 25% of the total building energy consumption; according to the EU Reference Scenario (2016), energy efficiency in the residential sector can be improved by using more efficient energy equipment, upgrading energy characteristics of buildings, and inducing changes in energy consuming behavior. Moreover, as widely reported in literature, the new buildings rarely perform as predicted during the design stage. The mismatch between the expected energy performance of new buildings and the actual energy bills has been addressed as “performance gap” (Carbon Trust, 2011; Menezes et al., 2012; Wilde, 2014), and the magnitude of the gap can be significant, especially in case of new expected “low energy” buildings (class A building). A similar phenomenon, addressed as “rebound share” or “energy savings deficit,” interests the refurbishment of existing buildings, where energy savings achieved in practice (and thus the reduction in CO2 emissions), due to building retrofit measures, is lower than those calculated in engineering conservation studies (Belaïd et al., 2018; Galvin, 2014).
The minimization of the performance gap is a key issue in the case of public–private social housing projects where energy performance measures are a crucial driver of feasibility. It has been demonstrated that the high-energy performance of buildings is a leverage for the provision of affordable housing; lower energy bills turns into tenants' willingness to pay higher rents, increasing economic benefits for the investor (Copiello, 2016).
There are many studies in which residential buildings were experimentally evaluated and investigated for the identification of the influencing factors on the performance gap. However, the case studies proposed are mainly detached houses or low-rise multifamily buildings (Colclough et al., 2018; Gupta et al., 2018). A limited number of assessments of multi-family buildings were found. For example, Rouleau et al. (2018) presented the results of the study of a multi-residential social housing building located in Quebec City, Canada, consisting of 40 apartments. It was shown that occupant behavior greatly influences the efficiency of a building, since identical dwellings may reach substantially different levels of energy demand.
Generally, the reasons causing the performance gap are categorized into three main groups: causes that pertain to the design stage, such as wrong assumptions in the energy models and inadequate predictions; causes rooted in the construction stage, such as difference between design and real construction; and causes that relate to the operational stage, such as not correctly operating systems as commissioned (including deficiencies in equipment installation and proper maintenance) or building occupants not behaving as supposed (Wilde, 2014).
Studying the real performance of residential buildings by assessing how buildings match users' needs once they are occupied and by acquiring more information and data on attitudinal factors of occupants becomes an important research issue in order to increase the understanding of the real energy and water consumption pattern in residential buildings and to get real energy savings (and the reduction in CO2 emissions). Efforts are increasingly underway to link prediction and measured data in integrated building information systems (Sirombo et al., 2017); while this does not necessarily bridge the gap, it at least works toward increasing the stakeholders' (designers, users, facility managers, etc.) awareness about the problem (Sirombo and Flippi, 2017). Refer, for example, to the CarbonBuzz project1 launched in 2008 by the Royal Institute of British Architects (RIBA) and the Chartered Institution of Building Services Engineers (CIBSE); it is a free online platform allowing practices to share and publish building energy consumption data anonymously, comparing that to predicted and benchmark values. A similar data gathering tool is Arc2, an online tool where any project can participate and immediately start measuring energy and sustainability performance across any rating system or standard and benchmark against the industry values.
In new buildings and interventions, a building monitoring system (MS) is strongly recommended (Ahmad et al., 2016; Calì et al., 2016), as it could provide objective data to:
- Better understand the real performance of buildings, monitoring the energy consumption, the behavior of occupants, and their interaction with new technologies;
- Assess the usability, reliability, and acceptance of new technologies;
- Address operation and maintenance activities.
However, in recent years, the implementation of building energy monitoring and management systems has been indirectly addressed by the European Directives, such as the Energy Performance of Building Directive recast (EPBD recast 2010/31/EU) and the Energy Efficiency Directive (EED 2012/27/EU) promoting the improvement of the operation of existing buildings and the diffusion of more transparent market and contributing to an increase of the awareness of the final consumers. The first has encouraged the use of intelligent metering systems for new or renovated buildings; the latter has fostered the customer access to real-time and historical energy consumption data and has introduced for large companies energy audit obligations and annual energy reporting. In Italy, the D.lgs. 102/2014, in response to the EED 2012/27/EU, requires, in multifamily buildings, the installation of energy metering devices able to track the “voluntary” energy consumptions for heating, cooling, and domestic hot water (DHW) of individual units for energy costs allocation.
Within this framework, the paper aims at presenting the implementation of a building MS installed in a large social housing intervention in Italy and at discussing the results of a long-term monitoring of the thermal energy and water consumption of a set of 152 dwellings in 2 years of occupation.
The objectives of the analysis are the following:
- Evaluate the actual operational rating of the occupied flats for heating and cooling, comparing both the consumption of dwellings between each other in the same period and through the years;
- Evaluate the annual consumption of DHW and domestic cold water (DCW);
- Investigate the pattern of energy and water consumption through the years;
- Investigate the influence of occupant behavior in the measured energy and water consumption of the flats through the available monitored data.
The case study
The case study refers to a large environmentally social housing intervention recently built near Milan in Northern Italy. It interests a large site for a total area of about 50,000 m2 and seven condominiums, for a total of 29,400 m2 of gross floor area housing 323 flats with floor area ranging from 28 to 114 m2, common auxiliary spaces (living room, laundry, storage room), 1,325 m2 of retail spaces, some offices, and co-working spaces. Common outdoor amenities and utilities are available for inhabitants (Figure 1). It has been completed in 2015 and partially (70%) occupied till now, and it is representative of the actual design and construction of high-performing multi-family buildings in Italy.
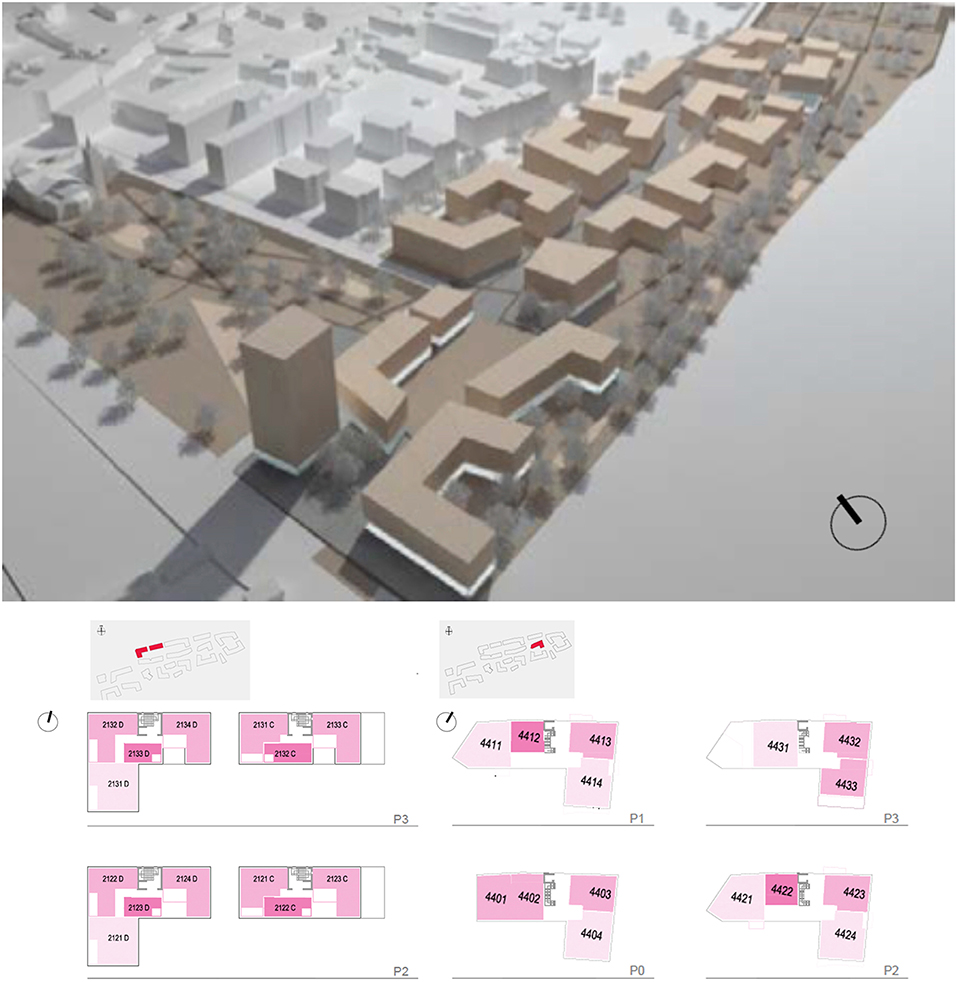
Figure 1. Schematic view of the social housing intervention and layout of some dwellings.
Buildings are designed to achieve high-energy performance in operation, reducing the heating, and cooling demand, installing high-energy efficient HVAC systems and renewable energy technologies. Apartment buildings have a surface-to-volume ratio between 0.5 and 0.6 and they are highly insulated. Main materials are concrete, bricks, and tiles to provide high thermal mass to the building. Exterior walls have an average U-value of 0.25 W/m2K; slabs on unconditioned spaces and roof, 0.24 W/m2K; and windows, 1.8 W/m2K. Buildings are designed to maximize the solar access during winter and the solar control during summer. External thermal insulation allows reducing the incidence of structural and material thermal bridges. All the buildings are class A rated according to the Italian legislation D.Lgs. 192/05 e s.m.i. in effect at the time of construction, which took into account only the primary energy need for heating and DHW.
Each flat has radiant panels for heating and cooling, controlled by a single-zone programmable BACnet device. Stairwell-centralized mechanical ventilation systems with active thermodynamic heat recovery supply fresh air to all flats served by the stairwell itself. During winter, the system extracts exhausted air, from which energy is recovered by means of a reversible heat pump and fresh air is supplied in occupied spaces at a comfort temperature at least equal to the indoor air temperature; in summer, fresh air is cooled and dehumidified. It is designed to operate continuously in constant volume mode (0.6 ACH), with no possibility of occupant control.
A system of underground closed-loop pipes distributes groundwater (supplied by four groundwater wells) to seven local plants, one for each condominium that groups two or more apartment buildings. Each local plant is made of a heat exchanger, transferring heat from groundwater to technical water in a closed loop. It serves two reversible heat pumps that supply hot and chilled water for heating and cooling and DHW as well. Therefore, the settlement is all electric; no other energy sources are present.
A building MS is installed, able to track in real-time the household energy and water consumptions, the indoor environment parameter (air temperature and relative humidity), as well as the factors influencing the energy consumption not related to the building characteristics (weather data and operational setting) and the overall system performance data (thermal and electrical energy uses in the local plant, temperature and flow rates of hot and chilled water, and flow rate and temperature of the ventilation).
The monitoring system
The installed MS allows the real-time collection of consumption data of building related to uses of energy (heating, cooling, DHW, and ventilation) and water (hot and cold). The goal underpinning the development of the MS was to verify the actual building consumption with regard to the design (and expected) targets, to control and optimize the building system operation, and to analyze the occupant behavior considering the strong influence on the energy consumption.
The MS is based on the BACnet™ (Building Automation and Control Network) standard, an open communication protocol developed by ASHRAE in 1995. It was preferred to other proprietary systems in order to maximize the interoperability and the flexibility in designing and configuring the system also in the future. Interoperability creates an environment where building operators and managers might see all of their systems from one interface and take appropriate maintenance actions and control adjustments that have important energy implications.
MS Architecture and Functionalities
Sensors and metering devices are physically located both at the central (local plants) and local level (stairwells, flats, retail, etc.) to measure building performance parameters (e.g., thermal and electrical energy consumption, water consumption), indoor environmental parameters (air temperature and relative humidity), and temperature and flow rates of hot and chilled water. Table 1 reports the main technical features of meters and sensors installed for the purpose. The MS also connects monitoring data (air flow, temperature, etc.) coming from onboard sensors of stairwell-centralized mechanical ventilation units.
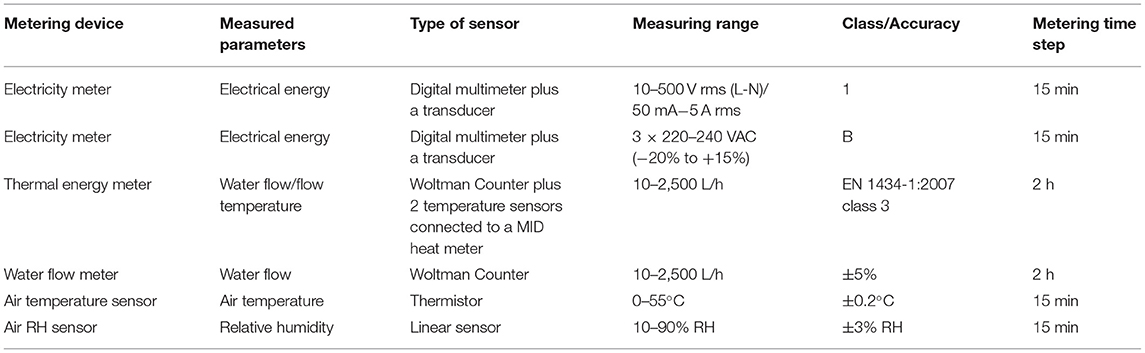
Table 1. Technical features of main installed metering devices or sensors.
The MS network is based on controllers and interface modules (gateways) connected by a flexible network such as to support a possible customization of system functioning and environment control. All devices are connected to each other with BUS RS-485 MS/TP connections, Ethernet, and IP and can communicate without intermediaries. The communication infrastructure, operating with BACnet standard, always keeps the control and the management/display points connected, minimizing any disruption due to a bad communication. The network is organized with a top-down logic as follows:
- Local plants, which aggregate a series of parcel;
- Parcel, which aggregates a series of apartment buildings;
- Apartment buildings, which aggregates a series of flats and retail/office spaces;
- Flats and retail/office spaces are the minimum control units.
Figure 2 shows a conceptualization of the typical system architecture, respectively, of the local plants and flats.
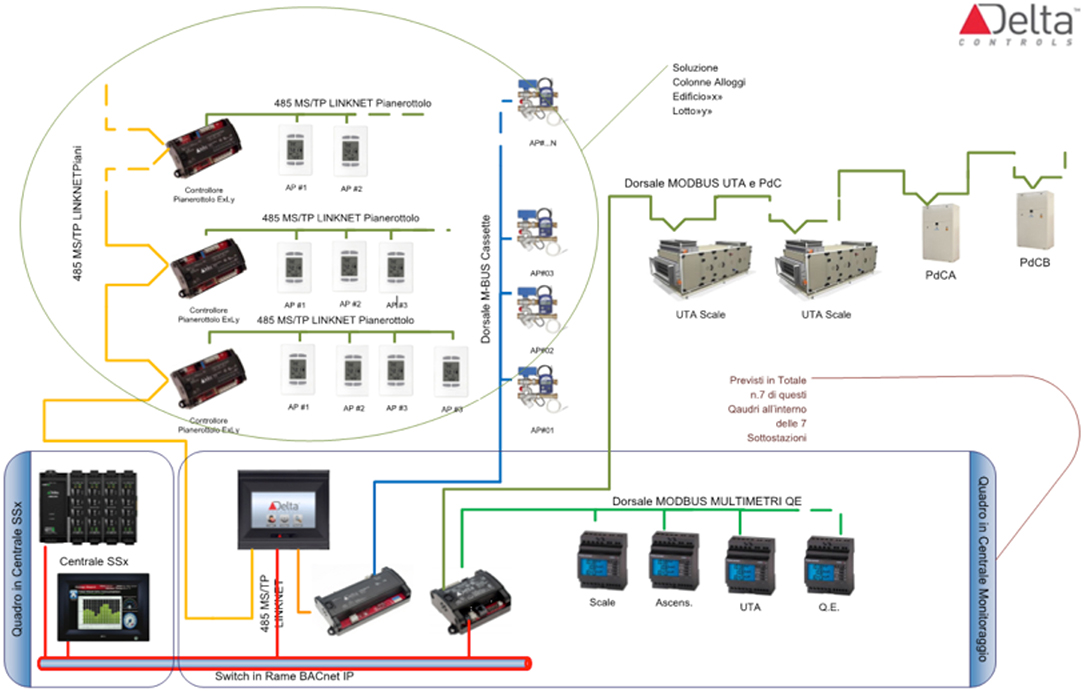
Figure 2. Monitoring system architecture (courtesy of Delta Cotrols Italy srl).
An apartment BACnet controller MS/TP with user interface allows managing each flat independently by the occupant. Through the device, the occupants can locally or remotely program the air temperature set points for different user-defined periods of time (hourly, daily, weekly, monthly, etc.), switch on or off the heating/cooling system, and control alarms as shown in Table 2. Moreover, the device allows monitoring and recording all the settings programmed by the users and the indoor air temperature and relative humidity. All these data are remotely accessible.
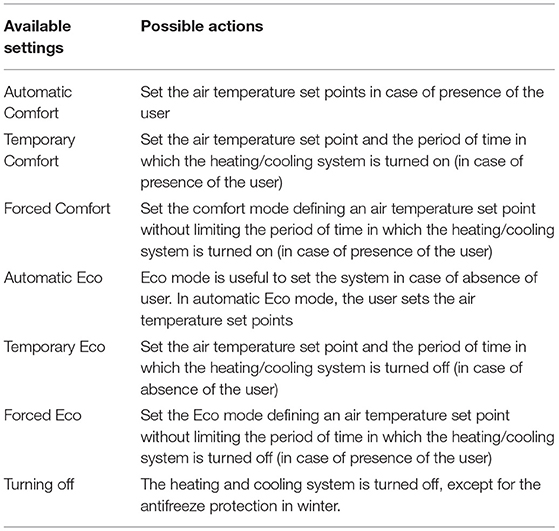
Table 2. Settings mode available for users.
The information related to each flat goes to another BACnet controller at the floor level that deals with the thermal energy and water meters. All flats and floor level controllers are concentrated at the scale level and then to central plant controllers that manage the hot and chilled water production including also all data read via M-BUS on the Heating/Cooling metering consumption boxes. All information is made comparable at the BACnet level, bringing into communication the production side (local plant) and the demand side (flats) to allow an energy-efficient control of the heating and cooling system.
For each building and local plant, the consumptions of electrical energy are metered by digital multimeters via MODBUS RTU in a BACnet device and converted in BACnet objects. In each local plant, a control panel is present. It is made of a native BACnet controller B-BC level with an adequate number of I/O (on average, about 180 for each local plant), a BACnet controller B-OD level with touchscreen, and a BACnet controller/gateway able to acquire, by installed multimeters, the electrical physical quantities related to various energy uses (AHU, elevators, lighting, etc.). The devices are all remotely or locally programmable, allowing real-time control of the system functioning. Moreover, at any moment, it is possible to change the algorithms, which control the sequences of operations of each system component and their integration.
The MS is based on a distributed computing platform and remotely managed by means of a standard web browser (no specific applications have to be installed). It is accessible simultaneously to an unlimited number of users, via Internet by a customer VPN.
The Collected Data
All the data collected on site from the different subsystems via standard protocol M-BUS and MODBUS are converted in BACnet objects in order to be stored on a web-computing platform and made accessible through specific facility management software (EnteliWEB 2.2). It provides the energy and cost management team (E&CM team) with customizable energy management dashboards, task-driven alarms, system dashboards, reports, etc., to visualize in real time the building systems' performance, analyze historic data, and remotely manage the facility, so that the facility manager and the owner are assisted in the definition of possible optimizations of the building system operation due to the identification of decreases of efficiency and failures, while the building manager is assisted in cost controlling and cost allocation of individual expenses according to the national standard UNI 10200 (UNI, 2018).
The installed MS is able to provide a clear picture of all building-related energy usage. Below, a synthetic description of the main available output data at different levels is reported.
By means of a series of BACnet controllers and M-BUS communication protocols, for each flat, the data collected are:
- Thermal energy consumptions for heating and cooling, derived from thermal energy meters located on the supply side of the distribution of the floor radiant system;
- Indoor air temperature and relative humidity derived from sensors installed within the conditioned volume;
- Settings of the BACnet control devices present in each flat, as set up by the occupants;
- Volume of hot and cold water consumed, derived from a water meter installed on the supply pipes. The DHW demand in kWh is calculated multiplying the hot water volume consumed (l) by a conventional multiplication factor of 0.038 kWh/L; it is derived considering an average temperature difference of 33°C between the temperature of water supplied by the water main (15°C) and the temperature of DHW produced by the heat pump (48°C).
For each stairwell, data collected include the electricity consumption for elevators, lighting, and ventilation, which includes both the electricity for fans (air circulation) and for packaged heat pumps (air treatment).
For each local plant, a series of multimeters separately meter the electricity consumed by each heat pump and the total electricity consumed by auxiliary components, mainly water circulation pumps.
Additional multimeters record the electricity consumption of pumps, which serve the groundwater loop.
Through metered consumption data, dedicated software allows one to calculate the allocation of energy costs between the occupants. Both voluntary and involuntary costs are calculated according to the abovementioned standard UNI 10200 (UNI, 2018).
Moreover, the MS records the status of all the mechanical equipment installed, in order to track the functioning of the overall building systems. Alarms are set in case of disruptions or malfunctioning and automatic communications are sent to the O&M building manager.
In conclusion, we can say that the IT platform is structured to provide useful data for all the facility management and operation and maintenance (O&M) activities, as evidenced in Table 3. Thus, the facility manager is assisted in the definition of possible optimization of the building system operation due to the identification of decreases of efficiency and failures, while the building manager is assisted in cost controlling and cost allocation of individual expenses according to the national standard UNI 10200.
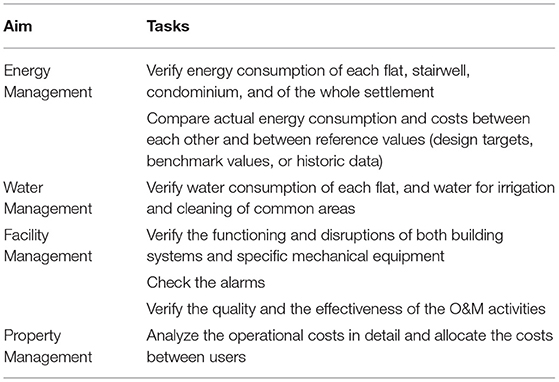
Table 3. Example of tasks that can be performed through Enteliweb.
Discussion
As mentioned above, the IT platform is suitable to assess the actual building energy performance, allowing benchmarking and comparison with the design targets to check the “performance gap” in terms of energy and cost management goals, allocation of the individual expenses, and occupant's behavior analysis.
For energy management purposes, it is possible to analyze metered data, according to the following main objectives:
- Check the operational energy rating of each flat, taking into account the actual energy use for heating, cooling, DHW, and ventilation compared to the design targets;
- Assess the consumptions of DHW;
- Verify the seasonal energy efficiency of building systems and equipment in order to better understand the real performance;
- Define reference values based on actual data for future comparison;
- Minimize the energy costs due by the users;
- Understand the occupant behavior in managing local control system to address education programs for occupants.
All the collected data are properly analyzed, allowing understanding both the energy consumption of buildings and the main factors influencing it, such as climate, building services and energy systems efficiency, building operation and maintenance, and indoor environmental quality provided. They correspond to four of the six main factors affecting energy consumption of buildings, as reported in IEA Annex 53 “Total Energy Use in Buildings: Analysis & Evaluation Methods3.”
The proposed analysis reports the data of 2 years of occupancy, from 2016 October 15th to 2018 October 14th. The occupancy rate during the analyzed period was equal to 50–60%; only the occupied flats are considered for the analysis. It is based on the following data recorded by the MS at the flat level:
- Thermal energy consumptions for heating and cooling respectively in the heating seasons 2016–2017 and 2017–2018 (October 15th–April 15th) and in the cooling seasons 2017 and 2018 (June–September);
- The volume of hot and cold water consumed;
- Settings of the BACnet control devices present in each flat, as set up by the occupants.
Analyzed data represent the final energy and water use of each flat; thus, they do not account for the efficiency of the building systems.
According to the main objective of the analysis, rough data were analyzed with statistical methods such as mean index of total energy and water consumption, median, and percentile methods. A normalization process of the data by basic factors such as building size (square meter of net floor area), heating degree days (HDD) during winter, and number of occupants is applied so that the energy and water use of different apartment buildings and flats can be compared between each other and between seasons (Filippi et al., 2008). A simplified regression analysis that considers the relationship between energy and water demand and some possible influencing factors such as the flat size, the number of occupants, and HDD has been already done.
The Actual Thermal Energy Consumption for Heating
The average actual thermal energy consumption of occupied flats is 63.2 kWh/m2y in the heating period 2016–2017 and 71.7 kWh/m2y in 2017–2018. The two seasons registered different average outdoor air temperatures: the first heating period was characterized by a warmer climate with a 2148 HDD, instead of 2336 HDD of the second heating period. Table 4 shows the synthesis of the measured actual thermal energy consumption for heating of the total occupied flats (152 flats).
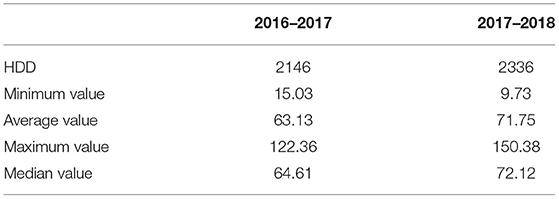
Table 4. Synthesis of the measured data (thermal energy consumption for heating) in kWh/m2y for the total occupied flats.
Figures 3, 4 report the boxplots for each condominium in the two analyzed seasons. The minimum monitored value, the first and the third quartiles of the distributions, with the midline showing the median value, and the maximum monitored value are reported. These boxplots confirm the large variability observed in heating demand among the occupied dwellings and among the six analyzed condominiums.
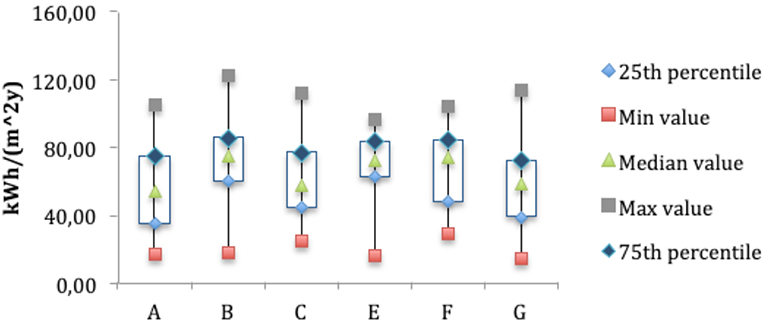
Figure 3. Actual thermal energy consumption for heating (2016 October 15th−2017 April 15th).
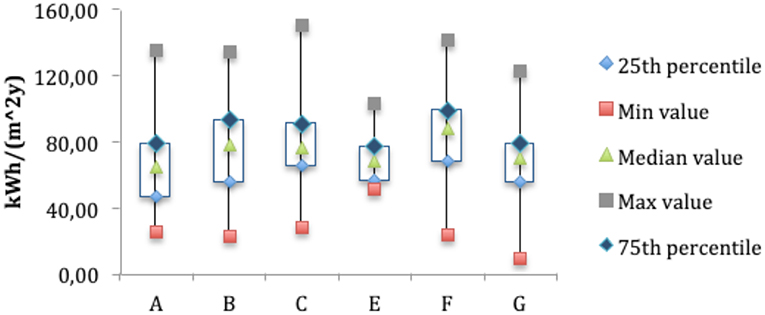
Figure 4. Actual thermal energy consumption for heating (2017 October 15th−2018 April 15th).
The actual heating energy demands are too high when compared with the design intents of low energy consumption dwellings, as well as the variability of the measured values compared to the average.
Investigating the reasons of the performance gap and the influencing factors on the energy performance of the buildings and of each dwelling is challenging. Below, some notes are clear to the authors based on the monitored data. Further investigations on the real thermal performance and airtightness of the building envelope could better complete the analysis.
During the heating season, the average indoor air temperature found in the monitored flat is 21.5°C in 2016–2017 and 21.3°C in 2017–2018; this generates an average increase of the energy consumption of 14% and 11%, respectively. Based on the standard HDD of each heating period considering an indoor air temperature of 20°C, the average thermal energy demand of flats would modify to 55.2 kWh/m2y (2016–2017) and 64.4 kWh/m2y (2017–2018). The measured heating load covered by the radiant panels mainly depends on the heat losses through the building envelope since the ventilation load should be totally covered by the thermodynamic heat recovery. This design scenario is not confirmed if the occupants are usual to open the windows, generating unexpected ventilation load that should be covered by the heating system.
The low occupancy rate could interfere with the performance data discussed above, since the heating system of unoccupied flat is off; even if the party walls and slabs are insulated, as required by the law (maximum thermal transmittance of 0.8 W/m2K), the heat transfer from the opaque party envelope could generate an increase in the energy demand of heated flats. This idea is also supported by the analysis of the average indoor air temperature of unoccupied flats that is in the range 14–16°C; it is probably mainly due to the contribution of the central mechanical ventilation (always operating) and the received heat from the neighboring occupied flats.
The correlation of the thermal energy consumption for heating of the occupied flats with the floor area and with the HDD of the heating period 2017–2018 is illustrated in Figures 5A,B. As demonstrated by the value of the R coefficient, the correlation is very weak and these variables in themselves are not significant in explaining the energy consumption.
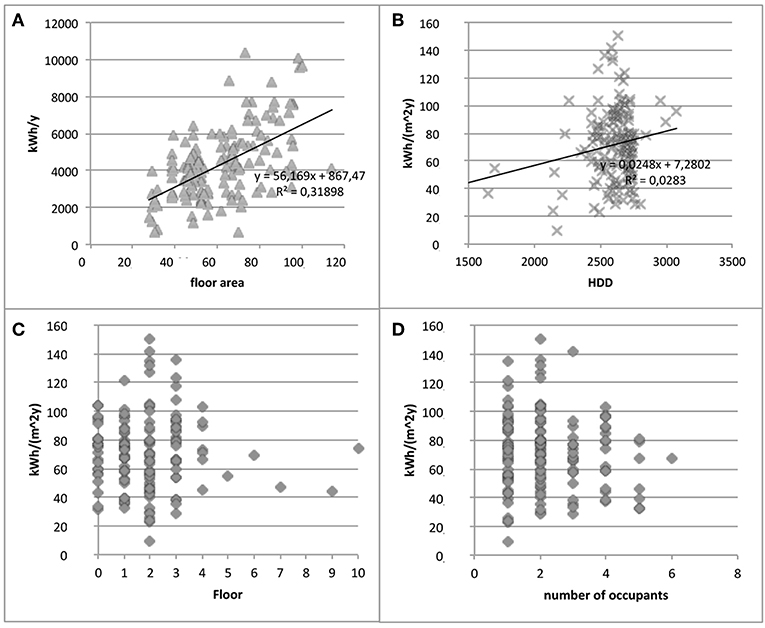
Figure 5. Correlation of the actual thermal energy consumption for heating in the period 2017–2018 with possible influencing factors: floor area (A), heating degree days (HDD) specific for each flat in the analyzed period (B), floor where the flat is located (C), and number of occupants (D).
Even clustering processes according to the floor where the flat is located (Figure 5C), or the number of occupants (Figure 5D), are not able to properly justify the heating demand of each dwelling. These graphs confirm the large variability observed.
Clustering the measured data according to the flat typology leads to similar conclusions. For example, two sets of dwellings similar in floor area, layout, orientation, and S/V value were defined: cluster 1 is made up of flats of 38–40 m2 located in condominiums B and C, while cluster 2 is made up of flats of 53 m2 located in condominium A.
Figure 6 represents the actual thermal energy consumption for heating normalized by the climate in the two analyzed periods for the two defined clusters. In order to exclude the effect of the climate in the comparison, the reported values represent the thermal energy consumption of each flat in a standard heating period characterized by 2404 HDD; the measured thermal energy consumption of each flat TEh(actual) was normalized according to Equation (1).
The graphs show both a significant variability of the data between similar dwellings in each heating period and a large variability of the energy consumption for some dwellings between seasons. The average higher consumption of cluster 1 [average value in the two heating periods: 86 kWh/(m2y)] compared to cluster 2 [average value in the two heating periods: 49 kWh/(m2y)] is also noticeable.
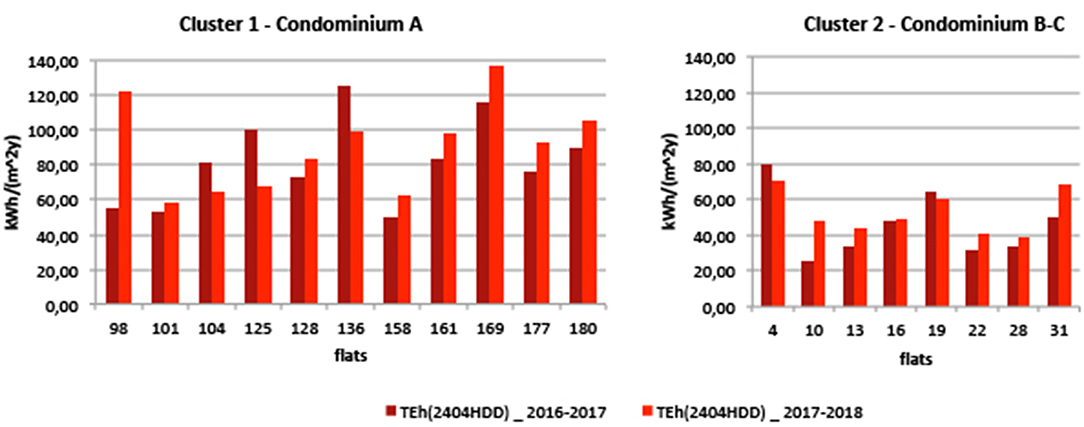
Figure 6. Comparison of the thermal energy consumption of two clusters of similar dwellings in the two analyzed heating periods, normalized by the standard heating degree days and by the floor area of each dwelling.
Although part of the observed variations in thermal energy consumption for heating might be due to building features (e.g., dwelling location within the building, orientation, presence of unoccupied adjacent dwellings, etc.), it is clear that most of it is produced by differences in occupant behavior and habits.
The average actual thermal energy consumption of occupied flats is 16.0 kWh/m2y in 2017 and 15.6 kWh/m2y in 2018. The two seasons registered slightly different average outdoor air temperature in the cooling period: 26.1°C in 2017 and 26.8°C in 2018.
Table 5 shows the synthesis of the measured actual thermal energy consumption for cooling of the occupied flats. Excluding the maximum registered value, it is noticeable that there is an average pattern of consumption in the two analyzed seasons. Moreover, the following are some general remarks: some occupants do not use the cooling system; a large variability between flats is confirmed probably due to the occupants' behavior and habits, as pointed out for the heating period; also, analysis of the energy consumption for cooling at the condominium scale (Figure 7) shows a similar pattern of variation.
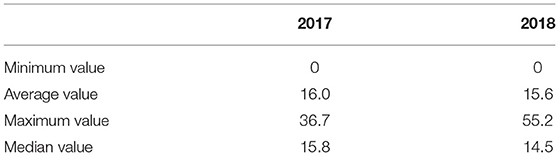
Table 5. Synthesis of the measured data (thermal energy consumption for cooling) in kWh/m2y for the total occupied flats.
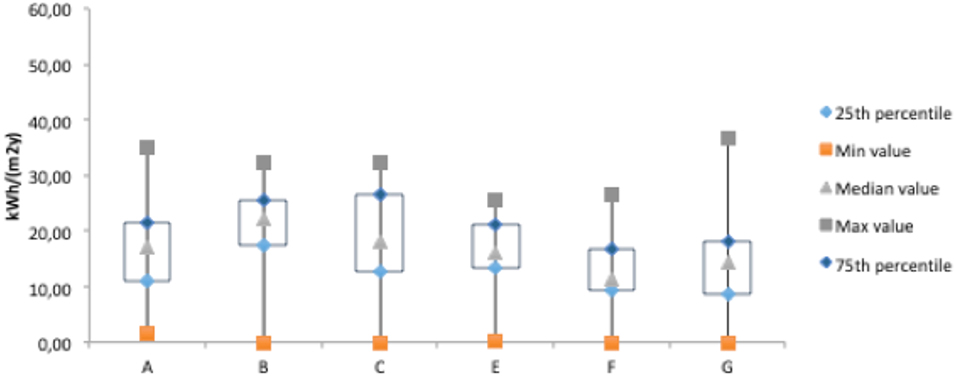
Figure 7. Actual thermal energy consumption for cooling (2017).
Domestic Cold and Hot Water
Considering the entire period of analysis, each occupant asks, on average, for 83.8 L/day of DHW and 67.0 L/day of DCW for a total daily volume demand of 150.8 l. As in Table 6 and Figure 8, it is evident that also the water consumption pattern shows unexpected variations between dwellings, due to the different occupants' habits. Even if the median values of the total water consumption are aligned with the reference value of 120 L/(pers*day) (UNI/PdR 15.1:2015, UNI, 2015), the variability is very significant.
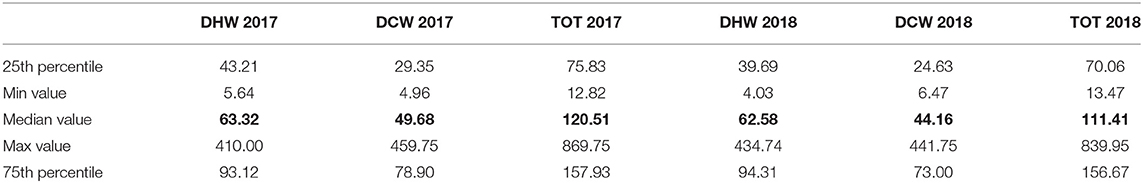
Table 6. Synthesis of the measured water consumption in L/(pers*day) for the total occupied flats.
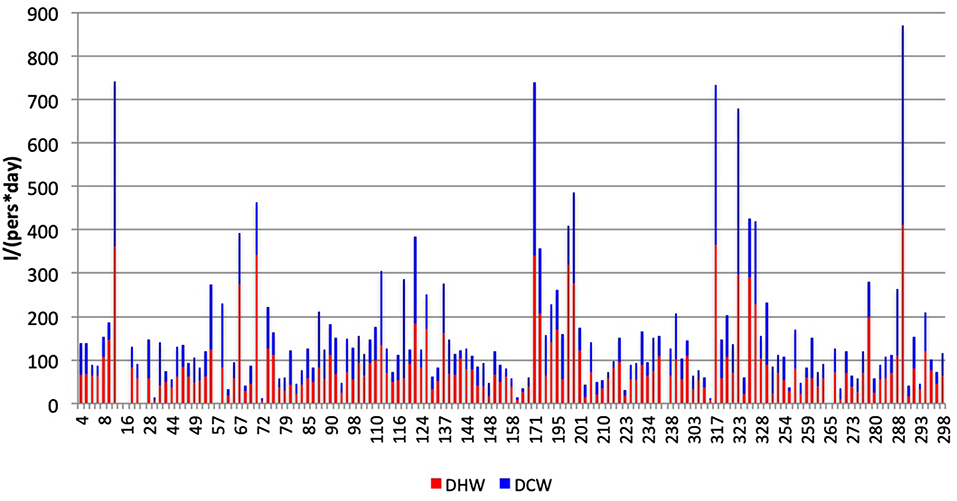
Figure 8. DHW and DCW consumption in the period 2016 October 15th to 2017 October 14th of all the analyzed dwellings.
The occupancy of each flat normalizes the values in L/day. This information was derived by the declaration of the building manager, but not directly verified by the authors. However, these results confirm the findings of similar studies where it was demonstrated that DHW consumption could vary by a maximum factor of 4.5 between flats with the same number of occupants (Gilli et al., 2010).
The incidence of the total DHW on the total consumption is equal to 57%. It is noticeable that the median value of DHW consumption [approximately 63 L/(pers*day)] is 33% higher than the DHW demand calculated according to the UNI TS 11300:2, (UNI, 2014) leading to an increased energy consumption for DHW compared to the expected.
Based on the median consumption values and a standard multiplication factor of 0.038 kWh/L (derived by an average temperature difference of 33°C between the temperature of water supplied by the water main−15°C—and the temperature of DHW produced by the heat pump-−48°C), the median thermal energy demand for DHW is 30 kWh/(m2y).
The Influence of Occupant Behavior
The occupant behavior has been evaluated assessing the set point values for heating and cooling and the attention of the occupants in properly managing the daily and weekly programs through the thermostats. Additional data, such as family composition, age, gender, income, etc., were not available for the purpose of the study, even if the authors are aware of the importance of these data to better characterize the occupant behavior.
As previously reported, during the heating season, occupants prefer to maintain the indoor air temperature at levels 1.3–1.5 higher than the standard 20°C.
This information is confirmed by the analysis of the set point temperature defined by the occupants. Usually, the indoor set point temperature in the case study building during the heating season is 1–2 degrees higher than 20°C, the standard value for calculations; in fact, the average set point temperature found in the monitored flat is 20.6°C in 2016–2017 and 20.8°C in 2017–2018.
The analysis of the thermostat settings reveals that a large part of the occupants are not programming the functioning of the heating system with daily and weekly schedules. The MS registers the number of variations of the set point temperature in a determined period; from the analysis of the total occupied flats per heating season, it is noticeable that the average number of registered set point variations during the heating season is equal to 152 in 2016–2017 and 218 in 2017–2018, less than two variations per day.
It is probable that the idea to live in a high-energy-efficient building with low operating costs might explain, to some extent, the high set point temperature and the little attention to the management of the heating system, a phenomenon known as the rebound effect (Belaïd et al., 2018, Hediger et al., 2018).
The influence of the occupant behavior seems to be a significant item in explaining the unexpected variation of thermal energy consumption for heating and cooling among the analyzed seasons. In Figure 9A, each dot represents the normalized thermal energy consumption of one flat on the two heating periods (normalization was done by the climate according to Equation 1), reporting the 2016–2017 value on the x-axis and the 2017–2018 value on the y-axis. On average, the second heating period (2017–2018) registered an increase of 15% of the energy consumption compared to the first period (independently from the specific HDD values) with a high variability among dwellings. The number of dwellings that have registered a variation of ±10% are 49 (33% of dwellings) and those that have registered a variation of ±20% are 90 (60% of dwellings); 25% of dwellings registered a variation higher than ± 30% (25% of dwellings).
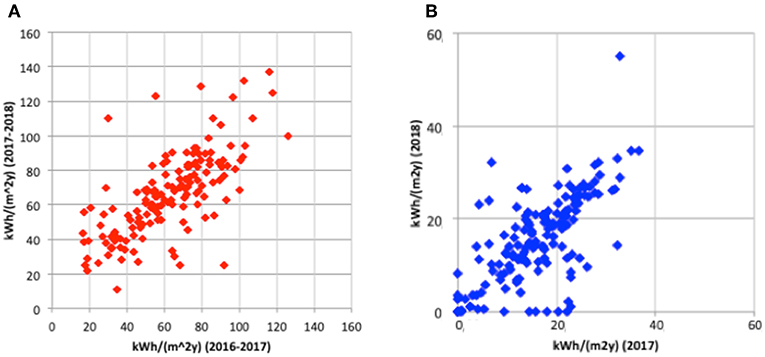
Figure 9. Comparison of the normalized thermal energy consumption for heating between the two analyzed winter seasons (A) and comparison of the thermal energy consumption for cooling between the two analyzed summer seasons (B).
Figure 9B shows the actual energy consumption for cooling of each flat in the two analyzed periods. Similar considerations are possible: there was a small average increase of consumption, equal to 5% in 2018, but the consumption pattern of each dwelling seems to be very variable between seasons.
Conclusions
The paper describes a case-study application of an MS in a large social housing intervention. It has been demonstrated how it can be instrumental to address a series of key objectives for building and facility managers and the E&CM team: the need to have a good understanding of what works and what does not in building operation, the need of bills controlling, and allocation of individual energy costs between the users, the facility, energy, and water management requirements including the understanding of the occupant's behavior. Moreover, it is an important tool to assess the effectiveness of installed building systems, in terms of reliability, user acceptance, etc.
Related to the specific case study, major findings are as follows. Thermal energy demand for heating of each flat is on average greater than expected and, compared between each other, a great variability has been observed. Further investigations on different directions will be carried out: assessment of the actual HDD and set points set by the users; verification of the occupant behavior for what concerns window openings and natural ventilation; analysis of the heat through the building envelope and via air infiltration, internal, and solar gains of each flat; and verification of the proper calibration of thermal energy meters.
On average, the share of the total thermal energy consumption of each dwelling is made by heating (59.6%), accounting for 68 kWh/(m2y); DHW (26.3%), accounting for 30 kWh/(m2y); and cooling (14.0%), accounting for 16 kWh/(m2y).
The average annual value of the measured heating energy demand 68 kWh/m2 seems to be too high in comparison with the calculated standard value 44.9 kWh/m2, and the consumption of each flat is highly variable around the average. However, it is important to note that the measured indoor air temperature during winter was, on average, 1.1°C higher than 20°C, causing a major consumption of 12% than the expected.
For water management purposes, the main KPIs are the daily total water consumption per person and the daily DHW consumption per person as related to the thermal energy demand of each flat. The average daily water consumption is in the range 111–120 L/p, of which the DHW consumption is 63 L/p.
The results show a large variability of the energy and water consumption pattern among the dwellings and between the years due to the significant influence of the occupants' behavior and habits; large variations in total energy and water consumption among the dwellings are seen and the data analysis seems to confirm some findings of other monitoring studies performed in apartment buildings (Calì et al., 2016).
For the heating consumption, the combination of factors, such as heating set points, windows opening cycles, internal gains, and unexpected heat losses between adjacent units, is probably responsible for the variation of the final energy consumption of each dwelling. Cooling represent a minor energy use in such context, but is very unpredictable due to the occupants' behavior. Similar consideration could be done for the water consumption since the value of consumption per day per person is very variable between occupants.
In this scenario, it is evident that the occupant behavior has a significant impact on the actual performance of the buildings. Occupants' education and awareness programs should be implemented to inform the users about building and system features, environmental items, and proper action in controlling heating and cooling systems. Making the real-time reading (instead of final seasonal reporting) of their consumption accessible for the occupants both in absolute value and compared with those of their neighbors through a mobile app could be useful to make them more conscious of their behavior. Based on findings of existing research, for residential buildings, an informed and aware occupant has an energy-saving potential in the range of 10–25% (Zhang et al., 2018).
Moreover, the presented method also implements a process of performance benchmarking, defining a level of water and energy demand in a certain period. For each dwelling, it serves as a metric of performance assessment relative to other similar flats and relative to its previous and future performance. The implementation of such a process through the operation of the building allows giving valuable feedback about occupant behavior, identifying targets of energy-saving potential, and facilitating a proper management of the building itself.
Data Availability Statement
The datasets generated for this study will not be made publicly available For privacy reasons the datasets cannot be shared.
Author Contributions
MF has developed the methodology to analyze data, including methods and relevant KPIs. ES has elaborated and analyzed the rough data. Both the authors have together commented and interpreted the analyzed data.
Conflict of Interest
The authors declare that the research was conducted in the absence of any commercial or financial relationships that could be construed as a potential conflict of interest.
Acknowledgments
The work started from the results presented during the 51st AiCARR International Conference, the human dimension of building energy performance that took place in Venice (Italy), on February 20–22, 2019.
Footnotes
1. ^https://www.carbonbuzz.org
3. ^AA.VV. Total Energy Use in Buildings: Analysis and Evaluation Methods. Available online at: https://www.iea-ebc.org/Data/publications/EBC_Annex_53_Factsheet.pdf (accessed on February, 2019).
References
Ahmad, M. W., Mourshed, M., Mundow, D., Sisinni, M., and Rezgui, Y. (2016). Building energy metering and environmental monitoring – A state of the art review and directions for future research. Energy Build. 120, 85–102. doi: 10.1016/j.enbuild.2016.03.059
Belaïd, F., Bakaloglou, S., and Roubaud, D. (2018). Direct rebound effect of residential gas demand: Empirical evidence from France. Energy Policy 115, 23–31. doi: 10.1016/j.enpol.2017.12.040
Calì, D., Osterhage, T., Streblow, R., and Müller Rather, D. (2016). Energy performance gap in refurbished German dwellings: Lesson learned from a field test. Energy Build. 127, 146–1158. doi: 10.1016/j.enbuild.2016.05.020
Carbon Trust (2011). Closing the Gap: Lessons Learned on Realizing the Potential of Low Carbon Building Design. London: Carbon Trust. Available online at: https://www.carbontrust.com/media/81361/ctg047-closing-the-gap-low-carbon-building-design.pdf (accessed January 2017).
Colclough, S., Kinnane, O., Hewitt, N., and Griffiths, P. (2018). Investigation of nZEB social housing built to the Passive House standard. Energy Build. 179, 344–359. doi: 10.1016/j.enbuild.2018.06.069
Copiello, S. (2016). Leveraging energy efficiency to finance public-private social housing projects. Energy Policy 96, 217–230. doi: 10.1016/j.enpol.2016.06.003
EU Reference Scenario (2016). Energy, Transport and GHG Emissions Trends to 2050. Luxembourg: EU Reference Scenario. Available online at: https://op.europa.eu/en/publication-detail/-/publication/aed45f8e-63e3-47fb-9440-a0a14370f243/language-en/format-PDF/source-106883045
Filippi, M., Corgnati, S. P., and Caldera, M. (2008). Energy demand for space heating through a statistical approach: application to residential buildings. Energy Build. 40, 1972–1983. doi: 10.1016/j.enbuild.2008.05.005
Galvin, R. (2014). Making the ‘rebound effect' more useful for performance evaluation of thermal retrofits of existing homes: defining the ‘energy savings deficit' and the ‘energy performance gap'. Energy Build. 69, 515–524. doi: 10.1016/j.enbuild.2013.11.004
Gilli, Z. M., Tierney, M. J., Pegg, I. M., and Allan, N. (2010). Low energy dwelling: the contribution of behavior to actual performance. Build. Res. Inform. 38, 491–508. doi: 10.1080/09613218.2010.505371
Gupta, R., Kapsali, M., and Howard, A. (2018). Evaluating the influence of building fabric, services and occupant related factors on the actual performance of low energy social housing dwellings in UK. Energy Build. 174, 548–562. doi: 10.1016/j.enbuild.2018.06.057
Hediger, C., Farsi, M., and Weber, S. (2018). Turn it up and open the window: on the rebound effects in residential heating. Ecol. Econom. 149, 21–29. doi: 10.1016/j.ecolecon.2018.02.006
Menezes, A. C., Cripps, A., Bouchlaghem, D., and Buswell, R. (2012). Predicted vs. actual energy performance of non-domestic buildings: using post-occupancy evaluation data to reduce the performance gap. Appl. Energy 97, 355–364. doi: 10.1016/j.apenergy.2011.11.075
Rouleau, J., Gosselin, L., and Blanchet, P. (2018). Understanding energy consumption in high-performance social housing buildings: a case study from Canada. Energy 145, 677–690. doi: 10.1016/j.energy.2017.12.107
Sirombo, E., and Flippi, M. (2017). “Analysis of operational data about energy and water uses to inform social housing design,” in AMPS Conference Proceedings. Living and Sustainability: An Environmental Critique of Design and Building Practices, Locally and Globally (London), 9–10.
Sirombo, E., Flippi, M., Catalano, A., and Sica, A. (2017). Building monitoring system in a large social housing intervention in Northern Italy. Energy Procedia 140, 186–197. doi: 10.1016/j.egypro.2017.11.151
UNI (2014). UNI TS 11300:2. Prestazioni energetiche degli edifici - Parte 2: Determinazione del fabbisogno di energia primaria e dei rendimenti per la climatizzazione invernale, per la produzione di acqua calda sanitaria, per la ventilazione e per l'illuminazione in edifici non residenziali
UNI (2015). UNI/PdR 15.1:2015 Sostenibilità ambientale nelle costruzioni - Strumenti operativi per la valutazione della sostenibilità.
UNI (2018). Impianti termici centralizzati di climatizzazione invernale e produzione di acqua calda sanitaria - Criteri di ripartizione delle spese di climatizzazione invernale ed acqua calda sanitaria. UNI10200 Standard. Ente Italiano di Normazione
Wilde, P. (2014). The gap between predicted and measured energy performance of buildings: A framework for investigation. Automat. Construct. 41, 40–49. doi: 10.1016/j.autcon.2014.02.009
Keywords: multifamily apartment, heating, cooling, domestic water, operational monitoring
Citation: Filippi M and Sirombo E (2019) Energy and Water Monitoring for a Large Social Housing Intervention in Northern Italy. Front. Energy Res. 7:126. doi: 10.3389/fenrg.2019.00126
Received: 15 July 2019; Accepted: 28 October 2019;
Published: 20 November 2019.
Edited by:
Francesca Romana d'Ambrosio, University of Salerno, ItalyReviewed by:
Marilena De Simone, University of Calabria, ItalyNicola Bianco, University of Naples Federico II, Italy
Copyright © 2019 Filippi and Sirombo. This is an open-access article distributed under the terms of the Creative Commons Attribution License (CC BY). The use, distribution or reproduction in other forums is permitted, provided the original author(s) and the copyright owner(s) are credited and that the original publication in this journal is cited, in accordance with accepted academic practice. No use, distribution or reproduction is permitted which does not comply with these terms.
*Correspondence: Elisa Sirombo, elisa.sirombo@gmail.com