Probabilistic Optimal Power Flow Calculation Method Based on Adaptive Diffusion Kernel Density Estimation
 Guoqing Li1
  Weihua Lu
- 1School of Electrical Engineering, Northeast Electric Power University, Jilin City, China
- 2China Electric Power Research Institute, Nanjing, China
To accurately evaluate the influence of the uncertainty and correlation of photovoltaic (PV) output and load on the running state of power system, a probabilistic optimal power flow (POPF) calculation method based on adaptive diffusion kernel density estimation is proposed in this paper. First, based on the distribution characteristics of PV output, the adaptive diffusion kernel density estimation model of PV output is constructed, which can transform the kernel function into a linear diffusion process to achieve self-tuning of the bandwidth of the nuclear density estimation. This model can fit the distribution of arbitrary distribution of PV power, improve the local adaptability of PV output model, and reflect the uncertainty and volatility of PV output more accurately. Therefore, it can provide more accurate input for POPF calculation. Second, the Kendall rank correlation coefficient and the least Euclidean distance are used as correlation measure and index of fitting to select the optimal Copula function, and the joint probability distribution model of PV output and load is constructed. After extracting the correlated PV output and load samples, a POPF calculation method considering the correlation of PV output and load is proposed by using genetic algorithm (GA), which takes the lowest fuel cost of power generation as the objective function. Finally, simulation studies are conducted with the measured data of a PV power plant of China and the IEEE 30-bus power system. The results show that considering the correlation between PV output and load can improve the accuracy of POPF calculation and effectively reduce the power generation cost of the power system.
Introduction
Photovoltaic (PV) power generation has developed rapidly in recent years due to its advantages of green environmental protection and renewable capacity. Up to the end of 2018, the total installed capacity of PV power generation in China has exceeded 174GW. However, PV power generation is a typical intermittent energy, and its output is susceptible to external factors, such as light intensity, temperature, weather, and PV panel materials and has strong uncertainty and volatility (Ke et al., 2016; Liu et al., 2017; Lujano-Rojas et al., 2018). Moreover, the correlation between PV output and load will also affect the running state of the power system. Probabilistic optimal power flow (POPF) is an effective method for analyzing power system uncertainty and optimizing power system operation. It can be used to evaluate the reliability and economy of power systems with PV power generation (Wang et al., 2018; Duan et al., 2019). Therefore, it is of great significance to conduct in-depth research on the POPF calculation method for power systems containing PV power generation.
Power scholars at home and abroad have carried on a lot of research on the PV output probabilistic model and the calculation method of POPF. In Wang and Ding (2010), the probability distribution model of PV output is established by using beta distribution, and the parameter value of beta distribution is obtained by the maximum likelihood method according to the measured historical data of PV output. In Xie et al. (2018), a non-parametric kernel density estimation model for distributed energy is established, and the optimal bandwidth is selected by the asymtotic mean integrated squared error (AMISE). The correlation between distributed energy output and load is processed based on Copula theory. On the basis of Xie et al. (2018) and Miao and Xie (2016) established a mixed kernel density estimation model for distributed energy, introduced the weight coefficient to represent the proportion of each kernel density estimation, and obtained the AMISE of the mixed kernel density estimation method. And then applied it to the Lagrange multiplier method to obtain the optimal weight coefficient. In Zhu and Jin (2018), considering the dependent structure between PV power plants, a stochastic probabilistic power flow calculation method considering the correlation between multiple PV power plants is proposed based on Copula theory. The digital interlacing technology is integrated into the quasi-Monte Carlo algorithm to improve calculation speed. Li et al. (2017) and Wu et al. (2017) established a correlation coefficient matrix between distributed PV power plants based on measured data and distribution network structure and obtained correlation samples of PV output by NATAF transformation. Multiple integration algorithms and Gram-Charlier series are used to perform power system probabilistic load flow calculation. Sadjad and Mahmoud (2019) used Cholesky factorization to form input variables and dealt with the correlation between random variables quickly and accurately through data clustering. In addition, it used genetic algorithm (GA) as an optimization tool to calculate the probability optimal power flow. Ullah et al. (2019) predicted the output power of wind turbines and PV generators based on real-time measurements and probability models of wind speed and solar irradiance. Combined with phasor particle swarm optimization (PPSO) and GSA algorithm, an optimal power flow calculation method for power system considering the correlation between PV and wind power generation is proposed.
Most of the above references used parametric estimation methods such as beta distribution and non-parametric kernel density estimation to model the PV output. The local adaptability of PV output estimation is not enough, and there are a few studies considering the impact of PV output and load correlation on probability optimal power flow calculation. Aiming at the above problems, a POPF calculation method is proposed based on adaptive diffusion kernel density estimation in this paper. First, based on the distribution characteristics of PV output, an adaptive diffusion kernel density estimation model suitable for PV output is proposed. The Gaussian kernel function is converted into a linear diffusion process to achieve self-adjustment of the bandwidth of the kernel density estimation, and the model can accurately fit the actual output of the PV power station. Therefore, it can provide more accurate input for POPF calculation. Second, Kendall rank correlation coefficient and least Euclidean distance are used as correlation measure and index of fitting to select the optimal Copula function to construct the joint probability distribution of PV output and load. And then a POPF calculation method considering the correlation of PV output and load is proposed by using GA, which takes the lowest fuel cost of power generation as the objective function. Finally, the simulation is performed on the IEEE 30-bus system with the actual measured data of a PV power plant in China. The accuracy and effectiveness of the POPF calculation method that considers the correlation between PV output and load are verified.
Probabilistic Model OF PV Output
Non-parametric Kernel Density Estimation Model
The non-parametric kernel density estimation model f (x) of PV output can be expressed as (1):
Where X1, X2, ..., Xn are measured data of PV output, x is the non-parametric kernel density estimation independent variable, n is the sample capacity, h is the bandwidth, and K(•) is the kernel function.
Select the Gaussian function as the kernel function, which can be written as (2):
When the PV output sample is given, f (x) is determined by the kernel function K(•) and the bandwidth h. The effect of bandwidth h on f(x) is much greater than the effect of kernel function K(•) on f (x). Therefore, the selection of the optimal bandwidth is particularly important in the non-parametric kernel density estimation. To balance the effects of kernel density estimation bias and variance, the AMISE method is generally used to select the optimal bandwidth (Fan et al., 2012):
Where f (x) is the non-parametric kernel density estimated probability density function, u = (x – Xi)/h, AMISE is the estimated asymptotic mean integrated square error.
The bandwidth obtained by minimizing the operation with AMISE as the objective function is the optimal bandwidth hAMISE. Although this method can select the overall fixed optimal bandwidth of PV output non-parametric kernel density estimation, the actual PV output has uncertainty and volatility, and its overall data density is not uniform. The overall optimal bandwidth cannot adjust itself according to the PV output data density of the local interval, which will result in poor local adaptability. To solve this problem, the traditional non-parametric Gaussian kernel density estimation method is improved in this paper. The transformation density of linear diffusion is used instead of the Gaussian kernel function to achieve adaptive adjustment of the bandwidth of the non-parametric kernel density estimation and improve its local adaptability.
Fourier Heat Equation
Because the Fourier heat equation has the adaptive feature of smoothing variables, it has been widely used in various fields. Based on this, Chaudhuri and Marlon proved that the Gauss kernel density estimation is the unique solution of the Fourier heat equation (Chaudhuri and Marron, 2000). The expression of the Fourier heat equation is as follows:
Where x is the measured data (x ∈ [0, 1]), t > 0. The initial condition is the empirical probability density of the data, and δ(x−Xi) is the Dirac measure of Xi.
By solving Equation (5), the analytical solution of Fourier heat equation can be obtained as follows:
The kernel function K in the above equation can be expressed as:
The asymptotic analysis of formula (7) shows that the properties of formula (7) in the domain [0, 1] are consistent with those of Gauss kernels.
In conclusion, the non-parametric Gaussian kernel density estimation problem of PV output can be transformed into the unique solution problem of the diffusion partial differential equation.
Adaptive Diffusion Kernel Density Estimation Model
The adaptive diffusion kernel density estimation method proposed in this paper is based on the smoothing property of linear diffusion process. Select the most common linear diffusion process, and its partial differential equation can be written as (8):
Where x ∈ [0, 1], t = h2 > 0, a(x) and p(x) can be any positive function with a second derivative in the domain. The initial condition is . Let a(x) = 1 and p(x) = 1, the simplified model of linear partial differential (Equation 9) for Gaussian kernel density estimation can be obtained:
By comparing formula (5) and formula (9), we can see that the Fourier heat equation can be connected with the linear diffusion partial differential equation by using as the intermediate medium, such as Equation (10):
From Equation (10), we can see that the solution of Fourier heat equation is the same as that of diffusion partial differential equation. In conclusion, the problem of estimating the Gauss nuclear density of PV output can be solved by solving the diffusion partial differential equation.
This research will be expanded in this paper. The analytical solution of Equation (8) can be obtained as follows:
Where: KD () represents diffusion kernel function; f (x; t) represents diffusion kernel density estimation; x, y, s are random variables in the definition domain of kernel function; and a() and P() can be any positive function with a second derivative in the definition domain.
It can be imagined that the kernel function is changing, but according to the previous paper, the influence of kernel function on non-parametric kernel density estimation is small and can be ignored. The diffusion kernel function should satisfy the following conditions:
Where: L* is the adjoint operation of L.
The optimal bandwidth is selected according to the criteria of AMISE, and f is assumed to be a second-order continuous differentiable function. The integrated squared bias of this method can be calculated as:
The integrated variance can be calculated as:
Therefore, the diffusion kernel density estimation AMISE can be obtained. The expression is as follows:
The minimum value of AMISE can be obtained by derivation of the above formula (Botev et al., 2010). The bandwidth h * corresponding to the minimum value of AMISE is the optimal bandwidth:
The optimal bandwidth can be adaptively selected by using linear diffusion by using the formula (16).
The measured data of the PV power station in China are used to simulate the Gaussian kernel density estimation probability density curve and the adaptive diffusion kernel density estimation probability density curve. The curve comparison is shown in Figure 1. It can be seen that the diffusion kernel density estimation model has a better fitting effect on the measured data and can reflect the uncertainty and volatility of the PV output better.
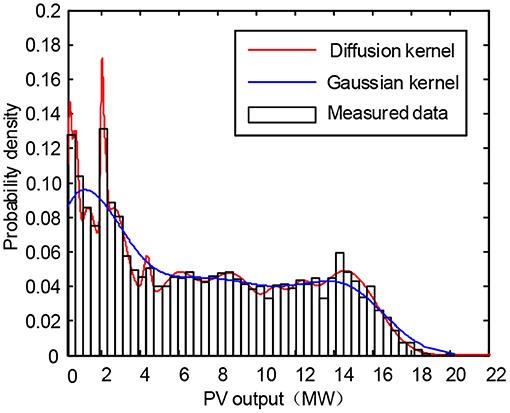
Figure 1. Probability density of photovoltaic (PV) output.
Joint Probability Distribution Model
Copula Theory
Copula theory states that a multidimensional joint probability distribution can be replaced by the cumulative probability distribution Fi(xi) of each variable and a connection function C (Wu et al., 2015; Zhang et al., 2016; Widen et al., 2017). Let F(x1, x2) be the joint cumulative probability distribution function of PV output and load. There is
Where x1, x2represent the data of PV output and load; F (x1, x2)is the joint cumulative probability distribution function of PV output and load; and F1 (x1), F2 (x2) is the marginal distribution function of PV output and load. C is the optimal Copula connection function to be selected.
When the marginal cumulative distribution function is continuous, the connection function C can be uniquely determined. In this paper, the least Euclidean distance between the empirical Copula function and the theoretical Copula function is used as the index of fitting to select the optimal theoretical Copula function.
Using the measured data to establish the empirical Copula function and various theoretical Copula function models, the least Euclidean distance of various Copula functions can be obtained just as shown in Table 1. It can be seen that the t-Copula function has the smallest Euclidean distance, so the t-Copula function is selected as the optimal Copula function.
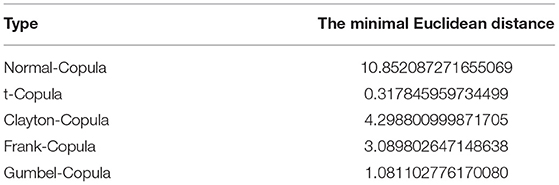
Table 1. The minimal Euclidean distance.
Furthermore, the frequency histogram of empirical Copula function and the joint probability density graph of t-Copula function are obtained, as shown in Figures 2, 3. The comparison shows that the t-Copula function has a better fitting effect.
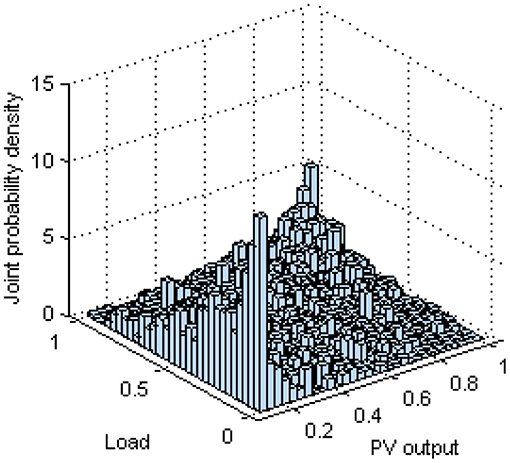
Figure 2. Joint probability density of empirical Copula.
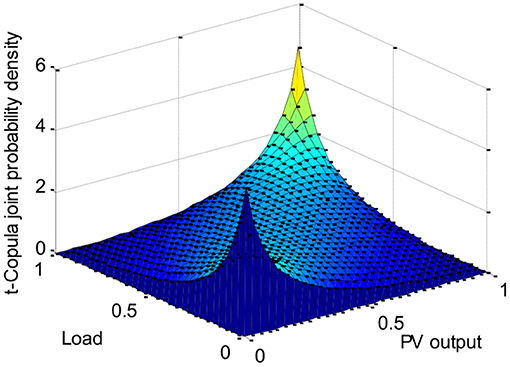
Figure 3. Joint probability density of t-Copula.
The Kendall rank correlation coefficient τ of the PV output and load can be calculated from the selected t-Copula function to describe the correlation. When −1 ≤ τ ≤ 1, the correlation between PV output and load increases with |τ| approaching 1, and the following conclusions can be drawn:
1. When 0 < τ ≤ 1, the PV output is positively correlated with the load.
2. When −1 ≤ τ ≤ 0, the PV output is negatively correlated with the load.
3. When τ = 0, the correlation between PV output and load cannot be determined.
According to the t-Copula function model, the correlation coefficient between PV output and load can be obtained τ = 0.4399. As a result, PV output is positively correlated with load.
Sampling Method of Relevant PV Output and Load
The joint probability distribution function obtained by t-Copula function can obtain PV output and load samples with correlation by sampling and inverse function transformation, thus avoiding the tedious process of state space transformation (Chen et al., 2013; Aien et al., 2014; Ren et al., 2017; Xiao et al., 2018). According to the statistical principle, the marginal function transforms a random variable from any domain to the uniform distribution of [0, 1].
The marginal cumulative distribution functions u = F1(x) and v = F2(y) of the PV output and load are obtained as shown in Equations (18) and (19).
Where x is the measured PV output data; y is the measured load data; u = F1 (x) and v = F2 (y) are the marginal cumulative distribution functions of PV output and load output, respectively; and f 1 (x) and f 2 (y) are the probability density estimation functions of PV output and load, respectively.
The cumulative probability distribution curves of Gauss kernel density estimation and diffusion kernel density estimation are obtained, as shown in Figures 4, 5. The joint probability distribution of PV output and load was sampled N times to obtain N sets of correlation samples (ui, vi) (i = 1, 2, ..., N). By substituting the obtained correlation samples into the PV output and load accumulation probability distribution inverse functions xi = (ui) and yi = (vi), N sets of correlated PV output and load samples can be obtained.
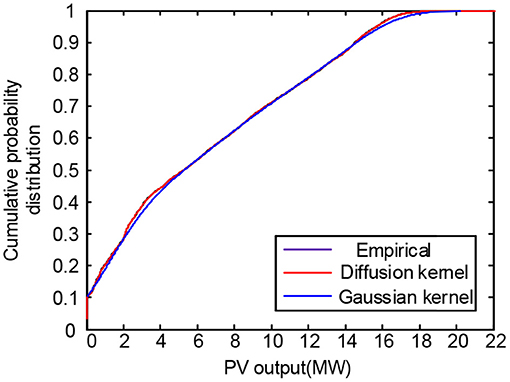
Figure 4. Probability distribution of photovoltaic (PV) output.
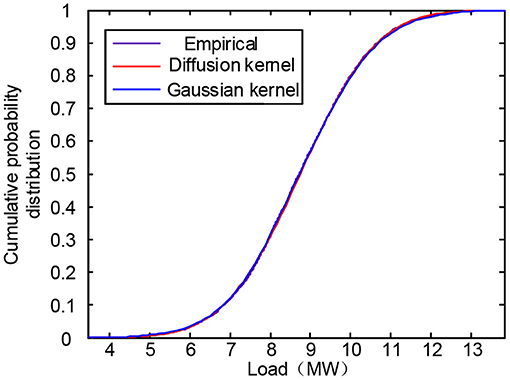
Figure 5. Probability distribution of load.
POPF Considering The Correlation OF PV Output and Load
POPF Model
In this study, the minimum fuel cost of the system is taken as the objective function, and the GA is used to calculate the POPF (Guo et al., 2018; Lin et al., 2019), which can take into account the correlation between PV output and load, to optimize the operation status of the power system. Optimal power flow model is composed of objective function and power system constraints, in which power system constraints can be divided into equality constraints and inequality constraints.
• Objective function
Where the objective function f of POPF is to minimize the total fuel cost of thermal power units without considering the outage cost of units; ai, bi, ci are the cost coefficients of the power system; PGi is the active power of the generator at bus i; and m is the number of generator buses in the power system.
• Power system constraints
The POPF needs to be calculated based on the probabilistic power flow equation, considering the upper and lower limits of line load power, the upper and lower limits of generator output, and other constraints of the system operation (Kazemdehdashti et al., 2018; Morshed et al., 2018).
Equality constraint
Where PGi and QGi, respectively represent the active power and reactive power of the generator at bus i, PLi, and QLi, respectively represent the active power and reactive power of the Load at bus i, and Ui and Uj represent the voltage amplitudes of bus i and bus j, respectively. θij represents the phase angle difference between bus i and bus j, Gij, and Bij represent the conductance and admittance between bus i and bus j, respectively, and NB is a set of power system buses.
Inequality constraint
Where PGimax, PGimin, QGimax, QGimin, respectively represent the upper and lower limits of the active power of the generator and the upper and lower limits of the reactive power at bus i. Timin and Timax, respectively represent the upper and lower limits of the adjustable ratio of the transformer at bus i, and NT represents the number of transformers in the system. Uimax and Uimin, respectively represent the upper and lower limits of the bus voltage, Plimax and Plimin, respectively represent the upper and lower limits of the active power of the branch, NG represents the set of generator buses, and Nl is the set of power lines. Based on this, the GA is used to calculate the POPF.
Calculation Steps of POPF
This chapter proposes a POPF calculation method that considers the correlation between PV output and load. The specific calculation steps are shown in Figure 6.
1. Based on the measured data of PV output and load, an adaptive diffusion kernel density estimation model that can reflect the PV output and load distribution characteristics is proposed.
2. Based on the Copula theory and taking the least Euclidean distance as index of fitting, the joint probability distribution model of PV output and load is obtained, and Kendall rank correlation coefficient is selected to describe the correlation between them.
3. The joint probability density distribution is sampled to obtain N groups of probability distribution samples with correlation. And then the PV output and load samples of N groups are obtained by inverse transformation using xi = (ui) and yi = (vi).
4. N times deterministic optimal power flow calculation is carried out by GA, and the results of power flow calculation are counted to obtain the results of POPF calculation.
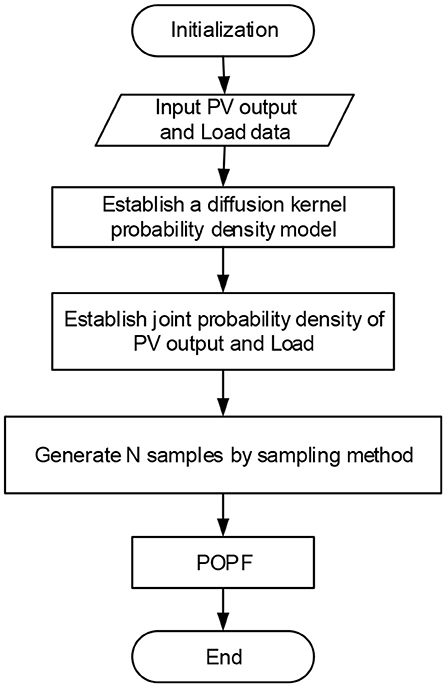
Figure 6. Flowchart of probabilistic optimal power flow.
Case Study
The proposed POPF method is tested on the IEEE 30-bus system, and the specific network structure is shown in Figure 7. The solid bus is the load bus, and the hollow is the generator bus. The number of buses in the network is NB = 30, the number of branches is Nl = 41, and the number of generator buses is NG = 6. PV power station with diffusion nuclear density probability distribution model is connected to bus 29 (Quan et al., 2019). The load bus adopts a Gaussian distribution model. The load mean is the load steady state value of the bus, and the variance of the bus load is 10%.
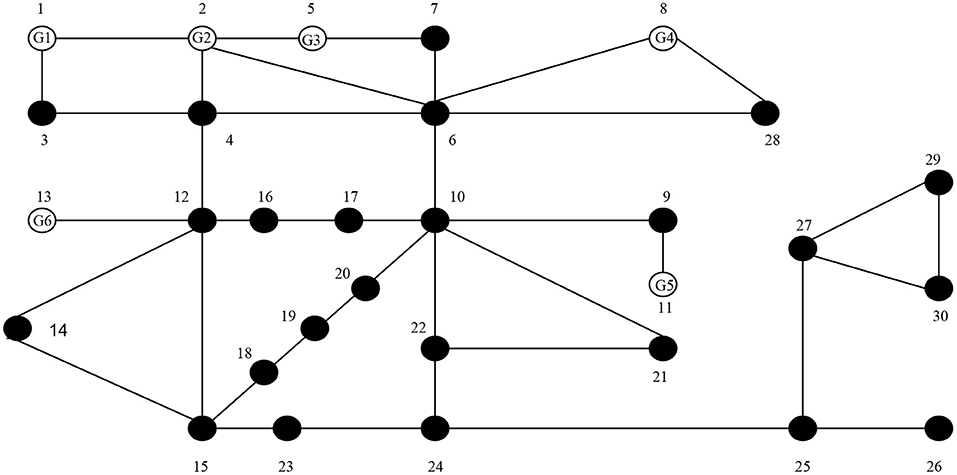
Figure 7. The IEEE 30-bus power system.
POPF Performance Evaluation Considering Correlation
The corresponding PV output and load data are respectively connected to buses No. 29 and No. 30, and the Monte Carlo probability optimal power flow calculation result with a sampling size of 30,000 times is used as an accurate result to judge the error of the proposed method. Table 2 gives the results of two POPF calculations.

Table 2. The results of probabilistic optimal power flow.
According to the comparison, the calculation results of the two are less error. It is verified that the proposed POPF calculation method that considers the correlation between PV output and load has higher accuracy.
Simulation Analysis of POPF
To further analyze the influence of the correlation between PV output and load on power system POPF calculation, the simulation is carried out on IEEE 30-bus system with the measured data of a PV power station and the corresponding measured data of the load in China. The output probability density distribution curve of generator No. 3 is shown in Figure 8. The comparison shows that the POPF calculation results considering the correlation between PV output and load are closer to Monte Carlo calculation results, and the accuracy is higher.
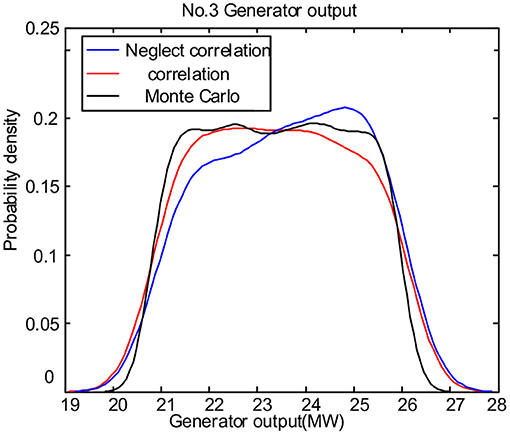
Figure 8. Probability density of No. 3 generator output.
Figures 9, 10 are the system power generation cost probability density curve and the system network loss probability density curve, respectively. As shown in Figure 9, the power generation cost curve that accounts for PV output and load correlation is closer to the Monte Carlo power generation cost curve. It can be seen that taking into account the correlation between PV output and load can improve the accuracy of system power generation cost calculation. It can be seen from Figure 10 that the system network loss curve considering the correlation between the two is closer to the Monte Carlo curve. It is proved that considering the correlation between the two can accurately estimate the network loss and the system power generation cost of the system and provide reliable reference information for scheduling.
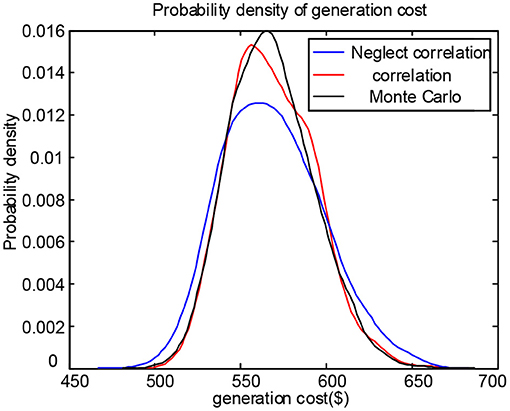
Figure 9. Probability density of generation cost.
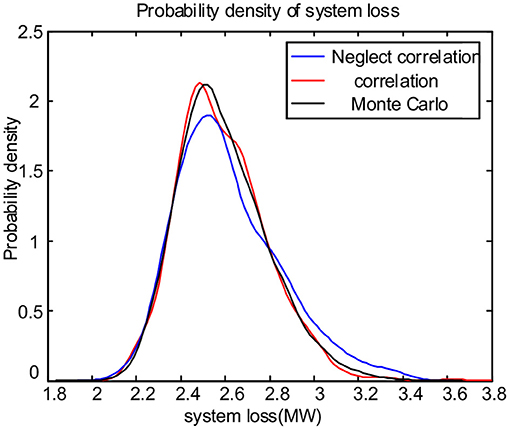
Figure 10. Probability density of system loss.
Figures 11, 12 are the system bus voltage mean curve and the bus voltage standard deviation curve, respectively. As can be seen from Figure 11, the three curves almost coincide. This shows that the correlation between PV output and load has little influence on the mean value of each bus in the power system. As shown in Figure 12, the curve that considers the correlation between PV output and load almost coincided with the Monte Carlo curve and away from the curve without considering the correlation. This shows that the correlation between PV output and load has great influence on the standard deviation of bus voltage. In addition, as shown in Figure 12, buses 23–30 are close to the buses with correlation, the standard deviation of buses 23–30 changes greatly, while the standard deviation of other buses changes little. This shows that the influence of the correlation between PV output and load on the operation state of the system is related to the distance. The closer the other buses are to the buses with correlation, the stronger the impact on the operation state is. The reason for this change is that considering the correlation between PV output and load makes their changes consistent and then strengthens the mutual influence of the operation state of the internal buses of the whole system. The closer the other buses are to the relevant PV and load buses, the stronger the impact on their operation.
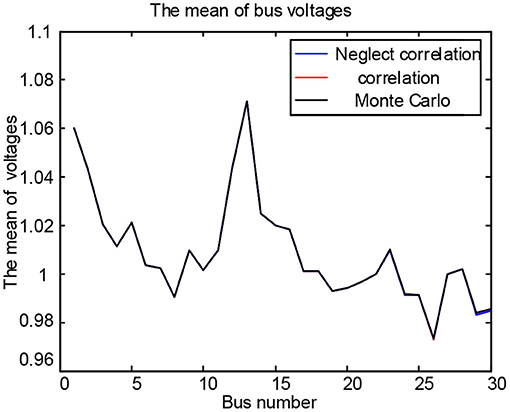
Figure 11. The mean of bus voltages.
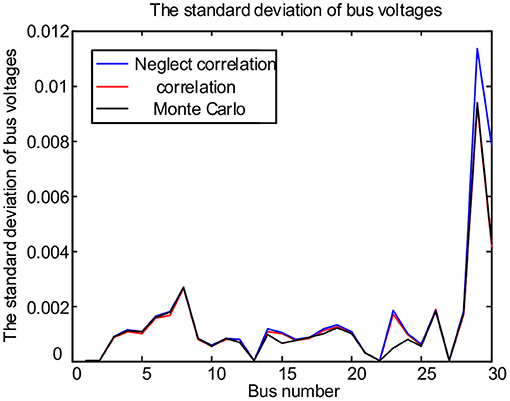
Figure 12. The standard deviation of bus voltages.
Supplementary Figures 1, 2 given in the supplementary material is the voltage probability density distribution of buses 12 and 26. The abscissa of the voltage probability density graph represents the variation range of the bus voltage. Bus 12 is far away from the buses with correlation, and its voltage range is 1.024–1.028. Bus 26 is close to the buses with correlation, and its voltage range is 0.962–0.980. It can be seen that the closer the bus is to the buses with correlation, the larger the variation range of bus voltage. One of the reasons for this change is that the PV output has fluctuations, which will cause the fluctuation of the system bus voltage. The closer other buses are to the PV buses, the greater the impact on their operation status. The other reason is that bus 26 is close to the buses with correlation. This change also verifies that the influence of the correlation between PV output and load on the system operation state is related to the distance. The closer other buses are to the relevant buses, the greater the impact on the operation status.
Conclusion
In this paper, a POPF calculation method based on adaptive diffusion kernel density estimation is proposed. The following conclusions can be drawn:
1. The traditional Gaussian kernel function is transformed by linear diffusion, and an adaptive diffusion kernel density estimation method suitable for arbitrary distributed PV output is proposed. The adaptive characteristics of linear diffusion improve the local adaptability of the PV output estimation model, and the model can more accurately describe the uncertainty and volatility of the actual output of the PV power plant.
2. Based on the Copula theory, the joint probability distribution model of PV output and load is established by using the least square Euclidean distance as the criterion. Then, through the sampling and inverse transformation of the function, the correlated PV output and load samples are obtained, which avoids the state space transformation of the correlation coefficient matrix and reduces the sampling calculation.
3. POPF calculation method that considers the correlation between PV output and load is proposed. The case study shows that considering the correlation can improve the accuracy of the probability optimal power flow calculation and effectively reduce system power generation costs and bus voltage deviations. And the closer to the correlation buses, the higher the influence of the correlation between PV output and load on the voltage deviation.
Data Availability Statement
The datasets analyzed in this manuscript are not publicly available. Requests to access the datasets should be directed to the datasets generated for this study are available on request to the corresponding author.
Author Contributions
GL: conceptualization. JB: methodology. WL: software. GL and JB: validation. WL: formal analysis. FQ and JW: data curation.
Funding
This research was financially supported by the Science and Technology Foundation of SGCC (Research and Application of Multi-Spatial Scale Variation of Photovoltaic Output Characteristics Considering Complex Factors such as Cloud and Floating Dust: NY71-19-013).
Conflict of Interest
The authors declare that the research was conducted in the absence of any commercial or financial relationships that could be construed as a potential conflict of interest.
The handling editor declared a past co-authorship with one of the authors GL.
Supplementary Material
The Supplementary Material for this article can be found online at: https://www.frontiersin.org/articles/10.3389/fenrg.2019.00128/full#supplementary-material
References
Aien, M., Fotuhi-Firuzabad, M., and Rashidinejad, M. (2014). Probabilistic optimal power flow in correlated hybrid wind–photovoltaic power systems. IEEE Trans. Smart Grid 5, 130–138. doi: 10.1109/TSG.2013.2293352
Botev, Z. I., Grotowski, J. F., and Kroese, D. P. (2010). Kernel density estimation via diffusion. Ann. Statist. Inst. Math. Statist. 5, 2916–2957. doi: 10.1214/10-AOS799
Chaudhuri, P., and Marron, J. S. (2000). Scale space view of curve estimation. Ann. Statist. 28, 408–428. doi: 10.1214/aos/1016218224
Chen, Y., Wen, J., and Cheng, S. (2013). Probabilistic load flow method based on nataf transformation and Latin hypercube sampling. IEEE Trans. Sust. Energy 4, 394–301. doi: 10.1109/TSTE.2012.2222680
Duan, S., Miao, S., Huo, X., Li, L., Han, W., and Yan, K. (2019). Modeling and dynamic correlation analysis of wind/solar power joint output based on dynamic Copula. Pow. Syst. Prot. Control 5, 35–42. doi: 10.7667/PSPC180149
Fan, M., Vittal, V., Heydt, G. T., and Ayyanar, R. (2012). Probabilistic load flow studies for transmission systems with photovoltaic generation using cumulants. IEEE Trans. Pow. Syst. 27, 2251–2261. doi: 10.1109/TPWRS.2012.2190533
Guo, X., Renxi, G., and Bao, H. (2018). Mixed probabilistic and interval optimal power flow considering uncertain wind power and dispatchable load. IEEEJ Trans. Electr. Electron. Eng. 13, 246–252. doi: 10.1002/tee.22520
Kazemdehdashti, A., Mohammad, M., and Seifi, A. R. (2018). The generalized Cross-Entropy method in probabilistic optimal power flow. IEEE Trans. Pow. Syst. 33, 5738–5748. doi: 10.1109/TPWRS.2018.2816118
Ke, D., Chung, C. Y., and Sun, Y. (2016). A novel probabilistic optimal power flow model with uncertain wind power generation described by customized gaussian mixture model. IEEE Trans. Sust. Energy 7, 200–212. doi: 10.1109/TSTE.2015.2489201
Li, K., Tai, N., Zhang, S., and Chen, X. (2017). Multi-objective planning method of distributed generators considering correlation. Autom. Electr. Pow. Syst. 9, 51–57. doi: 10.7500/AEPS20160805001
Lin, W., Yang, Z., Yu, J., Bao, S., and Daii, W. (2019). Toward fast calculation of probabilistic optimal power flow. IEEE Trans. Pow. Syst. 34, 3286–3288. doi: 10.1109/TPWRS.2019.2911050
Liu, S., Liu, P. X., Wang, X., and Meng, W. (2017). Effects of correlated photovoltaic power and load uncertainties on grid-connected microgrid day-ahead scheduling. IET Gen. Trans. Distrib. 11, 3620–3627. doi: 10.1049/iet-gtd.2017.0427
Lujano-Rojas, J. M., Dufo-López, R., Bernal-Agustín, J. L., Domínguez-Navarro, J. A., and Catalão, J. P. S. (2018). Probabilistic methodology for estimating the optimal photovoltaic capacity in distribution systems to avoid power flow reversals. IET Renew. Pow. Gen. 12, 1045–1064. doi: 10.1049/iet-rpg.2017.0777
Miao, S., and Xie, K. (2016). A mixture kernel density model for wind speed probability distribution estimation. Energy Convers. Manage. 126, 1066–1083. doi: 10.1016/j.enconman.2016.08.077
Morshed, M. J., Hmida, J. B., and Fekih, A. (2018). A probabilistic multi-objective approach for power flow optimization in hybrid wind-PV-PSE systems. Appl. Energy 211, 1136–1149. doi: 10.1016/j.apenergy.2017.11.101
Quan, D. M., Pham, D. P., Nguyen, T. T., Tuan, D. A., and Tran, H. T. (2019). Determination of optimal location and sizing of solar photovoltaic distribution generation units in radial distribution systems. Energies 12, 1–24. doi: 10.3390/en12010174
Ren, Z., Wang, K., Li, W., Jin, L., and Dai, Y. (2017). Probabilistic power flow analysis of power systems incorporating tidal current generation. IEEE Trans. Sust. Energy 8, 1195–1202. doi: 10.1109/TSTE.2017.2669139
Sadjad, G., and Mahmoud, C. (2019). Data clustering based probabilistic optimal power flow in power systems. IET Gen. Transm. Distrib. 13, 181–188. doi: 10.1049/iet-gtd.2018.5832
Ullah, Z., Wang, S., Radosavljević, J., and Lai, J. (2019). A solution to the optimal power flow problem considering WT and PV generation. IEEE Access 7, 46763–46772. doi: 10.1109/ACCESS.2019.2909561
Wang, M., and Ding, M. (2010). Probabilistic calculation of total transfer capability including large-scale solar park. Autom. Electr. Pow. Syst. 7, 31–35
Wang, T., Wang, C., and Li, C. (2018). Probabilistic load flow calculation based on Copula function and Rosenblatt transformation considering correlation among input variables. Pow. Syst. Prot. Control 21, 18–24. doi: 10.7667/PSPC171534
Widen, J., Shepero, M., and Munkhammar, J. (2017). Probabilistic load flow for power grids with high PV penetrations using Copula-based modeling of spatially correlated solar irradiance. IEEE J. Photovoltaics 7, 1740–1745. doi: 10.1109/JPHOTOV.2017.2749004
Wu, W., Wang, K., Han, B., Li, G., Jiang, X., and Crow, M. L. (2015). A versatile probability model of photovoltaic generation using pair Copula construction. IEEE Trans. Sust. Energy 6, 1337–1345. doi: 10.1109/TSTE.2015.2434934
Wu, W., Wang, K., and Li, G. (2017). Probabilistic load flow calculation method based on multiple integral method considering correlation of photovoltaic generation. Autom. Electr. Pow. Syst. 4, 568–574. doi: 10.13334/j.0258-8013.pcsee.2015.03.008
Xiao, Q., Shaowu, Z., and Jurado, F. (2018). Probabilistic power flow computation considering correlated wind speeds. Appl. Energy 231, 677–685. doi: 10.1016/j.apenergy.2018.09.165
Xie, Z. Q., Ji, T. Y., Li, M. S., and Wu, Q. H. (2018). Quasi-Monte Carlo based probabilistic optimal power flow considering the correlation of wind speeds using copula function. IEEE Trans. Pow. Syst. 33, 2239–2247. doi: 10.1109/TPWRS.2017.2737580
Zhang, N., Kang, C., Singh, C., and Xia, Q. (2016). Copula based dependent discrete convolution for power system uncertainty analysis. IEEE Trans. Pow. Syst. 31, 5204–5205. doi: 10.1109/TPWRS.2016.2521328
Keywords: PV output, adaptive diffusion kernel density, Copula theory, correlation, probabilistic optimal power flow
Citation: Li G, Lu W, Bian J, Qin F and Wu J (2019) Probabilistic Optimal Power Flow Calculation Method Based on Adaptive Diffusion Kernel Density Estimation. Front. Energy Res. 7:128. doi: 10.3389/fenrg.2019.00128
Received: 31 July 2019; Accepted: 30 October 2019;
Published: 21 November 2019.
Edited by:
Dongbo Zhao, Argonne National Laboratory (DOE), United StatesReviewed by:
Lucian Toma, Politehnica University of Bucharest, RomaniaMinh Quan Duong, The University of Danang, Vietnam
Copyright © 2019 Li, Lu, Bian, Qin and Wu. This is an open-access article distributed under the terms of the Creative Commons Attribution License (CC BY). The use, distribution or reproduction in other forums is permitted, provided the original author(s) and the copyright owner(s) are credited and that the original publication in this journal is cited, in accordance with accepted academic practice. No use, distribution or reproduction is permitted which does not comply with these terms.
*Correspondence: Jing Bian, bj_jjj@163.com