Developing Distributed PV in Beijing: Deployment Potential and Economics
 Xingping Zhang1,2
  Haonan Zhang
- 1School of Economics and Management, North China Electric Power University, Beijing, China
- 2Beijing Key Laboratory of New Energy and Low-Carbon Development, North China Electric Power University, Beijing, China
The building sector consumed a total of 580 million tons-coal equivalent (Mtce) terminal energy in China in 2018 including 1,888 terawatt-hours (TWh) electricity, accounting for 20.2% of total terminal energy consumption in this country. As the capital of China, Beijing is striving to improve the air quality while ensuring power and heat supply due to heavy reliance on electricity intake from other energy-rich provinces. The distributed photovoltaic, as a flexible application of renewable energy systems in urban and rural regions, can contribute to the power supply for rapid urbanization and mitigate the negative environmental impact of fossil energy use. In the context of grid parity, this article provides a systematic analysis of solar resource potential, power generation economics and policy support for the rooftop photovoltaic (PV) system in Beijing. The deployment potential of rooftop PV is estimated to be 11.47 GW and the large-scale commercial rooftop PV is approaching grid parity. Furthermore, this article discusses the feasibility of large-scale distributed PV deployment in Beijing by considering distributed electricity trade envisioned the ongoing power market reform in China.
Introduction
Solar PV and wind power are currently obtaining great opportunity for installation expansion and technological innovation around the world. Renewables are becoming an excellent option for many countries in the transition toward a secure, cost-effective and low-carbon energy supply system, while simultaneously combating climate change and local air pollution (IRENA, 2019). Current energy policies regard the development of renewables as a fundamental action plan to meet the immediate rise in energy demands expected in the coming decades. Moreover, solar PV is more universal and feasible for end-use sectors than clean energy such as hydropower, wind power, and biomass, because the rooftop PV can be installed on the demand side (IRENA, 2019). In this context, solar PV is one of the most promising options with an infinite sunlight resource and environmental sustainability to cover the evolving landscape for the integration of variable renewable power (Chitra and Himavathi, 2013; Bye et al., 2018).
The modularity of solar PV systems allows the universal deployment of modern energy across urban, rural, and suburban areas. Driven by the environmental policies and the sharp decline in renewable power costs, in particular the cost of PV falling by almost 75% between 2009 and 2018 (IRENA, 2018), the solar PV gains impressive growth with the installed capacity reaching 397 gigawatts (GW), comprising 17% of total renewable energy capacity and 5.78% of total power generating capacity (IEA, 2018). The power supply from distributed photovoltaic (DPV) and small solar devices, such as commercial park PV and solar home systems, is growing especially fast. New data from IRENA shows that about 25 million people obtain a higher level of renewable energy services through solar home systems or connection to a solar mini-grid (IRENA, 2016). International experiences may provide insight that the successful applications of solar PV contribute energy supply and conservation in the building sector (Bansal and Goel, 2000; Radhi, 2010; Sadineni et al., 2012; Emziane and Al Ali, 2015).
Assessment of the deployment potential of rooftop PV systems has been an expansive area for research scholars. Taking advantages of developing geospatial technology and efficient computational methods, several methodologies based on Geographic Information System (GIS) techniques are more accurate than the constant value method (making a number of assumptions to calculate the utilizable rooftop area) and manual based selection (using remote sensing techniques such as high-resolution satellite images to evaluate the available rooftop areas) in evaluating the potential of building rooftop PV installation (Dehwah et al., 2018). Literature summarizes several generic GIS-based toolkits including Feature Analyst tool (Wiginton et al., 2010), Light Detection and Ranging (LiDAR) (Jacques et al., 2014; Gooding et al., 2015; Lingfors et al., 2017) and Digital Surface Model (DSM) (Buffat et al., 2018). An alternative to DSM is 3D building models created from aerial photos, as Google Maps demonstrates, which will be available in the foreseeable future. Digital Elevation Model (DEM) and DSM are both the branches of the Digital Terrain Model. DEM represents the topographic surface of the terrain. This article uses DEM supported by Platform for Geographical Situation Monitoring of China to identify the rooftop geometries and compute the PV installed potential in Beijing. Thus, the process of DEM assessments is further elaborated in the sections below.
The economic evaluation metrics of a power generation project comprise various technical indicators of engineering economics, including net present value (NPV), life-cycle costing, levelized cost of electricity (LCOE), internal rate of return (IRR) and payback period, etc. Short et al. (1995) presented a comprehensive and detailed review of economic evaluation modeling. NPV index, as a profitability indicator used in capital budgeting, refers to the present value of cash inflows minus the present value of cash outflows. Li and Liu (2018) integrated NPV analysis with a developed pixel-based method to estimate the revenue of potential building PV projects. IRR is defined as the discount rate when the NPV equals zero, that is, the total present value of inflows equals the total present value of outflows. IRR method integrates the project returns during its lifespan with its total investment and provides a benchmark metric to determine whether the project is worth investing (Zhao et al., 2017). This merits the attention that, when evaluating independent projects, NPV, and IRR yield the same decision. Unfortunately, NPV intrinsically necessitates an appropriate discount rate that is the focus of controversy. Thus, IRR analysis is generally preferred other than NPV. The LCOE methodology is extensively applied when mentioning generation competitiveness of various power technologies options or considering grid parities for emerging technologies (Branker et al., 2011; Congedo et al., 2013; Larsson et al., 2014). The rationale for LCOE analysis is to consider lifetime generation and costs to evaluate the tariff per unit of electricity by minimizing the biases between diverse generating technologies (Yuan et al., 2014). Therefore, this article applies the LCOE method and IRR analysis to appraise the rooftop PV system in Beijing.
The combustion of fossil fuels predominately causes deterioration of the atmospheric environment by releasing sulfur dioxide (SO2), nitrogen oxides (NOX), particulate matter (PM), and carbon dioxide (CO2). In China, the coal-fired power issued severe regional pollution. Beijing and its surrounding areas explicitly prohibit captive coal power plants for coal capping and air quality improvement (NDRC and NEA, 2017). The DPV deployment will contribute to this process. Jones and Gilbert (2018) used the life cycle assessment (LCA) to assess the greenhouse gases (GHG) emissions for PV generation at the aggregated distribution network scale. Wang et al. (2018) estimated the potential of life cycle CO2 emissions reduction for three different patterns in Beijing. Allouhia et al. (2019) illustrated the environmental impact of PV systems by evaluating the potential of carbon emissions reduction, assuming that the energy generated by PV installations substitutes that by thermal power. The aforementioned literature conducted environmental impact analysis by employing a single factor of carbon emissions, which underestimates the environmental value without considering SO2, NOX, and PM. Thus, this article will consider all of the emissions mitigation fees to explore the real environmental value of rooftop PV.
Compared with previous studies, this article contributes a more comprehensive and comprehensive analysis of the potential and value of photovoltaic development. This article employs DEM technology to explore the precise potential of rooftop PV deployment, reconciles LCOE and IRR theories to appraise the appealing economics, and further considers the environmental value through mitigating emissions from coal-fired power generating.
This study unfolds as follows. Section A Development Briefing of Beijing presents a brief overview of power development in Beijing. Section Methodology introduces the methodology of potential estimation and economic analysis. Section Results and Discussion illuminates the empirical results and discussion on rooftop PV development in Beijing. Finally, section Conclusion and policy implications concludes the article with implications. The abbreviation for manuscript is depicted in Appendix I, and supporting policies and governmental subsidies for DPV power are described in Appendix II.
A Development Briefing of Beijing
Beijing, as the capital of China, covers 6,410 square kilometers with 27.1 million permanent residents. The capital city provides a massive daily energy consumption of 195,000 tce with daily GDP (Gross Domestic Product) of 767.5 million Chinese Yuan (CNY) in 2017. In order to optimize the energy structure and improve the environment, the government has formulated a large number of regulations to restrain the utilization of coal. Typically, from 2013, Beijing committed to phasing out all coal-fired generation fleets and installing alternative gas power plants. By the end of 2017, the energy mix of 71.33 Mtce in Beijing comprised coal (5.65%), petroleum (33.8%), natural gas (31.8%), external transmitted electricity (25.99%), and others (2.77%) (Beijing Municipal Bureau of Statistics, 2018). One of the remarkable performances is that from 2000 to 2017, the daily average concentration of SO2 has dropped from 71 to 8 mg/m3. The average concentration of Particulate Matters 2.5 (PM2.5) in Beijing drops from 104 μg/m3 in 2010 to 50.9 μg/m3 in 2018, ranking 8th in the global capital city in 2018 (AirVisual, 2018). The improvement of environmental performance in Beijing benefits from the cleaner energy and power supply.
As shown in Figure 1, the total electric power consumption in Beijing has increased to 1,067 TWh by the end of 2017. The development process characterizes several following marked features: (a) the sharp growth in 2000 derives from the compression of the coal utilization in terminal energy consumption to mitigate the severe environmental pollution, with the proportion of coal in terminal energy consumption falling from 70% in 1978 to 43% in 2000 (Beijing Municipal Bureau of Statistics, 2017); (b) the power consumption of service industry exceeded that of secondary industry in 2011, indicating the strong growth of real economic in service industry; (c) residential power consumption remains a fairly rapid increasing, 44 times higher in 2017 than in 1986; (d) the rebound of electricity consumption growth in 2016 is partially driven by the clean heating policy of coal-to-electricity transformation. Simultaneously, in 2017, the household electricity consumption in Beijing reached 1004 kWh/p which is equivalent to the level in Germany, Korea and Italy in 2011 (IEA Statistics, 2018).
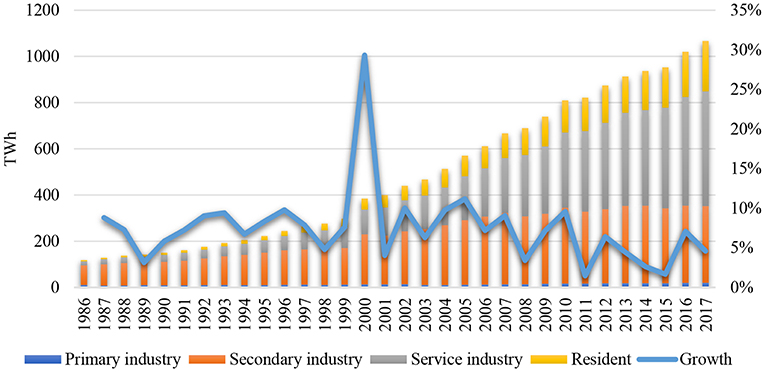
Figure 1. Electric power consumption and annual growth of total power consumption in Beijing, 1986–2017. Primary industry refers to agriculture, forestry, animal husbandry, and fishery and services in support of these industries. Secondary industry refers to mining and quarrying, manufacturing, production, and supply of electricity, water and gas, and construction. The tertiary industry, namely service industry, refers to other industries except the primary industry and the secondary industry. Resident refers to the household. The annual growth is calculated compared to the previous year.
The solar PV resource in Beijing is pretty abundant. The annual solar radiation in Beijing is about 4,600–5,700 MJ/m2, located in the Class-II resource areas of China1. The annual average generation hours of DPV system may reach 1,214 h2 in Beijing. PV systems can be classified into grid-connected and standalone systems based on their operational and functional requirements (Chitra and Himavathi, 2013). This article conducts a comparative economic evaluation of grid-connected and standalone rooftop PV systems for commerce and household.
Beijing pioneers in the full supply of clean electric power because there are no local coal-fired power plants. In 2017, the bulk of electric power was local gas power generation (34.7%) and renewable power generation (1.57%), as well as external electricity (63.7%) transmitted from vicinal provinces. By the end of 2018, the DPV installed capacity is 350 MW, occupying 87.5% of total solar PV installation, and the recently installed capacity accounts for 42.85% of the total. Until now, the government has issued seven award lists of DPV generation projects, which includes 141 commercial DPV projects and 9,796 household PV projects connected to the grid (shown in Table 1). The solar PV market gained momentum due to electricity generation planning and financial support policy. Beijing government explicitly pledged to 1,000 MW installed capacity by 2020. The concentrated PV will be hardly increased because it covers additional land resources instead of building roof resources like DPV. Thus, for the overcrowded capital city, the DPV installation is a more probable choice for the rest of the deployment.
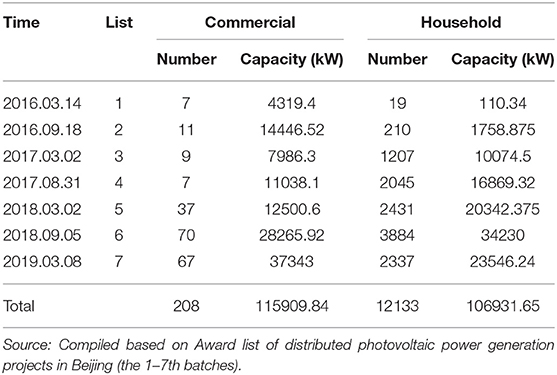
Table 1. Beijing DPV power generation project award list.
Methodology
We devised a three-stage approach to calculate the deployment potential and economics of rooftop PV in Beijing. The three research blocks comprise rooftop area assessment, PV generation economic appraisal and environmental value (depicted in Figure 2). In this article, the deployment potential of rooftop PV depends on the available roof of commercial and residential buildings, which is evaluated by DEM based on advanced digital and spatial techniques coupled with distinct building roof features. Then, the financial appraisal methods of engineering projects, including LCOE and Project Financial Evaluation, are employed to quantify the investment attraction. Finally, the environmental value assessment can provide insight into the positive impact on pollutant emission reduction in Beijing.
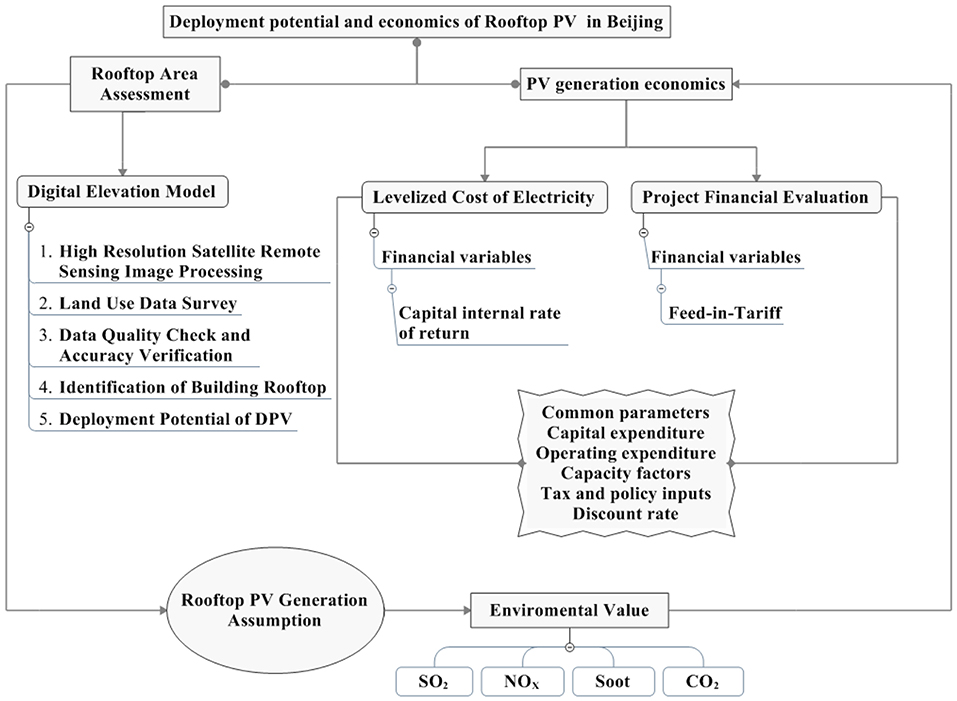
Figure 2. Overall research methodology.
Digital Elevation Model
DEM realizes the digital simulation of terrain (i.e., the digital representation of terrain surface morphology) through limited terrain elevation data. It is an entity terrain model that represents terrain elevation in the form of a set of ordered numerical arrays. The technology map of DEM is presented in Figure 3.
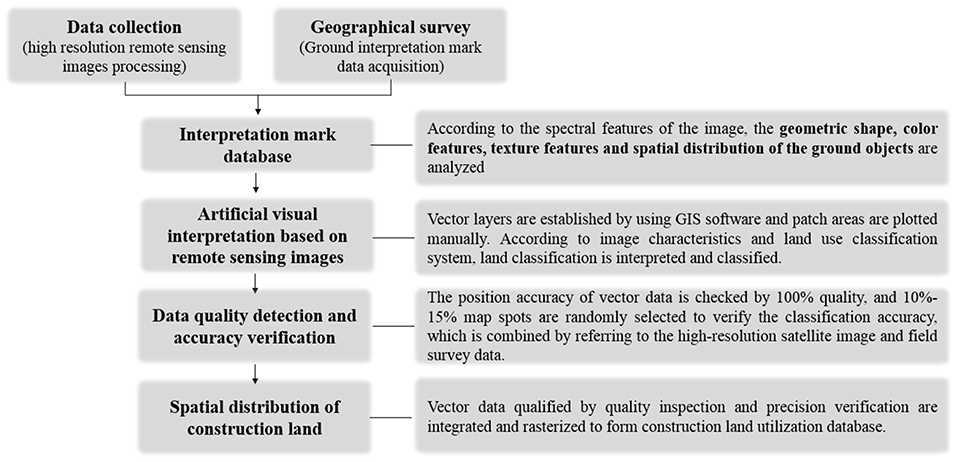
Figure 3. DEM technology map. Source: Platform for geographical situation monitoring of China.
DEM database supported by Platform for Geographical Situation Monitoring of China adopts a rapid extraction method of full digital human-computer interaction remote sensing to establish a spatial dataset for construction land and simultaneously make raster data of multiple scales. The high-quality DEM data with a spatial resolution of 30, 90 m and 1 km covers urban land use, rural residential area and other construction lands, etc. Then, the building area suitable for rooftop PV deployment is capable to be screened out from the massive land utilization data.
LCOE
LCOE refers to the tariff when the present value of the total revenues is equivalent to the present value of the total cost during the project lifespan. In this context, we employ the analytical approach proposed by Yuan et al. (2014) to evaluate the LCOE of rooftop PV systems in Beijing. The formula for calculation is shown as follows:
where En is the annual PV generation, C is the unit investment cost of the system, OPEX is the rate of operation and maintenance (O & M) cost, and I is the rate of insurance cost, TAXn is annual tax, Ci is interest rate of the loan, R is roof renting cost, H is annual utilization hours, S is generating capacity, d is the annual degradation rate of PV system, η is the performance factor of the system, r is discount rate and a stands for the construction period.
Project Financial Appraisal
The financial appraisal analysis of engineering projects involves a comprehensive evaluation of profitability, solvency and financial viability through integrating investment, costs, revenues, taxes and profits under a certain system of accounting, tax and price (Fu and Quan, 1996). The source of funds and the repayment of loan funds will affect the cash flow, then affect the economic performance of an enterprise. Thus, the economic appraisal covers two assessments: (a) “full investment” financial analysis regards all funds as own funds to examine the economic effects within the scope of enterprises; (b) “proprietary funds” financial analysis considers all factors including financial conditions to investigate the profitability of enterprises. In this article, we appraise the economics of engineering projects, not the profitability of own investment. Thereby, the full investment assessment matches the purpose. IRR, as already noted, is a rational metric to determine whether the project is worthy of investment (Yuan et al., 2014). IRR is generally considered to reflect the investing efficiency. Thus, we employ full investment IRR as an economic indicator.
LCOE analysis and project financial appraisal share many common variables and parameters that can be integrated into four categories: technical and economic variables, taxes and charges, operation expenditure and financial variables (Figure 4). Table 2 reports a detailed description of the common parameters for LCOE and IRR estimation based on current PV investment market briefs (detailed in Yuan et al., 2014; Li et al., 2018).
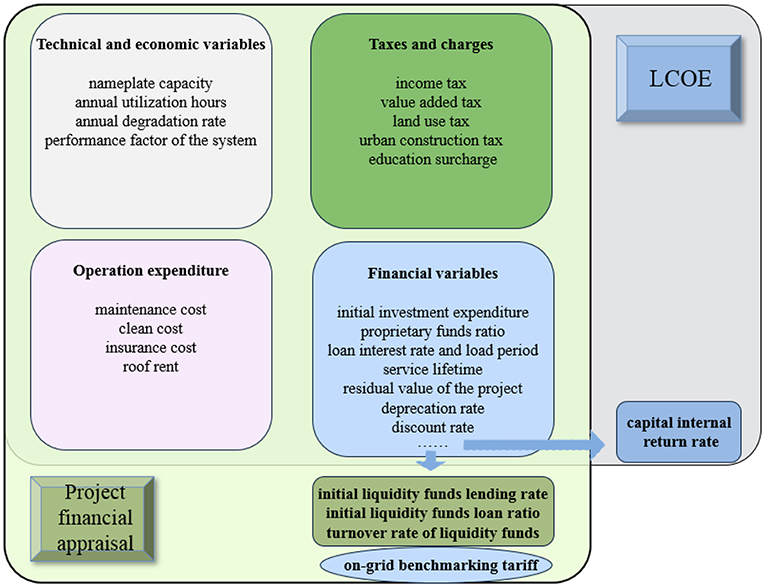
Figure 4. Model variables and parameters.
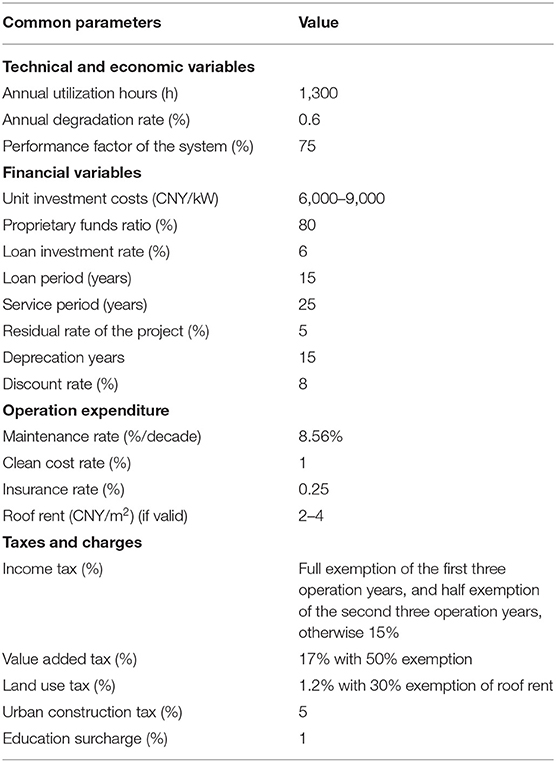
Table 2. Common parameters for economic analysis of rooftop PV.
Results and Discussion
Deployment Potential of Rooftop PV in Beijing
The high-quality DEM data can categorize construction land area in Beijing into urban land, rural land, and industry and traffic land. In detail, the urban land includes commercial buildings, ancient buildings, office buildings (including government, hospital and education institutions), and urban residential buildings (including multi-family and detached house) with clear features and name identifications. The public facility consists of transportation, water conservancy and industrial land. This article identifies the commercial building, office building, and residential building as available blocks for the rooftop PV system.
The DEM data describes the land use of Beijing covers 16,411 km2 (square kilometer) and the share of the building area is 19.7%. The building area suitable for rooftop PV is estimated at 241 km2 in Beijing in 2018, accounting for 7.45% of the total building area. After estimating the rooftop areas available for PV installation, it also requires the information about land use for unit installation to calculate the deployment potential. The Ministry of Land and Resources (MLR) of China, now renamed the Ministry of Natural Resources (MNR), recommends that the average land use for the rooftop PV project is 21 m2/kW in Beijing. Coupled with the estimated building roof area of 241 km2, the deployment potential of distributed PV in Beijing is determined to be 11.47 GW.
LCOE Results
By using the concise summaries of market findings, this article integrates the rooftop PV projects into six groups by generation capacity as the baseline levels of LCOE and IRR estimation. The distributed PV is defined as the station with generating capacity <6 MW in China (NEA, 2013). The large-scale rooftop PV more than 1 MW is appreciated to installation in the commercial zones and office buildings, and the small-scale DPV can be installed in residential buildings (apartment buildings and detached houses). The smallest-scale rooftop PV occupies the highest initial unit investment cost, that is, 9,000 CNY/kWh in the current market. In addition, the 2 kW-scale PV project rarely obtains a loan due to the tiny investment scale. The annual utilization hours of DPV derives from the annual valid data extraction of previous years. Table 3 presents the baseline LCOE levels of rooftop PV projects in Beijing. The capacity of commercial rooftop PV is assumed as 6, 2, and 1 MW; for the residential rooftop PV projects, the capacity is set as 20, 10, and 2 kW. The unit investment costs decrease with the increase of installed capacity of DPV project. As mentioned above, the unit roof usage is set as 21 m2/kW and the annual utilization hours is configured as 1,214 h/year. The baseline LCOE for diverse scales of rooftop PV projects ranges between 0.57 and 0.79 CNY/kWh. The result explored by Yuan et al. (2014) revealed that the LCOE of DPV ranged between 1.16 and 1.29 CNY/kWh, which is substantially more than our estimation. This disparity is due to the sharp decline in PV modules and an additional reduction of operation and maintenance cost.
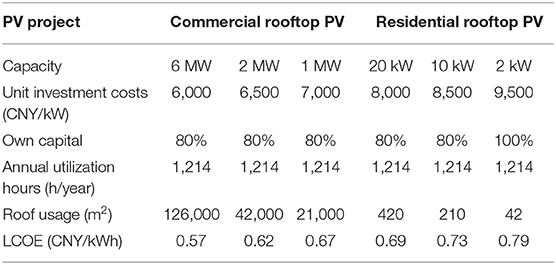
Table 3. Baseline LCOE levels of rooftop PV projects at various scales.
IRR Appraisal
In the baseline scenario of IRR, for convenience sake, we made some assumptions: (a) the roof owner and the PV investor are the same and thus the rules of on-site own consumption and on-grid redundant sale can be approved, and then the savings for commercial electricity bills are equivalent to the revenue of DPV project; (b) the shares of on-grid electricity for commercial and residential rooftop PV are 50% and 20%, respectively3; (c) the benchmarking on-grid electricity for coal power is set to 0.36 CNY/kWh according to the market price in Hebei province (the district around Beijing), because there is no longer any coal power in Beijing4; (d) the average commercial and residential electricity prices are 1 and 0.5 CNY/kWh5, respectively. Table 4 reports the results of the baseline IRR of commercial and residential DPV in Beijing. We term 8% as the benchmarking IRR for the power industry (Beijing Municipal Commission of Development Reform, 2013; Yuan et al., 2014). Thus, the IRRs of residential rooftop PV yield of 10 and 2 kW installed capacity are less than industry reference profitability, implying the poor investment attraction even with government subsidies. For parts of the patch, feed-in-tariff (FiT) for renewable energy is equal to the benchmarking on-grid electricity price for coal power plus renewable energy price subsidy, and Beijing's subsidy for the first 5 years is additional (see Appendix II for details). Comparing with residential DPV, the IRRs of large-scale commercial rooftop PV projects are higher than the sector's benchmarking return rate due to the low investment cost and high commercial electricity price.
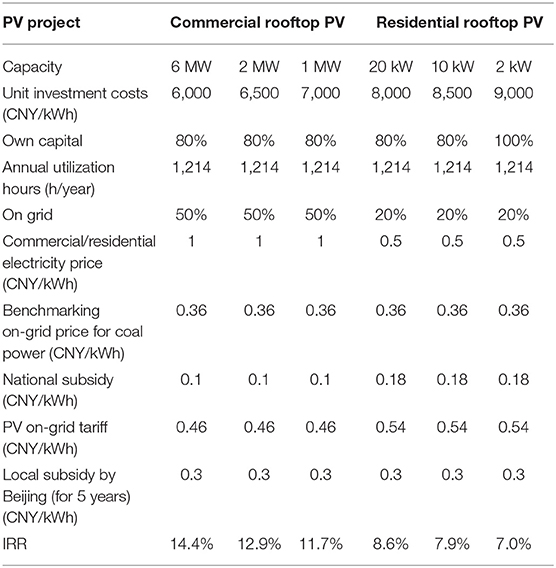
Table 4. IRR of commercial and residential rooftop PV in the baseline scenario.
Environmental Value Estimation
Although all the coal power plants have been eliminated, a large part of the power supply originates from the cross-regional transmission of coal power. This measure just shifts the pollution to other places rather than pollutants remission. Unlike the combustion of fossil fuels emitting various pollutants, the clean power generated by rooftop PV contributes to mitigating the environmental pressures. Lau et al. (2016) illustrated the emissions factors of different pollutants in China's regional power grids, and the sewage tax standard is the average charge of surrounding provinces (shown in Table 5) (Science Academy and Geography Institute of Henan Province, 2018). Then the total generation of rooftop PV could be 13924.58 GWh aligned with the deployment potential of 11.47 GW. Finally, the environmental value of rooftop PV in Beijing is estimated to be 1237.97 million CNY, which is a considerable social gain. Furthermore, DPV creates diverse implicit benefits, such as energy conservation, smart power and poverty alleviation, etc.
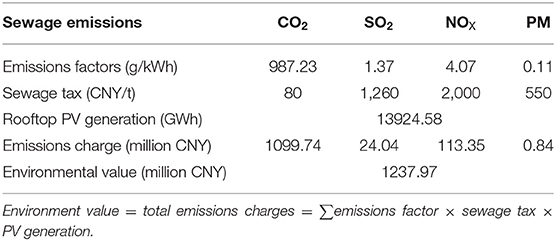
Table 5. Emissions factors and sewage tax for coal power and environmental value of DPV in Beijing.
Sensitivity Analysis and Discussions
The initial investment of power project usually has a crucial impact on the LCOE, especially for the renewable energy stations due to the no-fuel-cost feature. The progress of grid parity for wind and solar power mainly derives from the device's cost decline. In China, the lowest quotation for the DPV project is 5,000 CNY/kWh in specific districts (ERI, 2019). Suppose other factors remaining the same, the impact of initial investment variations on LCOE and IRR is quantified in Table 6. Given 1,000 CNY/kWh reduction in unit investment cost of rooftop PV, the LCOE would drop by 0.09–0.1 CNY/kWh and the IRR would rise by 1.5–3.8 percentage points. If the unit investment cost of 2 kW residential rooftop PV became, the IRR would be higher than the benchmarking return rate.
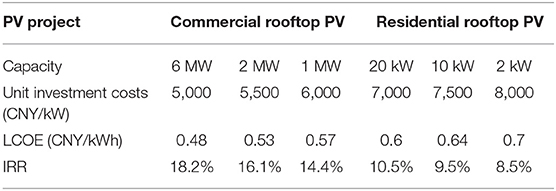
Table 6. The impact of initial investment on the LCOE and IRR of rooftop PV in Beijing.
For IRR of a rooftop PV project, another influencing factor is the share of on-grid electricity. As shown in Table 7, the share of on-grid electricity has a significant impact on the IRR of rooftop PV. For example, the IRR of 6 MW rooftop PV is 13.1, 14.4 and 15.7% when the share is 60, 50 and 40%, respectively. In simple terms, IRR is negatively correlated with the share of on-grid electricity, because the commercial/residential electricity price is higher than FiT.
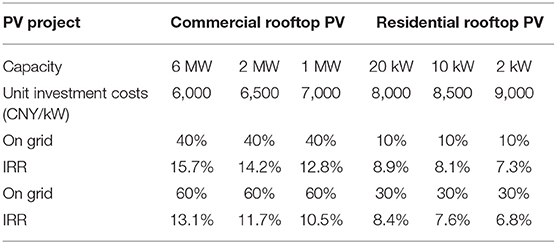
Table 7. The impact of on-grid share on the LCOE and IRR of rooftop PV in Beijing.
The subsidy for renewable energy still boosts the rooftop PV industry, whereas the government has promulgated subsidy retreat policy. Given that the national subsidy is halted and local subsidy remains the same, the IRRs of rooftop PV at various scales in Beijing would fall by a fraction as reported in Table 8. By then, the IRRs of commercial rooftop PV would remain higher than 8%, but residential rooftop PV gains a poor return rate. We can conclude that the grid parity of large-scale distributed PV in Beijing is nearly feasible.
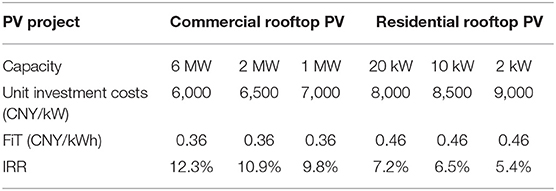
Table 8. The impact of subsidy retreat on the LCOE and IRR of rooftop PV in Beijing.
At the end of October 2017, NDRC and NEA jointly issued the “notice on the implementation of a market-oriented trading pilot program for distributed power generation,” which put forward reform plans on the problems such as low degree of market-oriented trading, lagging public services and imperfect management system encountered in distributed power generation. Then in January 2018, NEA further clarified the market-oriented trading pilot requirements of distributed power generation in terms of detailed rules. Recently, NDRC announced the pilot list for market-oriented trading of distributed power generation including 26 programs with a total installed capacity 1.47 GW though not in the Beijing area. These distributed power programs as grid parity demonstration occupy a full-scale guaranteed acquisition and priority right for generating, which is pledged by long-term fixed-price electricity purchase contract (not <20 years) aligned with benchmarking tariff of coal power. The market-oriented transaction of DPV helps to form the mechanism of market-determined electricity price, construct the market transaction process and system, reflect the reasonable value of distributed power, realize the grid parity as soon as possible, and create a win-win situation for power enterprises and terminal consumers.
FiTs function in a similar way to a standardized, long-term power purchase agreement (PPA), usually signed with a utility or a network company and backed by the government, although the stability and consistency of the FiT depend on the durability of its supporting legislation. Full consumption of electricity production is the key prerequisite for realizing profitability. The long-term fixed-price electricity purchase contract is a virtual long-term PPA that can guarantee a stable revenue expectation and then lessen/share risks. Another shared-risk instrument is a variable premium system, including the United Kingdom's Contracts for Difference (CfDs) and the variable renewable premium in Germany, similar to FiTs in that they provide a standardized, long-term PPA for renewable energy (IEA, 2016). The long-term fixed-price electricity purchase contract would help rooftop PV projects weaken operation risk and then help cut down the loan threshold and interest rate, which is a strong incentive to deploy rooftop PV extensively in Beijing.
Furthermore, the pilots for DPV are exempted from policy cross-subsidies and transmission charges of the previous voltage level without being involved. In the policy context, the commercial DPV project in Beijing can be profitable without subsidies due to the high share of own-consumption or direct transaction with industrial and commercial consumers.
Conclusion and Policy Implications
The scope of this article is to estimate the deployment potential and economics of DPV in Beijing. The DEM identifies the roof area suitable for DPV installed in Beijing as 241 km2, so the deployment potential is estimated to be 11.47 GW according to the occupation standard of 21 m2/kW. Then, by employing the LCOE and project financial appraisal method, the rooftop PV can earn a profit under existing tariff and subsidy policy, except the 2 and 10 kW residential DPV projects. The reduction of initial investment cost and on-grid share both could improve the profitability of DPV. Moreover, if eliminating national subsidy but reserving local subsidy, the commercial rooftop PV still generates good returns, which reveals the feasibility of grid parity for large-scale DPV in Beijing.
Renewables are the rational choice to reconcile energy supply and environmental governance in Beijing. In the initial phase, DPV deployment in Beijing depends on the national and local preferential policies and financial incentives for promoting renewable energy, including FiT, tax breaks, on-grid priority, and pilot projects, etc. The favorable strength for DPV development in Beijing is to guarantee full-scale acquisition through the long-term fixed-price electricity purchase contract, which is in place to ensure stable market expectation and conducive to lowering the DPV project risks. Driven by policy stimulus and technology innovation, the rising profitability of DPV can motivate investors and even cause overheated investment without any guidance. DPV power generation project award list in Beijing and national DPV subsidy retreat can curb the excessive expansion momentum. Incidentally, excessive renewable subsidies will add to the public finance burden and drive up electricity prices. A sun-set mechanism in FiT and then integration with the market are the solution. Thus, in the development process, persistent adherence to progressive policies is crucial to readjust DPV deployment to rapidly evolving industrial landscape.
Aligned with ongoing power market reform, subsidy retreat indicates the upcoming grid parity of large-scale DPV. The pilots for nearby direct trading of DPV is gaining momentum without any subsidy in China. Meanwhile, to facilitate market-oriented transactions, the government issues a series of regulations involving reducing non-technical cost, equipping associated power network, and penalizing nonperformance. The non-technical cost dilemmas cover loan cost, land renting, and transmission-distribution price. From the perspective of policy innovation, China's new policies include implementing a long-term PPA system, reducing transmission-distribution fees, exempting cross-subsidies, and implementing green certificate schemes, as well as emphasizing and clarifying past policies such as classified subsidy system, full-scale guaranteed acquisition system, and priority scheduling scheme. It can be concluded that full interact with a market-driven and policy guarantee is crucial to achieving the benign development of DPV. Beijing's experience has a good reference for other cities to develop renewable energy.
Data Availability Statement
The datasets generated for this study are available on request to the corresponding author.
Author Contributions
XZ was responsible for the specific work of this paper. SF carried out some of the calculation work. HZ guided the work of this article. JY optimized the structure and tone of this article.
Conflict of Interest
The authors declare that the research was conducted in the absence of any commercial or financial relationships that could be construed as a potential conflict of interest.
Acknowledgments
The authors acknowledge the funding of the National Natural Science Foundation of China (71673085), the Fundamental Research Funds for the Central Universities (2018ZD14) and the 111 Project (B18021). The authors would also like to acknowledge great thanks to reviewers for their valuable comments which largely improve the academic quality of this article. The usual caveats apply.
Footnotes
1. ^http://guangfu.bjx.com.cn/news/20150401/604172.shtml
2. ^https://news.solarbe.com/201801/11/123171.html
3. ^https://www.sohu.com/a/158209384_752928
4. ^http://www.hebei.gov.cn/hebei/11937442/10761139/13897734/index.html
References
AirVisual (2018). World Air Quality Report 2018. Available online at: https://www.airvisual.com/world-most-polluted-cities
Allouhia, A., Saadanib, R., and Buker, M. S. (2019). Energetic, economic and environmental (3E) analyses and LCOE estimation of three technologies of PV grid-connected systems under different climates. Sol. Energy 178, 25–36. doi: 10.1016/j.solener.2018.11.060
Bansal, N. K., and Goel, S. (2000). Integration of photovoltaic technology in cafeteria building, at Indian Institute of Technology, New Delhi. Renew. Energy 19, 65–70. doi: 10.1016/S0960-1481(99)00017-8
Beijing Municipal Bureau of Statistics (2017). Beijing Statistical Yearbook. Beijing. Available online: http://tjj.beijing.gov.cn/nj/main/2017-tjnj/zk/indexch.htm [in Chinese].
Beijing Municipal Bureau of Statistics (2018). Beijing Statistical Yearbook. Beijing. Available online at: http://tjj.beijing.gov.cn/nj/main/2018-tjnj/zk/indexch.htm [in Chinese].
Beijing Municipal Commission of Development Reform (2013). How is 8% Decided as Reference Internal Return Rate? Available online at: http://fgw.beijing.gov.cn/zwxx/ztzl/wzz/zcjd/201512/t9769937.htm (Cited July 31, 2013) [in Chinese].
Branker, K., Pathak, M., and Pearce, J. M. (2011). A review of solar photovoltaic levelized cost of electricity. Renew. Sust. Energy Rev. 15, 4470–4482. doi: 10.1016/j.rser.2011.07.104
Buffat, R., Grassi, S., and Raubal, M. (2018). A scalable method for estimating rooftop solar irradiation potential over large regions. Appl. Energy 216, 389–401. doi: 10.1016/j.apenergy.2018.02.008
Bye, B., Fæhn, T., and Rosnes, O. (2018). Residential energy efficiency policies: costs, emissions and rebound effects. Energy 143, 191–201. doi: 10.1016/j.energy.2017.10.103
Chitra, A., and Himavathi, S. (2013). “Modeling and experimental validation of solar PV system for cascade H-bridge multilevel inverter,” in International Conference on Power (Dindigul: IEEE).
Congedo, P. M., Malvoni, M., Mele, M., and De Giorgi, M. G. (2013). Performance measurements of monocrystalline silicon PV modules in South-eastern Italy. Energy Convers. Manage. 68, 1–10. doi: 10.1016/j.enconman.2012.12.017
Dehwah, A. H. A., Asif, M., and Rahman, M. T. (2018). Prospects of PV application in unregulated building rooftops in developing countries: a perspective from Saudi Arabia. Energy Build. 171, 76–87. doi: 10.1016/j.enbuild.2018.04.001
Emziane, M., and Al Ali, M. (2015). Performance assessment of rooftop PV systems in Abu Dhabi. Energy Build. 108, 101–105. doi: 10.1016/j.enbuild.2015.08.057
ERI (2019). Report on New Energy Power Generation in China. Beijing: Energy Research Institute. [in Chinese]
Fu, J., and Quan, Y. (1996). Industrial Technology Economics. Beijing: Tsinghua University Press. [in Chinese]
Gooding, J., Crook, R., and Tomlin, A. S. (2015). Modelling of roof geometries from low-resolution lidar data for city-scale solar energy applications using a neighbouring buildings method. Appl. Energy 148, 93–104. doi: 10.1016/j.apenergy.2015.03.013
IEA (2016). Re-Powering Markets: Market Design and Regulation During the Transition to Low-Carbon Power Systems. Paris: International Energy Agency.
IEA Statistics (2018). Available online at: https://www.iea.org//statistics/
IRENA (2016). Accelerating Off-grid Renewable Energy. Abu Dhabi: International Renewable Energy Agency.
IRENA (2018). Renewable Power Generation Costs in 2017. International Renewable Energy Agency. Available online at www.irena.org/publications/2018/Jan/Renewable-powergeneration-costs-in-2017
IRENA (2019). Innovation Landscape for a Renewable-Powered Future: Solutions to Integrate Variable Renewables. Abu Dhabi: International Renewable Energy Agency.
Jacques, D. A., Gooding, J., Giesekam, J. J., Tomlin, A. S., and Crook, R. (2014). Methodology for the assessment of PV capacity over a city region using low-resolution lidar data and application to the city of Leeds (UK). Appl. Energy 124, 28–34. doi: 10.1016/j.apenergy.2014.02.076
Jones, C., and Gilbert, P. (2018). Determining the consequential life cycle greenhouse gas emissions of increased rooftop photovoltaic deployment. J. Clean. Prod. 184, 211–219. doi: 10.1016/j.jclepro.2018.02.140
Larsson, S., Fantazzini, D., Davidsson, S., Kullander, S., and Mikael, H. (2014). Reviewing electricity production cost assessments. Renew. Sust. Energy Rev. 30, 170–183. doi: 10.1016/j.rser.2013.09.028
Lau, K. Y., Muhamad, N. A., Arief, Y. Z., Tan, C. W., and Yatim, A. H. M. (2016). Grid-connected photovoltaic systems for Malaysian residential sector: effects of component costs, feed-in tariffs, and carbon taxes. Energy 102, 65–82. doi: 10.1016/j.energy.2016.02.064
Li, C., Zhou, D. Q., and Zheng, Y. (2018). Techno-economic comparative study of grid-connected PV power systems in five climate zones, China. Energy 165, 1352–1369. doi: 10.1016/j.energy.2018.10.062
Li, Y., and Liu, C. (2018). Revenue assessment and visualisation of photovoltaic projects on building envelopes. J. Clean. Prod. 182, 177–186. doi: 10.1016/j.jclepro.2018.01.128
Lingfors, D., Bright, J., Engerer, N., Ahlberg, J., Killinger, S., and Widén, J. (2017). Comparing the capability of low- and high-resolution LiDAR data with application to solar resource assessment, roof type classification and shading analysis. Appl. Energy 205, 1216–1230. doi: 10.1016/j.apenergy.2017.08.045
NDRC and NEA (2017). Opinions on Promoting the Supply Side Reform to Prevent and Solve Overcapacity in the Coal-fired Power Generation Industry. Beijing: NDRC, NEA. [in Chinese].
NEA (2013). The Interim Procedures on the Management of Distributed PV Generation. Available online at: http://zfxxgk.nea.gov.cn/auto87/201312/t20131211_1735.htm (Cited November 18, 2013) [in Chinese].
Radhi, H. (2010). Energy analysis of façade-integrated photovoltaic systems applied to UAE commercial buildings. Sol. Energy 84, 2009–2021. doi: 10.1016/j.solener.2010.10.002
Sadineni, S. B., Atallah, F., and Boehm, R. F. (2012). Impact of roof integrated PV orientation on the residential electricity peak demand. Appl. Energy 92, 204–210. doi: 10.1016/j.apenergy.2011.10.026
Science Academy and Geography Institute of Henan Province (2018). Study on the Scheme and Policy of Coal Consumption Cap in Henan Province of China. Zhengzhou: Science Academy and Geography Institute of Henan Province. [in Chinese]
Short, W., Packey, D., and Holt, T. (1995). A Manual for Economic Evaluation of Energy Efficiency and Renewable Energy Technologies. Golden, CO: National Renewable Energy Laboratory. doi: 10.2172/35391
Wang, M., Mao, X., Gao, Y., and He, F. (2018). Potential of carbon emission reduction and financial feasibility of urban rooftop photovoltaic power generation in Beijing. J. Clean. Prod. 203, 1119–1131. doi: 10.1016/j.jclepro.2018.08.350
Wiginton, L., Nguyen, H. T., and Pearce, J. M. (2010). Quantifying rooftop solar photovoltaic potential for regional renewable energy policy. Comput. Environ. Urban Syst. 34, 345–357. doi: 10.1016/j.compenvurbsys.2010.01.001
Yuan, J., Sun, S., Zhang, W., and Xiong, M. (2014). The economy of distributed PV in China. Energy 78, 939–949. doi: 10.1016/j.energy.2014.10.091
Zhao, C., Zhang, W., Wang, Y., Liu, Q., Guo, J., Xiong, M., et al. (2017). The economics of coal power generation in China. Energy Policy 105, 1–9. doi: 10.1016/j.enpol.2017.02.020
Appendix I
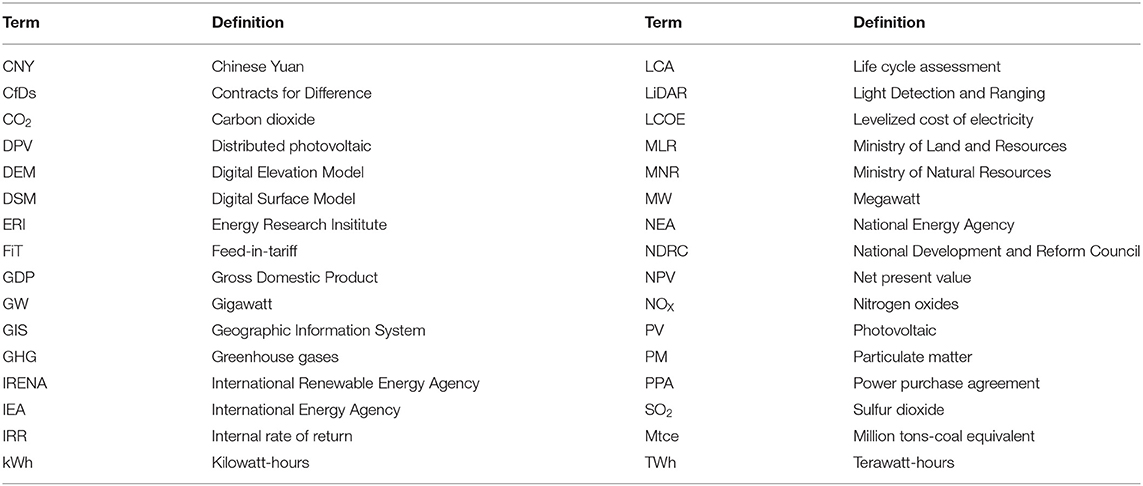
Glossary table.
Appendix II
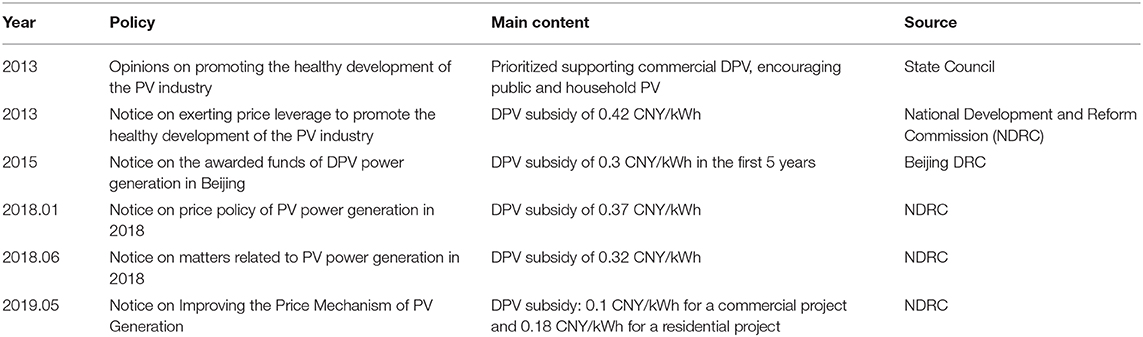
Supporting policies and governmental subsidies for DPV power.
Keywords: rooftop PV, deployment potential, economics, environmental value, Beijing
Citation: Zhang X, Feng S, Zhang H and Yuan J (2020) Developing Distributed PV in Beijing: Deployment Potential and Economics. Front. Energy Res. 7:155. doi: 10.3389/fenrg.2019.00155
Received: 20 August 2019; Accepted: 09 December 2019;
Published: 15 January 2020.
Edited by:
Farhad Taghizadeh-Hesary, Tokai University, JapanReviewed by:
Xiangyun Gao, China University of Geosciences, ChinaTiziana Susca, Italian National Agency for New Technologies, Energy and Sustainable Economic Development (ENEA), Italy
Copyright © 2020 Zhang, Feng, Zhang and Yuan. This is an open-access article distributed under the terms of the Creative Commons Attribution License (CC BY). The use, distribution or reproduction in other forums is permitted, provided the original author(s) and the copyright owner(s) are credited and that the original publication in this journal is cited, in accordance with accepted academic practice. No use, distribution or reproduction is permitted which does not comply with these terms.
*Correspondence: Haonan Zhang, z442192820@163.com