 Xinyang Wei
 Hongyi Che1
- 1School of Business, Macau University of Science and Technology, Taipa, Macau
- 2Centre for Applied Macroeconomic Analysis, The Australian National University, Canberra, ACT, Australia
- 3Institute of Energy, Environment, and Economy, Tsinghua University, Beijing, China
- 4Centre of Excellence in Population Ageing Research, University of New South Wales, Sydney, NSW, Australia
China's renewable energy industry has developed rapidly. However, due to China's current energy structure, coal plants still dominate the power generation, which poses a huge challenge to China's greenhouse gas reduction. On the other hand, this situation indicates that China's renewable industry still has great development potential and the sector can make a constructive contribution to China's response to climate change. However, in the process of developing the renewable sector, how to improve the profitability of enterprises and gradually lower the dependence on traditional energy is an important issue faced by corporate and government decision-makers. Therefore, from the perspective of capital structure, this paper aims to study its impact on the performance of renewable companies in China so that the society can achieve a “win-win” situation for enterprise development as well as environmental protection. By using pooled ordinary least squares and advanced panel data models, including fixed effects model and random effects model, the empirical results show that the relationship between capital structure and company performance is statistically significant in China's renewable industry. Specifically, the sustainable growth rate is significantly positively correlated with the total net profit margin, indicating that the sustainable growth model can be used to estimate the profitability of renewable companies in China.
Introduction
As the largest developing country in the world, China has made remarkable achievements in economic construction since the reform and opening up. However, economic growth, energy use, financial development and urbanization unfavorably resulted in environmental degradation and CO2 emissions (Rauf et al., 2018b). The choice of continuing to develop the economy at a high speed, or the need to take into account environmental protection and sustainable development has become a key issue for the Chinese government. In the middle and late period of the “Twelfth Five-Year Plan” (2011–2015), the Chinese economy began to move toward the “new normal,” and the economic structure continued to be optimized and upgraded from the extensive development to the new development centered on innovation and environmental friendliness (Hong, 2018).
As the current penetration of coal-fired power generation in China's electricity industry is still high, coal-fired power plants have exerted a lot of pressure on air pollution and greenhouse gas emission reduction. On the other hand, renewable energy such as hydroelectricity has a long-run impact on emissions reductions and environmental degradation (Solarin et al., 2017; Sharif et al., 2019). Therefore, the immediate task is to provide energy supply by promoting sustainable energy consumption (Rauf et al., 2018a). In this context, the development of the renewable sector is particularly important, and the Chinese government has introduced a series of industrial and supportive policies (Hsiao et al., 2019). Specifically, China has set targets to increase non-fossil fuel energy consumption to 15 and 20% by 2020 and 2030, respectively (NDRC, 2016a). By 2020, the installed capacity for the production of non-fossil energy will exceed 770 million kilowatts, an increase of 250 million kilowatts in comparison to the level in 2015. The share of non-fossil electricity generation will rise to 31% (NDRC, 2016b).
In the process of developing renewable energy, how to reduce production costs, improve the profitability of enterprises, gradually lower the dependence on traditional energy, and thus reduce the negative impact on the environment, is an important issue faced by corporate and government decision-makers. Therefore, from the perspective of the capital structure of the renewable energy industry in China, this paper aims to study its impact on the performance of renewable companies so that the society can achieve a “win-win” situation for enterprise development as well as environmental protection. This is of great significance to the future development of the renewable industry and the improvement of China's domestic natural environment.
Through the analysis of the capital structure of the renewable industry, this paper analyzes which factors have a significant impact on the performance of the enterprises of the renewable industry in China. This is important to improve the management level of renewable energy industry companies. At the same time, the research on the capital structure can also identify the risks that those companies may encounter in the future. This is also conducive to management's risk aversion strategy. By investigating listed companies from the renewable industry in China, this paper selects nine indicators in terms of capital structure and analyzes their impacts on companies' performance. By selecting the Return on assets (ROA) as the explained variable and using panel data models, we analyze the financial data of these enterprises during the 5-year period 2013–2017. Based on the empirical results, we find that capital structure of renewable companies in China has a significant impact on the companies' performance.
The remainder of this paper is organized as follows. In section Literature Review, we reviewed relevant literature and propose the hypotheses of this paper. In section Method and Data, we introduced the research methods of this paper. In section Results, we discussed the empirical results. In section Discussion, we summarize our research conclusions and key findings. Relevant policy recommendations are also proposed.
Literature Review
From the perspective of capital structure, there are many factors that affect corporate performance. One of the most important is the ownership structure. Shareholder governance is an important internal oversight mechanism where major shareholders can play an important role (Shleifer and Vishny, 1986). For large shareholders, the benefits of control are sufficient to make up for the costs incurred from the supervision of managers. Thus, large shareholders have incentives to supervise managers in order to promote corporate performance. Some studies have identified a positive correlation between equity concentration and company profitability (Claessens et al., 1999; Pedersen and Thomsen, 1999; Kapopoulos and Lazaretou, 2007). On the other hand, the check and balance of equity is an effective constraint on the largest shareholder or controlling shareholders, which can better protect the interests of external investors and minority shareholders (Shleifer and Vishny, 1986). In addition, the nature of equity has an impact on company performance. In the principal-agent theory, when the manager's shareholding ratio increases, the interests of managers and shareholders will gradually converge, resulting in a positive correlation between the manager's shareholding ratio and the company's operating performance (Jensen and Meckling, 1979). Based on a study of 988 private companies in the Czech Republic, researchers find that insider ownership is positively correlated with corporate value (Makhija and Spiro, 2000). In China, state-owned shares and overseas legal person shares are also found to have a weak positive correlation with the performance of commercial banks (Liu and Xu, 2018).
Secondly, the effectiveness of board governance is decisive for company performance and company sustainable development (Zhou and Li, 2010). Considering that a larger board needs more compromises to achieve consensus, the decisions of larger boards are often less extreme, resulting in less volatile corporate performance (Cheng, 2008). Researchers find that the profitability of the European banks is negatively associated with the size of the board of directors (Staikouras et al., 2007) and informative earnings are negatively related to the size of the board in New Zealand firms (Ahmed et al., 2006). Furthermore, some researchers find that board independence has a counter-effect on firm performance (Vo and Nguyen, 2014) and external independent directors do not lead to the improvement of company performance (Terjesen et al., 2016). Other scholars find that as the concentration of ownership decreases, the influence of board independence on corporate performance increases. However, this effect is different from the types of ownership. Results have shown that the board's effectiveness of privately-owned companies is statistically and economically significant, and the effects of state-owned companies are negligible, no matter whether they are controlled by state or local government (Li et al., 2015).
Third, some scholars have pointed out that working capital impacts both on liquidity and the company's performance. It is indicated that the liquidity ratio has a substantial effect on the ROA for petroleum and gas firms in Pakistan (Saleem and Rehman, 2011), and managers can reduce the cash conversion circle to a reasonable minimum level in order to generate positive value for shareholders (Raheman and Nasr, 2007). Besides, companies with expansion capabilities need to hold sufficient cash to reinvest, so that free cash flow becomes a predictor of the growth of enterprises (Scatizzi, 2009). Thus, there is a positive correlation between free cash flow and revenue growth which contributes to the profitability of the firm (Brush et al., 2000). This theory has been confirmed by empirical research in different countries and industries (Ravichandra and Mahendra, 2015; Ambreen and Aftab, 2016).
In addition, dividend policy may also have significant impacts on company performance. Research has shown that adequate payments of dividends are seen as a sign of firms' competitiveness in the future (Bhattacharya, 1979; Miller and Rock, 1985). Companies capable of generating increasing and stable profits can be regarded as a good sign linked to business results by investors, so that firm value will increase due to a positive response (Chen and Steiner, 2000; López-Iturriaga and Rodríguez-Sanz, 2001). In practice, researchers have found that stock prices rise when the cash dividend increases (Travlos et al., 2001; Akbar and Baig, 2010).
Furthermore, corporate growth also has a positive effect on corporate profitability. According to a survey of Korean SMEs' total asset growth rate (TAGR), researchers indicate that high growth in the previous period will facilitate profitability in the current period when the macroeconomy is relatively stable (Yoo and Kim, 2015). Moreover, the sustainable growth rate (SGR) offers a scientific tool that can help specify which elements in the financial structures that are more likely to stimulate profitability of a company (Harkleroad, 1993). Empirical results also show that sustainable growth rate has a significant and positive effect on return on asset (ROA) (Amouzesh et al., 2011; Hartono and Utami, 2016).
Companies prefer internal financing over costly external financing. Therefore, profitable companies generating high returns are less likely to utilize debt capital compared to a business with lower profitability (Myers and Majluf, 1984). This hypothesis has been evaluated with empirical analysis by several scholars. The findings suggest that profitability and debt asset ratios are significantly and negatively related (Kester, 1986) and there is a significant and negative relationship between profitability and leverage (Wald, 1999). Also, low debt levels are also seen in large profitable firms (Graham, 2000) and profitability is inversely related to debt level and company size (Booth et al., 2001). A researcher also finds that the ratio of long-term debt to total assets and Return on equity (ROE) are negatively correlated (Abor, 2005).
Based on literature analysis and review, we propose the following research hypotheses in this article: indicators to measure a company's financial liquidity, such as company cash flow (CCF), total cash recovery rate (TCR), cash reinvestment ratio (CRR) and current ratio (CR) are positively related to company's profitability, namely return on asset (ROA) in China's renewable industry. Furthermore, corporate growth indicators such as total asset growth rate (TAGR) and sustainable growth rate (SGR) also have positive effects on corporate performance. In addition, dividend payment ratio (DPR) and assets and liabilities rate (ALR) can also impose positive impacts on the company's earning capabilities.
In the existing literature, most of the literature on company performance is concentrated in sectors such as commercial banks, electricity, real estate, etc. Relevant literature on the research of the relationship between capital structure and company performance in renewable energy industry of China is relatively sparse. As a key sector in China's 13th 5-Year Plan (2016–2020), the future development of renewable energy is important. Therefore, the contributions of this paper are summarized in the following aspects: Firstly, in terms of the selection of research fields, this paper takes the renewable energy sector in China as the research object and studies the impact of its capital structure on company performance. Thus, this paper expands and enriches the research in the field of corporate governance to a new sector and tries to test whether the corporate governance theories can be applied to China's renewable industry. Secondly, this paper specifically selects the sustainable growth rate as the core explanatory variable to study its impact on company performance. Finally, this paper selects data from recent years for research, which reflects the characteristics of the current development of the renewable energy industry in China.
Method and Data
This paper selects 117 renewable listed companies in China as research samples. These companies include all the Chinese renewable energy listed companies in the RESSET financial research database 1, and the research period is 2013–2017. Within this period, China's renewable energy industry has made great progress, and the data can reflect the relevant characteristics of the industry changes, thus providing a reference for the future development of the entire industry. The following is a table that defines the variables analyzed in this paper. ROA is the explained variable and the rest are explanatory variables.
Since the data structure is panel data, we use pooled Ordinary Least Squares (OLS) and advanced panel data methods in order to identify the relationships between the capital structure and corporate performance in the renewable industry in China. In the pooled OLS model, we assume there is no unobserved heterogeneity across companies so that the model specifies a constant coefficient α for each company. This model increases the sample size as compared to the cross-section models and it allows us to obtain more precise estimators and more efficient test statistics (Wooldridge, 2016). This is the usual assumption for cross-sectional analysis:
where is the explanatory variable matrix and the subscript it means the ith company in the period of t. β is the coefficient vector of explanatory variables, mainly reflecting the degree of influence of changes in each explanatory variable on company performance. If the value of β is positive, it indicates that the variable has a positive correlation with the company's ROA, that is, the factor will promote the company's performance; otherwise, the company's performance will decline. uit is the disturbance error term.
In order to avoid heterogeneity bias and obtain more efficient estimators, this paper also adopts the advanced panel data methods, namely fixed effects model and random effects model (Wooldridge, 2016). We assume that there is unobserved heterogeneity across companies captured by αi. The main issue is whether the individual-specific effect αi is correlated with the explanatory variables. If they are correlated, then the fixed effects model is preferred. If they are not correlated, then the random effects model is preferred. The fixed effects model is given below:
We include αi as intercepts and each company has a different intercept term due to the individual-specific effect. The random effects model assumes that the individual-specific effects αi is not correlated with the explanatory variables. Thus, we can include αi in the error term:
Each company has the same slope parameters and a composite error term εit = αi + uit. The panel data models can be estimated with several estimators.
After the regression of these models, we use the F-test to identify whether there are fixed effects and the fixed effects model is superior to the pooled OLS model. Also, we use the Breusch-Pagan Lagrange multiplier test to identify whether there are random effects and the random effects model is superior to the pooled OLS model. Finally, we use the Hausman Test to identify which model is preferred between the fixed and random effects models. Hausman Test tests whether there exists a significant difference between the fixed effects and random effects estimators. The Hausman Test statistic can be calculated as below:
It follows a chi-square distribution with degrees of freedom equal to the number of parameters for the time-varying explanatory variables. The null hypothesis in this test is that the difference in coefficients is not systematic for fixed and random models. This means that the individual-specific effect αi is not correlated with the explanatory variables and both models' coefficients are consistent. If the null hypothesis is not rejected, then the random effects model is more efficient. However, if the null hypothesis is rejected, then it indicates that αi is correlated with the explanatory variables and the coefficients from the random effects model is inconsistent. Hence, the fixed effects model is preferred. Table 1 shows the Variable definition and description.
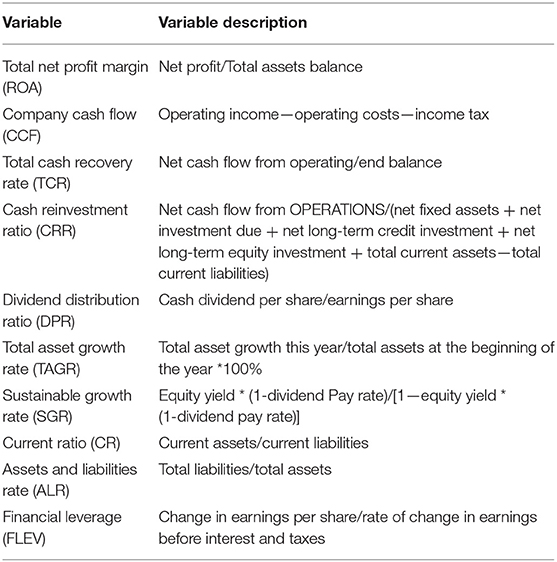
Table 1. Variable definition and description.
Results
Development Status of China's New Energy Industry
During the “Twelfth Five-Year Plan” period, China's renewable energy industry began to develop on a comprehensive scale, and the role of renewable energy in promoting energy structure adjustment has been continuously enhanced (NDRC, 2016a). Table 2 and Figure 1 shows the changes in the total amount of renewable generation in China from 2013 to 2017. The annual energy generation of renewable energy represented by hydropower increased continuously, and the growth of power generation by conventional energy such as thermal power has slowed down significantly. The total annual renewable energy generation in 2017, which was 16,131 million kWh, increased by 55% compared to the 2013 level, which was 10,388 million kWh.
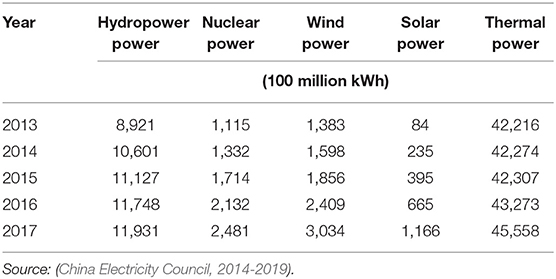
Table 2. China's Annual Power Generation Data 2013–2017.
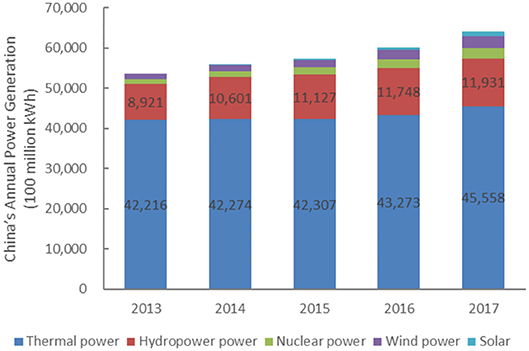
Figure 1. China's Annual Power Generation Data 2013–2017.
As can be seen from Table 3 and Figure 2, the installed capacity of renewable energy power generation in China from 2013 to 2017 continues to expand. By the end of 2017, China's renewable energy power generation capacity reached 636 million kilowatts; of which, hydropower installed capacity of 344 million kilowatts, wind power installed capacity of 163 million kilowatts, photovoltaic power generation installed capacity of 129 million kilowatts, biomass power generation installed 14.88 million kilowatts. The year-on-year growth rates were 3.5, 10.7, 69.6, and 22.6%, respectively (National Energy Administration, 2018).
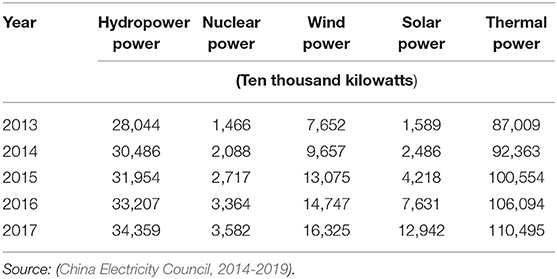
Table 3. China's Annual Power Generation Capacity Data 2013–2017.
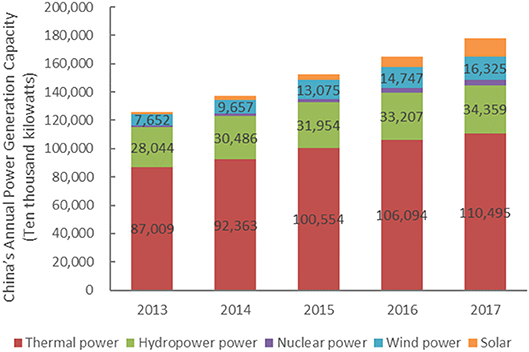
Figure 2. China's Annual Power Generation Capacity Data 2013–2017.
The annual newly installed capacity of hydropower and wind power has remained stable overall, while the newly installed capacity of solar energy has increased significantly, from 1,243 10,000 kw in 2013 to 5,341 10,000 kw in 2017 (Table 4).
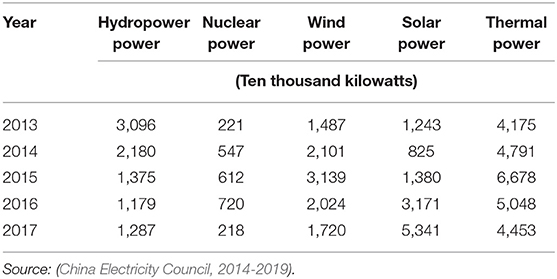
Table 4. China's Annual New Installed Power Generation Capacity Data 2013–2017.
Descriptive Statistical Analysis
Descriptive statistical analysis of the data is conducted, including the mean, maximum, minimum and standard deviation of the explained and explanatory variables. The specific information is as follows shown in Table 5:
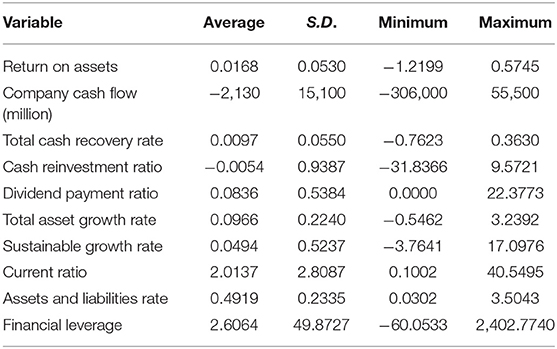
Table 5. Descriptive statistical analysis.
Descriptive statistics were derived from 2,340 sample data. From the table above we can draw the following conclusions: the maximum value of the ROA which representing the company's performance is about 0.57, the minimum value is about −1.22, and the range is about 1.277, indicating that the variation of ROA of the selected samples is small. Among the nine explanatory variables, the average value of the financial leverage factor is about 2.6, indicating that the average debt ratio of the renewable energy industry in China is reasonable, and the entire industry will not be in crisis due to the financial risk caused by high debt ratio. The standard deviation of the seven indicators, such as sustainable growth rate and total cash recovery rate, is <1, indicating that the data fluctuations are not large. The average industry current ratio is 2.01, indicating that the average capital liquidity of China's renewable energy listed companies is good, the companies do not have capital flow problems, and the companies' short-term solvency is strong.
The data is then tested for correlation for preliminary analysis and the results are shown in Table 6. The company's cash flow and financial leverage are weakly related to ROA. Total asset growth rate, sustainable growth rate and total cash recovery are positively correlated with ROA. The asset-liability ratio has a significant negative correlation with ROA, and the cash reinvestment ratio, dividend distribution ratio, and current ratio are weakly correlated with ROA. These results can also be seen from the scatter plots of the ROA against explanatory variables, which are shown in Figure 3.

Table 6. Correlation coefficients.
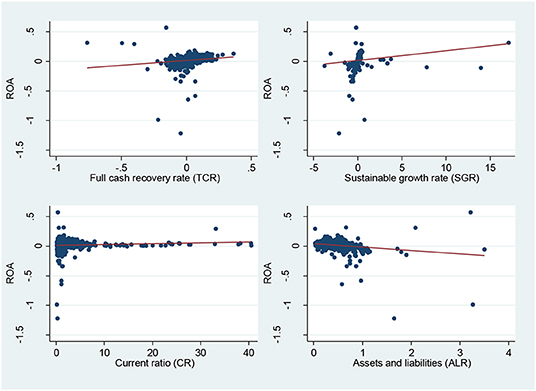
Figure 3. Scatter plots of ROA against explanatory variables TCR, SGR, CR, and ALR.
Regression Results
Pooled OLS and fixed effect model analyses were performed and the results are shown in Table 7. According to the F-test results with the null hypothesis that all the αi is zero, unobserved individual-specific characteristics do exist. Therefore, the fixed effect model is superior to pooled OLS. According to the results of the fixed effect model, it can be found that the p-values of the cash reinvestment ratio and the dividend distribution rate are 0.975 and 0.127, respectively. So, there is no significant correlation between the cash reinvestment ratio, the dividend distribution ratio and the ROA in China's renewable industry. The p-value of company's cash flow is 0.038, so company's cash flow is significantly positively correlated with the total net profit margin at a 5% significance level. The coefficient of financial leverage factor is −0.001 with a very small p-value. Therefore, financial leverage is significantly negatively correlated with the total asset net profit margin. The p-values of the remaining explanatory variables are all <0.01, representing that they are strongly positively correlated with ROA. By observing the coefficient of each variable, we can find that the asset-liability ratio's coefficient value is 0.078, which indicates that when the asset-liability ratio increases by 1%, the total asset net profit rate will increase by 0.078%. This presents that when the company has more funds from debt and fewer funds from assets, the net profit margin of total assets will present an increasing trend. The coefficient of financial leverage factor is negative, indicating that the increase in the financial leverage factor will result in a decrease in the net profit margin of total assets. According to the results from (Kang, 2015), when the financial leverage coefficient is maintained between 0 and 2, the company's total net profit margin can reach an optimal level. In the previous descriptive statistics of this paper, the average financial leverage is 2.6, which is higher than 2. In this case, financial leverage presents a negative effect on the net profit margin of the total assets of renewable energy companies in China. Besides, the coefficient of sustainable growth rate is 0.022, which indicates that when it increases by a percentage, the net profit margin of total assets will also increase by 0.022%.
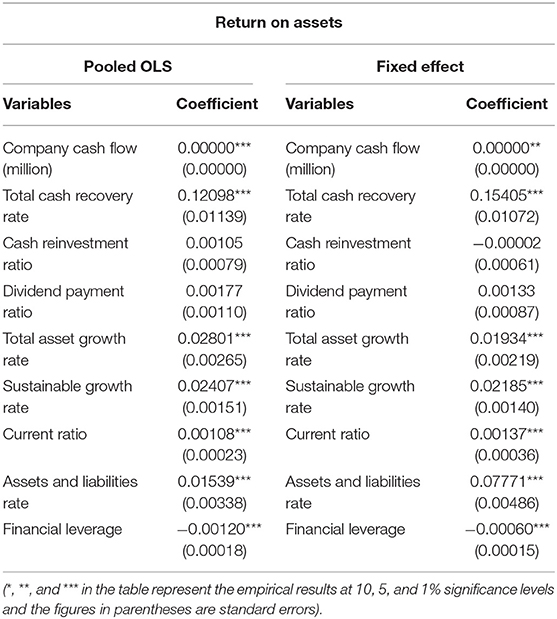
Table 7. Pooled OLS and fixed effect model empirical results.
Table 8 shows the empirical results of the pooled OLS and random effects models. Based on the Breusch-Pagan Lagrange multiplier test, which helps us decide between a random effects regression and the pooled OLS, we reject the null hypothesis that no significant difference across companies. Therefore, random effects model is more appropriate. According to the results of the random effect model, the financial leverage coefficient is <0 and still has a negative correlation with ROA, and the financial leverage standard error is 0.00071, indicating that the result is significant. In addition, we can find that the p-values of cash reinvestment ratio and dividend distribution rate are 0.778 and 0.115, respectively, both are >0.1. So, no significant correlations are identified between the two variables and ROA. This result is the same as the fixed effect model. The p-value of the company's cash flow is 0.024, <0.05 and thus it has a significant positive correlation with ROA. The rest of the variables are all positively correlated with ROA. Finally, in order to determine whether the fixed effects or random effects model is more suitable for the sample data selected, the Hausman test is performed with the hypotheses “H0:μi is not related to the explanatory variables; H1:μi is significantly related to explanatory variables. According to the Hausmann test result, the p-value is 0, then the null hypothesis should be rejected. So, the fixed-effects model is preferred.
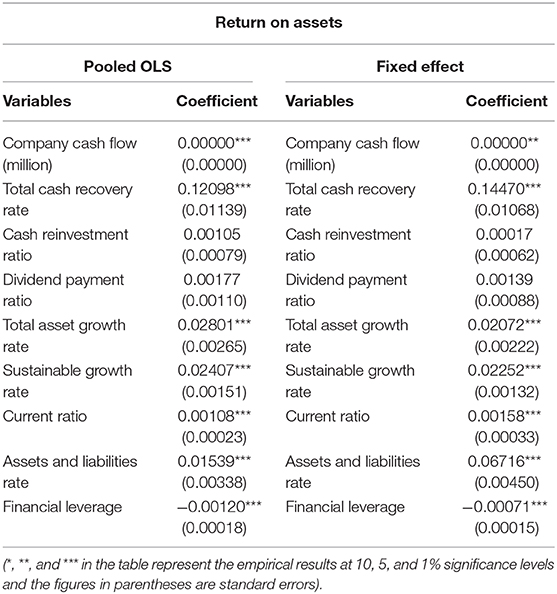
Table 8. Pooled OLS and random effects model empirical results.
Discussion
Through the above empirical analysis, we have the following discussions: At first, working capital significantly impacts a company's performance in China's renewable industry. Company cash flow, total cash recovery rate and current ratio of renewable energy companies are positively related to corporate profitability. It is indicated that companies with stronger liquidation ability and short-term solvency will also have better performance. This is consistent with the hypothesis proposed in this paper: companies with expansion capabilities need to retain sufficient cash to reinvest so that cash flow is a measure of the growth of enterprises (Scatizzi, 2009). The results have also been confirmed by other empirical research in different countries and industries (Ravichandra and Mahendra, 2015; Ambreen and Aftab, 2016). Specifically, the liquidity ratio has a substantial effect on the ROA for petroleum and gas firms in Pakistan (Saleem and Rehman, 2011).
Second, both the growth rate of total assets and sustainable growth rates have significantly positive impacts on corporate performance. From the empirical results, the total asset growth rate is significantly positively correlated with ROA regardless of the fixed or random effects model. In fact, the higher total asset growth rate is associated with stronger the company's capital accumulation capacity and more capital the company can use for future development. This ensures the company's future profitability and ability to develop in the future. This is consistent with the hypothesis of this paper. According to previous research, the sustainable growth rate offers a scientific tool and can be used to estimate the company's profitability (Harkleroad, 1993; Yuan, 2003). The results of this paper can also be supported by other empirical research which indicates when sustainable growth rate is high, the company has strong profitability (Amouzesh et al., 2011; Hartono and Utami, 2016).
However, among these factors, only financial leverage is significantly negatively correlated with the performance of renewable energy companies. This indicates that the higher financial leverage is associated with lower company performance in China's renewable energy industry. Again, this is in line with the research hypothesis of this paper. This result also corresponds to the theory that profitable companies are less likely to take debt financing considering the high-cost external financing (Myers and Majluf, 1984). Other empirical research also obtains similar results and there is a significant and negative relationship between profitability and leverage (Kester, 1986; Graham, 2000; Booth et al., 2001; Abor, 2005).
In addition, the relationship between dividend payment ratio and company performance is not significant in China's renewable industry. This means the dividend payment policy has no predictive effect on the profitability of China's new energy companies. On the other hand, the asset and liability ratio is an important factor affecting the performance of renewable energy companies in China. According to the research results of Liu (2015), the asset-liability ratio has different effects at different stages of the company's development: it is negatively correlated with the company's performance during the growth period and the recession period, and positively correlated with the company's performance during the maturity period. The results of this paper confirm that the development of China's renewable energy companies has entered a mature stage. So it is necessary to formulate a reasonable development strategy to ensure the future development of the company.
Conclusion
By taking China's renewable energy sector as the research object, this paper selects a total of 117 companies from 2013 to 2017 to study the impact of capital structure on company performance. We use the total net profit margin (ROA) as an indicator to measure the company's performance. We use 9 explanatory variables, such as the company's cash flow, as the measures of the capital structure. Pooled OLS and panel data models, including fixed effects model and random effects model, are used in the analysis. This paper expands and enriches the research in the field of corporate governance to a new sector and it proves that the corporate governance theories can be applied to China's renewable industry. The limitation of this paper is that it does not include factors such as ownership structure and board governance, which may also impact company's performance, due to data availability. However, this may become a possible research area in the future.
The empirical results show the following conclusions: First, the financial leverage is significantly negatively correlated with the total asset net profit rate, indicating that higher financial leverage is associate with lower company performance in China's renewable energy industry. Second, the sustainable growth rate is significantly positively correlated with the total net profit margin, indicating that the sustainable growth model can be used to estimate the profitability of renewable companies. When the sustainable growth rate is high, the company is more likely to have strong profitability. Third, the asset-liability ratio is positively correlated with the performance of China's renewable energy enterprises. Based on the results of this paper, the development of China's renewable energy companies has entered a mature stage, so it is necessary to formulate a long-term and effective development strategy to ensure the future development of the industry. Fourth, similar to other industries, the renewable energy companies' liquidity ratio and profitability are also positively correlated. Finally, the total asset growth rate is significantly positively correlated with the total asset net profit rate, indicating that the renewable energy company's total asset growth rate is greater, the company will generate more earnings per share.
Based on the above empirical results, this paper puts forward the following suggestions, hoping to help the development of renewable energy companies: First, China's renewable energy listed companies need to pay attention to the company's cash flow. At the same time of increasing revenue and reducing expenditure, the company should speed up capital turnover, improve the efficiency of capital use, and maximize the value of the company. Second, relevant renewable energy companies should pay attention to changes in the company's sustainable growth rate. In order to effectively maintain the company's sustainable growth rate, it is necessary to ensure that the company's financial situation is in a good position. Reasonable arrangements for the implementation of debt projects and the need to reduce capital costs are also important. Companies may choose to issue equity capital such as stocks to ensure the sustainable growth of corporate capital.
At present, the Chinese government adopts a financial subsidy policy to support the rapid development of the renewable energy industry. In a short period of time, this approach can promote rapid expansion of the entire industry. But in the long run, it will lead to excessive dependence on government subsidies for corporate performance, which is not sufficient for the sustainable development of enterprises. In terms of energy subsidy policies, the government should provide subsidies based on the actual conditions of the development of renewable industries and the status quo of national economic development. Since most of the subsidies come from electricity and other expenses, it is possible to use some special tax sources, such as the newly introduced environmental tax and the fiscal revenue from the carbon allowance allocation in the newly built national emissions trading scheme.
Although China's renewable energy industry is developing rapidly, the laws and regulations of the entire industry still need to be built and improved over a long period of time. As early as 2012, the State Council promulgated China's renewable energy policies. It stated that China's future energy construction needs to consider a way of high technology, low energy consumption, less pollution, high efficiency, thus achieving the goal of cost-effective, clean and secure development. This requires renewable energy companies to continuously innovate energy technologies, strengthen the research and application of energy technologies, and continuously improve the energy technology innovation system. At the same time, it is also necessary for the government to improve the construction of the electricity market, and gradually introduce the market mechanism of the power generation to reflect the advantages of renewable energy. This approach can encourage enterprises to carry out technological innovation by market incentives and realize the long-term and sustainable development of the industry. Relevant departments should also reform the administration of the renewable energy industry, reduce government intervention and introduce competitiveness to the strategic planning of energy development.
Data Availability Statement
Publicly available datasets were analyzed in this study. This data can be found here: http://www.resset.cn/.
Author Contributions
XW supervised the project. HC performed analysis. XW and HC wrote the manuscript. NS, CH, and QT contributed to the investigation and resources. GY contributed to the methodology.
Funding
This study was supported by the Ministry of Science and Technology of China (Grant No. 2018YFC1509006), the National Natural Science Foundation of China (Grant No. 71874096), the Macau SAR Government Higher Education Fund, and the Macau University of Science and Technology (Grant No. FRG-19-007-MSB and FRG-19-008-MSB).
Conflict of Interest
The authors declare that the research was conducted in the absence of any commercial or financial relationships that could be construed as a potential conflict of interest.
Footnote
1. ^RESSET financial research database is mainly used by universities, financial research institutions, and research departments of financial enterprises to provide support for empirical research and model testing. The RESSET database is the one of the professional databases in China that are in line with the world's leading standards and it is established with the participation of experts from Tsinghua University, Peking University, and London School of Economics and Political Science.
References
Abor, J. (2005). The effect of capital structure on profitability: an empirical analysis of listed firms in Ghana. J. Risk Finance 6, 438–445. doi: 10.1108/15265940510633505
Ahmed, K., Hossain, M., and Adams, M. B. (2006). The effects of board composition and board size on the informativeness of annual accounting earnings. Corp. Govern. 14, 418–431. doi: 10.1111/j.1467-8683.2006.00515.x
Akbar, M., and Baig, H. H. (2010). Reaction of stock prices to dividend announcements and market efficiency in Pakistan. Lah. J. Econ. 15, 103–125. doi: 10.35536/lje.2010.v15.i1.a5
Ambreen, S., and Aftab, J. (2016). Impact of free cash flow on profitability of firms listed in karachi stock exchange. Euro-Asian J. Econ. Finance 4, 113–122.
Amouzesh, N., Moeinfar, Z., and Mousavi, Z. (2011). Sustainable growth rate and firm performance: evidence from Iran stock exchange. Int. J. Business Soc. Sci. 2, 249–255.
Bhattacharya, S. (1979). Imperfect information, dividend policy, and “the bird in the hand” fallacy. Bell J. Econ. 259–270. doi: 10.2307/3003330
Booth, L., Aivazian, V., Demirguc-Kunt, A. E., and Maksimovic, V. (2001). Capital structure in developing countries. J. Finance 56, 87-130. doi: 10.1111/0022-1082.00320
Brush, T. H., Bromiley, P., and Hendrickx, M. (2000). The free cash flow hypothesis for sales growth and firm performance. Strat. Manage. J. 21, 455–472.
Chen, C. R., and Steiner, T. L. (2000). Tobin's q, managerial ownership, and analyst coverage: a nonlinear simultaneous equations model. J. Econ. Business 52, 365–382. doi: 10.1016/S0148-6195(00)00024-2
Cheng, S. (2008). Board size and the variability of corporate performance. J. Financial Econ. 87, 157–176. doi: 10.1016/j.jfineco.2006.10.006
China Electricity Council. (2014-2019). Power Statistics Basic Data List 2014-2018. In Chinese. Available online at: http://www.cec.org.cn/guihuayutongji/tongjxinxi/ (accessed August 07, 2019).
Claessens, S., Djankov, S., and Lang, L. H. (1999). Who Controls East Asian Corporations - and the Implications for Legal Reform. Washington, DC: World Bank. doi: 10.1596/0-8213-4631-8
Graham, J. R. (2000). How big are the tax benefits of debt? J. Finance 55, 1901–1941. doi: 10.1111/0022-1082.00277
Harkleroad, D. (1993). Sustainable growth rate analysis: evaluating worldwide competitors' ability to grow profitably. Compet. Intell. Rev. 4, 36–45. doi: 10.1002/cir.3880040209
Hartono, G. C., and Utami, S. R. (2016). The comparison of sustainable growth rate, firm's performance and value among the firms in Sri Kehati index and IDX30 index in Indonesia stock exchange. Int. J. Adv. Res. Manage. Soc. Sci. 5, 68–81.
Hong, Y. (2018). The major innovations of Chinese economic development theories in the new era. China Political Economy 1, 13–29. doi: 10.1108/CPE-09-2018-006
Hsiao, C. Y. L., Lin, W., Wei, X., Yan, G., Li, S., and Sheng, N. (2019). The impact of international oil prices on the stock price fluctuations of China's renewable energy enterprises. Energies 12:4630. doi: 10.3390/en12244630
Jensen, M. C., and Meckling, W. H. (1979). Theory of the firm: managerial behavior, agency costs, and ownership structure. Econ. Soc. Inst. 1, 163–231. doi: 10.1007/978-94-009-9257-3_8
Kang, J. (2015). Research on the financial leverage effect of listed companies on the GEM. Financial Court 9, 170–173.
Kapopoulos, P., and Lazaretou, S. (2007). Corporate ownership structure and firm performance: evidence from Greek firms. Corp. Govern. 15, 144–158. doi: 10.1111/j.1467-8683.2007.00551.x
Kester, W. C. (1986). Capital and ownership structure: a comparison of United States and Japanese manufacturing corporations. Financ. Manage. 15, 5–16. doi: 10.2307/3665273
Li, K., Lu, L., Mittoo, U. R., and Zhang, Z. (2015). Board independence, ownership concentration and corporate performance-Chinese evidence. Int. Rev. Financ. Anal. 41, 162–175. doi: 10.1016/j.irfa.2015.05.024
Liu, W., and Xu, M. (2018). Empirical research on the relationship between ownership structure and management performance of China's listed commercial banks. J. Qingdao Univ. Sci. Technol. 34, 43–48. doi: 10.16800/j.cnki.jqustss.2018.01.008
Liu, Y. (2015). Research on life cycle, capital structure and company performance - taking private listed companies in China as a sample. Brand 11, 238–239.
López-Iturriaga, F. J., and Rodríguez-Sanz, J. A. (2001). Ownership structure, corporate value and firm investment: a simultaneous equations analysis of Spanish companies. J. Manage. Govern. 5, 179–204. doi: 10.1023/A:1013078225905
Makhija, A. K., and Spiro, M. (2000). Ownership structure as a determinant of firm value: evidence from newly privatized Czech firms. Financ. Rev. 35, 1–31. doi: 10.1111/j.1540-6288.2000.tb01419.x
Miller, M. H., and Rock, K. (1985). Dividend policy under asymmetric information. J. Finance 40, 1031–1051. doi: 10.1111/j.1540-6261.1985.tb02362.x
Myers, S. C., and Majluf, N. S. (1984). Corporate financing and investment decisions when firms have information that investors do not have. J. Financ. Econ. 13, 187–221. doi: 10.1016/0304-405X(84)90023-0
National Energy Administration (2018). Introduction to the Operation of Renewable Energy Grid Connection in 2017. In Chinese. Available online at: http://www.gov.cn/xinwen/2018-01/24/content_5260072.~htm,#1 (accessed August 07, 2019).
NDRC China. (2016a). 13th FYP Development Plan for Renewable Energy. Available online at: http://www.ndrc.gov.cn/zcfb/zcfbghwb/201612/W020161216661816762488.pdf (accessed August 07, 2019).
NDRC China. (2016b). 13th Electricity Development Five-Year Plan. Available online at: http://www.ndrc.gov.cn/zcfb/zcfbghwb/201612/P020161222570036010274.pdf (accessed August 07, 2019).
Pedersen, T., and Thomsen, S. (1999). Economic and systemic explanations of ownership concentration among Europe's largest companies. Int. J. Econ. Business 6, 367–381. doi: 10.1080/13571519984133
Raheman, A., and Nasr, M. (2007). Working capital management and profitability–case of Pakistani firms. Int. Rev. Business Res. Pap. 3, 279–300.
Rauf, A., Liu, X., Amin, W., Ozturk, I., Rehman, O. U., and Hafeez, M. (2018a). Testing EKC hypothesis with energy and sustainable development challenges: a fresh evidence from belt and road initiative economies. Environ. Sci. Pollut. Res. 25, 32066–32080. doi: 10.1007/s11356-018-3052-5
Rauf, A., Liu, X., Amin, W., Ozturk, I., Rehman, O. U., and Sarwar, S. (2018b). Energy and ecological sustainability: challenges and panoramas in belt and road initiative countries. Sustainability 10:2743. doi: 10.3390/su10082743
Ravichandra, T., and Mahendra, G. (2015). Analysis of relationship between profitability and free cash flow to firms. Int. J. Manage. Soc. Sci. 3, 175–183.
Saleem, Q., and Rehman, R. U. (2011). Impacts of liquidity ratios on profitability. Interdisc. J. Res. Business 1, 95–98.
Sharif, A., Raza, S. A., Ozturk, I., and Afshan, S. (2019). The dynamic relationship of renewable and nonrenewable energy consumption with carbon emission: a global study with the application of heterogeneous panel estimations. Renew. Energy 133, 685–691. doi: 10.1016/j.renene.2018.10.052
Shleifer, A., and Vishny, R. W. (1986). Large shareholders and corporate control. J. Pol. Econ. 94, 461–488. doi: 10.1086/261385
Solarin, S. A., Al-Mulali, U., and Ozturk, I. (2017). Validating the environmental kuznets curve hypothesis in India and China: the role of hydroelectricity consumption. Renew. Sustain. Energy Rev. 80, 1578–1587. doi: 10.1016/j.rser.2017.07.028
Staikouras, P. K., Staikouras, C. K., and Agoraki, M. E. K. (2007). The effect of board size and composition on European bank performance. Eur. J. Law Econ. 23, 1–27. doi: 10.1007/s10657-007-9001-2
Terjesen, S., Couto, E. B., and Francisco, P. M. (2016). Does the presence of independent and female directors impact firm performance? A multi-country study of board diversity. J. Manage. Govern. 20, 447–483. doi: 10.1007/s10997-014-9307-8
Travlos, N. G., Trigeorgis, L., and Vafeas, N. (2001). Shareholder wealth effects of dividend policy changes in an emerging stock market: the case of Cyprus. Multinat. Finance J. 5, 87–112. doi: 10.17578/5-2-1
Vo, D. H., and Nguyen, T. M. (2014). The impact of corporate governance on firm performance: empirical study in vietnam. Int. J. Econ. Finance 6, 1–13. doi: 10.5539/ijef.v6n6p1
Wald, J. K. (1999). How firm characteristics affect capital structure: an international comparison. J. Financ. Res. 22, 161–187. doi: 10.1111/j.1475-6803.1999.tb00721.x
Wooldridge, J. M. (2016). Introductory Econometrics: A Modern Approach. Boston, MA: Nelson Education.
Yoo, S., and Kim, J. (2015). The dynamic relationship between growth and profitability under long-term recession: the case of Korean construction companies. Sustainability 7, 15982–15998. doi: 10.3390/su71215796
Keywords: capital structure, company performance, sustainable growth rate, renewable energy, China
Citation: Wei X, Che H, Sheng N, Hsiao CY-L, Tong Q and Yan G (2020) Research on the Development Status of China's Renewable Energy Industry - The Impact of Capital Structure on Company Performance. Front. Energy Res. 8:71. doi: 10.3389/fenrg.2020.00071
Received: 26 August 2019; Accepted: 09 April 2020;
Published: 30 April 2020.
Edited by:
Joni Jupesta, SMART Research Institute (SMARTRI), IndonesiaReviewed by:
Stanislav Martinat, Cardiff University, United KingdomIlhan Ozturk, Çağ University, Turkey
Copyright © 2020 Wei, Che, Sheng, Hsiao, Tong and Yan. This is an open-access article distributed under the terms of the Creative Commons Attribution License (CC BY). The use, distribution or reproduction in other forums is permitted, provided the original author(s) and the copyright owner(s) are credited and that the original publication in this journal is cited, in accordance with accepted academic practice. No use, distribution or reproduction is permitted which does not comply with these terms.
*Correspondence: Qing Tong, dG9uZ3FpbmdAdHNpbmdodWEub3JnLmNu