Effect of an Electric Vehicle Promotion Policy on China’s Islands: A Case Study of Hainan Island
 Xu Xiao
 Ziyue Chen
 Chan Wang
 Pu-yan Nie
- 1Institute of Guangdong Economy and Social Development, School of Finance, Guangdong University of Finance and Economics (GDUFE), Guangzhou, China
- 2Department of Manufacturing and Civil Engineering, NTNU, Norwegian University of Science and Technology, Trondheim, Norway
Despite the abundant clean energy resources on islands, energy supply on the islands in many countries and regions still depends on high-voltage power grids in neighboring continents and high-cost fossil energy such as oil. In China, increasing demand for private gasoline vehicles calls for an abundant gasoline supply, which is harmful to the renewable energy transformation on Chinese islands. The promotion of electric vehicles (EVs) offers a potential solution. However, on large islands with large populations, insufficient electricity supply restricts residents’ behavior, which has led to difficulties in promoting clean energy vehicles. To solve this problem, in 2019, the government formulated an 11-year plan to comprehensively promote clean energy vehicles from the energy supply side and user demand side to transform Hainan Island into a clean energy island. However, some predictions in the report are doubtful. As a result, this study takes Hainan Island in China as an example. Based on data on energy and EVs, the greenhouse gas emissions and electricity demand of the transportation industry in Hainan Island under policy and non-policy scenarios are calculated using a generation substitution accounting model. Based on the results, this study evaluates the expected effect of Hainan Province’s 11-year plan to develop clean energy vehicles and compares the results with those in the report. Policy implications based on the results are also proposed. This study combines the island’s energy structure with the application of EVs and expands the evaluation of government policies on the impact of large-scale energy transformation from the perspective of the energy supply chain. It also provides a reference for energy transformation on other large islands.
Introduction
Traditional gasoline vehicles are one of the main sources of greenhouse gas emissions. Hence, because of their feature of zero emissions, electric vehicles (EVs) have the potential to reduce greenhouse gas emissions in the transport sector (Kawamoto et al., 2019; Qiao et al., 2019b). However, it is controversial whether the promotion of EVs is effective on islands. Although having zero emissions reduces greenhouse gas emissions, the source of electricity used by EVs and their energy efficiency have led to some negative views. For instance, the promotion of EVs could transform pollutants (McKenzie, 2015; Nichols et al., 2015; Michaelides, 2020). Moreover, owing to the current main power supply and limited fossil fuel–based or renewable energy on islands, the use of large numbers of EVs in the short term could limit their energy supply. To solve this supply problem, more fossil energy or power generation with low efficiency would be used (Sioshansi et al., 2010). This would damage the island’s environment to a certain extent, which is the opposite of the goal of promoting EVs.
As a result, many countries have started to research clean energy and sustainable improvements on islands. In China, Hainan Province presented its Development Plan of Clean Energy Vehicles in Hainan Province (DPCEVHP) in 2019. The plan claims that in two periods, 2020–2025 and 2025–2030, the 11 categories of vehicles will be gradually substituted by new clean energy vehicles (Table A1 in the Supplementary Material), with the speed of transformation faster for public traffic than private traffic. In addition, the promotion of EVs would increase the pressure on electricity grids (Table A2 in the Supplementary Material).
Although this report provides results with a feasibility analysis, it does not specify the method of assessment or the robustness of the results based on this method. Therefore, this study aims to validate the conclusions in the plan using publicly available data and repeatable methods. First, based on data and policy information in Hainan Island, a generation balanced replacement model is built to characterize the replacement of traditional gasoline vehicles with new clean energy vehicles. Then, the numbers of new clean energy vehicles in the two categories of the policy, namely, private cars and public transport vehicles, are evaluated, and the contribution of electricity demand in the policy environment and greenhouse gas emission reduction from the aforementioned replacement policy are estimated for each year between 2019 and 2030. This study finally compares the results in the report with those calculated in this study. Based on this, policy implications are provided for the promotion of new clean energy vehicles in Hainan Island.
The contribution of this study is twofold. From a theoretical perspective, it expands the application range of the generation stable substitution model to analyze the policy on EVs in Hainan, as well as contributes to research on islands’ energy use in terms of EV promotion. From a practical perspective, it theoretically supports the promotion of EVs in Hainan based on publicly accessible data and a repeatable method. Additionally, this research is meaningful to energy substitution in terms of transport on islands with large populations.
The rest of the article is organized as follows. The second section is the literature review, which summarizes EVs and energy use on islands. The third section presents the theoretical model and simulation based on data in Hainan Island. The fourth section discusses the results and policy implications. The last section concludes the article.
Literature Review
Given the dearth of studies on EVs on islands, this study reviews research on EVs and energy systems on islands separately. Research on EVs is based on three aspects: whether EVs are environmentally friendly, the factors and incentives for EV promotion, and the effects of such promotion. Research on whether EVs are environmentally friendly abounds. Qiao et al. (2019b) analyzed greenhouse gas emissions in three phases of the life cycle, namely, producing, using, and recycling. They argued that the use phase dominates greenhouse gas emissions and that cleaner electricity would enlarge the carbon dioxide reduction. Shen et al. (2019) compared the greenhouse gas emission reduction caused by battery EVs in different areas of China. They pointed out that the transition to renewable electricity would decrease regional differences. Qiao et al. (2019a) analyzed the recycling technology of EVs in China. Their results emphasized the importance of recycling, which can decrease greenhouse gas emissions and production costs. Kawamoto et al. (2019) pointed out that when using life-cycle assessment to compare internal combustion engine vehicles with EVs, the production of batteries would increase carbon dioxide emissions, whereas low carbon dioxide–emitting power generation could decrease emissions. However, Patella et al. (2019) argued that battery EVs had the highest carbon dioxide emissions in terms of life-cycle impacts.
The promotion of EVs has also generated a large number of studies. Some have studied factors that influence promotion. For example, Gass et al. (2014) pointed out that chargers’ density, license fee exemption, no driving restrictions, and priority to charging infrastructure construction lands are the four key factors that influence the promotion of EVs, based on an analysis of 41 provinces in China. Bjerkan et al. (2016) analyzed promotion in Norway. They found that free of purchase tax and value-added tax is attractive to respondents. Rietmann and Lieven (2019) compared policy measures in 20 countries and illustrated the importance of the level and amount of political incentives in promoting EVs. Fritz et al. (2019), analyzing 3.2 million sales records, found that carbon dioxide fleet regulation would help promote EVs. Ouyang et al. (2019), using logistic regression, argued that license plate control is more effective than purchase subsidies.
Some researchers have examined the effects of promoting EVs on islands. Baptista et al. (2013) evaluated the promotion of EVs on an island of the Azores archipelago in Portugal using life-cycle analysis. Their results supported the positive view of adopting EVs. Pina et al. (2014) agreed with this view. They argued that a high renewable energy resource would not support recharging EVs. Kougias et al. (2020), analyzing the attitudes of 44 key stakeholders, found that the reduction of renewable energy production costs and subsidies would help promote EVs on small islands. However, Wang et al. (2019) showed that fiscal incentives no longer cause a difference in promotion in various countries. Other factors such as chargers’ density, fuel prices, and road priority are more important.
Most Chinese studies of EVs are based on cases in Mainland China. Li et al. (2016) found that the combination of the government and enterprises is effective at promoting EVs in public services based on a case study in Shenzhen. Wang et al. (2017) found that a convenience policy is important by interviewing 324 EV purchasers. Qiu et al. (2019) compared four incentive policies in 88 cities. The results showed that both purchase subsidies and parking benefits are ineffective, whereas charging discounts and infrastructure construction subsidies are effective. Deng and Tian (2020) analyzed China’s EV subsidies using an industrial organization model and found that such subsidies need improving. Asaithambi et al. (2019), using life-cycle assessment, found that the carbon dioxide emissions of EVs are higher in China than in Germany, the United States, and Japan.
Many studies have focused on energy sustainability. Ioannidis et al. (2019) found that islands tend to improve energy diversity to solve the problem of energy supply security, based on an analysis of 44 islands. Curto et al. (2019) constructed a mathematical approach to evaluate the potential energy production of energy resources. Bettencourt (2019) provided a comprehensive input–output matrix and a model of resource use and human occupation to support sustainability on islands. Genave et al. (2020) pointed out that heavily relying on fossil fuels is damaging to islands’ sustainability. Marczinkowski and Østergaard (2019) compared battery energy storage systems with thermal energy storage systems and argued that both systems have potential applications. Kavadias et al. (2019) explored the potential of combining a geothermal power plant with a concentrated solar array. The results showed that this would be useful in periods of low demand and high energy consumption. De Diego et al. (2019) introduced a program that could train qualified professionals to provide traditional and renewable energy solutions.
In summary, most previous research on EVs focuses on Mainland China rather than on islands. At the same time, research on islands’ energy structure and sustainable development has rarely been analyzed from the perspective of EVs. The impact of the promotion of EVs on an island’s energy system and environment thus remains to be studied.
Models
Numbers of Purchasing Vehicles
A stable generation model was built to simulate the impact of the DPCEVHP following Hofmann et al. (2016). In this study, new clean energy vehicles include battery EVs, plug-in hybrid vehicles, and fuel cell vehicles. However, according to recent sales of new clean energy vehicles, battery EVs and plug-in hybrid vehicles dominate the market. Therefore, this study mainly uses data on EVs. In this model, demand in each year is stable or changes slightly, which means depreciation equals the purchase amount. Meanwhile, we assume that all new clean energy vehicles are EVs for two reasons. First, data on EVs are easily accessible. Second, mainstream vehicles are EVs (Zhou et al., 2020). These assumptions are adopted to evaluate energy demand and the greenhouse gas emission reduction. Table 1 lists the parameters, indices, and values.
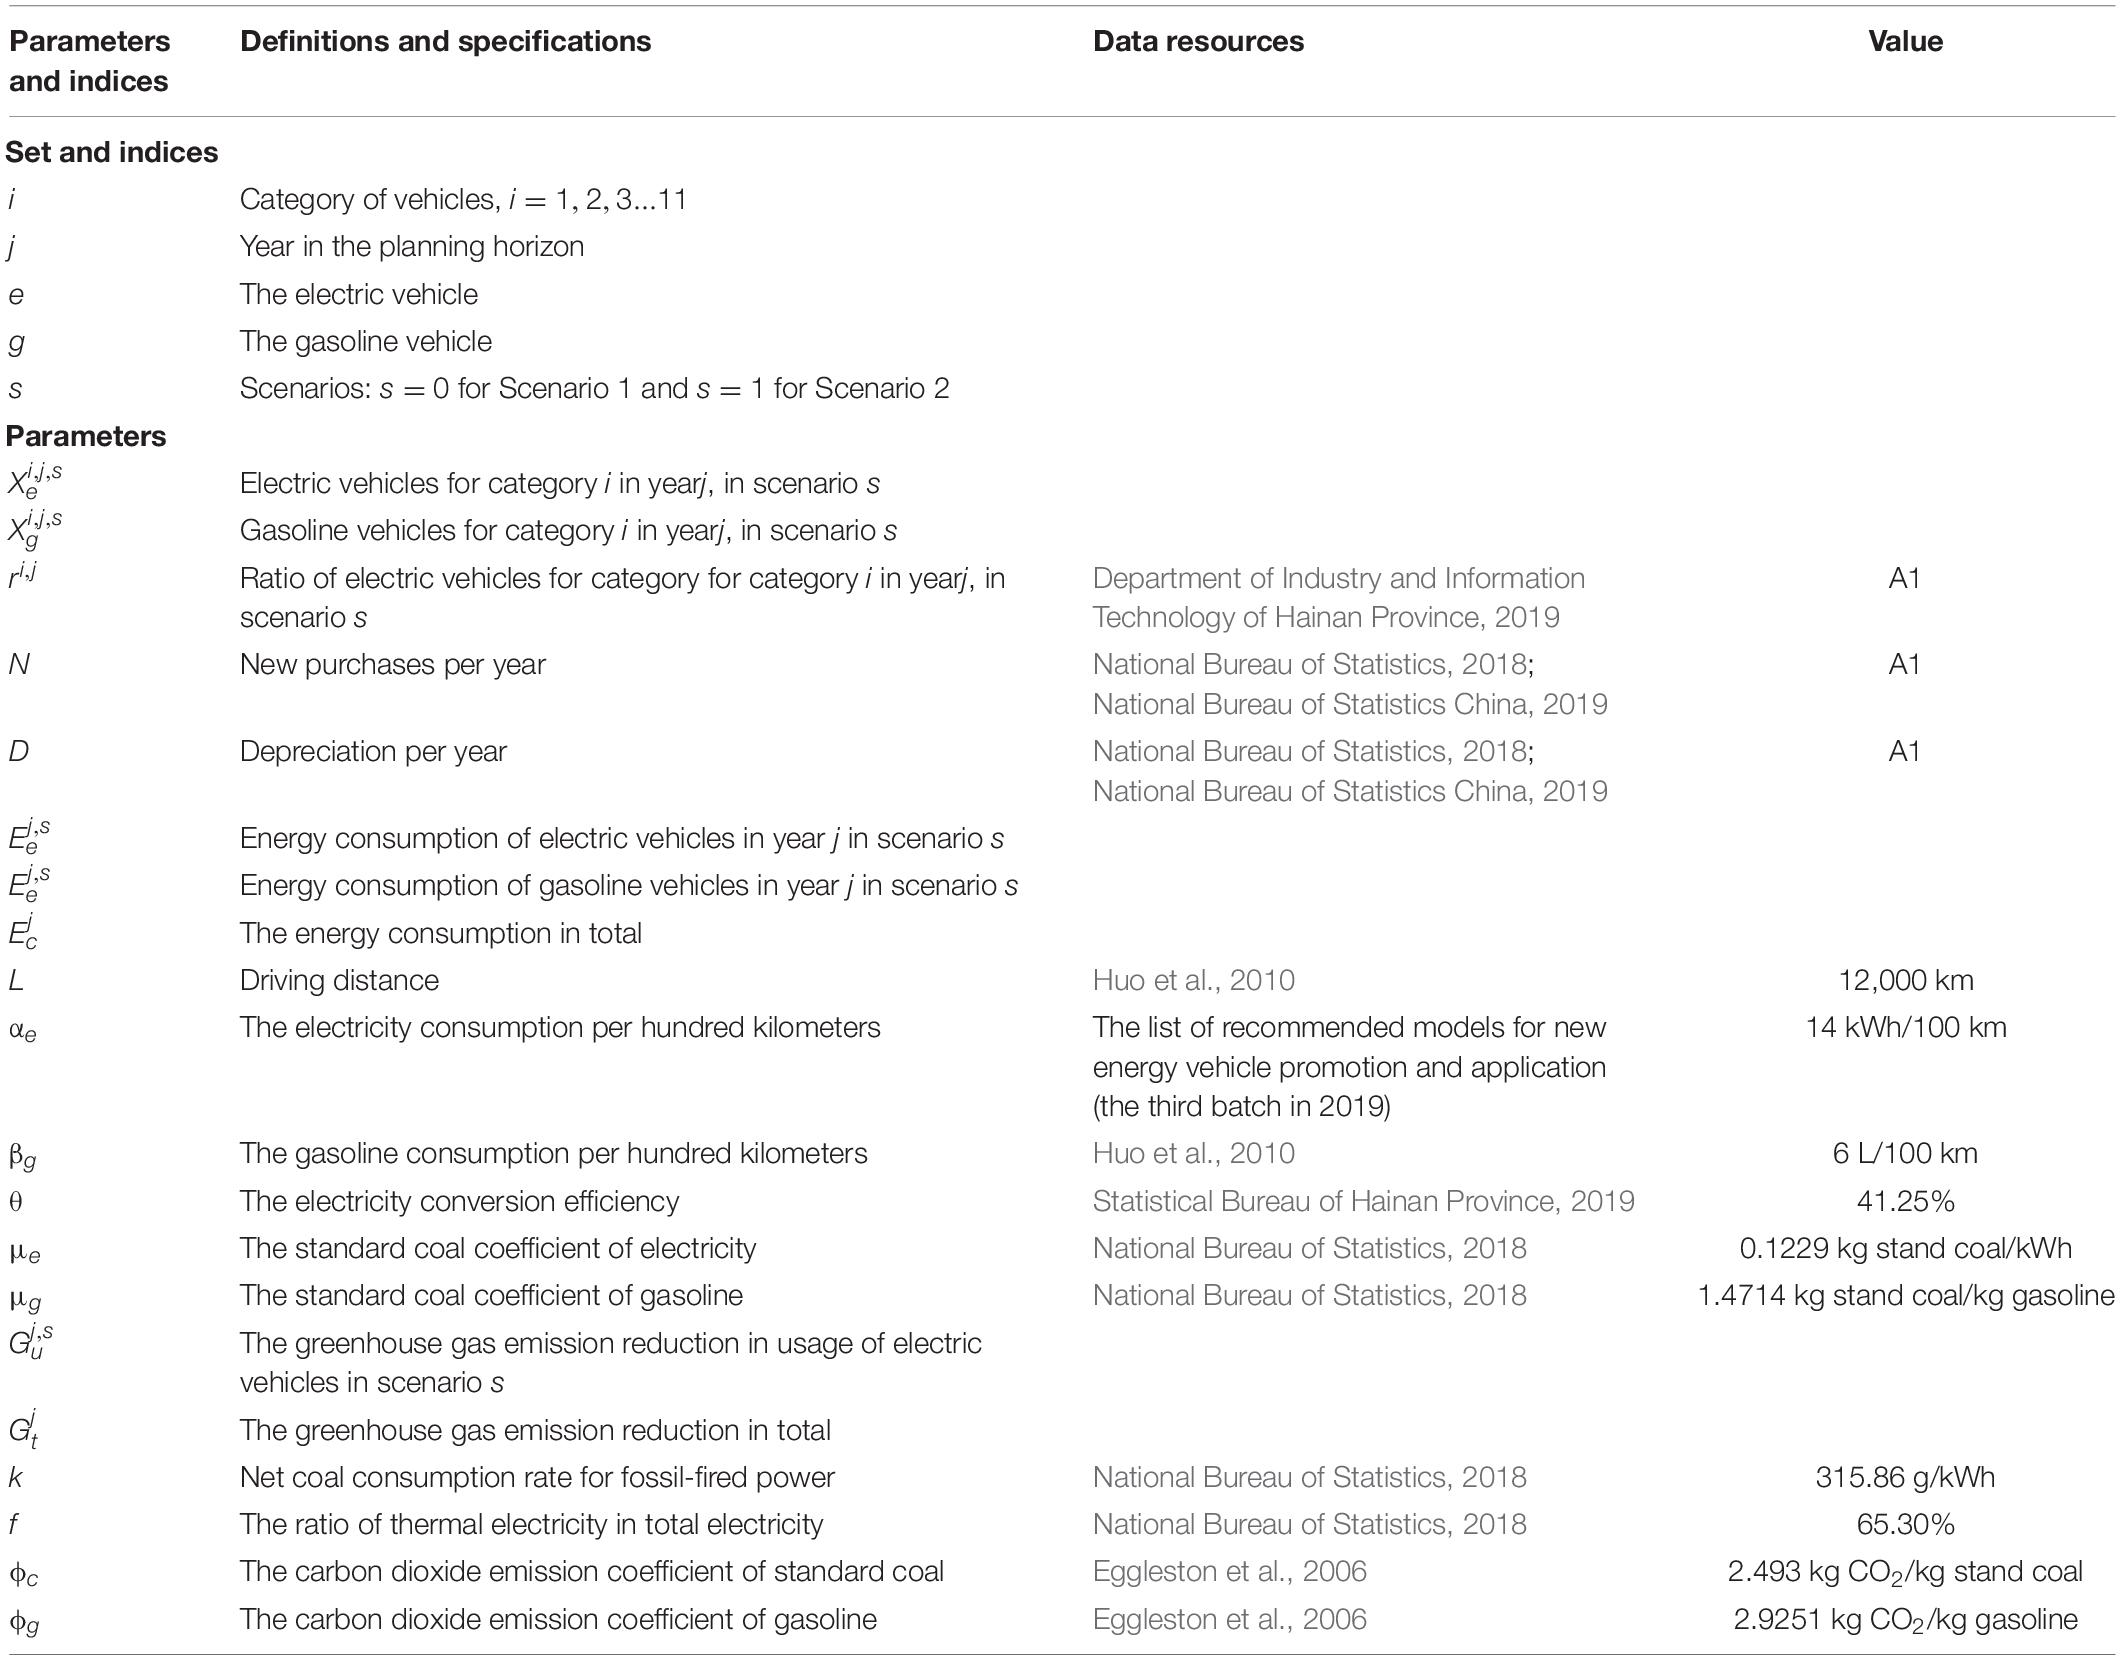
Table 1. Indices, parameters, and variables in the model.
We set the DPCEVHP as Scenario 1, denoted as s = 1. Correspondingly, we set a benchmark, Scenario 2, in which the ratio of EVs is fixed to that in 2017, meaning no effects of the DPCEVHP. In this scenario, the relative quantities, vehicles, and greenhouse gas emissions are denoted by s = 2.
The calculation function for EVs of vehicle i in year j is
is the number of EVs in year j in scenario s, and represents the number of gasoline vehicles. is the number of EVs in year (j−1). ri,j,s is the ratio of EVs to purchases. N represents total new purchases per year and D is depreciation per year, both of which are taken from the Hainan Statistical Yearbook. Eq. (2) represents the number of new EVs, whereas all vehicles of the category vehicle have been substituted by EVs. The extra D in Eq. (2) is depreciation of EVs per year. Values of D, N, and ri,j,s are listed in A1. Because predicting the number of owners of cars is difficult in general, we make the simplifying assumption that ownership of cars does not change in the studied period. In each category, the values of D and N depend on the ratio of cars in total new increasing and depreciation in 2017.
Energy Consumption
The calculation function for energy demand used is
where is electricity demand in year j, and is gasoline demand. The driving distance, L, is predicted to be 12,000 km for both EVs and gasoline vehicles, ignoring the difference between each category.αe is electricity consumption per 100 km, which is 14 kWh/100 km as adopted from the list of recommended models for new clean energy vehicle promotion and application (Ministry of Industry and Information Technology, 2019). represents category i in year j. βg is gasoline consumption per 100 km, which is 6 L/100 km as adopted from Huo et al. (2010). Importantly, combining the number of cars in 2017 (0.98 million), the average driving distance (12,000 km), and average gasoline consumption of each car (6 L/100 km), the usage of gasoline calculated out is 0.51 million tons, which should include the transportation consumption and the daily life consumption. According to Statistical Bureau of Hainan Province (2019), the gasoline consumption of these two parts is 0.50 million tons, which is little different from the calculation. Thus, the assumption of the average driving distance (12,000 km) and average gasoline consumption of each car (6 L/100 km) are reliable. Then, we use the following function to compare total energy demand in each year:
where μe and μg are standard coal coefficients, which are converted into different energy usages. θ is the electricity conversion efficiency.
The first (second) component calculates the difference in electricity (gasoline) between the two scenarios. Both are transformed into standard coal to combine the units.
The Greenhouse Gas Emission Reduction
Second, we calculate the greenhouse gas emission reduction. This document pointed out two goals of reducing greenhouse gas emissions: (1) the reduction in emissions when using EVs instead of the same number of gasoline vehicles and (2) the reduction in emissions of the whole plan. Thus, this article uses function (6) to calculate Goal 1 and function (7) to calculate Goal 2:
where k is the net coal consumption rate for fossil fuel–based power, f is the ratio of thermal electricity in total electricity per year, and ϕe and ϕg are the carbon dioxide emission coefficients of standard coal and gasoline, respectively. This function compares the reduction in emissions when using EVs instead of the same number of gasoline vehicles. The next step is to work out the total greenhouse gas emission reduction of this policy:
The first and second components in parentheses are used to calculate the greenhouse gas emission reduction in Scenario 1, whereas the third and fourth components are used to calculate this in Scenario 2. Importantly, all vehicles are imported from neighboring provinces because Hainan has no auto industry. In the calculation, we are only concerned about usage rather than production, which is supported by the Hainan input–output table announced in 2012.
Simulation Results
According to the model above, the structure of EVs, energy demand, and greenhouse gas emission reduction until 2030 is predicted.
Proposition 1. After the implementation of the EV promotion policy, private cars account for the majority of EVs, and this proportion is increasing.
As shown in Figure 1, after implementing the EV promotion policy, the number of private cars in Hainan Province is predicted to account for most EVs between 2019 and 2030. The proportion is increasing from 5.28% in 2019 to 90.59% in 2030. Overall, non-private vehicles such as light trucks and urban sanitation vehicles reach the goal of clean energy replacement by 2027. However, it is expected and modeled that private gasoline vehicles will continue to dominate until 2030 (Table A3 in the Supplementary Material; Figure 1). A clear inflection point in the change in the number of private EVs appears in 2025. The proportion of private EVs in the total number of EVs is 82.58%, an increase of 40% compared with that in 2020. Although r of EVs for private cars is low, private EVs still account for a large proportion of all EVs in Hainan Province because of the large number of private cars, as shown in Figure 1. Therefore, the effectiveness of this policy largely depends on the number of private cars, including the energy demand of private EVs and changes in greenhouse gas emissions caused by the replacement of private cars. This result is consistent with those in the government report DPCEVHP, which means that the goal of EV substitution could be realized by 2030.
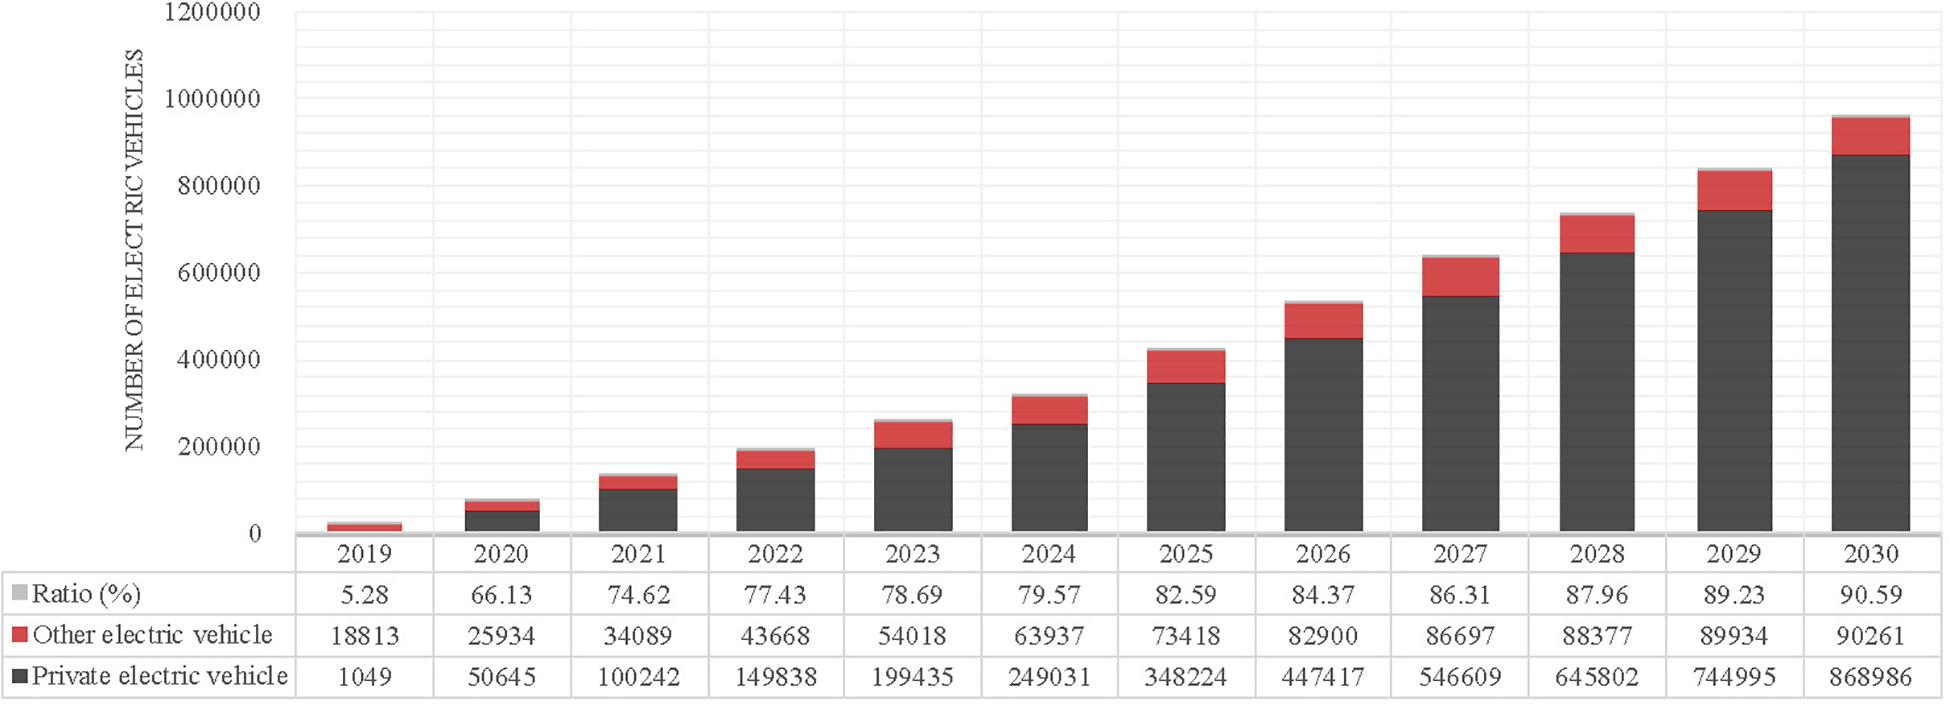
Figure 1. Structure of electric vehicles.
Proposition 2. This promotion raises energy demand, thereby placing high pressure on energy supply.
Figure 2 shows the annual energy demand of all vehicles. Gasoline and electricity demand are combined as the quantity of standard coal. Although both energy resources increase, electricity grows more quickly, especially after 2025, corresponding to the slow gasoline increase or even decrease by 2030. In the three important time points, namely, 2020, 2025, and 2030, electricity demand is 9,950, 2.11 million, and 4.80 million tons of standard coal, respectively. Compared with 2020, the volume is 20.22 times that in 2025 and 47.30 times that in 2030.
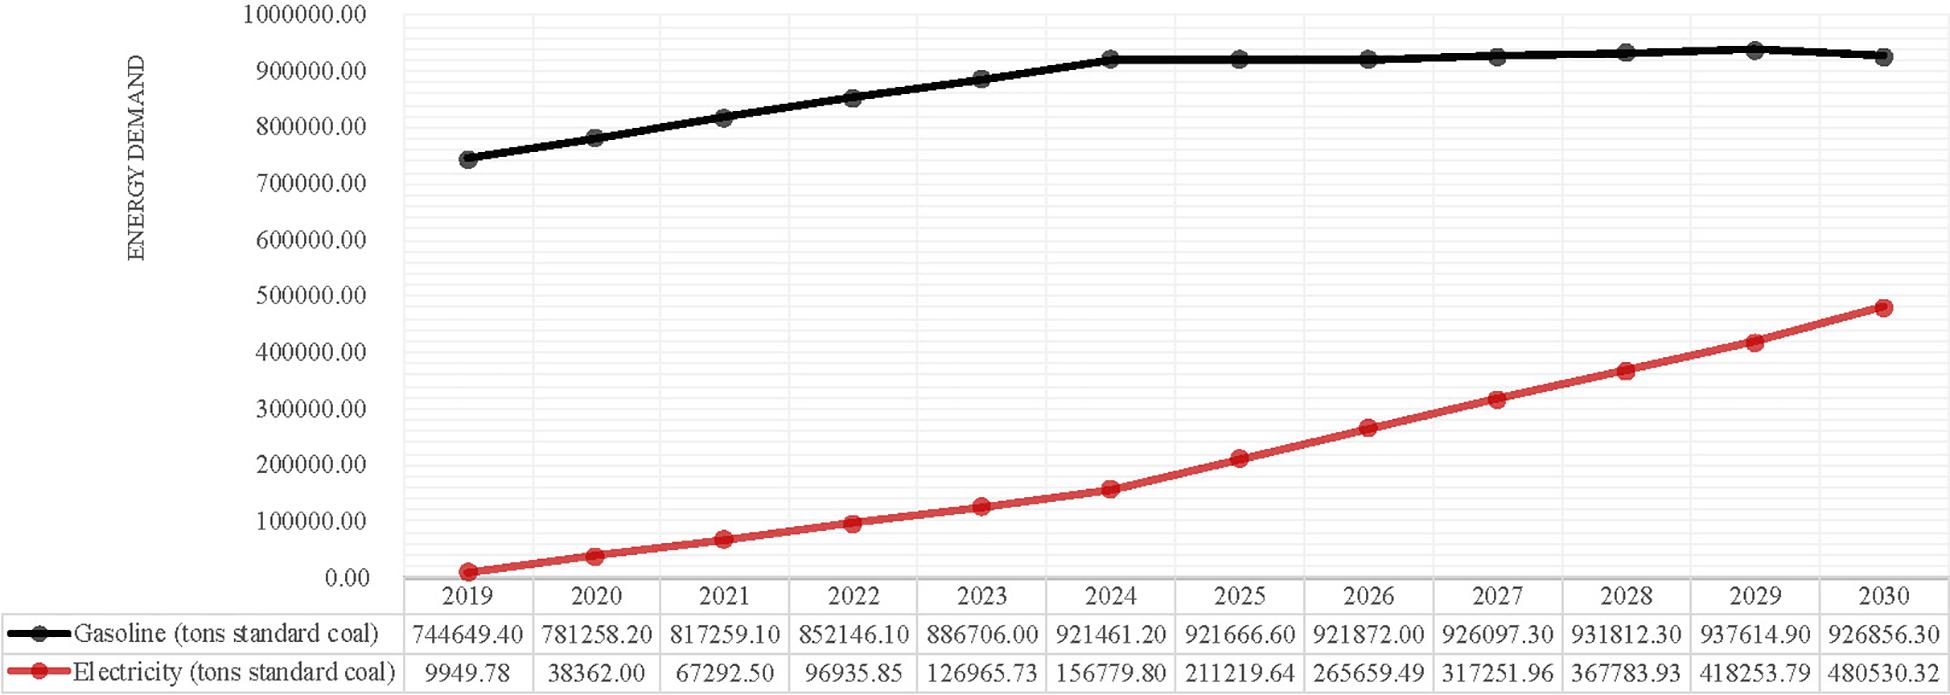
Figure 2. Energy demand in Hainan Island.
According to the Statistical Bureau of Hainan Province (2019), the total production of electricity in 2017 was 19.54 billion kWh, equal to 61.7 million tons of standard coal, compared with 19.66 billion kWh in 2016, equal to 62 million tons of standard coal. These data indicate that the power generation of Hainan is weak.
The electricity trend is dominated by private vehicles (90.6%). In 2017, electricity consumption by urban and rural residents was 18.32 million tons standard coal altogether, with 6.72% annual growth. Without this plan, the rapidly growing demand of electricity caused huge challenges to the little increasing supply of electricity. As a result, the extra electricity demands caused by new EVs, 2.11 million tons (2025), and 4.80 million tons (2030), are not affordable to the Hainan electricity industry.
These results are different than the government report in China for two reasons. The first reason is the different energy consumption of EVs. This model uses the average electricity consumption of EVs based on the list of recommended models for new clean energy vehicle promotion and application (Ministry of Industry and Information Technology, 2019). Electricity consumption under future regulation may be considered in the report, whereas energy consumption is unclear under the future regulation in this article. Second, the driving distance of each category is different in this study from that in the report. To simplify the calculation, data from Huo et al. (2010) are used. The distance adopted in this study is 12,000 km per car per year, which is different than that in reality.
Proposition 3. The greenhouse gas emission reduction is slowed by the electricity structure of Hainan Island.
Figure 3 presents the effect of the greenhouse gas emission reduction caused by this policy. It is clear that the promotion of EVs is effective to some extent, although the effect is below our expectations. The increase in EVs causes a reduction of 2.91 million tons of carbon dioxide in 2025 and 6.62 million tons in 2030, only half the prediction in the government report (Department of Industry and Information Technology of Hainan Province, 2019). The total reduction would be 3.63 million tons in 2025 and 8.27 million tons in 2030 because of increases in EVs and decreases in gasoline vehicles.
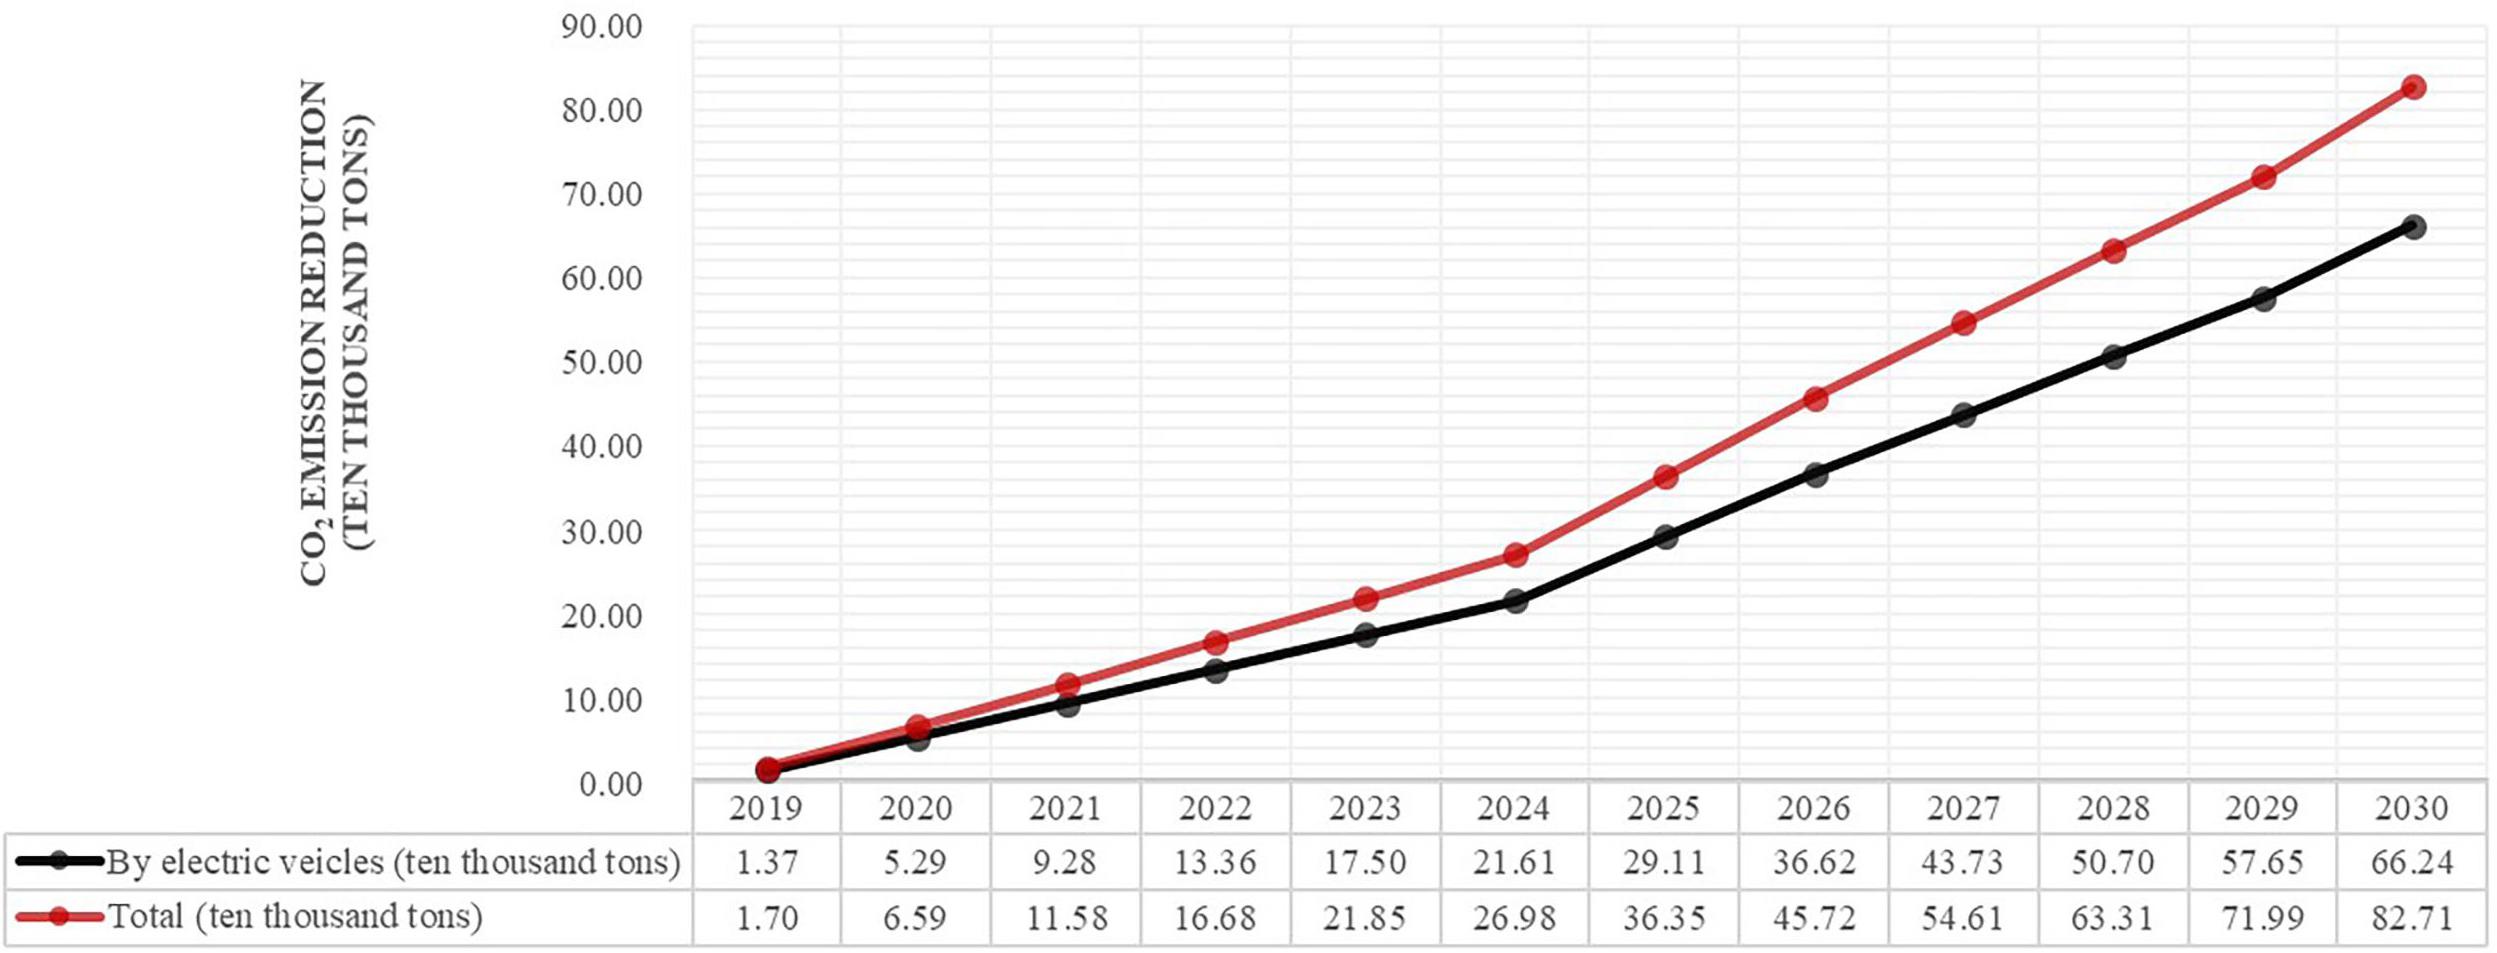
Figure 3. The greenhouse gas emission reduction.
Another difference is caused by the structure of energy. According to the National Bureau of Statistics (2018) produced by the National Bureau of Statistics, the production of electricity includes 65.3% thermal electricity, 24.9% nuclear electricity, 6.9% hydroelectricity, 1.8% wind power, and 1.1% solar electricity. The results show that the existing electricity structure could not help this policy reach the goal of reducing emissions.
In conclusion, simulating our model and comparing it with the benchmark scenario, we show that, first, the change in energy demand would exceed the ability of the electricity grid. Second, the reduction in greenhouse gas emissions would not be as high as expected owing to the non–environmentally friendly electricity structure.
This result is different than those in the government report for two reasons. First, the choice of power generation mode is different. The government report combines the 12th and 13th Five-Year Plans. In this plan, the scale of power generation and proportion of various types of energy generation change significantly. However, this model is based on 2017 and 2018 power generation data, which are significantly different than the plan. Second, the different estimates of driving distance affect the estimation of emissions as well.
Discussion
According to this analysis, private vehicles and the electricity structure would be key factors in reaching the goal, promoting EVs, and decreasing greenhouse gas emissions. Based on this view, we suggest three complementary suggestions to fix the DPCEVHP: exogenous technological improvement, power station evaluation, and public substitution.
Raising the Energy Efficiency of EVs
According to the results of this study, technological advances related to the energy efficiency of new clean energy vehicles can help promote the use of new clean energy vehicles in Hainan Island. When energy consumption decreases by 1 kWh/100 km, annual power demand will decrease by 34,324 tons of standard coal, as shown in Figure 4. If the average power consumption of each vehicle is 11 kWh/100 km or less, the growth in energy demand will slow. The technological progress of new clean energy vehicles in the model is considered to be exogenous, because there is no automobile industry in Hainan Island. Therefore, this study proposes measures to improve the energy efficiency of EVs from a policy perspective, which is to encourage the purchase of highly energy-efficient EVs. The subsidy policy can be inclined toward high-efficiency EVs. The lower the energy consumption, the higher is the subsidy.
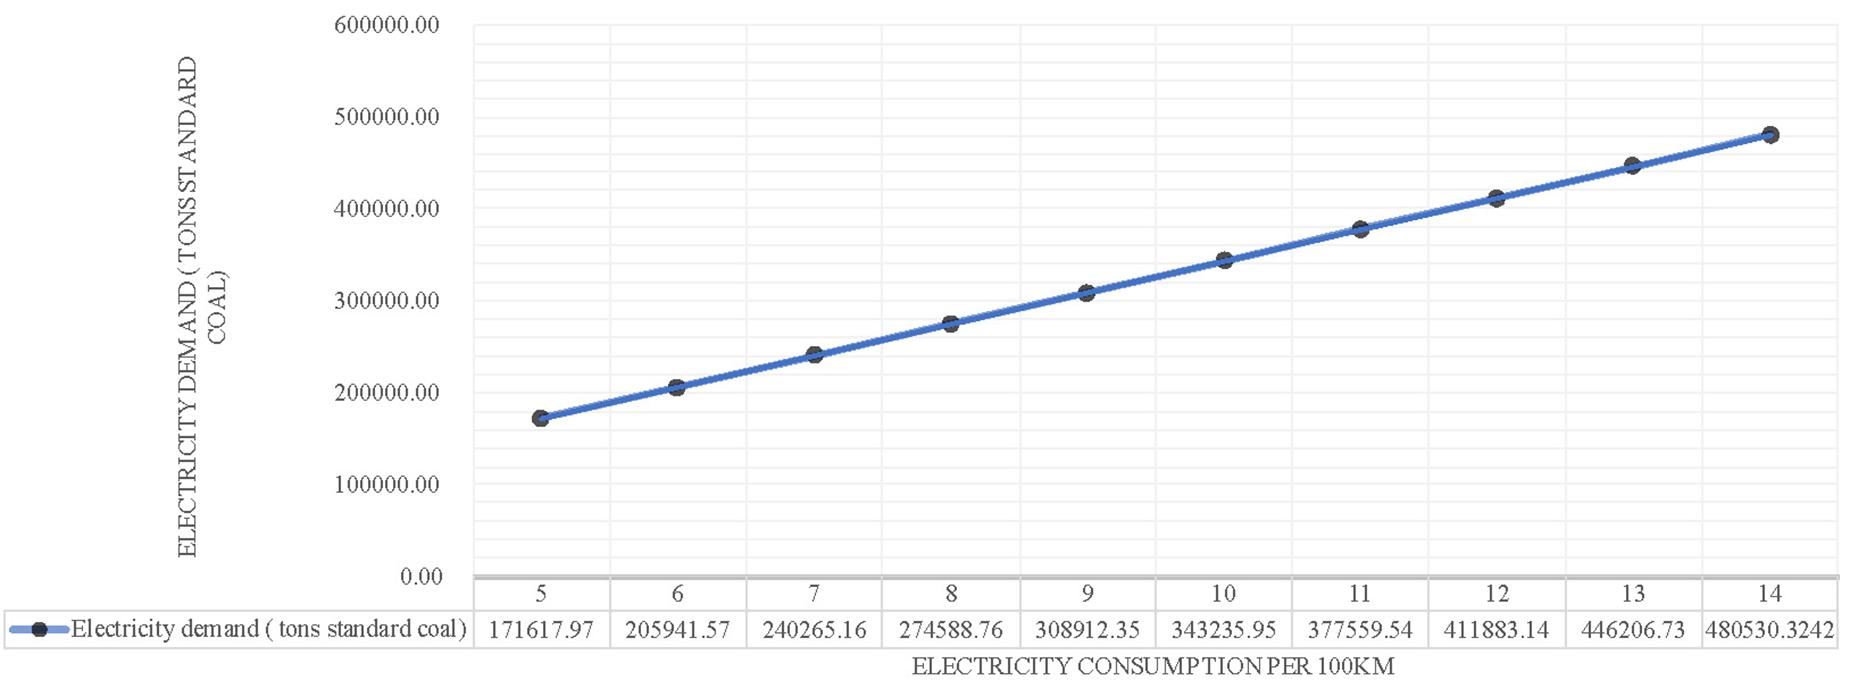
Figure 4. Relationship between electricity demand and the technology in 2030.
Adjusting the Supply-Side Power Structure
Increasing power supply is considered to be a necessary supporting measure to promote new clean energy vehicles. According to the calculation results, the short-term large-scale use of EVs will cause a sharp rise in power demand. This poses certain challenges to power supply. According to the 13th Five-Year Plan, building more power generation is infeasible. Indeed, during 2015–2018, power generation declined in all 3 years, from 23.46 billion kWh to 19.54 billion kWh owing to the implementation of environmental regulations and policies such as the closure of small coal-fired power plants.
To solve the problem of a power supply shortage, short- and long-term considerations should be separated. In the short term, strengthening grid construction and natural gas power generation could be considered. Hainan Island is reliant on external power, which is difficult to change quickly. Therefore, strengthening the construction of the power grid can alleviate the problem of insufficient power supply to a certain extent. The advantage of natural gas power generation is the short construction period. Chen et al. (2016) provided basic data for the different types of power generation used in this study. Natural gas power generation can be completed in only 2 years and can be used for 30 years. Further, compared with photovoltaic and wind power, the technology of natural gas power generation is more mature, cheaper, and more operable. The investment cost of natural gas power generation is 4294.64 yuan/kW, and the operation and maintenance costs are 0.0024 yuan/kWh. Compared with coal power and oil power, the pollution of natural gas power generation is also less, making it a short-term strategy to solve the energy shortage in Hainan Island. On the one hand, different from Hawaii (McKenzie, 2015), the technology of photovoltaic power generation and hydrogen power is not mature. On the other hand, the rich resource of natural gas supports it. According to the official document (General Office of Hainan Provincial People’s Government, 2017), Hainan Island is rich in natural gas and oil resources, accounting for more than one-third of the total reserves of oil and gas resources. According to CNOOC exploration, three of the five natural gas enrichment areas are distributed around Hainan. Meanwhile, the natural gas exploitation technology and industrial technology are mature. However, gas-fired power generation has a much lower capacity than coal-fired power generation (Chen et al., 2016). Therefore, in the long run, policymakers need to consider a comprehensive energy structure adjustment plan as a supporting plan for the promotion of EVs, including increasing the proportion of renewable energy, such as hydropower, to reduce the degree of external energy dependence in Hainan Island.
Improving Public Transport Competitiveness
Concerning the shortage of energy supply, the decrease in energy demand could help. According to the simulation, when 50,000 consumers stop purchasing a private EV and choose a clean energy public bus, electricity demand would be half that of the results, and the greenhouse gas emission reduction would also exceed the original goal. According to this prediction, increasing the frequency and services of public transport would increase its competitiveness. Making good use of existing buses or optimizing routes would thus reduce consumers’ desire to purchase private vehicles.
Anwar (2009) pointed out that improving bus services can encourage private car owners to use public transportation. The empirical findings of Boedisantoso et al. (2019) also supported this view. Their survey in Surabaya showed that 77% of respondents were willing to use a public transportation system with adequate public transport. However, Beirão and Cabral (2007) pointed out that personal characteristics, the purpose of travel, and feelings about transport all affect the choice of travel mode, making these the most important factors to consider when enhancing the attractiveness of public transportation. Hao and Guo (2019) pointed out that simply increasing bus lines does not reduce private car ownership. Hence, policymakers need to consider comprehensively improving bus services and optimizing public transport routes.
In conclusion, compared to other huge islands with huge populations, Hawaii, for instance, Hainan islands faced special challenges in promoting EVs. High electricity consumptions and the uncleaning electricity structure limited EV promotion. Combining with resources and demand of residents in Hainan would be a reliable solution.
Conclusion
In this study, a stable generation model is built to stimulate the effects of the DPCEVHP. Based on the assumption of stable car ownership, the number of EVs, electricity demand, and the greenhouse gas emission reduction between 2019 and 2030 in Hainan Island are simulated based on the government’s promotion policy. First, energy demand would exceed expectations. Compared with 2020, electricity demand would be 20.22 times that in 2025 and 47.30 times that in 2030. Second, the greenhouse gas emission reduction caused by decreases in gasoline vehicles and increases in EVs would be lower than expected owing to the large ratio of thermal electricity in total electricity.
According to the results, three policy suggestions are provided to reach the expected target. First, we capture the exogenous technological improvement. Technology for lowering the electricity consumption of each car as well as other clean energy vehicles such as natural gas vehicles would be beneficial. Second, building a clean energy power station, namely, gas-fired power generation, is suitable. Third, attractive public transport services, which means improving the level of public transport, would decrease the purchase of private vehicles.
This study not only expands the application of a generation balanced substitution model and analyzes the energy structure with respect to promoting EVs, but also theoretically supports EV promotion on islands using available data and a repeatable method. This research is meaningful for developing energy substitution in terms of transport on middle-sized and large islands with large populations. As with many other studies, the limitations of this study are mainly due to the failure to consider the individual differences of the vehicles in each category, as the rough data are insufficient to support a more detailed analysis. The refinement of vehicle data is thus a future research direction.
Data Availability Statement
All datasets generated for this study are included in the article/Supplementary Material.
Author Contributions
XX: collecting data, building models, collecting literatures, and writing the article. ZC: revising the article and modifying the language. CW: modifying the model and modifying the article. PN: reviewing the final edition of this manuscript and adjusting the structure. All authors contributed to the article and approved the submitted version.
Funding
This work was partially supported by the National Natural Science Foundation of China (71771057), Guangdong Science Foundation (2018A030310669), Innovative Foundation (Humanities and Social Sciences) for Higher Education of Guangdong Province (2018WZDXM003), the Innovative Group Foundation (Humanities and Social Sciences) for Higher Education of Guangdong Province (2015WCXTD009), Philosophy and Social Science Development Project of Guangzhou (2020GZQN39), and the Foundation for High-level Talents in Higher Education of Guangdong [GDUPS (2019)].
Conflict of Interest
The authors declare that the research was conducted in the absence of any commercial or financial relationships that could be construed as a potential conflict of interest.
Supplementary Material
The Supplementary Material for this article can be found online at: https://www.frontiersin.org/articles/10.3389/fenrg.2020.00132/full#supplementary-material
References
Anwar, A. M. (2009). Paradox between public transport and private car as a modal choice in policy formulation. J. Bangladesh Inst. Plan. 2, 71–77. doi: 10.3329/jbip.v2i0.9568
Asaithambi, G., Treiber, M., and Kanagaraj, V. (2019). “Life cycle assessment of conventional and electric vehicles,” in International Climate Protection, eds M. Palocz-Andresen, D. Szalay, A. Gosztom, L. Sípos, and T. Taligás (Cham: Springer), 161–168. doi: 10.1007/978-3-030-03816-8_21
Baptista, P. C., Silva, C. M., Lopes, J. P., Soares, F. J., and Almeida, P. R. (2013). Evaluation of the benefits of the introduction of electricity powered vehicles in an island. Energy Conv. Manag. 76, 541–553. doi: 10.1016/j.enconman.2013.07.075
Beirão, G., and Cabral, J. S. (2007). Understanding attitudes towards public transport and private car: a qualitative study. Trans. Policy 14, 478–489. doi: 10.1016/j.tranpol.2007.04.009
Bettencourt, L. M. (2019). “Critical paths to sustainability: the research challenge from island urban systems, in Urban Galapagos, T. Kvan, and J. Karakiewicz (Cham: Springer), 155–160. doi: 10.1007/978-3-319-99534-2_10
Bjerkan, K. Y., Nørbech, T. E., and Nordtømme, M. E. (2016). Incentives for promoting battery electric vehicle (BEV) adoption in Norway. Trans. Res. Part D 43, 169–180. doi: 10.1016/j.trd.2015.12.002
Boedisantoso, R., Ciptaningayu, T. N., Syafei, A. D., Assomadi, A. F., Slamet, A., and Hermana, J. (2019). “Reduction of CO, NOx and SO2 emissions from the transfer of private vehicles to public transportation: a case study of Surabaya,” in Proceedings of the IOP Conference Series: Earth and Environmental Science, Vol. 239, (Bristol: IOP Publishing), 012041. doi: 10.1088/1755-1315/239/1/012041
Chen, H., Tang, B. J., Liao, H., and Wei, Y. M. (2016). A multi-period power generation planning model incorporating the non-carbon external costs: a case study of China. Appl. Energy 183, 1333–1345. doi: 10.1016/j.apenergy.2016.09.097
Curto, D., Franzitta, V., Viola, A., Cirrincione, M., Mohammadi, A., and Kumar, A. (2019). A renewable energy mix to supply small islands. A comparative study applied to Balearic Islands and Fiji. J. Clean. Product. 241:118356. doi: 10.1016/j.jclepro.2019.118356
De Diego, L., Marco, M. L., and Bravo, M. (2019). “Capacity building itinerary on sustainable energy solutions for islands and territories at risk for the effects of climate change,” in Climate Change and the Role of Education, eds W. L. Filho, and S. L. Hemstock (Cham: Springer), 237–253. doi: 10.1007/978-3-030-32898-6_14
Deng, Z., and Tian, P. (2020). Are China’s subsidies for electric vehicles effective? Manag. Decision Econ. 41, 475–489. doi: 10.1002/mde.3114
Department of Industry and Information Technology of Hainan Province (2019). The Development Plan of Clean Energy Vehicles in Hainan Province [DPCEVHP] (in Chinese); 2019. Haikou: Department of Industry and Information Technology of Hainan Province.
Eggleston, S., Buendia, L., Miwa, K., Ngara, T., and Tanabe, K. (eds) (2006). 2006 IPCC Guidelines for National Greenhouse Gas Inventories (Vol. 5). Hayama: Institute for Global Environmental Strategies.
Fritz, M., Plötz, P., and Funke, S. A. (2019). The impact of ambitious fuel economy standards on the market uptake of electric vehicles and specific CO2 emissions. Energy Policy 135:111006. doi: 10.1016/j.enpol.2019.111006
Gass, V., Schmidt, J., and Schmid, E. (2014). Analysis of alternative policy instruments to promote electric vehicles in Austria. Renew. Energy 61, 96–101. doi: 10.1016/j.renene.2012.08.012
Genave, A., Blancard, S., and Garabedian, S. (2020). An assessment of energy vulnerability in Small Island Developing States. Ecol. Econ. 171:106595. doi: 10.1016/j.ecolecon.2020.106595
General Office of Hainan Provincial People’s Government (2017). Guiding Opinions on the 13th Five Years Plan for the Development of Oil and Gas Industry in Hainan Province; 2017. Haikou: General Office of Hainan Provincial People’s Government.
Hao, L., and Guo, X. (2019). “Study on the influencing factors of private car ownership in China under the background of aging,” in Proceedings of the Fourth International Conference on Economic and Business Management (FEBM 2019) (Paris: Atlantis Press).
Hofmann, J., Guan, D., Chalvatzis, K., and Huo, H. (2016). Assessment of electrical vehicles as a successful driver for reducing CO2 emissions in China. Appl. Energy 184, 995–1003. doi: 10.1016/j.apenergy.2016.06.042
Huo, H., Zhang, Q., Wang, M. Q., Streets, D. G., and He, K. (2010). Environmental implication of electric vehicles in China. Environ. Sci. Technol. 44, 4856–4861. doi: 10.1021/es100520c
Ioannidis, A., Chalvatzis, K. J., Li, X., Notton, G., and Stephanides, P. (2019). The case for islands’ energy vulnerability: Electricity supply diversity in 44 global islands. Renew. Energy 143, 440–452. doi: 10.1016/j.renene.2019.04.155
Kavadias, K. A., Alexopoulos, P., Charis, G., and Kaldellis, J. K. (2019). Sizing of a solar–geothermal hybrid power plant in remote island electrical network. Energy Proc. 157, 901–908. doi: 10.1016/j.egypro.2018.11.256
Kawamoto, R., Mochizuki, H., Moriguchi, Y., Nakano, T., Motohashi, M., Sakai, Y., et al. (2019). Estimation of CO2 emissions of internal combustion engine vehicle and battery electric vehicle using LCA. Sustainability 11:2690. doi: 10.3390/su11092690
Kougias, I., Nikitas, A., Thiel, C., and Szabó, S. (2020). Clean energy and transport pathways for islands: a stakeholder analysis using Q method. Trans. Res. Part D 78:102180. doi: 10.1016/j.trd.2019.11.009
Li, Y., Zhan, C., de Jong, M., and Lukszo, Z. (2016). Business innovation and government regulation for the promotion of electric vehicle use: lessons from Shenzhen. China. J. Clean. Product. 134, 371–383. doi: 10.1016/j.jclepro.2015.10.013
Marczinkowski, H. M., and Østergaard, P. A. (2019). Evaluation of electricity storage versus thermal storage as part of two different energy planning approaches for the islands Samsø and Orkney. Energy 175, 505–514. doi: 10.1016/j.energy.2019.03.103
McKenzie, K. (2015). The State of Electric Vehicles In Hawaii. Hawaii: Hawaii Natural Energy Institute.
Michaelides, E. E. (2020). Thermodynamics and energy usage of electric vehicles. Energy Conv. Manag. 203:112246. doi: 10.1016/j.enconman.2019.112246
Ministry of Industry and Information Technology (2019). The List of Recommended Models for New Clean Energy Vehicle Promotion and Application (the third batch in 2019). Beijing: Ministry of Industry and Information Technology.
National Bureau of Statistics (2018). China Energy Statistical Yearbook 2018. Beijing: China Statistics Press.
National Bureau of Statistics China (2019). Chinese Statistical Yearbook 2019. Beijing: China Statistics Press.
Nichols, B. G., Kockelman, K. M., and Reiter, M. (2015). Air quality impacts of electric vehicle adoption in Texas. Trans. Res. Part D 34, 208–218. doi: 10.1016/j.trd.2014.10.016
Ouyang, D., Ou, X., Zhang, Q., and Dong, C. (2019). Factors influencing purchase of electric vehicles in China. Mitigat. Adapt. Strat. Glob. Change 25, 413–440. doi: 10.1007/s11027-019-09895-0
Patella, S. M., Scrucca, F., Asdrubali, F., and Carrese, S. (2019). Traffic simulation-based approach for a cradle-to-grave greenhouse gases emission model. Sustainability 11:4328. doi: 10.3390/su11164328
Pina, A., Baptista, P., Silva, C., and Ferrão, P. (2014). Energy reduction potential from the shift to electric vehicles: the Flores island case study. Energy Policy 67, 37–47. doi: 10.1016/j.enpol.2013.07.120
Qiao, Q., Zhao, F., Liu, Z., and Hao, H. (2019a). Electric vehicle recycling in China: economic and environmental benefits. Resour. Conserv. Recycl. 140, 45–53. doi: 10.1016/j.resconrec.2018.09.003
Qiao, Q., Zhao, F., Liu, Z., He, X., and Hao, H. (2019b). Life cycle greenhouse gas emissions of Electric Vehicles in China: combining the vehicle cycle and fuel cycle. Energy 177, 222–233. doi: 10.1016/j.energy.2019.04.080
Qiu, Y. Q., Zhou, P., and Sun, H. C. (2019). Assessing the effectiveness of city-level electric vehicle policies in China. Energy Policy 130, 22–31. doi: 10.1016/j.enpol.2019.03.052
Rietmann, N., and Lieven, T. (2019). “A comparison of policy measures promoting electric vehicles in 20 countries,” in The Governance of Smart Transportation Systems, eds M. Finger, and M. Audouin (Cham: Springer), 125–145. doi: 10.1007/978-3-319-96526-0_7
Shen, W., Han, W., Wallington, T. J., and Winkler, S. L. (2019). China electricity generation greenhouse gas emission intensity in 2030: implications for electric vehicles. Environ. Sci. Technol. 53, 6063–6072. doi: 10.1021/acs.est.8b05264
Sioshansi, R., Fagiani, R., and Marano, V. (2010). Cost and emissions impacts of plug-in hybrid vehicles on the Ohio power system. Energy Policy 38, 6703–6712. doi: 10.1016/j.enpol.2010.06.040
Statistical Bureau of Hainan Province (2019). Hainan Statistical Yearbook 2018. Beijing: China Statistics Press.
Wang, N., Tang, L., and Pan, H. (2019). A global comparison and assessment of incentive policy on electric vehicle promotion. Sustain. Cities Soc. 44, 597–603. doi: 10.1016/j.scs.2018.10.024
Wang, S., Li, J., and Zhao, D. (2017). The impact of policy measures on consumer intention to adopt electric vehicles: evidence from China. Trans. Res. Part A 105, 14–26. doi: 10.1016/j.tra.2017.08.013
Keywords: electric vehicle promotion policy, electricity demand on islands, greenhouse gas emissions, generation balanced substitution model, electricity structure
Citation: Xiao X, Chen Z, Wang C and Nie P (2020) Effect of an Electric Vehicle Promotion Policy on China’s Islands: A Case Study of Hainan Island. Front. Energy Res. 8:132. doi: 10.3389/fenrg.2020.00132
Received: 28 February 2020; Accepted: 02 June 2020;
Published: 08 July 2020.
Edited by:
Goran Krajacic, University of Zagreb, CroatiaReviewed by:
Marco Aiello, University of Stuttgart, GermanyJay Zarnikau, The University of Texas at Austin, United States
Laura Fiorini, University of Groningen, Netherlands and Mohammad Hadi Rouhani, University of Stuttgart, Germany, in collaboration with reviewer MA
Copyright © 2020 Xiao, Chen, Wang and Nie. This is an open-access article distributed under the terms of the Creative Commons Attribution License (CC BY). The use, distribution or reproduction in other forums is permitted, provided the original author(s) and the copyright owner(s) are credited and that the original publication in this journal is cited, in accordance with accepted academic practice. No use, distribution or reproduction is permitted which does not comply with these terms.
*Correspondence: Xu Xiao, xuu_xiao@163.com; Chan Wang, wangchan0512@163.com