Impedance Analysis and PHIL Demonstration of Reactive Power Oscillations in a Wind Power Plant Using a 4-MW Wind Turbine
 Przemyslaw Koralewicz1
  Shahil Shah1*
  Vahan Gevorgian1
  Robb Wallen1
  Kapil Jha2 Dale Mashtare2 Kasi Viswanadha Raju Gadiraju2 Arvind Tiwari2
- 1National Renewable Energy Laboratory (NREL), Golden, CO, United States
- 2General Electric (GE), Schenectady, NY, United States
This paper presents impedance-based analysis, mitigation, and power-hardware-in-the-loop (PHIL) demonstration of reactive power oscillations in a wind power plant using a 4-MW Type III wind turbine drivetrain. Because such low-frequency oscillations result from interactions among slower control loops of wind turbines regulating phasor quantities—active and reactive power output of the wind turbine and the magnitude of voltages at the point of interconnection (POI)—a new type of admittance is defined in terms of phasor quantities for their analysis. The so-called power-domain admittance of a wind turbine is defined as the transfer function from the frequency and magnitude of voltages at the POI to the active and reactive power output of the turbine. The power-domain admittance responses of the 4-MW wind turbine are measured using a 7-MVA grid simulator to identify the source of the reactive power oscillations. Power-domain impedance analysis and PHIL experiments are performed to explain how a resonant mode manifests as turbine-to-turbine and plant-to-grid reactive power oscillations. It is discovered that weaker grids exhibiting high inductive impedance mitigate oscillations in the reactive power output of wind power plants; however, a higher grid impedance does not help in damping turbine-to-turbine reactive power oscillations. This paper presents a simple droop-based solution to eliminate both turbine-to-turbine and plant-to-grid reactive power oscillations.
Introduction
Fast and complex controls of power electronics equipment in wind turbines make wind power plants prone to different types of control interaction problems. These problems manifest as oscillations or resonance, which have resulted in significant equipment damage and disruption in the operation of wind power plants around the world (Gross, 2010; Brendel and Traufetter, 2014; Buchhagen et al., 2016; Sun et al., 2017; Xie et al., 2017; Liu et al., 2018). Resonance is classified either as subsynchronous resonance (Gross, 2010; Cheng et al., 2013, 2019; Sun et al., 2017; Xie et al., 2017; Liu et al., 2018) or super-synchronous resonance (Brendel and Traufetter, 2014; Buchhagen et al., 2016; Lyu et al., 2016), depending, respectively, on whether the frequency of oscillations is lower or higher than the fundamental frequency. In addition to the frequency of oscillations, however, it is also important to note whether the oscillations are measured in phasor variables—active and reactive power flows, and frequency, magnitude, and angle of bus voltages and currents—or phase variables—three-phase voltages and currents; subsynchronous oscillations in phasor variables appear as a combination of subsynchronous and supersynchronous oscillations in phase variables (Shah and Parsa, 2017). For instance, torsional oscillations in bulk power systems (Kundur, 1994) and active/reactive power oscillations in wind power plants (Knuppel et al., 2012; Ofgem.gov, 2019; Zhou et al., 2020) at a subsynchronous frequency, for example fs, appear in three-phase voltages and currents as a combination of oscillations at a subsynchronous frequency, f 1-fs, and a supersynchronous frequency, f 1+fs. Hence, subsynchronous resonance in phasor variables can be referred to as near-synchronous resonance in phase variables. This paper focuses on subsynchronous reactive power oscillations in wind power plants, which as explained, appear as near-synchronous resonance in three-phase voltages and currents. Reactive power oscillations were observed in Hornsea Wind Farm in the U.K. in August 2019 before the wind farm lost 737 MW of generation due to a transmission line fault, consequently leading to a major blackout event (Ofgem.gov, 2019); hence, it is important to understand reactive power oscillations in wind power plants and how they are affected by the grid conditions.
Near-synchronous resonance does not occur in wind power plants because of their interaction with the grid impedance: the impedance of a wind power plant near the fundamental frequency is generally higher than the grid impedance and they do not intersect around the fundamental frequency. Near-synchronous resonance, however, could occur because of interaction among slower control loops of wind turbines regulating the phasor quantities such as active and reactive power outputs and the magnitude of voltages at the point-of-interconnection (POI). Impedance-based stability analysis has proven effective for the evaluation and mitigation of control interactions in wind power plants (Sun, 2011; Ren and Larsen, 2016; Rygg et al., 2016; Shah et al., 2019a). The use of sequence impedances—positive-sequence and negative-sequence—has become a standard practice for the application of impedance-based stability analysis. Recent works have discovered the existence of coupling between the positive- and negative-sequence impedances of wind turbines and inverters because of frequency coupling effects (Rygg et al., 2016; Shah and Parsa, 2017); the coupling is shown to be dominant near the fundamental frequency. In fact, the coupling response during the impedance measurement of wind turbines is found to have the same magnitude or sometimes even higher magnitude than the direct response around the fundamental frequency (Shah et al., 2019b); hence, it must be considered for the accurate analysis of near-synchronous resonance problems. Impedance-based stability analysis considering the coupling effects, however, requires the application of more complicated generalized Nyquist criteria for multi-input multi-output systems (Shah and Parsa, 2017).
This paper presents impedance-based analysis of reactive power oscillations in a wind power plant using impedance measurements and power-hardware-in-the-loop (PHIL) experiments on a 4-MW Type III wind turbine with the help of a 13.8-kV, 7-MVA grid simulator. A new type of impedance, called power-domain impedance, is used to perform the analysis in terms of the phasor quantities including the active and reactive power outputs of the wind turbine as well as the frequency and magnitude of the voltages at the POI. The rest of the paper is organized as follows: Section reactive power oscillations in a wind power plant describes the reactive power oscillations observed during simulation studies of a wind power plant using a specific 4-MW Type III wind turbine product. Section power-domain impedance theory defines a new type of impedance, called power-domain impedance, for the analysis of active and reactive power oscillations in wind power plants. Section analysis of reactive power oscillations measures the power-domain impedance of the 4-MW wind turbine for understanding the source of the reactive power oscillations. Section power-hardware-in-the-loop experiments presents experiments demonstrating turbine-to-turbine reactive power oscillations by simulating a digital turbine inside a real-time digital simulator (RTDS) system. It also presents a simple droop-based solution to eliminate both plant-to-grid and turbine-to-turbine reactive power oscillations. Section conclusions presents the conclusions of this paper.
Reactive Power Oscillations in a Wind Power Plant
Reactive power oscillations were observed during simulation studies of a wind power plant using a specific 4-MW Type III wind turbine product. Figure 1 shows the single-line schematic diagram of the turbine. The rotor-side converter is connected to the rotor of the doubly-fed induction generator (DFIG), and the grid-side converter (GSC) at a low-voltage level is connected to the DFIG stator at a medium-voltage level via a transformer having leakage impedance of XXf_T. Figure 2 shows the plant-level arrangement of the wind turbines. Multiple wind turbines are connected in parallel and supply a collection transformer with leakage impedance XXf_CL. The grid is assumed inductive, and its impedance is denoted by Xg. In Figure 3, VT1 and XT1 are, respectively, the magnitude of the voltages at the terminals of Turbine 1 and the impedance of the connecting cable between Turbine 1 and the collection transformer. Similar notations are used for other turbines.
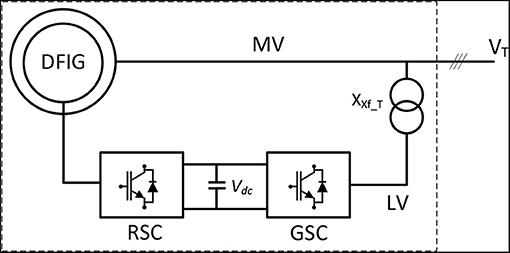
Figure 1. DFIG-based wind turbine with low-voltage + medium-voltage architecture.
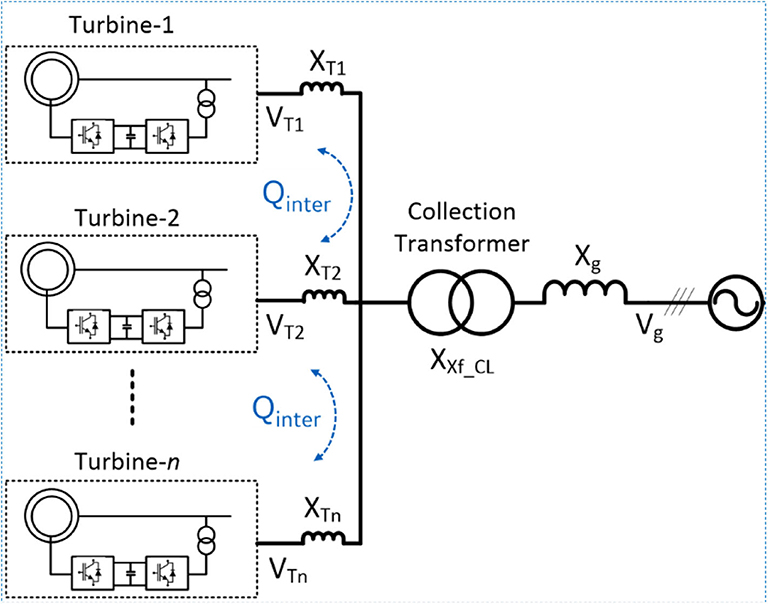
Figure 2. Plant-level collection of wind turbines.
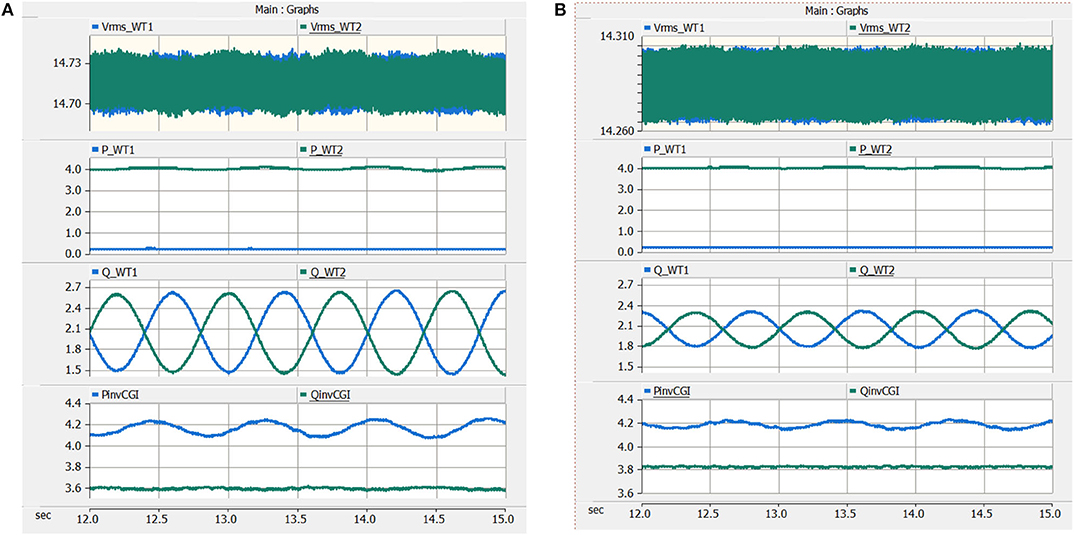
Figure 3. PSCAD simulations showing turbine-to-turbine reactive power oscillations and the effect of the grid impedance: (A) Lg = 8 mH and (B) Lg = 4 mH.
Simulation studies were conducted using PSCAD-EMTDC software by embedding the actual wind turbine controller firmware in the simulation models of the wind turbines. One study used two wind turbines in the plant-level collection (Turbine 1 and Turbine 2), as described in Figure 2. Turbine 1 is operated at cut-in wind speed with cut-in active power and rated reactive power output, whereas Turbine 2 is operated at rated wind speed with rated active power and reactive power output. Simulation results in Figure 3 show that the turbines are meeting the commanded active power set points (PT1 and PT2); however, there are sustained oscillations in the terminal voltages of each turbine (VT1 and VT2), which are also resulting in reactive power oscillations between the two turbines. Figure 3 also shows the impact of the grid strengths on turbine-to-turbine reactive power oscillations: the magnitude of the reactive power oscillations between the two turbines reaches ~1,200 kVAR when the grid inductance Lg is 8 mH, whereas it is 500 kVAR when the grid inductance Lg is 4 mH. This shows that a weaker grid increases the severity of reactive power oscillations between the wind turbines. Another interesting point to note from Figure 3 is that the reactive power oscillations between the two turbines do not result in significant oscillations in the reactive power input of the plant to the grid; somehow the grid impedance blocks the reactive power oscillations inside the farm from flowing into the grid. This behavior is evident in Figure 4, which shows the reactive power outputs of the two wind turbines and the reactive power input to the grid for two different grid strengths following a sudden change in the reactive power reference of Turbine 2. As evident, a higher grid impedance improves damping of the oscillations in the reactive power input to the grid. These two opposite behaviors—reduced damping of turbine-to-turbine reactive power oscillations and increased damping of plant-to-grid reactive power oscillations in the presence of significant grid impedance—are explained in the following sections.
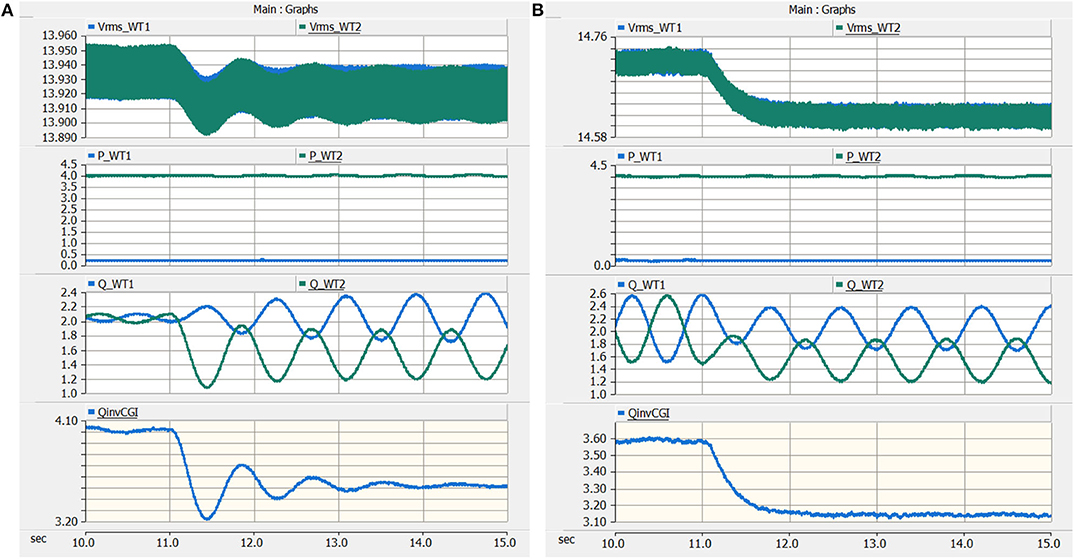
Figure 4. Response of wind turbines when the reactive power reference of Turbine 2 is reduced from 2 MVAR to 1.5 MVAR: (A) grid inductance Lg = 1 mH and (B) grid inductance Lg = 8 mH.
Power-Domain Impedance Theory
Active and reactive power oscillations in wind power plants—similar to those described in the previous section—result from interactions among the slower control loops of wind turbines regulating the phasor quantities such as the active and reactive power outputs of wind turbines as well as the magnitude and frequency of the voltages at the POI; hence, their analysis is much more insightful if the dynamics of the wind turbines are represented in terms of these phasor quantities instead of the phase variables including three-phase voltages and currents. This follows the same logic of using active and reactive power flows as well as the frequency, angle, and magnitude of bus voltages as state variables for analyzing the stability of bulk power systems (Kundur, 1994); hence, a new type of impedance and admittance transfer functions in terms of the phasor quantities are used in this paper for the analysis of active and reactive power oscillations in wind power plants. Such admittance is defined as a transfer function from the frequency and magnitude of voltages to the active and reactive power output at the POI. For instance, such admittance of a wind turbine can be defined as:
where F(s) and Vm(s) represent small-signal perturbations in the frequency and magnitude of voltages at the terminals of the wind turbine, respectively, and P(s) and Q(s) represent small-signal perturbations in the active and reactive power output of the turbine, respectively. Note that the Laplace variable s (= j2π fp) represents the complex perturbation frequency. The two-by-two transfer matrix in Equation (1) maps perturbations from the frequency and magnitude of voltages at the POI to the active and reactive power output of the wind turbine; it is termed as power-domain admittance. Power-domain impedance is similarly defined as the inverse of the power-domain admittance and it maps perturbations from the active and reactive power flow to the frequency and magnitude of the voltages at the POI:
Power-domain impedance and admittance responses can be used for impedance-based stability analysis (Sun, 2011) in a similar manner as other types of impedance and admittance transfer functions. Although the use of power-domain impedance for stability analysis is not common, it is worth mentioning that (Yang et al., 2016, 2020) used similar transfer functions for analyzing the stability of power electronic systems. Shah and Gevorgian (2019) used the transfer function gain from the active power input to the frequency of voltages at the POI, basically the ZFP(s) element of the impedance defined in Equation (2), for characterizing the frequency response of a power system network—it was shown that the measurement of ZFP(s) can be used to estimate system inertia and primary frequency response in real time. Shah et al. (2020) used power domain impedance measurements for evaluating inter-area modes in a two-area system and for designing damping controls in wind turbines and provide power system stabilizer (PSS) type functionality.
Analysis of Reactive Power Oscillations
Analysis of active and reactive power oscillations in a wind power plant can be performed with the highest level of accuracy if exact simulation models of the turbine generators, power converters, and control architecture with all the parameters are available; however, building analytical models of such complex system is very difficult and requires numerous simplifications. This section applies the power-domain impedance theory presented in the previous section for the analysis of reactive power oscillations observed in PSCAD simulations presented in section reactive power oscillations in a wind power plant.
Impedance Measurement Testbed
Figure 5 shows the setup at the National Renewable Energy Laboratory (NREL) in Colorado, United States, used for the impedance measurement of the 4-MW Type III wind turbine involved in reactive power oscillations that observed in the simulation study in section reactive power oscillations in a wind power plant. Figure 5A shows a 13.8-kV/7-MVA grid simulator, called the controllable grid interface (CGI), which was commissioned in 2013–2014 (Koralewicz et al., 2016). The CGI is the centerpiece of the grid integration testbed at NREL, and it is used for many open-loop tests of wind turbines and inverters, including low- and high-voltage ride-through tests, testing of fault and transient performance, and impedance measurements. It is also used for closed-loop PHIL experiments by simulating a power system network inside an RTDS system interfaced with the CGI. The CGI is essentially a voltage amplifier of 7-MVA rating that generates high power-quality voltage waveforms for testing different equipment. It features a high bandwidth of 1,000 Hz, which allows injection of sinusoidal voltage perturbations at frequencies ranging from 0.1 to 1,000 Hz. The reference for the voltage perturbations for the impedance measurement is generated inside the RTDS and commanded to the CGI using a 2 Gbit/s optical fiber. Automation of the impedance measurement, including the selection of the perturbation magnitude and frequency, and post-processing of measurements is performed by a console PC using MATLAB. More details on the impedance measurement system can be found in Shah et al. (2019b).
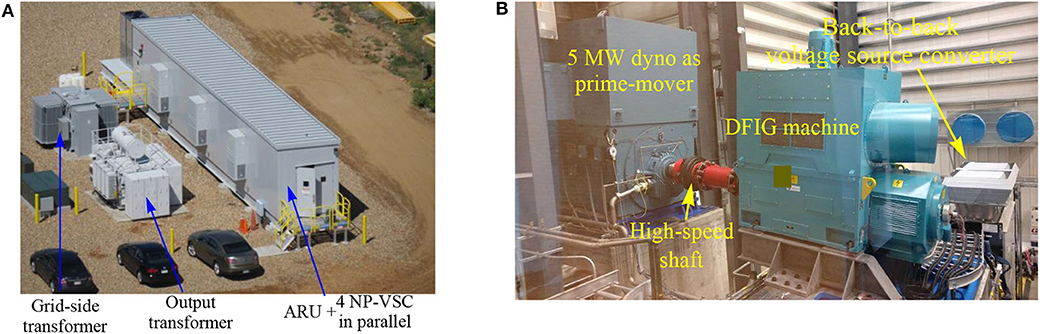
Figure 5. Impedance measurement of a 4-MW Type III wind turbine drivetrain at NREL. (A) 13.8-kV/7-MVA grid simulator used as perturbation source for impedance measurement and (B) 4-MW Type III wind turbine drivetrain. Source: NREL.
Figure 5B shows the drivetrain of the 4-MW turbine; it consists of a DFIG generator with a medium voltage output, back-to-back voltage source converters, a transformer for stepping up the voltages from power converters to a medium voltage level, and necessary switchgears. The gearbox of the wind turbine is not included because it does not influence the electrical dynamics of the turbine; hence, the high-speed shaft of the DFIG generator is connected directly to a 5-MW dynamometer motor.
Power-Domain Admittance of the 4-MW Wind Turbine
The power-domain admittance of a wind turbine can be measured by injecting perturbations in the frequency and magnitude of voltages at its terminals and measuring the response in its active and reactive power outputs. The CGI is used for injecting perturbations in the magnitude and frequency of the voltages at the terminals of the 4-MW wind turbine drivetrain. Figure 6 shows measurements during an injection of 1% (0.01 p.u.) perturbation in the voltage magnitude at 7 Hz perturbation frequency. The noise in the measurements is because of the switching harmonics from the CGI and the turbine. Figure 6 shows that the response in the reactive power output of the turbine is much more pronounced than the response in the active power output. This shows that the magnitude of YQV(s) is significantly larger than the magnitude of YPV(s) at 7 Hz. Note that YPV(s) and YQV(s) are two elements of the power-domain admittance defined in Equation (1). The same process is repeated by injecting perturbations in the frequency of the voltages to obtain responses of YPF(s) and YQF(s). This process is repeated for different perturbation frequencies to obtain the power-domain admittance response from 0.1 to 100 Hz.
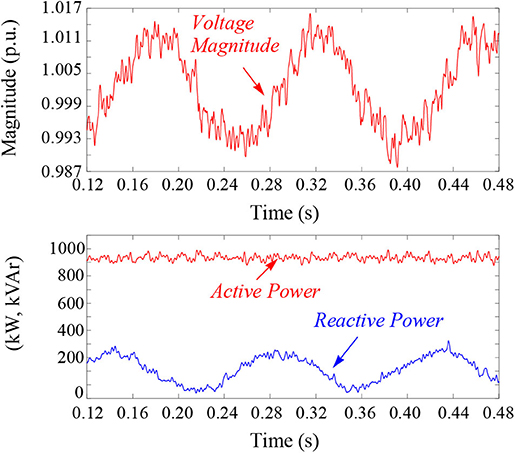
Figure 6. Injection of 1% (0.01 p.u.) sinusoidal perturbation at 7 Hz in the magnitude of voltages at the terminals of the 4-MW wind turbine drivetrain using the CGI: (top) magnitude of perturbed voltages at the terminals of the wind turbine and (bottom) active and reactive power output of the wind turbine.
Figure 7 shows the power-domain admittance response of the 4-MW wind turbine drivetrain measured using the CGI. As evident from Figure 6, the power-domain admittance is measured when the nominal active and reactive power output from the 4-MW turbine are ~900 kW and 100 kVAr, respectively. Figure 7 shows that at frequencies less than 10 Hz, the magnitude of YQV(s) is significantly higher than the magnitude of YPV(s). Moreover, the responses in Figure 7 also show an underdamped resonant peak at 1.2 Hz in YQV(s). Hence, the reactive power oscillations at 1.2 Hz described in section reactive power oscillations in a wind power plant can be attributed to the underdamped resonant mode in YQV(s). The manifestation of this 1.2-Hz mode as turbine-to-turbine and plant-to-grid reactive power oscillations is discussed in the following sections.
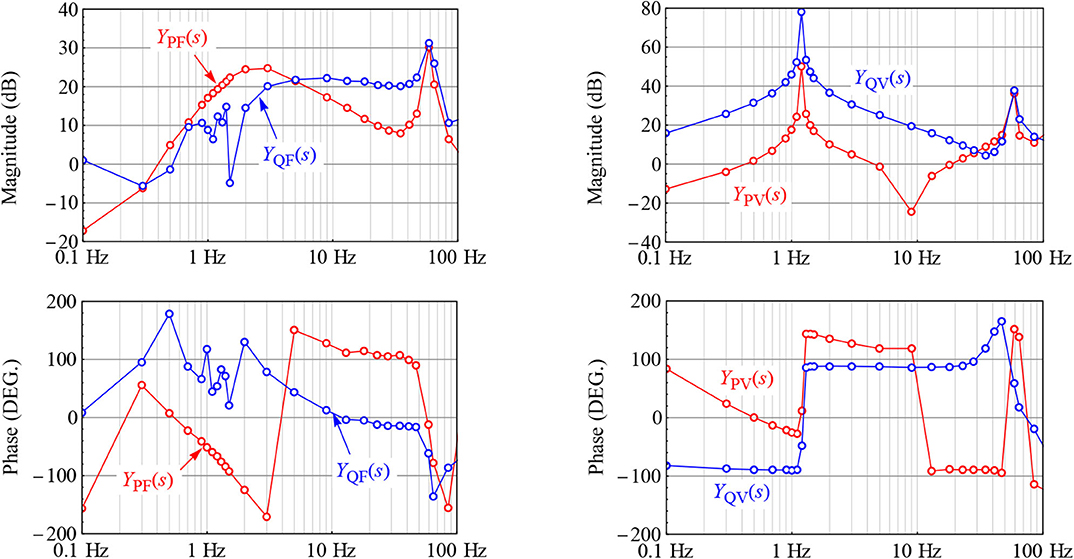
Figure 7. Power-domain admittance response of a 4-MW wind turbine drivetrain. Magnitude responses are plotted in per unit dB, and phase responses are plotted in degrees. The base values used are 1 MW for the active power output, 1 MVAR for the reactive power output, 13.2 kV for line-to-line voltages RMS, and 60 Hz for frequency.
Power-Domain Impedance of Grid
It is important to model the power-domain impedance of the grid to understand how the 1.2-Hz resonant mode in the reactive power dynamics of the 4-MW wind turbine manifest as plant-to-grid and turbine-to-turbine reactive power oscillations. The grid is assumed to be inductive around the frequency of oscillations. Figure 8A shows a representation of the grid as an inductor in front of an ideal voltage source; the latter represents the internal voltage of the grid. Figure 8B shows a phasor diagram of describing the relationship between the internal voltage of the grid and the voltage at the POI. The black lines show steady-state phasors, and the blue lines show the effect of small-signal perturbations at low frequencies. Note in Figure 8B that variables in bold letters represent phasors, variables in uppercase letters represent steady-state values, and variables in lowercase letters with “hat” represent a small-signal disturbance superimposed on the steady-state values. The instantaneous active and reactive power inputs to the grid can be written in terms of the dq-axis components of the voltages and currents at the POI as:
Linearizing Equations (3) and (4) gives:
where V1 is the peak of the phase-to-neutral voltages, which is the same as the steady-state value of vd; and Id and Iq represent, respectively, the steady-state values of the d- and q-axis components of currents entering the grid. The variables with “hat” represent small-signal perturbations.
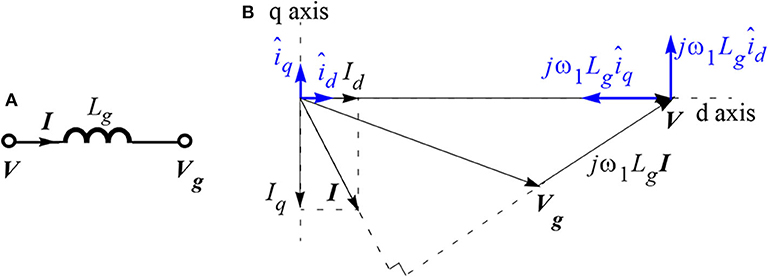
Figure 8. Calculation of ZVQ(s) of an inductive grid, the transfer function from the reactive power input to the grid to the magnitude of voltages at the point-of-interconnection: (A) grid represented by an inductive impedance behind a voltage source and (B) phasor diagram.
If the perturbation frequency is assumed to be much smaller than the fundamental frequency, the small-signal perturbations in id, iq and vd, vq can be related depending on the grid inductance, Lg, as:
These relationships are shown in Figure 8B using blue lines. Substituting Equation (7) in Equations (5) and (6), we get:
Inverting the matrix in Equation (8), we get:
Equation (9) maps perturbations in the active and reactive power input to an inductive grid to the d- and q-axis components of the voltages at the POI. Because the d-axis is aligned with the voltages at the POI, the perturbation in the dq components of the voltages can be related with the perturbation in the magnitude and frequency of the voltages at the POI as follows (Shah and Parsa, 2017; Shah and Gevorgian, 2019):
The relation between Vq(s) and F(s) in Equation (10) follows from the fact that the perturbation in vq is directly proportional to the perturbation in the phase of the POI voltages, the latter can be related with the perturbation in the frequency of the POI voltages (Shah and Parsa, 2017). Using Equation (10) in Equation (9), we get the power-domain impedance of the grid as:
Equation (11) is valid only at low frequencies because of the approximation made in Equation (7).
Based on the power-domain admittance response of the 4-MW wind turbine in Figure 7, it can be assumed that the coupling between the voltage magnitude and the reactive power output of the wind turbine dominates the dynamics of the reactive power oscillations, and the analysis of reactive power oscillations analysis can focus only on the relationship between the voltage magnitude and the reactive power flow. The absence of significant active power oscillations in the presence of substantial reactive power oscillations in the simulations results shown in Figures 3, 4 proves further that the active power flow dynamics can be ignored during the analysis of low-frequency reactive power oscillations. Hence, we can focus only on the ZVQ(s) element of the power-domain impedance of the grid derived in Equation (11) as:
The expression in Equation (12) can be simplified further by noting that the peak of the phase voltages, V1, is significantly higher than the voltage drop across the grid inductance:
When the 4-MW wind turbine drivetrain shown in Figure 5B is connected to the CGI, the grid impedance seen by the turbine consists only of the leakage inductance of the CGI output transformer, which is 8 mH; hence, the grid inductance Lg seen by the turbine is 8 mH. To verify the expression for ZVQ,grid(s) derived in Equation (13), a 1-MW/1-MWh battery energy storage system (BESS) interfaced by a 2.2-MVA inverter is used to inject reactive power perturbations into the CGI. The 4-MW turbine is kept disconnected from the CGI during this test. Figure 9 compares the response of ZVQ,grid(s) predicted by Equation (13) against experimental measurements.
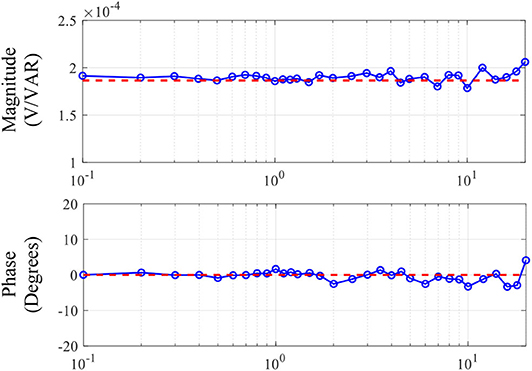
Figure 9. Response of the ZVQ(s) element of the power-domain impedance of the grid. It shows the frequency-dependent gain from the reactive power injected into the grid to the magnitude of voltages at the POI. Dashed lines: theoretical prediction for Lg = 8 mH based on Equation (13), and solid lines with circles: experimental measurements.
Equivalent Circuit Analysis
The responses of YQV(s) of the 4-MW turbine shown in Figure 7 and ZVQ(s) of the grid shown in Figure 9 can be represented using a simple equivalent circuit for the analysis of reactive power oscillations. It can be shown that the response of YQV(s) of the 4-MW turbine at frequencies <20 Hz can be approximated by a second-order transfer function:
The parameters of the second-order transfer function in Equation (14) for fitting it with the response of YQV(s) in Figure 7 are obtained as k = 540, ωo = 2π·1.2 rad/s, and ζ = 0.005. Note the low value of ζ because of the poorly damped resonant mode at 1.2 Hz in YQV(s). Such a second-order transfer function can be realized by a series R-L-C branch, where the current coming out of the branch represents the reactive power output of the wind turbine, and the voltage across the branch represents the magnitude of the voltages at the terminals of the wind turbine.
Based on Equation (13), ZVQ,grid(s) is constant at low frequencies; hence, it can be represented by a resistor with the current entering the resistor representing the reactive power input to the grid and the voltage across the resistor representing the magnitude of the voltages at the POI. To combine this resistor with the equivalent circuit of the wind turbines, it must be per-unitized because the response of YQV(s) used for obtaining the parameters of the approximation in Equation (14) is in per unit.
Figure 10 shows the equivalent circuit representation of the reactive power dynamics of two wind turbines supplying to an inductive grid. The reactive power outputs of the two wind turbines act as current outputs from two parallel connected R-L-C branches, and they are denoted in Figure 10 by q1 and q2, respectively. The reactive power entering the grid, which is equal to the sum of q1 and q2, is denoted by qg. The voltage across parallel R-L-C branches in Figure 10, vm, is equivalent to the magnitude of the three-phase voltages at the terminals of the wind turbines. The parameters of the R-L-C branches representing the YQV(s) admittance of the wind turbines are obtained by comparing the admittance transfer function of the RLC branch with the approximation of YQV(s) in Equation (14) using a second-order transfer function:
Figure 10 is an equivalent circuit representation of the dynamics of the reactive power flowing between the wind turbines and the grid and the voltages and currents defined in Figure 10 do not have the usual physical meaning; q1, q2, and qg represent instantaneous reactive power flows, and vm represents the instantaneous magnitude of the voltages at the POI. This is the reason why the units of the R-L-C branch parameters are not defined in Equation (15).
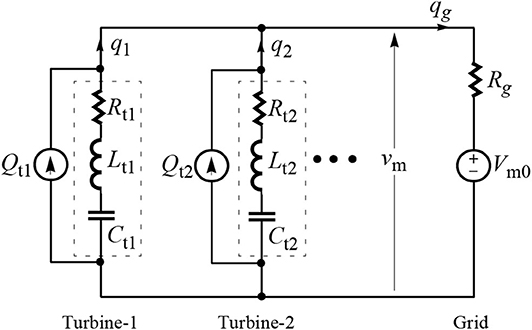
Figure 10. Equivalent circuit describing the small-signal relationship between the reactive power flows from two wind turbines to the grid (q1, q2, and qg) and the magnitude of the voltages at the POI (vm).
The resistor Rg in Figure 10 represents ZVQ,grid(s) in per unit, which is obtained in terms of the grid inductance Lg using Equation (13) as:
Qt1 and Qt2 in Figure 10 represent steady-state reactive power outputs from wind turbines in per unit, and Vm0 represents the steady-state magnitude of the voltages at the POI in per unit. The effects of the connecting cables between the wind turbines and the grid on the reactive power flow dynamics are ignored in Figure 10 by assuming that the voltage drop across the cables is negligible.
Figure 10 has one interesting inference, which is that the grid inductance behaves like a resistor in the context of reactive power dynamics, and a higher grid impedance during weak grid conditions increases the value of this resistance, which signifies higher damping in the circuit; hence, based on Figure 10, the reactive power oscillations between the wind turbines and the grid will have a higher damping during weak grid conditions. This explains the simulated responses in Figure 4, which shows that the oscillations in the reactive power input to the grid have higher damping when the grid impedance is high. The experimental results shown in Figure 11 on the 4-MW wind turbine also confirm that reactive power oscillations between the 4-MW wind turbine and the grid have higher damping when the grid impedance is high. The strong grid condition in Figure 11A is achieved by compensating the leakage inductance of the CGI transformer via emulation of a negative inductance inside the CGI control system. Note that the oscillations in the reactive power output of the 4-MW wind turbine as shown in Figure 11A are quite similar to those observed in the Hornsea Wind Farm in the U.K. before the August 2019 blackout event (Ofgem.gov, 2019).
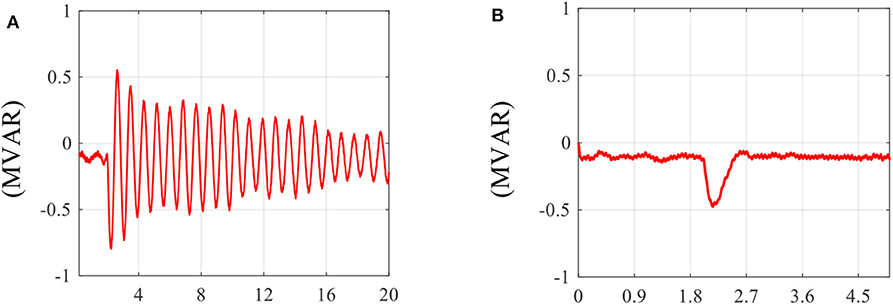
Figure 11. Reactive power output of the 4-MW wind turbine drivetrain when the magnitude of the voltages at the POI is increased by 100 V (rms) at t = 2 s: (A) strong grid, Lg = 0; and (B) weak grid, Lg = 8.0 mH.
The second inference from Figure 10 is that even though an inductive grid impedance damps the reactive power oscillations between the wind turbines and the grid, it does not reduce the risks of turbine-to-turbine reactive power oscillations. It can be seen from the equivalent circuit in Figure 10 that the impedance seen by a turbine is the parallel combination of the impedance of the other turbine and the grid impedance; hence, if the grid impedance is very low, the impedance seen by each turbine will be dominated by the grid impedance. On the other hand, for a weak grid condition, because the grid impedance is high, the impedance seen by each turbine will be dominated by the impedance of the other turbine; hence, reactive power oscillations between wind turbines will be more severe for a weak grid condition. This is confirmed by the simulated responses shown in Figure 3.
In summary, the equivalent circuit analysis in this section showed that a reactive power oscillation mode in wind turbines will manifest as turbine-to-turbine and/or plant-to-grid reactive power oscillations depending on the impedance characteristics of the grid. Moreover, an inductive grid damps plant-to-grid reactive power oscillations; hence, oscillations in the reactive power output of a wind power plant are less likely during its operation with weaker grids. However, a weak inductive grid does not help mitigate turbine-to-turbine reactive power oscillations.
Power-Hardware-in-the-Loop Experiments
Setup
The PHIL experiment was setup to study reactive power oscillations between wind turbines and evaluate mitigation strategies. Figure 12 shows the schematic of the setup. The 4-MW wind turbine drivetrain is connected to the CGI, as discussed before for the power-domain impedance measurement. Additionally, as shown in Figure 12, an RTDS simulator interfaced with the CGI is used to digitally simulate an inductive grid with inductance Lsim. The CGI control system also has an internal algorithm to compensate for the inductive impedance of the CGI output transformer; this compensation algorithm was used to emulate a very strong grid (Lg = 0) to obtain the test result shown in Figure 11A. The compensation algorithm essentially emulates a negative inductance, denoted by Ltc in Figure 12, to compensate the impedance of the CGI output transformer; note that Ltc is zero when the compensation algorithm is deactivated. To analyze reactive power oscillations between wind turbines, a wind turbine is simulated digitally inside the RTDS; it is denoted by WTsim in Figure 12. The grid inductance Lg faced by the real 4-MW turbine and the digital turbine can be tuned to any desired value by changing the value of the simulated inductance Lsim shown in Figure 12. Either of the two wind turbines, real and simulated, can be either connected or disconnected from the CGI, respectively, using a physical breaker, S1, and a simulated breaker, S2. For completeness, Figure 12 also shows the 1-MW/1-MWh BESS used to inject reactive power perturbations to obtain responses of the ZVQ(s) element of the power-domain impedance of the network seen by the 4-MW turbine. The BESS is disconnected during PHIL experiments analyzing turbine-to-turbine oscillations between the real and simulated wind turbines.
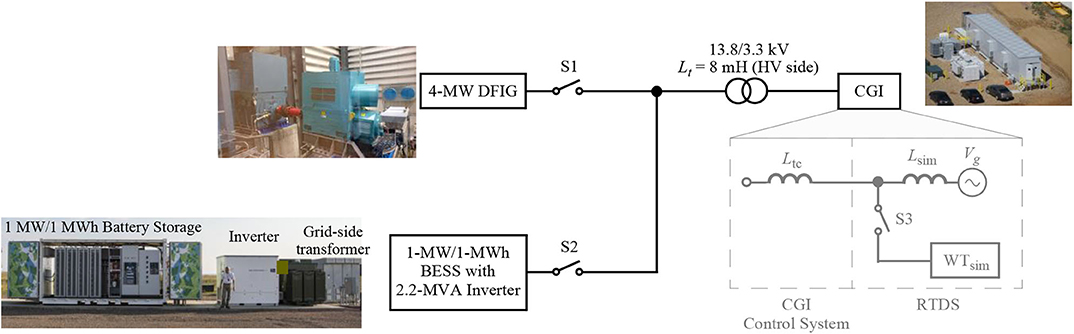
Figure 12. PHIL setup consisting of a 4-MW DFIG-based TYPE III wind turbine drivetrain coupled to a 5-MW dynamometer, 7-MVA grid simulator (CGI), 1-MW/1-MWh BESS, and a digital wind turbine simulated inside an RTDS system coupled with the CGI. Source: NREL.
The simulated wind turbine captures only the reactive power dynamics of the 4-MW wind turbine; it basically emulates the response of the YQV(s) element of the power-domain admittance. To implement the response of the YQV(s) element in RTDS, the magnitude of voltages at the POI of the simulated turbine is first calculated using Clark's transformation. The voltage magnitude signal is then passed through a second-order transfer function approximation of the YQV(s) response of the real 4-MW turbine to generate reference for the reactive power output of the simulated turbine. The filtered version of the voltage magnitude signal and a phase locked loop (PLL) are used for deriving commands for a three-phase controllable current source depending on the reactive power reference output from the second-order transfer function approximation of YQV(s). Because the simulated turbine captures only the reactive power dynamics of the real 4-MW turbine, this setup can be used only for the evaluation of reactive power oscillations. Future work will develop a detailed EMT model of the 4-MW wind turbine inside RTDS to evaluate other types of interactions between the wind turbines.
Validation of the PHIL System
The PHIL system using the CGI and RTDS is a relatively complex system with multiple controllers, limiters, delays, and delay compensation mechanisms, all running simultaneously in real time; hence, it is important to validate the PHIL setup to ensure that it correctly represents the intended dynamic behavior. For this paper, the dynamic characteristic of interest is the relation between the reactive power flow and the voltage magnitude. To validate such dynamic characteristics of the PHIL system—which includes the 4-MW wind turbine, the CGI, PHIL interface between the CGI and RTDS, and the simulated grid and wind turbine models inside the RTDS—the testbed shown in Figure 12 is reconfigured by closing switch S2 and opening switch S1. The BESS is then used to inject reactive power perturbations with perturbation frequency ranging from 0.1 to 20 Hz while maintaining its active power output at zero. Voltages and currents are measured at the POI and postprocessed to obtain the response of the ZVQ(s) element of the power-domain impedance of the simulated network; the real 4-MW turbine is kept disconnected during validation tests by keeping the switch S1 open. Such validation essentially verifies whether the power-domain impedance of the simulated grid and the simulated wind turbine measured at the POI match the analytical model.
In the first part of the PHIL system validation, the simulated network includes only the simulated grid whereas the simulated turbine WTSim is disconnected by opening switch S3. Three different values of the simulated grid inductances are used for the validation, Lsim = {4,8,12} mH. Figure 13 shows the measured responses of ZVQ(s) for these three values of the grid inductance compared with analytical predictions using Equation (13). The responses confirm that the PHIL system accurately represents the reactive power dynamics of the simulated grid in the frequency range of interest. In the second part of the PHIL system validation, the response of ZVQ(s) is measured after closing switch S3; this connects the simulated wind turbine in parallel with the simulated grid. The measured response of ZVQ(s) of the PHIL system including the simulated grid and the simulated turbine matches well with the analytical prediction as shown in Figure 13. The validation shows that the CGI+RTDS system accurately emulates the reactive power dynamics of the simulated grid and turbine within the frequency range of interest.
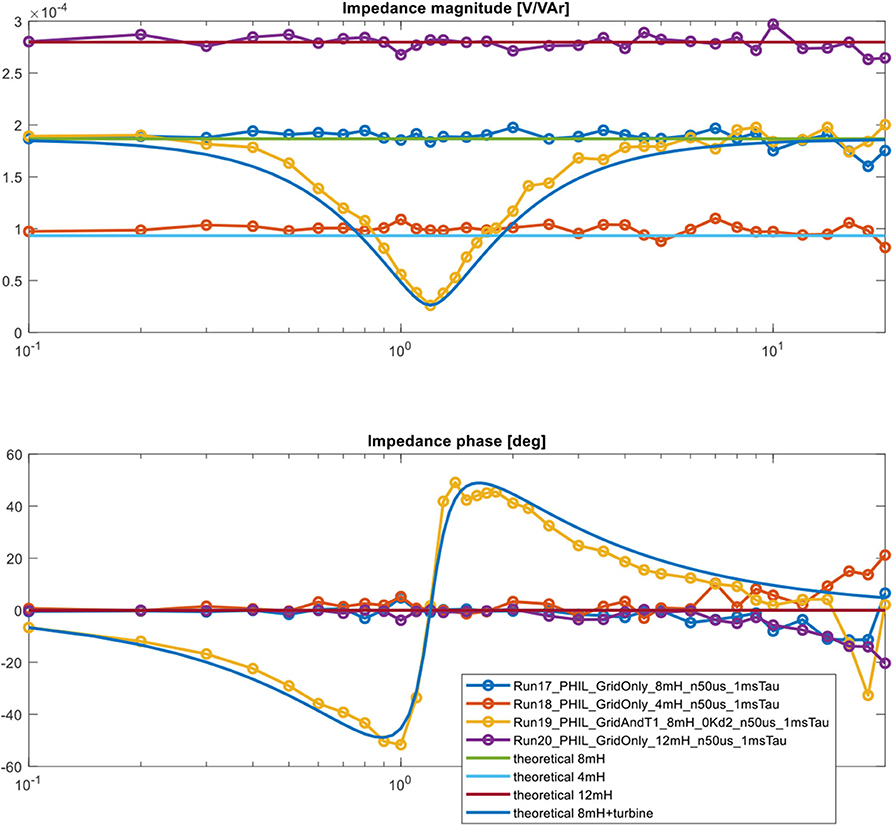
Figure 13. Validation of the PHIL system performed by comparing the measured responses of the ZVQ(s) element of the power-domain impedance of the network simulated inside RTDS with the analytical predictions. The measurements are performed by injecting reactive power perturbations at different frequencies using a 1-MW/1-MWh BESS.
Turbine-to-Turbine Reactive Power Oscillations
Now that it is verified that the PHIL setup accurately emulates the reactive power dynamics of the simulated grid and the simulated wind turbine, it is possible to create turbine-to-turbine reactive power oscillations between the real 4-MW wind turbine and the simulated wind turbine similar to those observed during the simulation study in section reactive power oscillations in a wind power plant. Figures 14A,B show the reactive power outputs of the real and simulated wind turbines along with the reactive power input to the grid for two sets of experiments. As shown in Figure 14A, the two turbines burst into sustained reactive power oscillations following a small disturbance with the oscillation frequency of 1.2 Hz, matching the frequency of the resonant mode discovered in the power-domain admittance response of the 4-MW turbine. The grid inductance Lg for this test is kept at 8 mH. Based on the equivalent circuit analysis in Figure 10, it is inferred that the grid inductance blocks plant-to-grid reactive power oscillations, but it does not provide damping to turbine-to-turbine reactive power oscillations. This is verified in Figure 14A, where the reactive power oscillations are restricted only between the turbines, and the reactive power input to the grid stays almost constant.
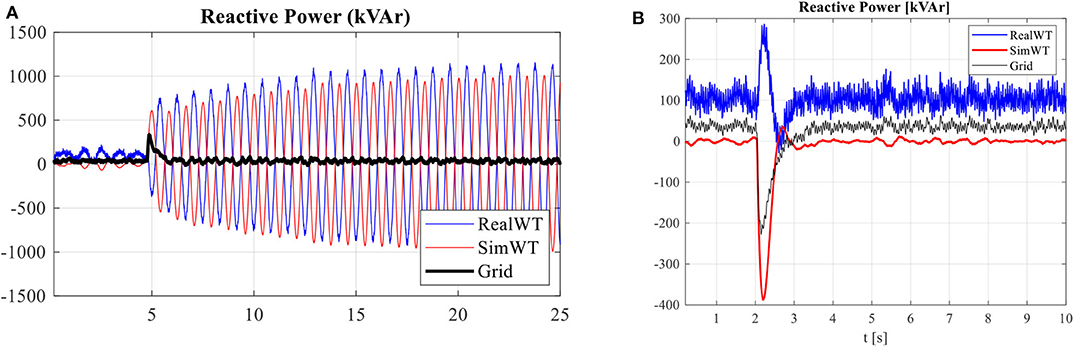
Figure 14. Turbine-to-turbine reactive power oscillations. (A) A real 4-MW turbine and a simulated 4-MW turbine burst into oscillations and start exchanging reactive power at 1.2-Hz oscillation frequency with peak-to-peak magnitude of around 2 MVAR. Note that the reactive power input to the grid remains unaffected. (B) Mitigation of reactive power oscillations by Q-V droop control inside wind turbines; the droop gain kdroop was kept 1 ×10⁻⁸ for obtaining this result.
It was shown before that an inductor behaves like a resistor at low frequencies in the context of the reactive power dynamics; hence, any inductive impedance between wind turbines can damp turbine-to-turbine reactive power oscillations. It is more cost effective, however, if the damping is provided by updating the controller firmware of the wind turbines. The required resistive behavior in the reactive power dynamics of wind turbines can be emulated by introducing a droop control between the reactive power output of the wind turbine and the magnitude of voltages at the POI. This is equivalent to increasing the value of the resistance Rt in the R-L-C branches shown in Figure 10. Figure 15 shows measurements of the YQV(s) element of the power-domain admittance of the 4-MW wind turbine for different values of the Q-V droop gains, denoted by kdroop. Clearly, a higher droop gain improves damping of the 1.2 Hz resonant mode in the reactive power dynamics of the wind turbine. Figure 14B repeats the test used for obtaining the measurements shown in Figure 14A with the Q-V droop control inside the wind turbines. The droop control effectively damps the 1.2 Hz resonant mode and mitigates both turbine-to-turbine and plant-to-grid reactive power oscillations.
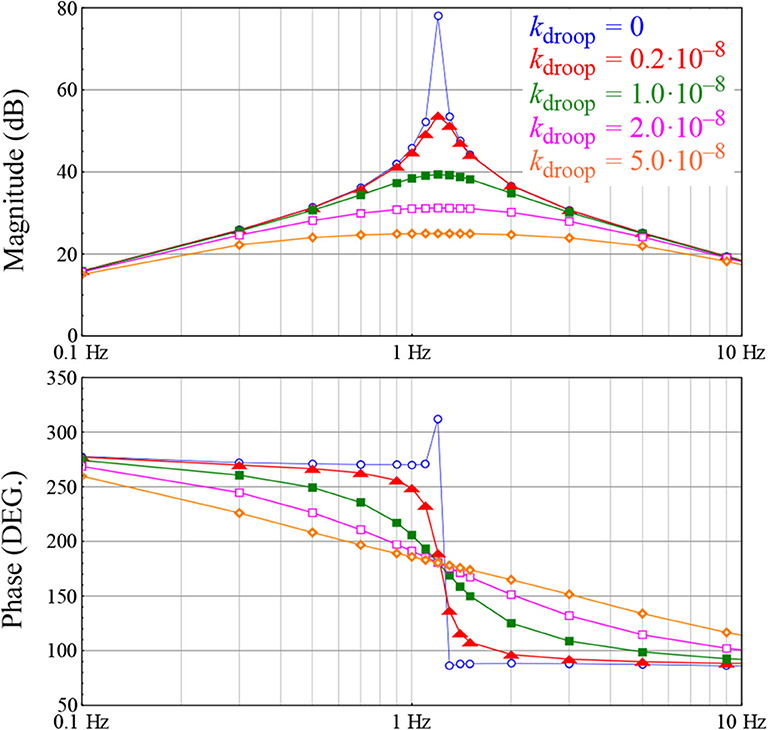
Figure 15. Response of the YQV(s) element of the power-domain admittance of the 4-MW wind turbine for different values of the droop gain kdroop. YQV(s) is defined as a transfer function from the magnitude of the voltages at the POI to the reactive power output of the wind turbine.
Conclusions
This paper studied reactive power oscillations in a wind power plant using an impedance-based approach. A new type of impedance, called power-domain impedance, is used for the analysis of active and reactive power oscillations in wind power plants. Power-domain impedance measurements and PHIL experiments are conducted on a 4-MW wind turbine to identify the source of reactive power oscillations observed during simulation studies of a wind power plant using the same 4-MW wind turbine. The specific reactive power oscillation problem presented in this paper was found to emerge from an underdamped resonant mode inside the wind turbine. The paper showed that reactive power oscillations in wind power plants can be damped using reactive power droop control in wind turbines. The paper also showed that an inductive grid impedance at the POI of a wind power plant during weak grid conditions damps oscillations in the reactive power output of the wind power plant; interestingly the reactive power oscillations between a wind power plant and the grid could be more severe during strong grid conditions. The paper presented the power-domain impedance measurement as an effective tool for the analysis and mitigation of active and reactive power oscillations in wind power plants.
Data Availability Statement
The raw data supporting the conclusions of this article will be made available by the authors, without undue reservation, to any qualified researcher.
Author Contributions
PK designed and performed all experiments and contributed to the writing of this paper. SS led manuscript preparation, modeling, and analysis for this study. VG and RW supported experiments and helped with analysis through constructive discussions. KJ and KG performed PSCAD simulations for this study and supported with the control of the wind turbine. DM supported experiments by ensuring that the 4-MW wind turbine stayed within the safe operation zone. AT participated in constructive discussions and provided coordination among different teams. All authors have read and approved the final manuscript.
Funding
This work was authored in part by Alliance for Sustainable Energy, LLC, the manager and operator of the National Renewable Energy Laboratory for the U.S. Department of Energy (DOE) under Contract No. DE-AC36-08GO28308. Funding provided by U.S. Department of Energy Office of Energy Efficiency and Renewable Energy Wind Energy Technologies Office.
Conflict of Interest
KJ, DM, KG, and AT were employed by the company General Electric.
The remaining authors declare that the research was conducted in the absence of any commercial or financial relationships that could be construed as a potential conflict of interest.
Acknowledgments
The views expressed in the article do not necessarily represent the views of the DOE or the U.S. Government. The U.S. Government retains and the publisher, by accepting the article for publication, acknowledges that the U.S. Government retains a nonexclusive, paid-up, irrevocable, worldwide license to publish, or reproduce the published form of this work, or allow others to do so, for U.S. Government purposes.
The authors thank Jian Fu of the U.S. Department of Energy's Wind Energy Technologies Office for her feedback and continuous support of this project.
References
Buchhagen, C., Greve, M., Menze, A., and Jung, J. (2016). “Harmonic stability–practical experience of a TSO,” in Proceedings 15th Wind Integration Workshop (Vienna).
Cheng, Y., Huang, S. H., Rose, J., Pappu, V. A., and Conto, J. (2019). Subsynchronous resonance assessment for a large system with multiple series compensated transmission circuits. IET Renew. Power Gener. 13, 27–32. doi: 10.1049/iet-rpg.2018.5254
Cheng, Y., Sahni, M., Muthumuni, D., and Badrazadeh, B. (2013). Reactance scan crossover-based approach for investigating SSCI concerns for DFIG-based wind turbines. IEEE Trans. Power Del. 28, 1858–1869. doi: 10.1109/TPWRD.2012.2223239
Gross, L. C. (2010). “Sub-synchronous grid conditions: new event, new problem, and new solutions,” in Proceesings Western Protective Relay Conference (Spokane, WA), 1–19.
Knuppel, T., Kumar, S., Thuring, P., Stottrup, M., and Friman, J. (2012). “Towards a reactive power oscillation damping controller for wind power plant based on full converter wind turbines,” in Proc. 2012 IEEE Power and Energy Soc. Gen. Meeting (PESGM) (San Diego, CA).
Koralewicz, P., Gevorgian, V., Wallen, R., ven der Merwe, W., and Jorg, P. (2016). “Advanced grid simulator for multimegawatt power converter testing and certification,” in Proc. 2016 IEEE Energy Conv. Cong. Expo. (ECCE) (Milwaukee, WI).
Liu, H., Xie, X., Gao, X., Liu, H., and Li, Y. (2018). Stability analysis of SSR in multiple wind farms connected to series-compensated systems using impedance network model. IEEE Trans. Power Syst. 33, 3118–3128. doi: 10.1109/TPWRS.2017.2764159
Lyu, J., Cai, X., and Molinas, M. (2016). Frequency domain stability analysis of MMC-based HVdc for wind farm integration. IEEE J. Emerg. Sel. Topics Power Electron. 4, 141–151. doi: 10.1109/JESTPE.2015.2498182
Ofgem.gov (2019). Technical Report on the Events of 9 August 2019. Available online at: https://www.ofgem.gov.uk/system/files/docs/2019/09/eso_technical_report_-_final.pdf (accessed July 15, 2020).
Ren, W., and Larsen, E. (2016). A refined frequency scan approach to sub-synchronous control interaction (SSCI) study of wind farms. IEEE Trans. Power Syst. 31, 3904–3912. doi: 10.1109/TPWRS.2015.2501543
Rygg, A., Molinas, M., Zhang, C., and Cai, X. (2016). A modified sequence-domain impedance definition and its equivalent to the dq-domain impedance definition for the stability analysis of ac power electronic systems. IEEE J. Emerg. Sel. Topics Power Electron. 4, 1383–1396. doi: 10.1109/JESTPE.2016.2588733
Shah, S., and Gevorgian, V. (2019). “Impedance-based characterization of power system frequency response,” in Proc. 2019 Power and Energy Soc. Gen. Meeting (PESGM) (Atlanta, GA).
Shah, S., Gevorgian, V., and Liu, H. (2019a). “Impedance-based prediction of SSR-generated harmonics in doubly-fed induction generators,” in Proc. 2019 IEEE Power Energy Soc. Gen. Meet. (PESGM) (Atlanta, GA).
Shah, S., Koralewicz, P., Gevorgian, V., and Wallen, R. (2019b). “Impedance measurement of wind turbines using a multimegawatt grid simulator,” in Proc. 18th Wind Integr. Workshop (Dublin, Ireland). Available online at: https://www.nrel.gov/docs/fy20osti/74890.pdf (accessed July 15, 2020).
Shah, S., and Parsa, L. (2017). Impedance modeling of three-phase voltage source converters in DQ, sequence, and phasor domains. IEEE Trans. Energy Conv. 32, 1139–1150. doi: 10.1109/TEC.2017.2698202
Shah, S., Yan, W., Gevorgian, V., and Gao, W. (2020). “Power-domain impedance theory for the analysis and mitigation of interarea oscillations,” in Proc. 2020 Power and Energy Soc. Gen. Meeting (PESGM). Available online at: https://www.nrel.gov/docs/fy20osti/75273.pdf (accessed July 15, 2020).
Sun, J., Zhang, Z., Xu, T., He, J., Wang, H., and Li, G. (2017). Renewable energy transmission by HVDC across the continent: system challenges and opportunities. CSEE J. Power Energy Syst. 3, 353–364. doi: 10.17775/CSEEJPES.2017.01200
Sun,. J. (2011). Impedance-based stability criterion for grid-connected inverters. IEEE Trans. Power Electron. 26, 3075–3078. doi: 10.1109/TPEL.2011.2136439
Xie, X., Zhang, X., Liu, H., Liu, H., Li, Y., and Zhang, C. (2017). Characteristic analysis of subsynchronous resonance in practical wind farms connected to series-compensated transmissions. IEEE Trans. Energy Conv. 32, 1117–1126. doi: 10.1109/TEC.2017.2676024
Yang, D., Ruan, X., Wu, H., Chen, X., and Zhao, W. (2016). “General power control methods for distributed generation sources and its stability analysis based on unified power models,” in Proc. 2016 IEEE 8th Int. Power Electron. Motion Control Conf. (IPEMC-ECCE Asia) (Hefei).
Yang, Z., Mei, C., Cheng, S., and Zhan, M. (2020). Comparison of impedance model and amplitude-phase model for power-electronics-based power system. IEEE J. Emerg. Sel. Topics Power Electron. doi: 10.1109/JESTPE.2019.2927109. [Epub ahead of print].
Keywords: wind power plants, stability, subsynchronous oscillations, impedance analysis, power-hardware-in-the-loop experiments, reactive power oscillations
Citation: Koralewicz P, Shah S, Gevorgian V, Wallen R, Jha K, Mashtare D, Gadiraju KVR and Tiwari A (2020) Impedance Analysis and PHIL Demonstration of Reactive Power Oscillations in a Wind Power Plant Using a 4-MW Wind Turbine. Front. Energy Res. 8:156. doi: 10.3389/fenrg.2020.00156
Received: 24 February 2020; Accepted: 22 June 2020;
Published: 31 July 2020.
Edited by:
Marta Molinas, Norwegian University of Science and Technology, NorwayReviewed by:
Jing Lyu, Shanghai Jiao Tong University, ChinaYicheng Liao, Aalborg University, Denmark
Copyright © 2020 Koralewicz, Shah, Gevorgian, Wallen, Jha, Mashtare, Gadiraju and Tiwari. This is an open-access article distributed under the terms of the Creative Commons Attribution License (CC BY). The use, distribution or reproduction in other forums is permitted, provided the original author(s) and the copyright owner(s) are credited and that the original publication in this journal is cited, in accordance with accepted academic practice. No use, distribution or reproduction is permitted which does not comply with these terms.
*Correspondence: Shahil Shah, Shahil.Shah@nrel.gov