Lithium Salt Dissociation in Diblock Copolymer Electrolyte Using Fourier Transform Infrared Spectroscopy
 Kyoungmin Kim
 Leah Kuhn3
  Daniel T. Hallinan
 - 1Department of Chemical and Biomedical Engineering, Florida A&M University–Florida State University College of Engineering, Tallahassee, FL, United States
- 2Aero-Propulsion, Mechatronics and Energy Center, Florida State University, Tallahassee, FL, United States
- 3Department of Chemistry and Biochemistry, Florida State University, Tallahassee, FL, United States
Polymer electrolytes are important materials in the manufacture of all-solid-state batteries due to their ionic conductivity, achieved by doping the polymer with salt, and mechanical strength, achieved by use of a block copolymer with a rigid block. High salt concentration is advantageous to achieve high ionic conductivity, but it makes estimation of battery performance difficult due to the breakdown of dilute-solution theory, which assumes complete ion dissociation. Therefore, practical battery design would benefit from an empirical understanding of the relationship between ion dissociation and salt concentration in block copolymer electrolyte. In this study, the dissociation of lithium bis(trifluoromethanesulfonyl)imide (LiTFSI) in polystyrene (PS)—poly(ethylene oxide) (PEO) diblock copolymer electrolyte was investigated using Fourier transform infrared (FTIR) spectroscopy. Quantitative analysis was performed to reveal the appearance of ion pairs and interactions between the salt and the ethylene oxide moieties with increasing salt concentration. FTIR peaks associated with polymer functional groups were found to be more useful than those of the TFSI anion for understanding the chemical state of the block copolymer electrolyte. In particular, PS peaks were used to quantify polymer dilution upon salt addition and verify that the Beer–Lambert law was valid at all concentrations investigated. PEO peaks revealed conformational changes of the polymer upon coordination with lithium ions. A previously unidentified FTIR peak was discovered that relates to polymer–salt interaction. It was used to determine the extent of salt dissociation, which compares well with a Raman study of a homopolymer electrolyte. This work definitively shows that LiTFSI dissolves into the PEO phase of the block copolymer, essentially unaffected by PS presence. It also establishes FTIR as a useful technique for quantifying dissociation state of concentrated polymer and composite electrolytes for lithium batteries.
Introduction
The development of future energy storage systems should include the improvement of battery materials to have higher power and higher energy density with low cost and safety (Goodenough et al., 2007; Li et al., 2018). All-solid-state batteries are a promising battery type in terms of safety, stability and energy density (Hallinan et al., 2018; Judez et al., 2018). Polymer electrolytes are important materials in manufacture of all-solid-state batteries due to their adhesivity, processability, and chemical resistance (Ruck et al., 2019). For these reasons, they will likely play a role in composite/hybrid electrolytes, considered necessary to enable future energy storage systems.
After it had been found that the ether groups in the amorphous phase of poly(ethylene oxide) (PEO) coordinate with cations and conduct ions by segmental motion (Wright, 1975; Borodin and Smith, 2006), there have been a great number of studies on the electrochemical properties and the transport mechanisms of polymer electrolyte systems. This is, in part, because practical batteries require higher charge/discharge rate than is currently achievable with PEO-based electrolytes (Hallinan and Balsara, 2013). There are two complementary approaches that could address transport limitations: (1) the use of composites, and (2) the use of concentrated polymer electrolyte. Ion transport experiments and theory are significantly more complicated in composite and concentrated systems (Pesko et al., 2017; Villaluenga et al., 2018). Furthermore, salt concentration impacts not only polymer morphology and dynamics (Chintapalli et al., 2016; Oparaji et al., 2018) but also transport (Berliner et al., 2019; Kim and Hallinan, 2020). Increasing lithium salt concentration provides an increasing number of charge carriers in the form of dissociated ions. However, strong polymer-cation interactions can negatively impact ionic mobility (Suo et al., 2016; Ford et al., 2020). In addition, salt dissociation appears to decrease with increasing salt concentration in polymer electrolyte, resulting in the formation of triplets or higher ion clusters (Suo et al., 2016). These large agglomerates and neutral ion pairs negatively impact the diffusion and migration of the ions, making estimation or analysis of transport behavior complex or even impossible without direct knowledge of thermodynamics (via dissociation and interaction of ions with the chemical environment). This motivates an in-depth study of lithium salt dissociation and ion interaction with the chemical environment in concentrated composite electrolytes, such as block copolymer/salt mixtures.
The dissociation of N(SO2CF3)2 (bis(trifluoromethanesulfonyl)imide, TFSI) salts with group 2 elements (Mg, Ca, Sr and Ba) in PEO electrolyte was studied using Fourier transform infrared spectroscopy (FTIR) by Bakker et al. (Bakker et al., 1995). Two different geometric structures of ion pairs were found for different metal ions and ion pairs were found at high salt concentration. Dissanayake et al. studied the effect of temperature on the dissociation and phase transition of PEO/LiSO3CF3 (lithium trifluoromethanesulfonate, LiTf) electrolyte using FTIR (Dissanayake and Frech, 1995). The degree of dissociation was measured by the band intensities of SO3 and CF3 groups in associated or free ions. FTIR and Raman spectroscopy of PEO/LiN(SO2CF3)2 (lithium bis(trifluoromethanesulfonyl)imide, LiTFSI) were performed by Rey et al. (1998b). Attempts to reveal the conformational changes of ether groups or TFSI anions, and ion-pairing effects of Li+ and TFSI− were carried out with limited quantitative analysis. FTIR studies of ion pairs and polymer-cation interactions in block copolymer electrolyte systems with lithium salts have been conducted for PEO-poly(propylene oxide)-PEO triblock copolymer with imide salts (Bakker et al., 1996), poly(vinylpyrrolidone-co-methyl methacrylate) (PVP-PMMA)/LiClO4 (Chiu et al., 2007), and PEO-containing polyester copolymer with sodium salts (Lu et al., 2009). In this study, LiTFSI dissociation is investigated in a high molecular weight polystyrene-poly(ethylene oxide) (SEO) block copolymer which is highly promising for lithium batteries due to its superior dendrite suppression and mechanical strength derived from the presence of the glassy PS block (Stone et al., 2012; Hallinan et al., 2013; Oparaji et al., 2018).
A recent molecular dynamics (MD) study on ion solvation found a decrease in the diffusion coefficient with increasing ion concentration in a diblock copolymer (Seo et al., 2019). In our previous study, the mutual diffusion coefficient of LiTFSI in SEO block copolymer was studied using time-resolved FTIR (Kim and Hallinan, 2020). The diffusion coefficient in the low salt concentration regime was found to decrease followed by an increase of the diffusion coefficient in the high salt concentration regime, where salt dissociation is presumed to be limited. Changes of the FTIR spectra were observed at various salt concentrations that appeared to indicate the presence of associated ion pairs in the concentrated polymer electrolyte samples. This current study takes a systematic, detailed look at the equilibrium FTIR spectra of SEO/LiTFSI electrolytes in an attempt to provide better understanding of the dissociation state of the salt and the coordination between the ions and the polymer backbone. All the regions of the mid-infrared region of the spectrum have been analyzed, including peak deconvolution where necessary, to track changes in peak intensity and position. A discussion, in light of other studies in the literature, connects these observations to the chemical interactions underlying the spectral changes.
Experimental
Materials
A diblock copolymer of SEO was synthesized via anionic polymerization as described elsewhere (Oparaji et al., 2016). The molecular weight of PS and PEO blocks were 121 and 165 kg/mol, respectively. The PDI was 1.11, and the volume fraction of the PEO was 0.56 at 120°C. The synthesized polymer was freeze-dried under vacuum and stored at −20°C. LiTFSI was purchased from BASF and dried under vacuum for 48 h at 120°C in an antechamber connected to an argon-filled glove box. The dried LiTFSI was transferred to the glovebox without exposure to air, and is denoted “as-received”.
Polymer Electrolyte Preparation
The SEO and LiTFSI were mixed in n-methyl-2-pyrrolidone (NMP), and the mixtures were stirred overnight at 60°C. The mixtures were cast on a hot plate covered with nickel foil, and the solvent was allowed to evaporate at 60°C. The cast films were removed from nickel foil after 24 h and dried under vacuum at 90°C for 24 h in the antechamber mentioned above. The thicknesses were measured by a micrometer. The average thickness of films was 100 ± 10 μm. The salt molarity in the resulting films was from 0 to 1.54 molLiTFSI/Ltotal (r = 0–0.17 molLiTFSI/molEO). Polymer electrolyte membrane casting was performed in an argon-filled glove box with <0.2 ppm of oxygen and water.
The molarity of species i,
where xi is the moles of species i, r is the molar ratio of salt and ethylene oxide (EO) moieties, M is the molecular weight, ρ is the density, and subscripts i, EO, S, PEO, PS and LiTFSI are species, ethylene oxide monomer, styrene monomer, PEO, PS and LiTFSI, respectively. xi of the LiTFSI, EO and styrene monomers were r, 1, and
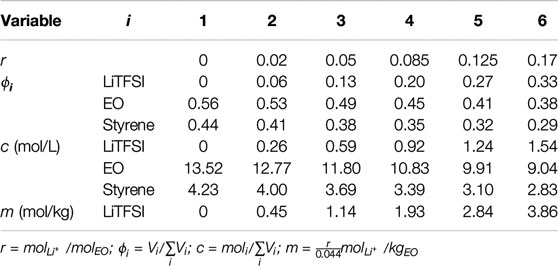
TABLE 1. Molar ratios (r), volume fractions (
Fourier-Transform Infrared-Attenuated Total Reflectance (FTIR-ATR) Spectroscopy
The polymer electrolyte films were placed on a single reflection diamond ATR crystal (Golden Gate, Specac) in an argon-filled glove box and sealed by an o-ring. All spectra were the result of four scans, collected at a 4 cm−1 resolution in the range of 4,000–650 cm−1 on a PerkinElmer Frontier with a liquid-nitrogen-cooled MCT detector. The background of the diamond crystal was taken immediately following each measurement after removing the sample. The absolute absorbance values reported in this work were calculated directly from the detected infrared energy transmitted through the sample at each wavenumber (Es) and the energy of the background (Eb) according to
Density Functional Theory Simulation
The interactions between the lithium cation and polymer or TFSI anion were simulated using density functional theory (DFT). All optimization and frequency calculations were conducted using the Kohn–Sham formulation of DFT with the B3LYP function and the 6-31++G(d,p) basis set. All geometry optimizations and vibration analyses were calculated using Gaussian 09 software (Frisch et al., 2009). All structures were optimized and frequency calculations were performed in order to ensure that a local minimum energy structure had been found. The data for the IR spectra was extracted from the output files using GaussView 5.0.9 (GaussView, 2009) and plotted using a scaling factor of 0.964 (Johnson III, 2019). Natural bond orbital (NBO) calculations were conducted on the optimized structures using NBO Version 3.1 (Glendening et al., 1998). Three-dimensional structures were produced with CYLView 1.0.1 (Legault, 2009). The chemical structures and the coordination of the materials and the simulation results are given in the Supplementary Material.
Results
The FTIR spectra of pure LiTFSI and SEO/LiTFSI polymer electrolytes of different concentrations at 120°C are shown in Figure 1. The assignment of peaks of pure materials is shown in Table 2. The characteristic peaks of LiTFSI and PEO in the SEO electrolyte shifted with respect to the pure components, indicating that the salt dissolved into the PEO phase of SEO. The PS peaks do not exhibit any changes in peak position because the PS component is not involved in solvation of the salt. Therefore, all changes of the IR bands of LiTFSI arise from the interaction only between the PEO and LiTFSI. The shift of the peaks with addition of salt is presented in Table 2, where peak locations are reported for all salt concentrations investigated.
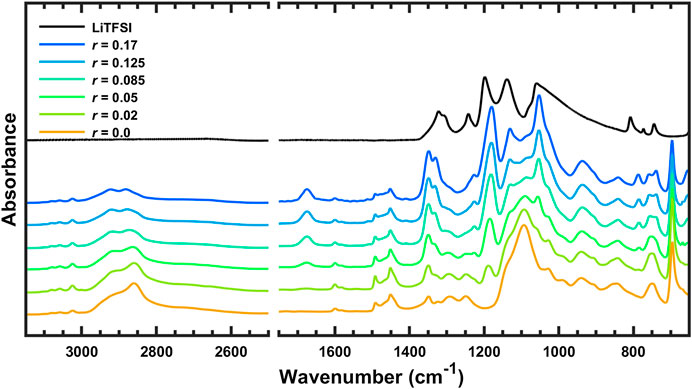
FIGURE 1. FTIR spectra of SEO, LiTFSI, and SEO/LiTFSI polymer electrolytes with different salt concentrations at 120°C. For clarity, spectra have been vertically shifted, and regions that are not of interest have been omitted: 4,000–3,150 and 2,500–1,750 cm−1.
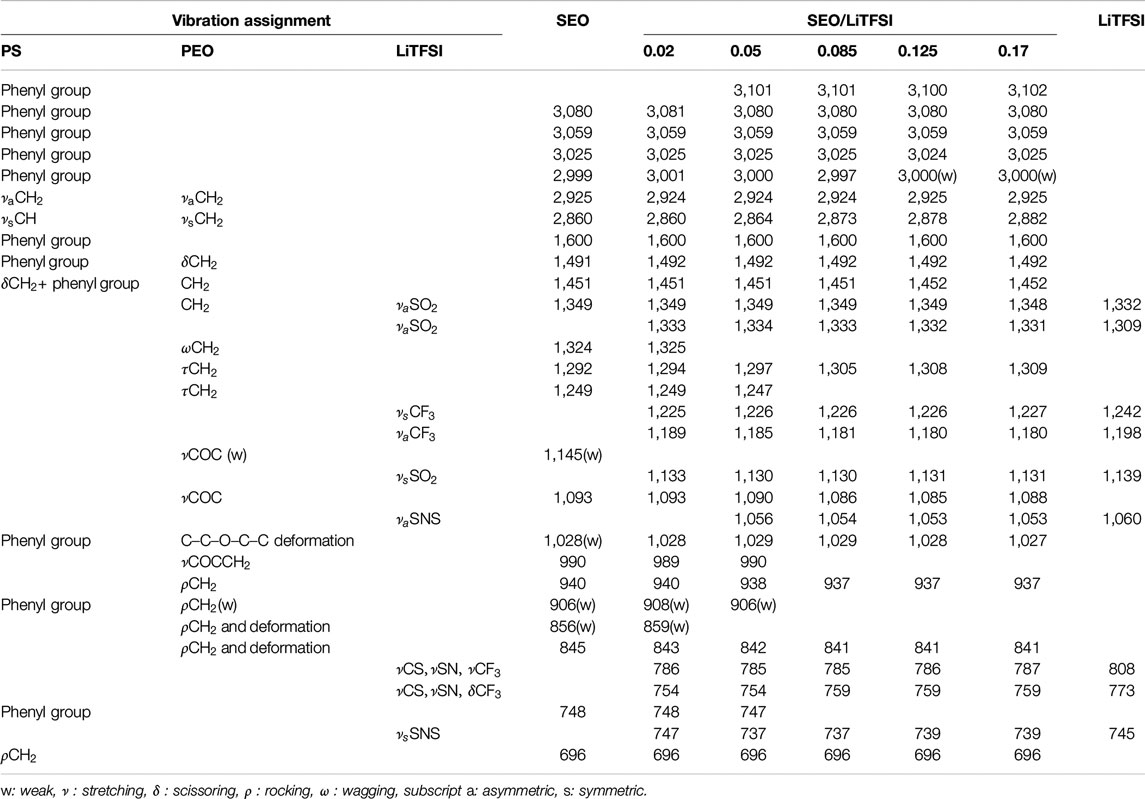
TABLE 2. FTIR peak assignments of SEO, LiTFSI and SEO/LiTFSI polymer electrolytes and peak shifts at various salt concentrations.
The increase of lithium salt concentration resulted in the increase of the absorbance of the peaks associated with LiTFSI. The most obvious increases can be found for the SO2 asymmetric vibration (νa SO2, 1,349 and 1,330 cm−1), CF3 asymmetric vibration (νa CF3, 1,180 cm−1), and SNS asymmetric vibration (νa SNS, 1,053 cm−1). Conversely, the absorbance of peaks associated with PEO and PS decreased with increasing salt concentration. Decreasing CH or CH2 stretching bands were observed with increasing salt concentration at high wavenumber (νCH of benzene rings, 3,100–3,000 cm−1, and νCH and νCH2 of PS and PEO backbone, 2,925 and 2,860 cm−1). The COC vibration of PEO (νCOC, 1,093 cm−1) was found to have decreased and shifted by addition of lithium salt. The various infrared bands associated with the phenyl groups of PS showed decreasing absorbance with increasing salt concentration, but did not show any change in the peak position. Since some peaks shifted as a function of salt concentration, to avoid confusion the peaks of the salt components are referred to by their location in the polymer/salt system with the highest salt concentration in our experiments (r = 0.17 molLiTFSI/molEO), and the peaks of the polymer components are referred to by their location in pure SEO (r = 0 molLiTFSI/molEO). Refer to Table 2 for detailed information regarding peak shifting according to the FTIR-ATR spectra before deconvolution.
The left-hand side of Figure 1 is the FTIR-ATR spectra of the polymer electrolytes between 3,150 and 2,500 cm−1. In this wavenumber range, there are no LiTFSI peaks, and IR bands in this range are due to carbon-hydrogen vibrations of PS or PEO. The small peaks above 3,000 cm−1 are CH stretching of the phenyl groups (Jabbari and Peppas, 1993). These bands have small changes in intensity with increasing salt concentration, but the peak positions are constant. The broad set of convoluted bands between 3,000 and 2,500 cm−1 are due to CH2 stretching of PS and PEO, CH stretching of the main chain of PS, and aromatic ring vibrations (Jabbari and Peppas, 1993). Although the highest peak at 2,859 cm−1 has components of PS and PEO, it seems to be dominated by the signal from CH2 of PEO since the peak shifts with salt addition. The peaks in this region from the backbone of the PS block seem to have only a slight decrease with increasing salt concentration and no change in position and shape, because the PS component is inert to the interaction with the lithium salt (Oparaji, 2017). The changes in the absorbance of PS peaks are thought to be due to dilution by addition of LiTFSI, which increases the volume fraction of the PEO/LiTFSI phase. The depth of penetration of the FTIR-ATR evanescent wave is on the order of 1 μm and the infrared spot size is on the order of 1 mm2. Thus, this technique samples a volume on the order of 1 nL = (100 µm)3, which is a sufficiently large control volume that the continuum concentration of the polymer electrolyte should be considered, unaffected by the block copolymer nanostructure, which is on the order of 100 nm. Therefore, addition of LiTFSI into the PEO phase of the block copolymer not only decreases the concentration of PEO, but also decreases the effective, macroscopic concentration of PS. Intensity changes of peaks associated with SEO are examined quantitatively and in more detail below using more intense peaks that occur in the fingerprint region. The right-hand side of Figure 1 is the fingerprint region from 1,750 to 650 cm−1. The IR spectra of the polymer electrolytes in this region will be discussed subsequently using Figures 2–9, which present enlarged sections with more detail.
Discussion
The results were examined thoroughly in terms of salt dissociation and ion interaction because the degree of dissociation and ion interaction largely impact the polymer electrolytes’ physical and electrochemical properties such as the structure, mechanical strength, or ionic conductivity. The mechanical properties of block copolymer electrolytes are known to be dependent on the volume fraction of each component (Niitani et al., 2005; Devaux et al., 2015), the microphase separation (Rosedale and Bates, 1990; Ruzette et al., 2001), and the sequence of blocks (Matsuo et al., 1968). Since microphase separation of SEO becomes stronger with increasing salt content due to strong ionic interactions of lithium salt in PEO phase (Metwalli et al., 2015; Chintapalli et al., 2016; Oparaji et al., 2018), the mechanical strength of PS–PEO-based block copolymer electrolytes that are microphase separated in the neat state merely depends on the molecular weight and the volume fraction of glassy phase (Devaux et al., 2015; Oparaji et al., 2018).
The polymer–salt interaction of PEO-based polymer electrolytes was related to the thermodynamic and electrochemical properties using Lewis-base approach by Wieczorek et al. (Wieczorek et al., 1995). Different types of fillers (polymeric, organic, or inorganic) acted as Lewis acid or base centers and caused non-uniform distribution of metal cations in the vicinity of the fillers forming different types of complexes. This caused unique features of the polymer composites with each filler in terms of the crystallinity, the glass transition temperature, and the dependence of ionic conductivity on temperature or filler concentration. Pesko et al. (2016) studied the electrochemical, thermodynamic, and structural properties as a function of solvation-site connectivity which is defined as the ratio of number of oxygen atoms to the total number of atoms in a repeat unit. The solvation-site connectivity was controlled by varying the chain lengths of vinyl or EO groups in the repeat unit. Higher connectivity makes more solvation-sites and narrows the distance between solvation-sites, which facilitates ion hopping between the solvation-sites. Ionic conductivity showed a linear increase to increasing number of solvation-sites for 0.06 ≤ r ≤ 0.14 and Tg + 55°C ≤ T ≤ Tg + 95°C. A recent study of PEO-based polymer electrolytes with sodium triflate (NaTf) showed a rapid decrease of ionic conductivity at high salt concentration (
Since ions play an important part in battery electrolytes, there are quite a few studies of the dissociation state of alkali salts in various solvents. For example, the solvation and ionic state of LiTFSI can be investigated using the spectroscopic behavior of the block copolymer electrolytes. Vibrational spectroscopies are powerful methods to study the state of ions or molecules influenced by intermolecular or intramolecular interactions. Although its specialty is for identification of compounds, detection of functional groups, and qualitative analysis of chemical interactions, quantitative analysis is also possible. This requires precise and careful control of samples and experimental conditions along with appropriate analysis and proper assumptions (Kakihana et al., 1990; Fieldson and Barbari, 1993; Ferry et al., 1995; Sammon et al., 1998; Elabd et al., 2003; Philippe et al., 2004; Hallinan and Elabd, 2007; Oparaji et al., 2016; Yang et al., 2018; Kim and Hallinan, 2020). In this section, the dissociation of LiTFSI in SEO is investigated via detailed analysis of the fingerprint region.
Absorbance of FTIR is proportional to concentration according to the Beer–Lambert law; appropriate concentration units are molarity (M or mol/L). The molarity (and therefore absorbance) of the polymer is expected to decrease with increasing salt content. Pure SEO peaks (δCH2 + phenyl group, 1,491 and 1,451 cm−1) as well as pure PS peak (ρCH2, 696 cm−1) were chosen to study the dilution of SEO by addition of LiTFSI. These are strong polymer peaks without any overlap by LiTFSI peaks. They are shown in Figures 2A,B. The peak positions do not show any significant change as shown in Figure 2C. However, the absorbance of these peaks increased when salt was first introduced (r = 0.02) then steadily decreased with increasing salt concentration as shown in Figure 2D. The initial increase of the IR absorbance at low salt concentration (r = 0.02) can be explained by (1) the density change of polymer/salt mixture due to non-ideal mixing (Teran and Balsara, 2014) or (2) the change of chemical environment of the system by addition of salt influencing the molar extinction coefficient which affects the IR intensity (Lappi et al., 2004). The further decrease of absorbance with increasing LiTFSI concentration is due to dilution as mentioned above.
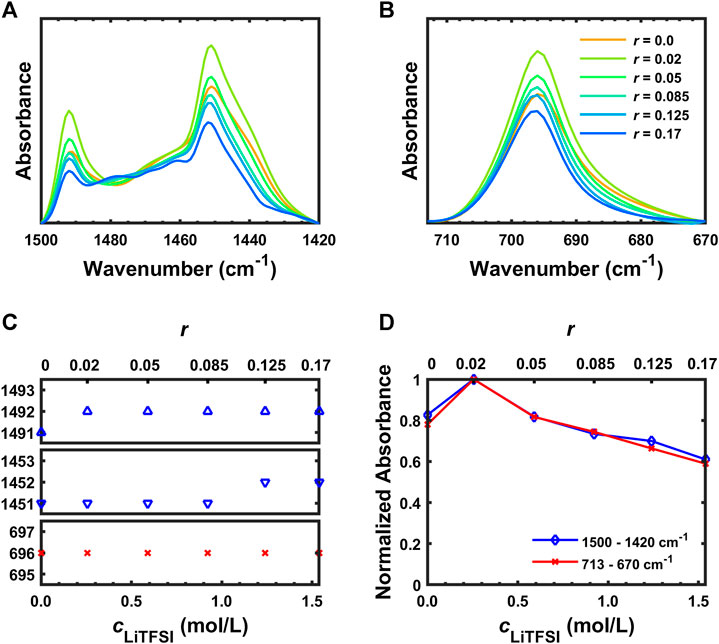
FIGURE 2. (A) FTIR-ATR spectra of SEO/LiTFSI between 1,500 and 1,420 cm−1, (B) FTIR-ATR spectra of SEO/LiTFSI between 713 and 670 cm−1, (C) peak positions of
Figure 3A shows the FTIR-ATR spectra of SEO/LiTFSI between 1,400 and 1,150 cm−1. The
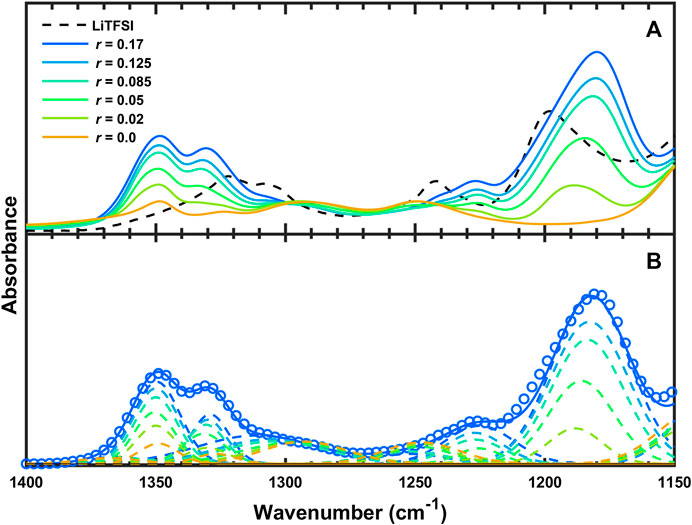
FIGURE 3. (A) FTIR-ATR spectra and of SEO, LiTFSI, and SEO/LiTFSI from 1,400 to 1,150 cm−1 and (B) experimental data (circles) and fit (solid curve) of SEO/LiTFSI (r = 0.17) as well as deconvoluted peaks (dashed curves) of SEO/LiTFSI at the various salt concentrations studied.
The deconvoluted IR bands from Figure 3B in the region from 1,400 to 1,200 cm−1 are presented in Figure 4A. With increasing salt concentration, the deconvoluted νaSO2 peaks at 1,348 and 1,331 cm−1 do not significantly change position but they do increase with increasing salt concentration (Figure 4B) as expected. This is shown quantitatively in Figure 4C, where the normalized integrated absorbance of the deconvoluted νaSO2 peaks increase monotonically with r. The peak at 1,348 cm−1 is known to be affected more by C1 conformer (cis) than C2 (trans), and vice versa for the other (Herstedt et al., 2005). The ratio of these peaks therefore have been shown to be different with different content of geometric isomers. However, for PEO-based polymer electrolytes, as we mentioned above, the νaSO2 doublet overlaps with
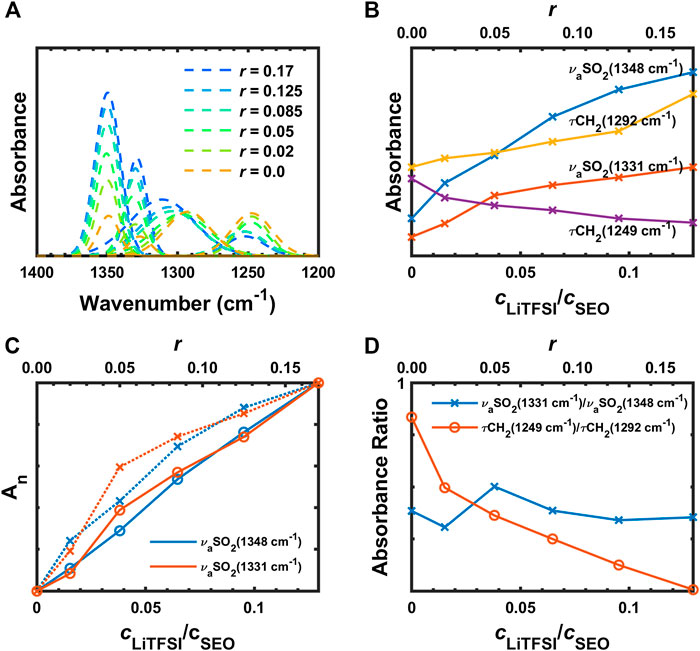
FIGURE 4. (A) Deconvoluted peaks of IR bands from 1,400 to 1,200 cm−1, (B) absorbances of
In Figure 4B, the increase of absorbance of the νaSO2 doublet seems to deviate from the expected linear relationship with the concentration. The peak absorbances were normalized for comparison
where An is the normalized absorbance, A is the absorbance at each salt concentration, and the superscripts denote the sample numbers in Table 1. In order to remove the effect of volume changes, the peaks were calibrated by the absorbance of
where Ac is calibrated absorbance, A is the absorbance of the peak to be calibrated, and
The calibrated absorbances were then normalized
where superscripts denote the sample numbers and the subscripts c and n mean calibration and normalization, respectively. As shown in Figure 4C, the normalized calibrated absorbances were linear as a function of the molarity ratio of salt to SEO. The linearity of the plot demonstrates the validity of the Beer–Lambert law across the entire concentration range since
The τCH2 (1,292 and 1,249 cm−1) show interesting behavior in Figure 4A. These peaks initially have similar intensities and shape when there is no salt in the polymer. With addition of salt, the τCH2 band at 1,292 cm−1 gradually shifts to higher wavenumber and the peak area increases (Figure 4B) while the other τCH2 becomes smaller and broader. The ratio of the two
The deconvoluted IR bands from Figure 3B at 1,227 cm−1 (
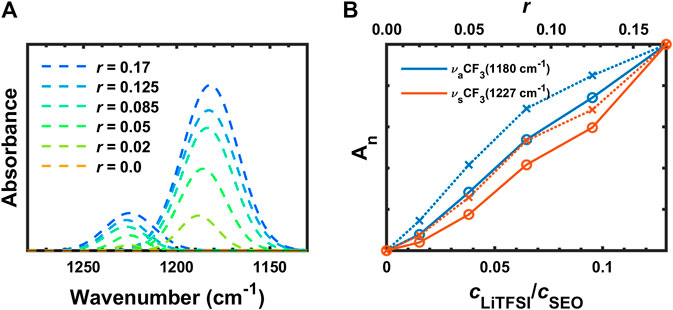
FIGURE 5. (A) Deconvoluted FTIR-ATR bands and (B) normalized absorbances of
Figure 6 shows the FTIR-ATR spectra of SEO (r = 0), LiTFSI, and the salt-doped polymer electrolytes between 1,160 and 713 cm−1. As shown in Figure 6A, the symmetric stretching vibration of SO2 (
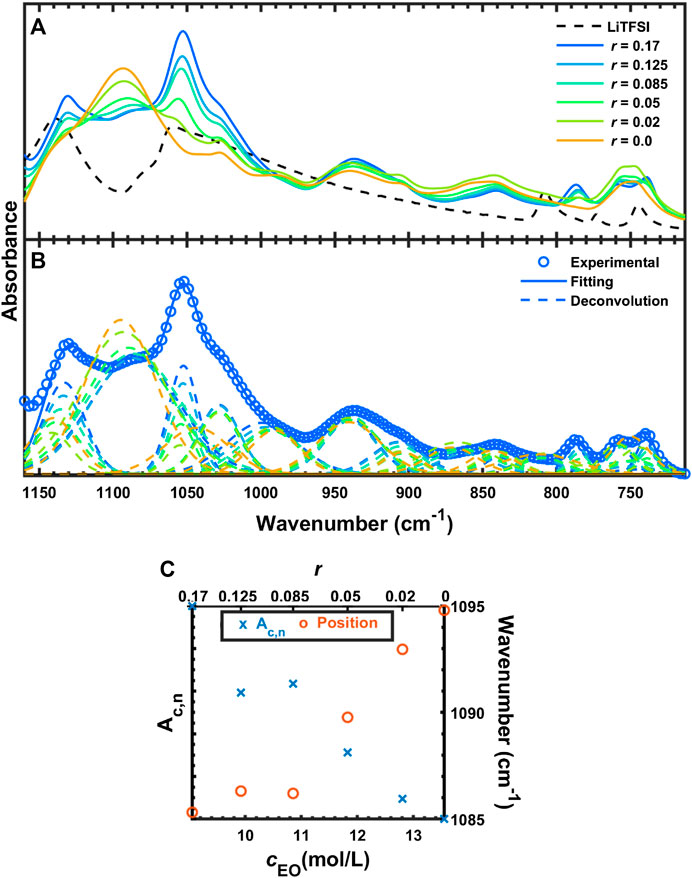
FIGURE 6. (A) FTIR-ATR spectra of SEO, LiTFSI, and SEO/LiTFSI in the region from 1,160 to 713 cm−1, (B) deconvolution of SEO/LiTFSI, and (C) quantification of COC peak absorbance and position.
The peaks between 1,100 and 800 cm−1 shown in Figure 6A originate from SEO, with the exception of
The deconvoluted IR bands from Figure 6B between 805 and 713 cm−1 are shown in Figure 7A. The assignments of these peaks are not clear in many literature reports (Pennarun and Jannasch, 2005; Kam et al., 2014; Velez et al., 2016). These three peaks are thought to be shifted from 808, 773, and 745 cm−1 for the solid LiTFSI to 787, 759, and 739 cm−1 for the SEO/LiTFSI electrolyte at r = 0.17. The assignments of these peaks are shown in Table 2. For pure LiTFSI, the IR peaks at 808 and 773 cm−1 seem to be complex combination peaks including the vibrations of CS, SN, and CF3 components (Rey et al., 1998a). However, there is agreement that the peak at 745 cm−1 in pure LiTFSI is the symmetric SNS vibration (νsSNS). Upon incorporation of LiTFSI into SEO, all three of these peaks redshift. The peak at the highest frequency shifted from 808 cm−1 in pure LiTFSI to 787 cm−1 at r = 0.17 molLiTFSI/molEO; the middle peak shifted from 773 to 755 cm−1; and the lowest peak shifted from 745 to 740 cm−1. As a result, the peak at 787 cm−1 showed monotonic increase in absorbance without changing the peak position with increasing salt concentration with only minor overlap with the CH2 rocking band (ρCH2). The absorbance increase is presented quantitatively in Figure 7B. Like νaCF3 and νaSO2, the normalized, calibrated absorbance of the peak at 787 cm−1 (Figure 7B) is more-or-less linear with salt concentration. The 787 cm−1 peak position also exhibits minor shifts mirroring those of νaSO2 that are too small for quantitative analysis. The other LiTFSI peaks seemingly split from 748 cm−1, but in fact, it is due to the growth of two different peaks (νCS, νsN, νCF3 at 759 cm−1 and νs SNS at 740 cm−1) around the peak of benzene ring vibration (748 cm−1). Due to this overlap, no quantitative analysis was attempted.
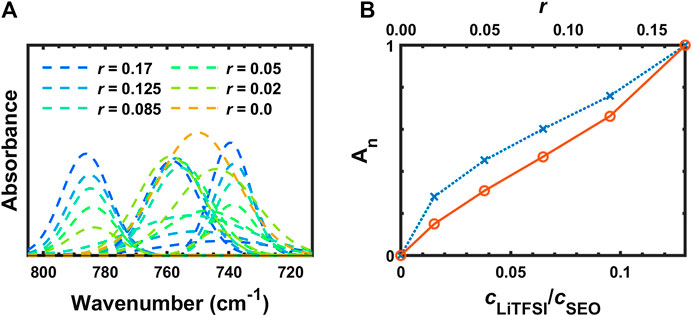
FIGURE 7. (A) Deconvoluted FTIR-ATR bands from 805 to 713 cm−1 and (B) concentration dependence of the peak integration of
Figure 8 presents the FTIR spectra of SEO, SEO/LiTFSI, and LiTFSI from 1,715 to 1,615 cm−1. No absorption was found in this region for the pure SEO nor for solid LiTFSI, but a peak clearly appears in the electrolyte at 1,675 cm−1. The peak location was constant for all samples. To the best of our knowledge, this peak has not been reported in literature for any PEO-based polymer electrolytes nor any LiTFSI-doped electrolytes. We propose that this peak is attributed to the ether-lithium interaction. An approximate argument for this assignment can be made using liquid water stretching as a reference (
where
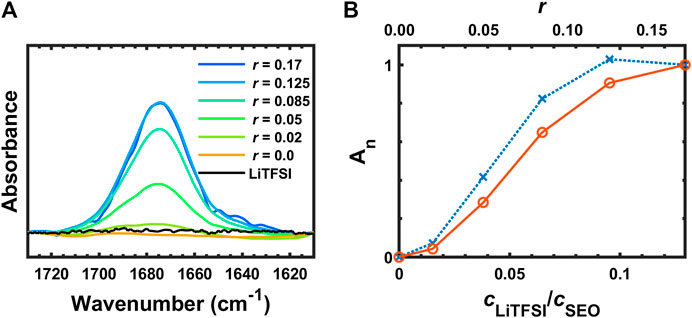
FIGURE 8. (A) FTIR-ATR spectra of SEO, SEO/LiTFSI, and LiTFSI from 1,715 to 1,615 cm−1, and (B) normalized integration of (A) (∙∙∙×∙∙∙An) and normalized, calibrated absorbance (─○─ Ac,n).
As a zeroth order approximation assuming that
This is remarkable agreement with observation (1,675 cm−1), but clearly involves somewhat arbitrary assumptions. This peak assignment should be verified with simulations. A peak has been observed in liquid electrolyte at 1,650 cm−1 (Pyun, 1999). Along with several other peaks, it was assigned to a degradation product of LiPF6 and ethylene carbonate that contains Li–O functionality and can be catalyzed by water presence. However, unlike the other peaks in that study, the absorbance at 1,650 cm−1 did not increase monotonically with water content. This could indicate that it actually corresponds to the coordinated Li–O intermediate in the reaction scheme, which would support our peak assignment. It is worth mentioning that the water bending absorbance occurs in this region (1,640 cm−1). It is unlikely that the peak at 1,675 cm−1 is due to water contamination because our experimental setup has been design and tested to rigorously exclude exposure to air. Returning to experimental observations, the peak did not show any further absorbance increase on going from r = 0.125 to r = 0.17. This might be due to the number of ether groups per lithium ion being saturated at r = 0.125 (EO:Li+ = 8), resulting in incomplete dissociation of LiTFSI with addition of more salt. If additional Li cations are not generated with the addition of salt, then additional Li+–O coordination cannot form and the peak intensity will not increase. The normalized absorbance of this peak is shown in Figure 8B (blue dotted line with × marks), where it appears to plateau. However, if the effect of dilution is taken into account using the normalized, calibrated absorbance (red solid line with ○ marks in Figure 8B), it can be seen that LiTFSI dissociation is not completely shut down at the highest salt concentration (r = 0.17, EO:Li+
The data for
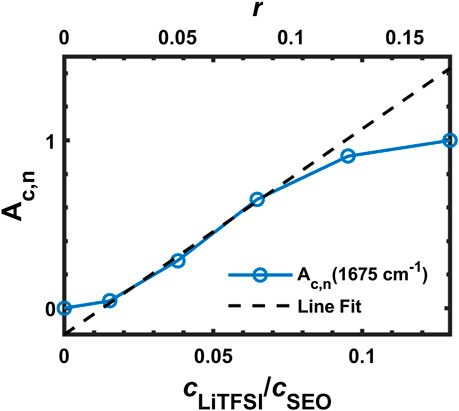
FIGURE 9. Ac,n of the FTIR band at 1,675 cm−1 with line fitting.
Several computations were conducted following the approach of Han et al. (2017), in which DFT calculation has been used to support experimental results of FTIR and Raman spectroscopy. In this study, computations were conducted in order to identify a potential origin for the peak that appears at 1,675 cm−1 as the LiTFSI is added to the system. We have initially tested if the peak originates from the coordination of the Li cation and the PEO backbone. In order to look at Li-PEO coordination, a fragment of the PEO backbone was modeled as coordinated with a Li-cation. Backbone fragments consisting of a single chain containing either two or three oxygens (1,2-dimethoxyethane and 1-methoxy-2-(2-methoxyethoxy)ethane respectively), and two individual chains of 1,2-dimethoxyethane were explored as potential Li-PEO interaction sites that could be occurring experimentally. Vibrations corresponding to the C–H bonds before and after Li-coordination were in agreement with the experimentally determined spectra suggesting that our model system is a good approximation to the experimental system. The experimental peak at approximately 1,500 cm−1 corresponds to C–H stretching on the PEO-backbone and therefore was used as a reference peak for the calculated IR spectra. All three potential Li-PEO coordination calculations had the expected peak around 1,500 cm−1 but did not have a peak around the region of interest [both before and after scaling (by 0.964)], suggesting that the peak at 1,675 cm−1 is not from Li-PEO coordination. Next, the potential for the TFSI counterion interacting with the Li-PEO system was explored. These simulated IR spectra also had the internal standard peak at ∼1,500 cm−1 corresponding to C–H stretching of the PEO backbone. The other PEO backbone peaks overlap with the peaks experimentally shown to correspond to the LiTFSI salt making it difficult to differentiate most of the other IR signals. Despite this, the expanded system also did not result in a peak around 1,675 cm−1.
The potential presence of water was explored next where the Li-PEO system formed a
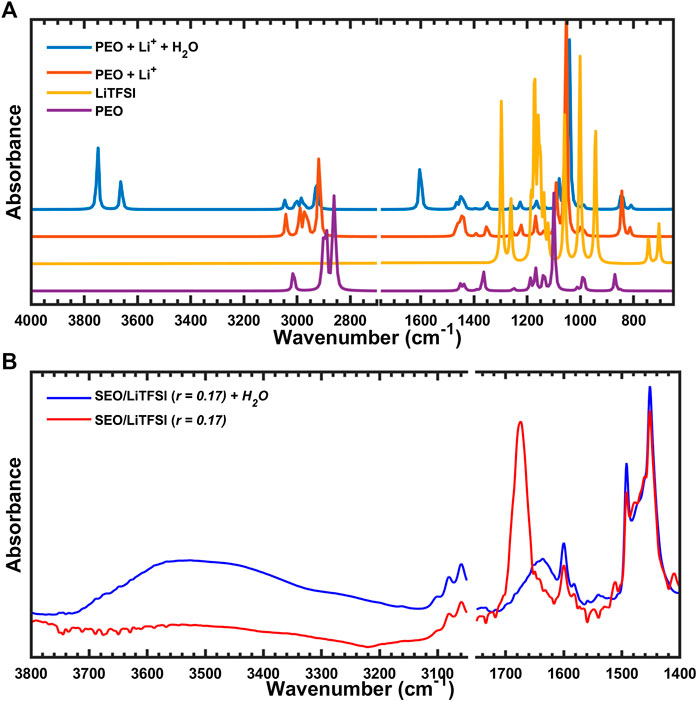
FIGURE 10. (A) Simulated IR spectra of PEO coordinated with Li+ and H2O, and (B) experimental FTIR-ATR spectra of SEO/LiTFSI with or without water.
Other potential interactions between Li and oxygen-based impurities were explored in order to rule out their involvement. A hydroxy-anion coordinated to the Li cation in the Li-PEO system did not produce a peak around the 1,675 cm−1 region. Finally, the IR spectra for an oxygen-bridge between the two Li-PEO systems was explored too. Again, formation of a Li–O–Li bridge did not result in a peak around the region of interest.
Interestingly, stereoelectronic effects were found in the calculated IR spectra for the C–H bond vibration region (∼3,000 cm−1) when converting from the uncoordinated trans conformer to the Li-coordinated gauche configuration. These changes originate from the attenuation of anomeric effect (Juaristi and Cuevas, 1992; Alabugin, 2000; Kirby, 2012; Gomes et al., 2015) When uncoordinated, the lone pairs of oxygen are able to donate electron density to the antibonding C–H orbitals, effectively weakening the C–H bonds. However, in order for the PEO backbone to coordinate with the lithium cation it must adopt a gauche conformation and the oxygen uses one of its lone pairs to coordinate with lithium. As a consequence, oxygen has only one lone pair that can participate in hyperconjugation with the C–H bond and the orbital overlap between the donor and acceptor has been compromised due to the now gauche geometry. Both of these factors decrease the average donor ability of oxygen from 6 kcal/mol in the uncoordinated configuration to 4.2 kcal/mol in the Li-coordinated complex according to NBO analysis (Glendening et al., 2012). Due to the weaker donor ability of oxygen in the gauche conformer the IR peaks corresponding to C–H bond vibrations are blue-shifted in comparison to the trans-conformer spectra, as shown in Figure 11A. Although somewhat less pronounced, the same blue shift is seen in the experimental spectra of Figure 11B, where the C–H bond vibration in question monotonically shifts from 2,860 cm−1 in the neat polymer to 2,882 cm−1 at r = 0.17 molLi/molEO (Table 2). In other words, the simulated and experimental spectra both indicate that the amount of gauche PEO conformations increase with addition of LiTFSI salt to the polymer, and the computational modeling provides molecular insight into the origin of these changes.
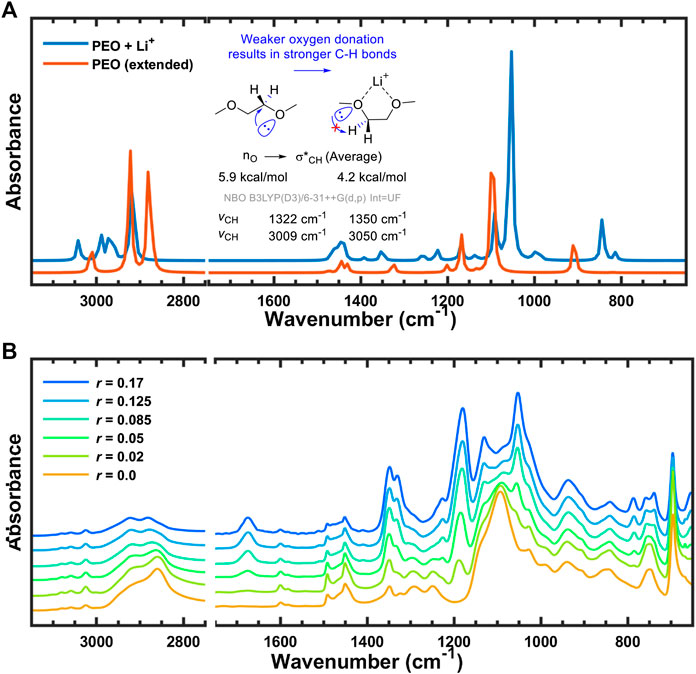
FIGURE 11. FTIR-ATR spectra with anomeric effect from (A) simulation with scaling factor of 0.964, and (B) experiment.
The interaction of cation and NMP was also studied experimentally since the C=O double bond has a peak around 1,675 cm−1. The spectrum of a solution of NMP and LiTFSI, shown in Figure 12A, exhibits a large C=O peak. After collecting the spectrum of the solution, the LiTFSI/NMP mixture on the ATR crystal was brought into the argon-filled glovebox, unsealed, and dried overnight at 60°C. The sample was further dried for one more overnight under vacuum at 60°C. Then another FTIR spectrum was collected of the LiTFSI dried from solution. This spectrum is shown in Figure 12A along with a spectrum of as-received LiTFSI that had never been exposed to NMP. There are distinct differences between the LiTFSI salt dried from solution and the as-received LiTFSI. For the most part, the LiTFSI peaks in the wavenumber range from 1,550 to 650 cm−1 agree between the dried and the as-received salt. On the other hand, a weak peak remains at 1,675 cm−1 (and 3,050–2,800 cm−1, not shown) in the LiTFSI salt dried from solution, whereas there are no indications of these peaks in the as-received salt. This seems to indicate that there is strong solvation between LiTFSI and NMP, and that NMP-LiTFSI complex remains in polymer electrolytes processed with this solvent. It is known that large dielectric constant of PEO reduces ion-ion interaction and leads to higher ion mobility (Wheatle et al., 2017). However, when there is solvent with larger dielectric constant than polymer, lithium cation is likely coordinated to solvent rather than polymer (Ford et al., 2020). We propose that the formation of Li-NMP complex depends on the amount of lithium salt. To prove this, salt diffusion test was set up as described in our previous study (Kim and Hallinan, 2020) with the membrane of higher salt concentration placed below the membrane with lower salt concentration. Figure 12B represents the time-resolved FTIR spectra where the LiTFSI diffuses from the bottom to the top membrane. The initial spectrum is represented as orange line and the final spectrum is blue. The peak at 1,675 cm−1 decreased with decreasing LiTFSI concentration supporting the assertion that this peak is from a complex containing LiTFSI.
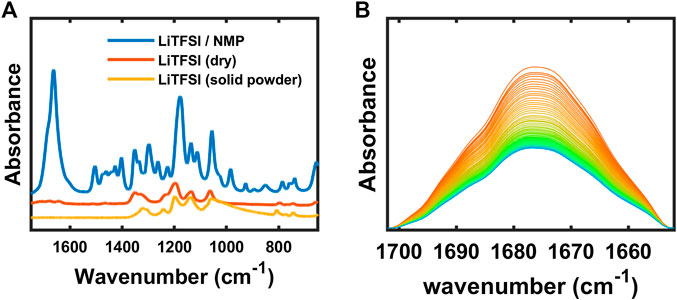
Figure 12. (A) FTIR-ATR spectra of LiTFSI + NMP, dry LiTFSI and solid LiTFSI powder, and (B) time-resolved FTIR-ATR spectra of SEO/LiTFSI with diffusion.
Conclusion
In this study, the dissociation of LiTFSI in the amorphous PEO conducting phase of an SEO diblock copolymer electrolyte was investigated using FTIR-ATR spectroscopy. Quantitative analysis showed increasing interactions between the salt molecule and ethylene oxide chains with increasing salt concentration and a lack of complete dissociation at the highest salt concentration studied. The inert polystyrene block worked as a reliable indicator of the consistency of the Beer–Lambert law at high salt concentration. In other words, the absorbance of polystyrene peaks decreased with increasing LiTFSI content (due to dilution), but lacked any detectable interaction with the salt. The PEO phase, however, was found to interact strongly with Li+. Conformational changes of the PEO backbone upon Li+ complexation were detected via relative changes of CH2 vibrations (
Data Availability Statement
All datasets presented in this study are included in the article/Supplementary Material.
Author Contributions
The manuscript was written through contributions of all authors. KK conducted the FTIR experiment and analysis. LK conducted the DFT calculations. All authors have given approval to the final version of the manuscript.
Conflict of Interest
The authors declare that the research was conducted in the absence of any commercial or financial relationships that could be construed as a potential conflict of interest.
Funding
This work was supported by the National Science Foundation award number 1804871.
Acknowledgments
The authors would like to acknowledge assistance from the FAMU-FSU. College of Engineering Machine Shop.
Supplementary Material
The Supplementary Material for this article can be found online at: https://www.frontiersin.org/articles/10.3389/fenrg.2020.569442/full#supplementary-material
Abbreviations
ATR, attenuated total reflectance; DFT, density functional theory; EO, ethylene oxide; FTIR, Fourier transform infrared spectroscopy; IR, infrared; LiTf, lithium trifluoromethanesulfonate; LiTFSI, lithium bis(trifluoromethanesulfonyl)imide; NaTf, sodium triflate; NBO, natural bond orbital; NMP, n-methyl-2-pyrrolidone; MCT, mercury-cadmium-telluride; MD, molecular dynamics; PDI, polydispersity index; PEO, poly(ethylene oxide); PMMA, poly(methyl methacrylate); PPO, poly(propylene oxide); PS, polystyrene; PVP, poly(vinylpyrrolidone); S, styrene; SEO, polystyrene-poly(ethylene oxide) diblock copolymer; TFSI, bis(trifluoromethanesulfonyl)imide; A, absorbance; Ac, calibrated absorbance; Ac,n, normalized calibrated absorbance; An, normalized absorbance; c, speed of light; ci, molarity of species i (mol/L); C1, cis conformation; C2, trans conformation; Eb, energy of the background; Es, energy of the sample; M, molecular weight (g/mol); m, molality (mol/kg);
References
Alabugin, I. V. (2000). Stereoelectronic interactions in cyclohexane, 1,3-dioxane, 1,3-oxathiane, and 1,3-dithiane: W-effect, σC–X↔ σ*C–H interactions, anomeric effect what is really important? J. Org. Chem. 65 (13), 3910–3919. doi:10.1021/jo991622+.
Aravindan, V., Gnanaraj, J., Madhavi, S., and Liu, H.-K. (2011). Lithium-ion conducting electrolyte salts for lithium batteries. Chem. Eur. J. 17 (51), 14326–14346. doi:10.1002/chem.201101486.
Arnaud, R., Benrabah, D., and Sanchez, J.-Y. (1996). Theoretical Study of CF3SO3Li, (CF3SO2)2NLi, and (CF3SO2)2CHLi Ion Pairs. J. Phys. Chem. 100 (26), 10882–10891. doi:10.1021/jp953259q.
Bakker, A., Gejji, S., Lindgren, J., Hermansson, K., and Probst, M. M. (1995). Contact ion pair formation and ether oxygen coordination in the polymer electrolytes M[N(CF3SO2)2]2PEOn for M = Mg, Ca, Sr and Ba. Polymer 36 (23), 4371–4378. doi:10.1016/0032-3861(95)96841-u.
Bakker, A., Lindgren, J., and Hermansson, K. (1996). Polymer electrolytes based on triblock-copoly(oxyethylene/oxypropylene/oxyethylene) systems. Polymer 37 (10), 1871–1878. doi:10.1016/0032-3861(96)87303-4.
Begum, R., and Matsuura, H. (1997). Conformational properties of short poly(oxyethylene) chains in water studied by IR spectroscopy. Faraday Trans. 93 (21), 3839–3848. doi:10.1039/a703436i.
Berliner, M. D., McGill, B. C., Majeed, M., and Hallinan, D. T. (2019). Electrochemical kinetics of lithium plating and stripping in solid polymer electrolytes: pulsed voltammetry. J. Electrochem. Soc. 166 (2), A297–A304. doi:10.1149/2.0851902jes.
Borodin, O., and Smith, G. D. (2006). Mechanism of ion transport in amorphous poly(ethylene oxide)/LiTFSI from molecular dynamics simulations. Macromolecules 39 (4), 1620–1629. doi:10.1021/ma052277v.
Chintapalli, M., Le, T. N. P., Venkatesan, N. R., Mackay, N. G., Rojas, A. A., Thelen, J. L., et al. (2016). Structure and ionic conductivity of polystyrene-block-poly(ethylene oxide) electrolytes in the high salt concentration limit. Macromolecules 49 (5), 1770–1780. doi:10.1021/acs.macromol.5b02620.
Chiu, C.-Y., Yen, Y.-J., Kuo, S.-W., Chen, H.-W., and Chang, F.-C. (2007). Complicated phase behavior and ionic conductivities of PVP-co-PMMA-based polymer electrolytes. Polymer 48 (5), 1329–1342. doi:10.1016/j.polymer.2006.12.059.
Devaux, D., Glé, D., Phan, T. N. T., Gigmes, D., Giroud, E., Deschamps, M., et al. (2015). Optimization of block copolymer electrolytes for lithium metal batteries. Chem. Mater. 27 (13), 4682–4692. doi:10.1021/acs.chemmater.5b01273.
Denoyel, M. A. K. L., and Frech, R. (1995). Infrared spectroscopic study of the phases and phase transitions in poly(ethylene oxide) and poly(ethylene oxide)-lithium trifluoromethanesulfonate complexes. Macromolecules 28 (15), 5312–5319. doi:10.1021/ma00119a022.
Edman, L. (2000). Ion association and ion solvation effects at the crystalline−amorphous phase transition in PEO-LiTFSI. J. Phys. Chem. B 104 (31), 7254–7258. doi:10.1021/jp000082d.
Elabd, Y. A., Baschetti, M. G., and Barbari, T. A. (2003). Time-resolved Fourier transform infrared/attenuated total reflection spectroscopy for the measurement of molecular diffusion in polymers. J. Polym. Sci. B Polym. Phys. 41 (22), 2794–2807. doi:10.1002/polb.10661.
Ferry, A., Jacobsson, P., and Torell, L. M. (1995). The molar conductivity behavior in polymer electrolytes at low salt concentrations; A Raman study of poly(propylene glycol) complexed with LiCF3SO3. Electrochimica Acta 40 (13), 2369–2373. doi:10.1016/0013-4686(95)00196-l
Fieldson, G. T., and Barbari, T. A. (1993). The use of FTi.r.-a.t.r. spectroscopy to characterize penetrant diffusion in polymers. Polymer 34 (6), 1146–1153. doi:10.1016/0032-3861(93)90765-3.
Ford, H. O., Park, B., Jiang, J. Z., Seidler, M. E., and Schaefer, J. L. (2020). Enhanced Li+ conduction within single-ion conducting polymer gel electrolytes via reduced cation-polymer interaction. ACS Mater. Lett. 2 (3), 272–279. doi:10.1021/acsmaterialslett.9b00510.
Frisch, M. J. T., Schlegel, H. B., Scuseria, G. E., Robb, M. A., Cheeseman, J. R., Scalmani, G., et al. (2009). “Gaussian 09.” 01E. ed.
GaussView, P. (2009). 5.0. 9. Dennington R., Keith TA, Millam JM, Semichem Inc., Shawnee Mission, KS.
Glendening, E. D., Landis, C. R., and Weinhold, F. (2012). Natural bond orbital methods. WIREs Comput. Mol. Sci. 2 (1), 1–42. doi:10.1002/wcms.51.
Gomes, G. d. P., Vil', V. A., Terent'ev, A. O., and Alabugin, I. V. (2015). Stereoelectronic source of the anomalous stability of bis-peroxides. Chem. Sci. 6 (12), 6783–6791. doi:10.1039/c5sc02402a.
Goodenough, J., Abruna, H., and Buchanan, M. (2007). “Basic research needs for electrical energy storage. Report of the basic energy sciences workshop on electrical energy storage, April 2–4, 2007.” DOESC (United States: USDOE Office of Science (SC)).
Hallinan, D. T., and Balsara, N. P. (2013). “Polymer electrolytes,” in Annual Review of materials research, Vol. 43, ed. D. R. Clarke (Palo Alto: Annual Reviews, 503.
Hallinan, D. T., and Elabd, Y. A. (2007). Diffusion and sorption of methanol and water in nafion using time-resolved Fourier transform infrared−attenuated total reflectance spectroscopy. J. Phys. Chem. B 111 (46), 13221–13230. doi:10.1021/jp075178n.
Hallinan, D. T., Mullin, S. A., Stone, G. M., and Balsara, N. P. (2013). Lithium metal stability in batteries with block copolymer electrolytes. J. Electrochem. Soc. 160 (3), A464–A470. doi:10.1149/2.030303jes.
Hallinan, D. T., Villaluenga, I., and Balsara, N. P. (2018). Polymer and composite electrolytes. MRS Bull. 43 (10), 759–767. doi:10.1557/mrs.2018.212.
Han, L., Iguchi, D., Gil, P., Heyl, T. R., Sedwick, V. M., Arza, C. R., et al. (2017). Oxazine ring-related vibrational modes of benzoxazine monomers using fully aromatically substituted, deuterated, 15N isotope exchanged, and oxazine-ring-substituted compounds and theoretical calculations. J. Phys. Chem. A 121 (33), 6269–6282. doi:10.1021/acs.jpca.7b05249.
Ohashi, M., Smirnov, M., Johansson, P., Chami, M., Grondin, J., Servant, L., et al. (2005). Spectroscopic characterization of the conformational states of the bis(trifluoromethanesulfonyl)imide anion (TFSI−). J. Raman Spectrosc. 36 (8), 762–770. doi:10.1002/jrs.1347.
Lassègues, E., and Peppas, N. A. (1993). Use of ATR-FTIR to study interdiffusion in polystyrene and poly(vinyl methyl ether). Macromolecules 26 (9), 2175–2186. doi:10.1021/ma00061a006.
Jo, G., Ahn, H., and Park, M. J. (2013). Simple route for tuning the morphology and conductivity of polymer electrolytes: one end functional group is enough. ACS Macro Lett. 2 (11), 990–995. doi:10.1021/mz400468m.
Johnson III, R. (2019). NIST computational chemistry comparison and benchmark database, NIST standard reference Database number 101, Release 20, 2019.
Juaristi, E., and Cuevas, G. (1992). Recent studies of the anomeric effect. Tetrahedron 48 (24), 5019–5087. doi:10.1016/s0040-4020(01)90118-8.
Judez, X., Zhang, H., Li, C. M., Eshetu, G. G., González-Marcos, J. A., Armand, M., et al. (2018). Review-solid electrolytes for safe and high energy density lithium-sulfur batteries: promises and challenges. J. Electrochem. Soc. 165 (1), A6008–A6016. doi:10.1149/2.0041801jes.
Rodriguez-Martinez, M., Schantz, S., and Torell, L. M. (1990). Raman spectroscopic study of ion–ion interaction and its temperature dependence in a poly(propylene‐oxide)‐based NaCF3SO3-polymer electrolyte. J. Chem. Phys. 92 (10), 6271–6277. doi:10.1063/1.458351.
Kam, W., Liew, C.-W., Lim, J. Y., and Ramesh, S. (2014). Electrical, structural, and thermal studies of antimony trioxide-doped poly(acrylic acid)-based composite polymer electrolytes. Ionics 20 (5), 665–674. doi:10.1007/s11581-013-1012-0.
Kim, K., and Hallinan, D. T. (2020). Lithium salt diffusion in diblock copolymer electrolyte using Fourier transform infrared spectroscopy. J. Phys. Chem. B 124 (10), 2040–2047. doi:10.1021/acs.jpcb.9b11446.
Kirby, A. J. (2012). The anomeric effect and related stereoelectronic effects at oxygen. Berlin: Springer Science & Business Media.
Lappi, S. E., Smith, B., and Franzen, S. (2004). Infrared spectra of , and D2O in the liquid phase by single-pass attenuated total internal reflection spectroscopy. Spectrochim. Acta Part A Mol. Biomol. Spectrosc. 60 (11), 2611–2619. doi:10.1016/j.saa.2003.12.042.
Lehmann, M. L., Yang, G., Gilmer, D., Han, K. S., Self, E. C., Ruther, R. E., et al. (2019). Tailored crosslinking of poly(ethylene oxide) enables mechanical robustness and improved sodium-ion conductivity. Energy Storage Mater. 21, 85–96. doi:10.1016/j.ensm.2019.06.028.
Ge, M., Lu, J., Chen, Z. W., and Amine, K. (2018). 30 years of lithium-ion batteries. Adv. Mater. 30 (33), 1800561. doi:10.1002/adma.201800561.
Liang, C. Y., and Krimm, S. (1958). Infrared spectra of high polymers. VI. Polystyrene. J. Polym. Sci. 27 (115), 241–254. doi:10.1002/pol.1958.1202711520.
Lu, M. F., Runt, J., and Painter, P. (2009). An infrared spectrocopic study of a polyester copolymer ionomer based on poly(ethylene oxide). Macromolecules 42 (17), 6581–6587. doi:10.1021/ma900978d.
Majeed, M. (2019). Ionic conductivity and reaction kinetics of lithium electrodes with solid polymer electrolytes. BS Undergraduate Honors, Tallahassee: Florida State University.
Matsuo, M., Ueno, T., Horino, H., Chujyo, S., and Asai, H. (1968). Fine structures and physical properties of styrene-butadiene block copolymers. Polymer 9 (8), 425–429. doi:10.1016/0032-3861(68)90052-9.
Matsuura, H., and Fukuhara, K. (1986). Vibrational spectroscopic studies of conformation of poly(oxyethylene). II. conformation-spectrum correlations. J. Polym. Sci. B Polym. Phys. 24 (7), 1383–1400. doi:10.1002/polb.1986.090240702.
Matsuura, H., and Miyazawa, T. (1969). Vibrational analysis of molten poly(ethylene glycol). J. Polym. Sci. A-2 Polym. Phys. 7 (10PA), 1735-&. doi:10.1002/pol.1969.160071009.
Metwalli, E., Rasool, M., Brunner, S., and Müller-Buschbaum, P. (2015). Lithium-salt-containing high-molecular-weight polystyrene-block-polyethylene oxide block copolymer films. ChemPhysChem 16 (13), 2882–2889. doi:10.1002/cphc.201500358.
Niitani, T., Shimada, M., Kawamura, K., and Kanamura, K. (2005). Characteristics of new-type solid polymer electrolyte controlling nano-structure. J. Power Sources 146 (1–2), 386–390. doi:10.1016/j.jpowsour.2005.03.102.
Oparaji, O. D. (2017). Influence of molecular transport on the structure-property relationships of amphiphilic block copolymer membranes. Ph.D, Tallahassee: Florida State University.
Oparaji, O., Narayanan, S., Sandy, A., Ramakrishnan, S., and Hallinan, D. (2018). Structural dynamics of strongly segregated block copolymer electrolytes. Macromolecules 51 (7), 2591–2603. doi:10.1021/acs.macromol.7b01803.
Oparaji, O., Zuo, X. B., and Hallinan, D. T. (2016). Crystallite dissolution in PEO-based polymers induced by water sorption. Polymer 100, 206–218. doi:10.1016/j.polymer.2016.08.026.
Panday, A., Mullin, S., Gomez, E. D., Wanakule, N., Chen, V. L., Hexemer, A., et al. (2009). Effect of molecular weight and salt concentration on conductivity of block copolymer electrolytes. Macromolecules 42 (13), 4632–4637. doi:10.1021/ma900451e.
Pennarun, P. Y., and Jannasch, P. (2005). Influence of the alkali metal salt on the properties of solid electrolytes derived from a Lewis acidic polyether. Solid State Ionics 176 (23–24), 1849–1859. doi:10.1016/j.ssi.2005.05.014.
Pesko, D. M., Timachova, K., Bhattacharya, R., Smith, M. C., Villaluenga, I., Newman, J., et al. (2017). Negative transference numbers in poly(ethylene oxide)-based electrolytes. J. Electrochem. Soc. 164 (11), E3569–E3575. doi:10.1149/2.0581711jes.
Pesko, D. M., Webb, M. A., Jung, Y. Y., Zheng, Q., Miller, T. F., Coates, G. W., et al. (2016). Universal relationship between conductivity and solvation-site connectivity in ether-based polymer electrolytes. Macromolecules 49 (14), 5244–5255. doi:10.1021/acs.macromol.6b00851.
Balsara, L., Sammon, C., Lyon, S. B., and Yarwood, J. (2004). An FTIR/ATR in situ study of sorption and transport in corrosion protective organic coatings. Prog. Org. Coat. 49 (4), 315–323. doi:10.1016/j.porgcoat.2003.10.007.
Pyun, S.-I. (1999). In-situ spectroelectrochemical analysis of the passivating surface film formed on a carbon film electrode as a function of the water content in 1 M LiPF 6 -EC/DEC solution. Fresenius' J. Anal. Chem. 363 (1), 38–45. doi:10.1007/s002160051135.
Rey, I., Johansson, P., Lindgren, J., Lassègues, J. C., Grondin, J., and Servant, L. (1998a). Spectroscopic and theoretical study of (CF3SO2)2N-(TFSI-) and (CF3SO2)2NH (HTFSI). J. Phys. Chem. A 102 (19), 3249–3258. doi:10.1021/jp980375v.
Rey, I., Lassègues, J. C., Grondin, J., and Servant, L. (1998b). Infrared and Raman study of the PEO-LiTFSI polymer electrolyte. Electrochim. Acta 43 (10–11), 1505–1510. doi:10.1016/s0013-4686(97)10092-5.
Rosedale, J. H., and Bates, F. S. (1990). Rheology of ordered and disordered symmetric poly(ethylenepropylene)-poly(ethylethylene) diblock copolymers. Macromolecules 23 (8), 2329–2338. doi:10.1021/ma00210a032.
Ruck, S., Enderle, S., Bolsinger, M., Weller, M., Knoblauch, V., and Riegel, H. (2019). “Enhancing the rate capability of highly densified Li-ion battery cathodes by selective laser ablation,” in Laser-based micro- and nanoprocessing XIII, eds. U. Klotzbach, A. Watanabe, and R. Kling (Bellingham: Spie-Int Soc Optical Engineering).
Ruzette, A.-V. G., Soo, P. P., Sadoway, D. R., and Mayes, A. M. (2001). Melt-formable block copolymer electrolytes for lithium rechargeable batteries. J. Electrochem. Soc. 148 (6), A537–A543. doi:10.1149/1.1368097.
Sammon, C., Mura, C., Yarwood, J., Everall, N., Swart, R., and Hodge, D. (1998). FTIR-ATR studies of the structure and dynamics of water molecules in polymeric matrixes. a comparison of PET and PVC. J. Phys. Chem. B 102 (18), 3402–3411. doi:10.1021/jp980169n.
Seo, Y., Shen, K.-H., Brown, J. R., and Hall, L. M. (2019). Role of solvation on diffusion of ions in diblock copolymers: understanding the molecular weight effect through modeling. J. Am. Chem. Soc. 141 (46), 18455–18466. doi:10.1021/jacs.9b07227.
Shieh, Y.-T., and Liu, K.-H. (2004). Conformational changes of poly(ethylene oxide) in poly(ethylene oxide)/poly(methyl methacrylate) blends by supercritical carbon dioxide. J. Polym. Sci. B Polym. Phys. 42 (13), 2479–2489. doi:10.1002/polb.10492.
Silverstein, R. M., Kiemle, D. J., and Webster, F. X. (2005). Spectrometric identification of organic compounds. Hoboken, NJ: John Wiley & Sons.
Stone, G. M., Mullin, S. A., Teran, A. A., Hallinan, D. T., Minor, A. M., Hexemer, A., et al. (2012). Resolution of the modulus versus adhesion dilemma in solid polymer electrolytes for rechargeable lithium metal batteries. J. Electrochem. Soc. 159 (3), A222–A227. doi:10.1149/2.030203jes.
Suo, L. M., Zheng, F., Hu, Y.-S., and Chen, L. Q. (2016). FT-Raman spectroscopy study of solvent-in-salt electrolytes. Chinese Phys. B 25 (1), 016101. doi:10.1088/1674-1056/25/1/016101.
Teran, A. A., and Balsara, N. P. (2014). Thermodynamics of block copolymers with and without salt. J. Phys. Chem. B 118 (1), 4–17. doi:10.1021/jp408079z.
van Asselen, O. L. J., van Casteren, I. A., Goossens, J. G. P., and Meijer, H. E. H. (2004). Deformation behavior of triblock copolymers based on polystyrene: an FT-IR spectroscopy study. Macromol. Symp. 205, 85–94. doi:10.1002/masy.200450108.
Vélez, J. F., Aparicio, M., and Mosa, J. (2016). Effect of lithium salt in nanostructured silica-polyethylene glycol solid electrolytes for Li-Ion battery applications. J. Phys. Chem. C 120 (40), 22852–22864. doi:10.1021/acs.jpcc.6b07181.
Villaluenga, I., Pesko, D. M., Timachova, K., Feng, Z. E., Newman, J., Srinivasan, V., et al. (2018). Negative Stefan-Maxwell diffusion coefficients and complete electrochemical transport characterization of homopolymer and block copolymer electrolytes. J. Electrochem. Soc. 165 (11), A2766–A2773. doi:10.1149/2.0641811jes.
Wheatle, B. K., Keith, J. R., Mogurampelly, S., Lynd, N. A., and Ganesan, V. (2017). Influence of dielectric constant on ionic transport in polyether-based electrolytes. ACS Macro Lett. 6 (12), 1362–1367. doi:10.1021/acsmacrolett.7b00810.
Wieczorek, W., Florjanczyk, Z., and Stevens, J. R. (1995). Composite polyether based solid electrolytes. Electrochim. Acta 40 (13–14), 2251–2258. doi:10.1016/0013-4686(95)00172-b.
Wright, P. V. (1975). Electrical conductivity in ionic complexes of poly(ethylene oxide). Brit. Poly. J. 7 (5), 319. doi:10.1002/pi.4980070505
Yang, G., Ivanov, I. N., Ruther, R. E., Sacci, R. L., Subjakova, V., Hallinan, D. T., et al. (2018). Electrolyte solvation structure at solid-liquid interface probed by nanogap surface-enhanced Raman spectroscopy. ACS Nano 12 (10), 10159–10170. doi:10.1021/acsnano.8b05038.
Nanda, J., and Wu, P. Y. (2007). Crystallization process of poly(ɛ-caprolactone)-poly(ethylene oxide)-poly(ɛ-caprolactone) investigated by infrared and two-dimensional infrared correlation spectroscopy. Polymer 48 (12), 3477–3485. doi:10.1016/j.polymer.2007.04.021.
Zhang, H. C., and Wang, J. J. (2009). Vibrational spectroscopic study of ionic association in poly(ethylene oxide)-NH4SCN polymer electrolytes. Spectrochim. Acta Part A: Mol. Biomol. Spectrosc. 71 (5), 1927–1931. doi:10.1016/j.saa.2008.07.018.
Keywords: polymer electrolytes, Fourier transform infrared spectroscopy, block copolymer, composite electrolytes, solid electrolytes
Citation: Kim K, Kuhn L, Alabugin IV and Hallinan DT (2020) Lithium Salt Dissociation in Diblock Copolymer Electrolyte Using Fourier Transform Infrared Spectroscopy. Front. Energy Res. 8:569442. doi: 10.3389/fenrg.2020.569442
Received: 04 June 2020; Accepted: 26 August 2020;
Published: 24 September 2020.
Edited by:
Tomonori Saito, Oak Ridge National Laboratory (DOE), United StatesReviewed by:
Lu Han, Oak Ridge National Laboratory (DOE), United StatesRose Ruther, Solid Power, United States
Copyright © 2020 Kim and Hallinan Jr. This is an open-access article distributed under the terms of the Creative Commons Attribution License (CC BY). The use, distribution or reproduction in other forums is permitted, provided the original author(s) and the copyright owner(s) are credited and that the original publication in this journal is cited, in accordance with accepted academic practice. No use, distribution or reproduction is permitted which does not comply with these terms.
*Correspondence: Daniel T. Hallinan Jr., dhallinan@eng.famu.fsu.edu