Drivers and Policy Choices of Industrial Total-Factor Coal Productivity: Evidence From Eastern China
 Di Wang
 Yueying Zhao3,4*
 - 1School of Economics and Management, China University of Mining and Technology, Xuzhou, China
- 2Center for Environmental Economics and Management Research, China University of Mining and Technology, Xuzhou, China
- 3School of Mathematics, China University of Mining and Technology, Xuzhou, China
- 4School of Mathematics and Statistics, Xuzhou University of Technology, Xuzhou, China
Identifying the critical factors of industrial total-factor coal productivity (TCP) and its promotion paths will help achieve the goals of regional energy conservation and pollution reduction. Based on the perspective of total-factor productivity, this paper integrates the methods of stochastic frontier analysis (SFA), Kaya identity, and STIRPAT model to systematically diagnose the temporal and spatial characteristics and the heterogeneous sources of the industrial TCP in 11 provinces of eastern China, and it proposes some differentiated regulatory policies for different provinces. The results show that the TCP is increasing year by year and tends to converge, which indicates that increasing TCP is more and more challenging. Further research shows that there are significant spatial differences in the impact of the economic development level (EDL), industrial economic structure (IES), energy consumption intensity (ECI), and energy consumption structure (ECS) on industrial TCP. As the original driving factors of technological progress, the impact of R&D investment intensity (RII) and R&D investment levels (RIL) on industrial TCP is relatively consistent in different regions. The former has a negative congestion effect on TCP due to the imbalance of R&D investment structure, while the latter has a positive effect on TCP. Therefore, the eastern region should increase R&D expenditure and optimize R&D expenditure structure as a general way to improve TCP in each region and adopt differentiated regulatory policies in economic development and energy utilization according to local conditions.
Introduction
With the development of economy and the acceleration of industrialization, problems such as resource shortage and air pollution have become increasingly serious. How to coordinate the development of economy and environment has become a topic of common concern for the whole society. Therefore, while developing the economy, we must also pay attention to energy saving and emission reduction, so as to coordinate economic and environmental benefits. Through previous studies, we know that improving energy efficiency is an essential means of energy saving and emission reduction (Guan et al., 2014; Mardani et al., 2017; Wang et al., 2019a). The key to energy saving is to define the factors that affect the total-factor coal productivity (TCP) in the industrial sector. Besides, affected by industry-dominated industrial structure and coal-dominated energy structure, improving TCP in the industrial sector is related to the economy’s sustainable development, and it is an important means to resolve air pollution (Hou et al., 2018; Zhao et al., 2018; Xiong et al., 2019). Based on the above, it is urgent to study how to identify important influencing factors and how to choose the upgrade path of TCP in consideration of regional differences. Therefore, this paper analyzes the evolution trends and regional differences, key factors, and possible improvement paths of industrial coal productivity. It contributes to industrial energy saving and emission reduction and has an important significance for the economic transformation and upgrading.
For energy productivity measurement, single-factor and total-factor energy productivity are usually used. The former, traditionally represented by energy intensity, is used to measure the relationship between energy input and economic output. It is easy to operate but cannot measure the potential technology efficiency and ignores the substitution effect of production factors such as labor and capital on energy (Zhou et al., 2008). In comparison, the substitution elasticity of energy and other production factors is considered, and the defects mentioned above are overcome in the total-factor energy productivity (Wang et al., 2016; Liu and Bae, 2018). As for the measurement methods, the most used methods are non-parametric data envelopment analysis (DEA) and parametric SFA (Chen et al., 2015; Iftikhar et al., 2016; Wang et al., 2018). Comparatively speaking, as the DEA is a mathematical programming method that does not include statistical noise, its estimate of efficiency value may be biased, and its measurement results are easily affected by extreme values (Yang et al., 2011). The SFA method can identify the ineffectiveness of various influencing factors and analyze the factors affecting efficiency while calculating the efficiency, thus avoiding the deficiency of the DEA two-step method (Feng et al., 2017; Gong, 2018). Therefore, considering random noise, the SFA method is applied to measure the industrial TCP in this paper.
There are large spatial differences in China’s energy productivity. For example, He et al. (2018) studied the industrial sector’s energy productivity and found that the energy productivity in the eastern region was higher than that in the central and western regions. Zhao et al. (2014) studied industrial energy productivity and found that energy productivity gaps in the eastern region were narrowing, while in the west and central regions, they were widening. In studying the economic and environmental efficiency of energy consumption, Lu et al. (2019) found a positive spatial correlation between the economic and environmental efficiency of energy consumption. The productivity of coastal areas in eastern China was relatively high, while that of inland areas in central and western China was relatively low. Overall, energy productivity is high in the eastern region and low in the west and central regions.
As for the influencing factors of energy productivity, energy productivity is affected by technology, energy structure, economic development, industrial structure, and others. However, due to the differences in research methods or samples, different scholars' research conclusions were not the same (Ang and Xu, 2013; Meng et al., 2015). For the technological level, it is generally believed that its improvement will increase energy productivity. For example, Ouyang et al. (2019) found that the technical level was the main driving force for energy efficiency growth. In contrast, Jiang and Zha (2015) found that R&D expenditures from enterprises could improve it, but those from the government would inhibit it. Energy structure is also an important influencing factor in energy productivity. Most scholars believed that the high-carbon energy consumption structure was not beneficial to improving energy productivity (Li and Shi, 2014). For example, Teng et al. (2018) hold that the industrial sector’s productivity has not been significantly improved only because the optimization of energy consumption structure and the treatment of emission reduction have reduced pollution emissions. Besides, many scholars were also concerned about the relationship between economic development and energy productivity, but the research results differed. For example, Zhao et al. (2014) and Lu et al. (2019) found that there was a positive correlation between economic development and energy productivity, but Zhou et al. (2018) found that there was a U-shaped relationship. The industrial structure has an important impact on regional energy productivity. In general, the increase in the proportion of the secondary industry characterized by high energy consumption would reduce energy productivity, but the increase in the proportion of the tertiary industry characterized by low energy consumption would increase energy productivity (Wang et al., 2019b).
The spatial evolution trends of industrial coal productivity and the spatial differences of the influence of related factors on TCP need to be further examined. What is more, many scholars used to adopt energy intensity, which was an indicator of output-type technological progress, to explore the influence of technological progress on the TCP. In contrast, few scholars comprehensively consider the impact of input-type and output-type technological progress. Therefore, this paper takes per capita R&D investment and R&D investment proportion as input-type technological progress factors to examine their regional energy efficiency implications.
As for the research methods for the influencing factors of energy productivity, the method of the factor decomposition and the econometric analysis are most widely used. However, data availability often limits the former, and its conclusions can only provide a general direction for policy improvement. Therefore, many scholars use econometric methods to analyze the influencing factors of energy efficiency. Overall, all methods have advantages and disadvantages. For example, the Ordinary Least Square (OLS) method often leads to biased estimation results (Li and Shi, 2014), and the Tobit model is also a commonly used method. But Simar and Wilson (2007) found that the Tobit regression would show inconsistent results with the deterioration in DEA, and the truncated model was more applicable to related research. However, the truncated model has some defects. Liu and Lin (2018) pointed out that the truncated regression would lose some observations and decrease sample size. Generalized-moment-method estimator (GMM) was also a method for analyzing the main factors affecting energy productivity. This method could significantly improve the efficiency of the estimates and solve the endogenous variable. However, compared with other methods, GMM introduces more estimates of the variables. Although this method would improve the estimated results’ consistency, it may cause excessive restriction to generate estimated bias (Jiang and Zha, 2015). Considering the spatial differences in the influencing factors of industrial coal productivity, this paper uses a panel data model. This method is more beneficial to revealing the spatial differences and the promotion paths of the influencing factors of regional coal productivity than using time series data or cross-sectional data alone.
Generally speaking, the existing literature has carried out extensive research on energy productivity and put forward many useful insights, but some shortcomings also exist. First, many scholars mostly measure energy productivity by energy intensity, and the result is difficult to reflect the real energy utilization efficiency, while there are few studies on TCP. Second, based on the research objects (provinces, industries, and cities), most scholars do not consider different impacts of heterogeneous factors such as resource endowments, institutional environment, and industrial structure on TCP (Lu et al., 2019). Moreover, the existing research on provincial energy productivity is usually based on the dynamic panel data model, such as system GMM. Although this method can avoid endogenous problems of variables, it leads to overconstraints and thus produces estimation bias, and it is difficult to portray the spatial differences of heterogeneous influencing factors of TCP. Finally, most of the influencing factors of regional energy productivity are selected based on subjective experience or existing literature, lacking a theoretical basis.
The efficient use of coal resources depends on a differentiated policy support system. However, there is still a lack of consistent analysis framework concerning the measurement of the coal utilization efficiency, the description of its internal heterogeneities, and the analysis of related influencing factors within the existing literature. In addition, the previous literature rarely considered the impact of technological progress on TCP in terms of input and output.
Based on the above deficiencies, the contribution of our paper is threefold. First, the TCP in the eastern region is taken as the research object to discuss its influencing factors’ spatial differences. China’s industrial structure is dominated by the industrial sector, and the energy consumption structure is dominated by coal. The eastern part of China is the center of economic development and energy consumption. At the same time, it is facing problems such as resource shortage and environmental carrying capacity constraints. Therefore, this paper takes 11 provinces in eastern China as the research objects. The results are more targeted and operable for industrial energy saving and emission reduction. Second, based on the expanded Kaya identity, this paper measures energy technology progress from two aspects; that is, it considers the impact of technological progress on total-factor coal productivity comprehensively. Per capita R&D investment and R&D investment proportion are regarded as input-type technological progress, and industrial energy intensity is used as output-type to examine the effect on TCP. Third, based on the STIRPAT model, the spatial differences of various influencing factors in China’s eastern region on TCP are empirically analyzed to clarify the possible paths for the improvement of coal productivity and thus to promote the energy saving and emission reduction in the industrial sector and the transformation and upgrade of the regional economy.
The remainder of this paper is organized as follows. Section 2 describes the research methods and sample data. Section 3 presents the empirical results. Section 4 discusses the impact of various influencing factors on the industrial TCP in the eastern region and the differences between regions, and Section 5 concludes.
Methodology
Stochastic Frontier Analysis
Stochastic frontier analysis (SFA) is proposed by Aigner et al. (1977). Its main feature is that it adopts a combined error term composed of symmetric random error and new unilateral error. This method can not only capture the random influence of environmental factors but also measure the non-effectiveness. Compared with the traditional DEA method, SFA is more convenient to compare and analyze different objects. Its discriminant ability is stronger, especially in the processing of panel data (Zhang and Lu, 2017). Referring to the modeling ideas of Battese and Coelli (1995), this paper expresses the stochastic frontier production function of TCP as follows.
where i and t represent the ith region and tth period, respectively,
Before measuring the TCP through the stochastic frontier production function, the form of the production function must be determined first. The production functions in the existing literature mainly include the Cobb-Douglas production function and the trans-logarithmic production function. In comparison, the latter can reflect the interaction of input factors on output. Therefore, this paper uses the trans-logarithmic production function to measure the TCP. Based on the research ideas of Zhang and Lu (2017), this paper sets capital, labor as fixed investment, and industrial coal consumption as a variable input, establishing the trans-logarithmic production function as follows:
where IEA represents the industrial value-added (100 million yuan), K represents the net value of industrial fixed assets (100 million yuan), L represents the total population of industrial employees (10 thousand people), and ICC represents the industrial coal consumption (10 thousand tons). This paper measures TCP by the ratio of IEA to industrial coal consumption (ICC), subtracting lnICC from both sides of model Eq. 3 simultaneously:
Therefore, the industrial TCP can be measured based on model Eq. 4.
Kaya Identity
Kaya identity integrates social, economic, energy, environmental, and technological subsystems and is described by a simple mathematical identity (Kaya, 1989). Because of simple structure and intuitive calculation, it is widely used to analyze the influencing factors in greenhouse gas emissions, energy consumption, and other research fields (Lima et al., 2016; Wu et al., 2016). Kaya identity is expanded in this paper to define the influencing factors of TCP, as shown in model Eq. 5.
where GDP represents the regional gross domestic product. TEC represents terminal energy consumption. RDI represents internal expenditures for regional research and development. IES indicates the industrial economic structure, represented by the proportion of IEA to GDP. EDL is the per capita GDP to measure the level of economic development. ECS represents the proportion of ICC to TEC to measure the energy consumption structure in the industrial sector. Therefore, a high degree of the ECS means that the industrial sector uses more coal, while other sectors use less. That is, coal resources are concentrated in the industrial sector. It is well known that the industrial sector has high coal utilization efficiency, so increasing the proportion of coal consumption in total energy consumption is more conducive to energy saving and emission reduction. ECI denotes TEC per unit of GDP to measure the level of output-type technological progress. RII is the proportion of R&D expenditures to regional GDP to measure the intensity of R&D expenditures. RIL indicates the R&D investment level, measured by per capita R&D investment. According to model (5), TCP is mainly affected by factors such as industrial economic structure (IES), economic development level (EDL), industrial energy consumption structure (ECS), energy consumption intensity (ECI), R&D investment intensity (RII), and R&D investment level (RIL).
STIRPAT Model
Based on the identification of the influencing factors, the STIRPAT model is used to analyze the asymmetrical impact of IES, EDL, ECS, ECI, RII, and RIL on TCP in this paper. The STIRPAT model facilitates the avoidance of cross-sectional dependence, heterogeneity, and nonlinear transformation of potential integration variables (Liddle, 2015). On this basis, the logarithm on both sides of model Eq. 6 is taken, and a panel data model Eq. 7 for influencing factors of industrial coal productivity in eastern China is obtained:
where
where n is the number of cross-section objects; k is the number of explanatory variables; T is the number of periods. S1, S2, and S3 represent the sum of squares of residuals of the variable coefficient model, variable intercept model, and constant-coefficient model, respectively. If the model accepts hypothesis H1, it means that the model should be set as the constant coefficient model. If H1 is rejected, it is necessary to check further whether H2 is received. If H2 is accepted, the local boundary model should be selected; otherwise, it should be set as the variable coefficient model.
This paper uses this method to determine the type of panel data and then empirically analyzes the influencing factors of industrial TCP of 11 provinces in eastern China.
Sample and Data
Affected by industry-dominated industrial structure and coal-dominated energy structure, energy consumption in the east of China has increased dramatically in recent years (Wang et al., 2020; Xu et al., 2020). Therefore, studying the industrial TCP in the region and its influencing factors will help formulate differentiated energy saving measures and paths. This paper takes the data from 2000 to 2018 in 11 provinces in eastern China as samples (Beijing City, Tianjin City, Hebei Province, Liaoning Province, Shanghai City, Jiangsu Province, Zhejiang Province, Fujian Province, Shandong Province, Guangdong Province, and Hainan Province). The indexes of GDP, industrial value-added (IEA), and the net value of industrial fixed K are derived from the “China Statistical Yearbook (2000–2019)”, and K is calculated by subtracting the accumulated depreciation from the original value of the fixed assets of industrial enterprises above designated size. For excluding the price factor, GDP, IEA, and K of each province have been deflated to constant price referring to 2019.
Because of the availability of data, POP represents the average employee number of industrial enterprises above designated size; the data is derived from “China Industrial Statistical Yearbook (2000–2019)”; the missing data are obtained from the statistical yearbooks of each province; terminal energy consumption (TEC) and industrial coal consumption (ICC) are sourced from the regional energy balance sheet in “China Energy Statistical Yearbook”; R&D investment intensity (RII) and R&D investment level (RIL) are derived from “China Science and Technology Statistical Yearbook (2000–2019)”.
Results
Calculation Results of TCP in Eastern China
Based on the SFA model, this paper calculates the industrial total factor coal productivity of 11 provinces in eastern China from 2000 to 2018, and the results are shown in Table 1. On the whole, the industrial TCP in the east of China has been increasing year by year, but there are obvious spatial and temporal differences in the annual average growth rate and cumulative increment of industrial TCP.
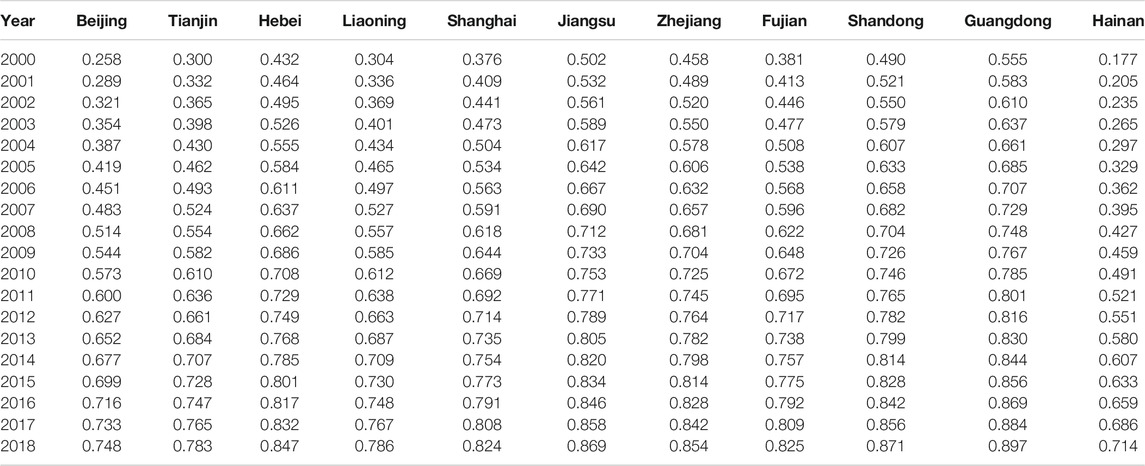
TABLE 1. Results of TCP in eastern China from 2000 to 2018.
As shown in Table 1, the industrial TCP of 11 provinces shows growth trends from 2000 to 2018. However, due to the heterogeneity of regional social and economic development, there are obvious regional differences in industrial TCP of various provinces. For example, the industrial TCP in Guangdong, Jiangsu, Shandong, Zhejiang, and Hebei provinces is obviously higher than the average level in the eastern region, which indicates that the industrial TCP in these provinces has limited potential for improvement in the future. In contrast, the industrial TCP of the four provinces of Liaoning, Tianjin, Beijing, and Hainan is significantly lower than the average level of eastern China, which indicates that the TCP of these provinces has great potential for improvement in the future.
In terms of the change trends, the regional differences in TCP tend to decrease. As shown in Figure 1, its growth rate and the increment are significant in Beijing, Tianjin, Liaoning, and Hainan provinces during the inspection period. For example, the TCP in Hainan province increased from 0.177 in 2000 to 0.714 in 2018, and its average annual growth rate reached 8.06%. In contrast, due to the relatively large base of the TCP in Hebei, Zhejiang, Jiangsu, Shandong, Guangdong, and other provinces, its growth rate and the increment are not significant. However, their TCP is still at a relatively high level. Besides, the regional gap in TCP in the eastern region decreases year by year, and its growth rate tends to converge. The maximum inter-provincial gap in TCP was 0.378 in 2000, and the maximum inter-provincial gap in 2018 was 0.183. Meanwhile, the regional differences in the growth rate of TCP fell from 10.77% to 2.86%, and the growth rate showed convergence trends, which means that China's regional energy productivity has astringency (Zhang and Lu, 2017).
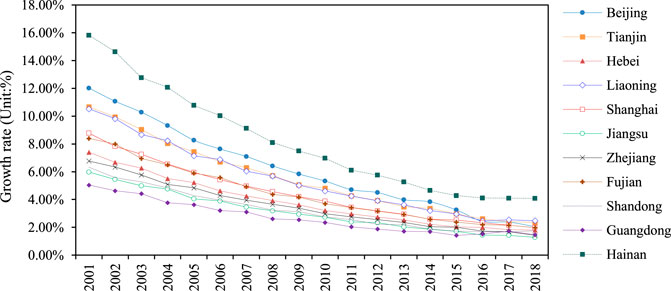
FIGURE 1. Changes in the annual growth rate of TCP in eastern China.
In general, there are great regional differences in the industrial TCP in eastern China. All regions’ TCP increases year by year. The changes in its growth rate and the increment value tend to converge, which means that the potential for improvement in the industrial TCP is relatively limited. As we all know, the different levels of economic development lead to different industrialization processes in various regions, so the energy utilization technology and utilization efficiency of each region are also different (Steven, 1997). The reason why Hainan Province has the largest growth rate at the beginning is because the base number is small and it is in the growth period, while the other regions are in the mature or decline period of the life cycle and the TCP base is relatively large, so the growth rates and increments are not significant. Therefore, it is necessary to identify the key influencing factors and improvement paths that affect regional TCP.
Empirical Results of TCP Influencing Factors
The unit root test is usually used to judge the data stationarity to avoid spurious regression (Harris et al., 2020). According to the IPS, Fisher-ADF, and Fisher-PP tests, the results in Table 2 show that the first-order difference terms of all variables are stationary. Further, the results of the Kao test show that the null hypothesis of “no co-integration relationship” is rejected at 1% significant level, so the co-integration relationship exists among the variables.
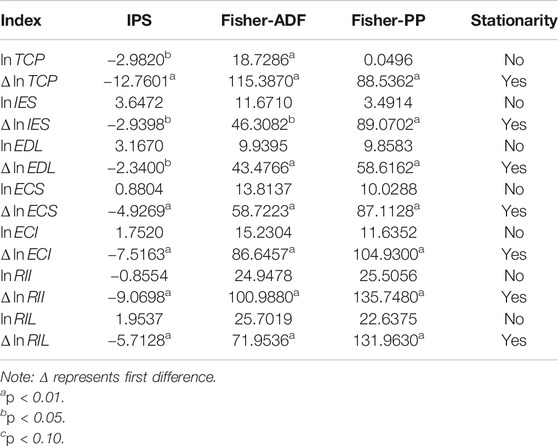
TABLE 2. The results of the unit root test.
On this basis, this article uses the Hausman test to determine the type of panel data model. According to the test results in Table 3, F1>F0.05 (70,132), F2>F0.05 (60,132). Therefore, this paper chooses the variable coefficient model to analyze the influencing factors of industrial TCP.
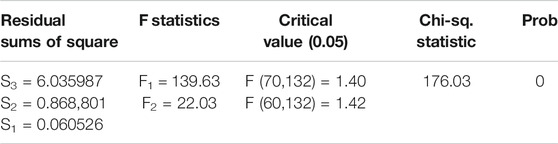
TABLE 3. Results of covariance analysis and Hausman test.
Because of the serial correlation and the cross-sectional heteroskedasticity of panel data, this paper uses the CS-SUR method to make an empirical test on the panel data of 11 eastern provinces from 2000 to 2018. The results show that the model passes the F-statistic at the 1% significance level, and most of the estimated coefficients in the panel data model pass the t-test, which indicates that the model fits well (Table 4).
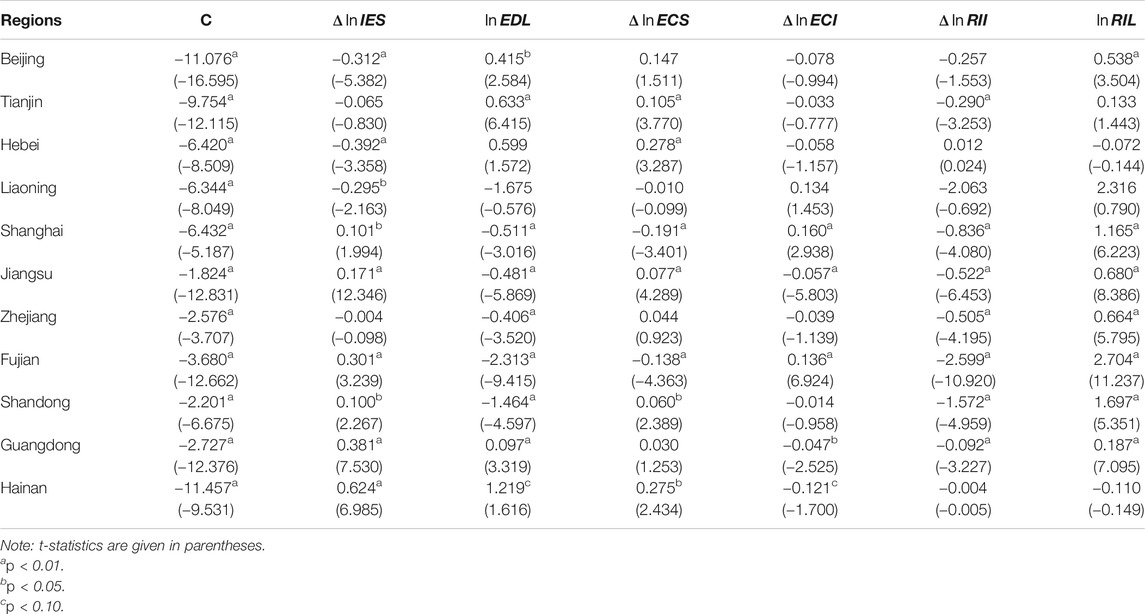
TABLE 4. Regression coefficient test results of influencing factors of TCP.
Overall, there are noticeable regional differences in the influence of different factors on industrial TCP. From the perspective of the contribution of various factors to TCP, the coal consumption structure and R&D investment level have a positive effect on the industrial TCP; the energy intensity and R&D investment intensity have a negative effect on the industrial TCP; and the impact of industrial economic structure and economic development level has large regional differences. The contribution of each influencing factor is discussed in detail below.
Discussion
Influencing Factors of TCP in Eastern China
Based on the empirical test results, this article further discusses the influencing factors of the industrial TCP in eastern China to clarify the possible paths for the promotion of regional TCP.
Regional Differences in the Impact of EDL on TCP
From the test results, the economic development level (EDL) has significant impacts on the TCP. Its influence effect is positive in some provinces such as Beijing, Tianjin, Hebei, Guangdong, and Hainan, and the elasticity coefficients are 0.415, 0.633, 0.599, 0.097, and 1.219, respectively. In contrast, the EDL of Shanghai, Jiangsu, Zhejiang, Fujian, and Shandong provinces has inhibited the increase in industrial TCP, and the elasticity coefficients were −0.511, −0.481, −0.406, −2.313, and −1.464, respectively.
In fact, due to the regional differences in the industrial structure, resource endowments, and economic development of eastern China, the U-shaped relationship between economic development and energy efficiency is usually not uniform in different regions and economic planning period (Huang and Wang, 2017; Zhou et al., 2018). Meanwhile, the impact of the EDL on TCP in Liaoning Province does not pass the significance test, and it may be caused by data falsification in recent years.
Regional Differences in the Impact of IES on TCP
According to the empirical results, the influence of industrial economic structure (IES) on TCP shows significant regional differences. It can be seen that, in Tianjin and Zhejiang, the IES is not a critical factor affecting TCP, while in other provinces, the IES is an essential factor affecting TCP. In comparison, IES greatly influences the industrial TCP in Beijing, Hebei, Liaoning, Fujian, Guangdong, and Hainan provinces, but it has relatively small effects in Shanghai, Jiangsu, and Shandong provinces. As shown in Table 4, the IES of Shanghai, Jiangsu, Fujian, Shandong, Guangdong, and Hainan provinces significantly promoted the improvement of industrial TCP, while it had a negative impact on Beijing, Hebei, and Liaoning provinces. Table 4 shows that there are significant regional differences in the promotion effect of industrialization on total-factor coal productivity.
The root cause lies in the different stages of industrialization in 11 provinces in eastern China. When the degree of industrialization is not high enough, regional development pursues more economic development, ignoring the utilization of coal resources and the protection of the ecological environment (Long et al., 2016). In the post-industrial stage, the economic level reaches a certain height. The region pays more attention to the improvement of coal resource productivity and the coordinated development of social economy, energy utilization, and ecological environment (Li and Dewan, 2017).
Regional Differences in the Impact of ECS on TCP
From the empirical results, there are spatial differences in the impact of ECS on TCP. The ECS in Shanghai, Liaoning, and Fujian Province has a negative impact on the TCP, while the ECS in other provinces has a positive impact on the TCP. It is found that the ECS of Hebei and Hainan provinces has a greater impact on the TCP, while the ECS of Jiangsu and Shandong provinces has a relatively small effect on the TCP. According to the definition, the ECS represents the proportion of coal consumption in total energy consumption. The larger the ECS, the higher the proportion of industrial coal consumption in the total energy consumption, which means that the degree of centralized utilization of coal resources will be greater. In fact, the centralized utilization of coal resources is more conducive to promoting and applying energy saving technology and improving energy efficiency (Li and Dewan, 2017).
In comparison, the impact of ECS in Shanghai and Fujian does not meet the theoretical expectations. As shown in Figure 2, with the rapid development of high-tech industries in Shanghai, the economic status of the secondary industry gradually gives way to the tertiary industry, and the industrial economic structure reached 26.61% in 2018. Meanwhile, the energy consumption structure is gradually optimizing in Shanghai, and the coal consumption structure is declining year by year and concentrates in the industrial sector. According to statistics, the coal consumption of Shanghai's industrial sector in 2018 was 31.51 million tons of standard coal, accounting for 99.78% of the total coal consumption and 3.02% of the total energy consumption. It can be argued that, in Shanghai, the shrinkage of economic structure and the centralized utilization of coal resources in the industrial sector are the reasons that cause the coal consumption structure to have a negative impact on the industrial TCP.
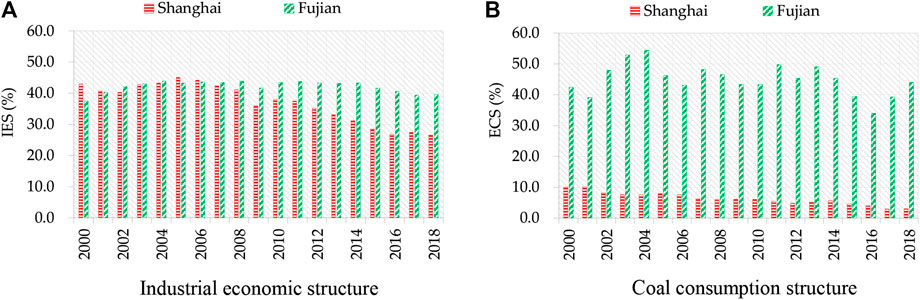
FIGURE 2. Comparison of IES and ECS between Shanghai and Fujian Province. (A) Industrial economic structure. (B) Coal consumption structure.
For Fujian Province, the industrial economic structure changed slightly during the investigation period, from 37.50% in 2000 to 39.61% in 2018. In terms of the coal consumption structure, coal consumption in Fujian Province is mainly concentrated in the industrial sector. In 2018, the industrial sector's total coal consumption was 57.50 million tons of standard coal, accounting for 44.04% of the total terminal energy consumption and 66.36% of the total industrial energy consumption. It can be considered that the excessive concentration and scale effect of the industrial coal consumption are the fundamental reasons for the negative impact of the ECS on the industrial TCP. Therefore, promoting economic transformation and intensive utilization of coal resources are the important ways to improve the industrial TCP in Fujian Province (Xie et al., 2015).
Regional Differences in the Impact of ECI on TCP
According to Table 4, there are noticeable regional differences in the impact of ECI on industrial TCP in eastern China. The impact of ECI on TCP has not passed the significance test in sample areas such as Beijing, Tianjin, Hebei, Liaoning, Zhejiang, and Shandong provinces, which shows that whether the energy efficiency driven by technological innovation in these regions can improve the industrial TCP has not been supported by empirical data.
In comparison, the ECI in Shanghai, Jiangsu, Fujian, Guangdong, and Hainan has significant effects, but there are noticeable regional differences. The ECI of Jiangsu, Guangdong, and Hainan has negative impacts, which is in accord with theoretical expectations, while the ECI in Shanghai and Fujian has positive impacts. According to the analysis, ECI is a biased single-factor indicator of energy efficiency, with the implicit assumption that economic growth is mainly driven by energy consumption and technological progress, without considering the substitution elasticity of various production factors and energy input structures for economic growth (Norman, 2017; Adom et al., 2018). According to the empirical results of Shanghai and Fujian, the increase in ECI leads to an increase in the industrial TCP. Considering the bias of energy intensity indicators, the reduction of regional energy efficiency does not mean the decrease of industrial TCP (Cao et al., 2017).
Regional Differences in the Impact of RII on TCP
As we all know, advanced equipment utilization and higher technological input help reduce inefficient energy systems, which is beneficial in improving total-factor energy productivity (Beyzanur et al., 2018). According to the test results, the impact of RII on TCP in Hebei, Liaoning, and Hainan provinces does not pass the significance test. In contrast, the RII in other provinces has a significant negative effect on the TCP, which does not meet the theoretical expectations.
There are two reasons for this result. On the one hand, the utilization efficiency of R&D investment in the eastern provinces is relatively low. The transformation and application of R&D achievements are relatively few, leading to the fact that the industrial TCP does not improve with the growth of RII. Especially in Hebei, Liaoning, and Hainan provinces, RII has no significant impact on TCP, and their RII is less than the national average of 2.07% (as shown in Figure 3), which indicates that RII needs to cross a certain threshold to promote the increase in TCP significantly. Therefore, improving the utilization efficiency of R&D funds and promoting the transformation and application of R&D achievements are important ways to improve the industrial TCP (Medina et al., 2016). On the other hand, the imbalance of the investment structure of R&D expenditure is also not conducive to the increase in TCP. In fact, the R&D expenditure in the eastern regions is mainly for high-tech industries and emerging industries. In contrast, the proportion of the total R&D expenditure in the energy-intensive industrial sector is relatively small. In other words, due to the imbalance of the input structure of R&D funding, high-tech industries have a certain crowding-out effect on energy-intensive industries in terms of total-factor energy efficiency improvement.
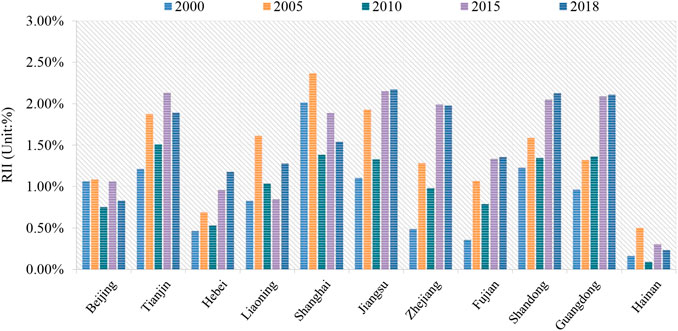
FIGURE 3. Regional comparison of RII in eastern China.
Regional Differences in the Impact of RIL on TCP
According to the empirical results, the RIL of Beijing, Tianjin, Shanghai, Jiangsu, Zhejiang, Fujian, Shandong, and Guangdong provinces has significantly positive effects on industrial TCP, while in Hebei, Liaoning, and Hainan provinces, the RIL does not pass the significance test. As shown in Figure 4, the R&D expenditure of 11 provinces in eastern China has increased year by year, but each province’s growth rate is quite different. The RIL of Beijing, Tianjin, and Shanghai is relatively large, while that of Hebei, Liaoning, and Hainan is relatively low. Taking 2018 as an example, the RIL of Hebei, Liaoning, and Hainan was 505.55, 689.61, and 121.74 yuan per capita, respectively, being far lower than the average level of 1,419.53 yuan per capita in eastern China. It implies that the quantitative changes will cause qualitative changes; that is, when R&D expenditure reaches a certain scale, it can promote the increase in industrial TCP. Therefore, we can conclude that increasing R&D investment is an important way to improve the industrial TCP.
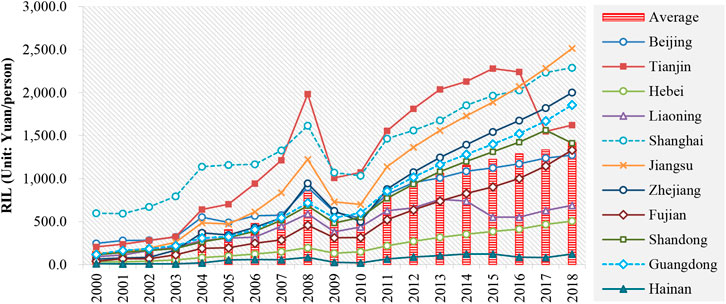
FIGURE 4. Changes in RIL in eastern China in 2000–2018.
Promotion Paths for TCP in Eastern China
Determining the critical factors of industrial TCP and its upgrade path will help achieve the win-win goals of energy conservation and pollution reduction in eastern China. According to the empirical results, due to the regional differences in economic development, energy utilization, and R&D investment in the 11 eastern provinces of China, there are significant regional differences in the impact of various influencing factors on industrial TCP. We compared the contribution of various influencing factors to TCP, and the results are shown in Table 5.
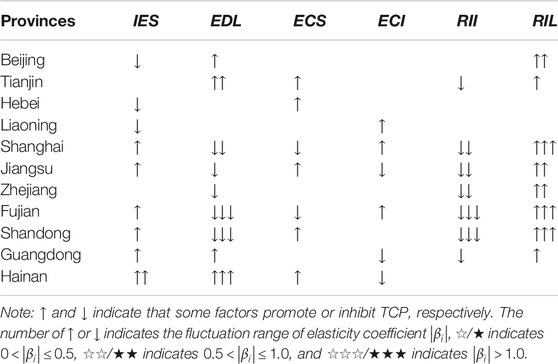
TABLE 5. Analysis of the critical paths to improving the industrial TCP in eastern China.
According to Table 5, it can be seen that the contribution of the influencing factors of industrial TCP in eastern China is not consistent. Overall, the IES, EDL, ECS, and ECI have heterogeneous effects on industrial TCP in the 11 provinces in eastern China. The RII has a negative inhibitory effect, while RIL has a positive promotion effect. Promoting R&D investment and the transformation of scientific research results are the generic ways to increase the industrial TCP. Therefore, to improve the TCP of the industrial sector in eastern China, differentiated adjustment policies should be formulated in law and market according to local conditions (Liu et al., 2016). In terms of the 11 provinces in eastern China, each province has a different critical path to promote the industrial TCP.
• For Beijing, the IES, EDL, and RIL have a significant impact on TCP. Therefore, the key to improving industrial TCP in Beijing lies in optimizing its industrial structure, promoting economic development, and increasing R&D investment.
• For Tianjin, the factors EDL, ECS, and RII have a significant impact on industrial TCP. Therefore, the key to improving industrial TCP in Tianjin is to accelerate economic development, promote the centralized utilization of coal resources, and increase R&D investment and the transformation and application of its achievements.
• For Hebei Province, considering the significant impact of IES and ECS on industrial TCP, the key to improving industrial TCP in Hebei Province is to optimize the economic structure and the coal consumption structure in its industrial sector.
• For Liaoning Province, the impact of IES and ECI on industrial TCP is slightly significant. Therefore, the key to improving industrial TCP in Liaoning Province is to optimize the industrial structure and intensive utilization of energy.
• For Liaoning Province, the impact of IES on industrial TCP is more significant, while the impact of ECI on TCP is slightly significant. Therefore, the key to enhancing industrial TCP in Liaoning Province in the future is to optimize the industrial structure and pay attention to the intensive utilization of energy resources.
• For the Shanghai Municipality and Fujian Province, the industrial TCP is mainly affected by EDL, RII, and RIL. Therefore, accelerating economic development, increasing R&D expenditures, and accelerating the transformation and application of R&D results are the critical paths to improve their industrial TCP.
• For Jiangsu and Shandong Province, the key influencing factors of industrial TCP in the two provinces are roughly the same. The key to improving industrial TCP lies in accelerating economic development, optimizing the coal consumption structure, and increasing the R&D investment and its achievement transformation.
• For Zhejiang Province, industrial TCP is mainly affected by EDL, RII, and RIL. The key to improving industrial TCP lies in further promoting economic development, increasing R&D investment, and achievement transformation.
• For Guangdong Province, the TCP is relatively high and has a rapid growth rate. The empirical results show that, except for ECS, other factors significantly impact TCP, but these factors have relatively limited potential for industrial TCP improvement. Comparatively speaking, the factors IES and RIL have a great influence on TCP. Therefore, the critical path of upgrading industrial TCP in Guangdong Province lies in optimizing the economic structure and increasing R&D investment.
• For Hainan Province, the empirical results show that IES, EDL, ECS, and ECI significantly impact industrial TCP. Therefore, the key to enhancing industrial TCP in Hainan Province lies in the improvement of industrial economic structure and economic development level, as well as the intensive utilization of coal resources in industrial sectors.
Conclusions and Policy Implications
During the inspection period, the industrial TCP in 11 provinces of eastern China increases year by year, but the regional differences in growth margin and growth rate decrease and show a convergence trend. The growth margin and growth rate of the industrial TCP in Beijing, Tianjin, Liaoning, and Hainan provinces are relatively large. In contrast, those in Hebei, Zhejiang, Jiangsu, Shandong, and Guangdong provinces are not obvious, but their industrial TCP ranks first in eastern China.
The EDL and IES in eastern China have a significant impact on industrial TCP, and there are spatial differences in this impact. The EDL in Beijing, Tianjin, Hebei, Guangdong, Hainan, and other provinces positively affects the industrial TCP. In contrast, the EDL in Shanghai, Jiangsu, Zhejiang, Fujian, and Shandong has a negative inhibitory effect. As for IES, this factor has a positive effect on TCP in Shanghai, Jiangsu, Fujian, Shandong, Guangdong, and Hainan provinces, while that of Beijing, Hebei, and Liaoning provinces does not promote the improvement of industrial TCP. The heterogeneity of the regional industrial structure, resource endowments, and economic development mode are the root causes of this result.
There are spatial differences in the effect of the ECS on the industrial TCP. The ECS in Liaoning, Zhejiang, and Guangdong provinces has no significant impact on TCP. In contrast, ECS in Beijing, Tianjin, Hebei, Jiangsu, Shandong, and Hainan provinces positively affects TCP. By contrast, the ECS in Shanghai and Fujian has a negative impact on industrial TCP. In general, the greater the degree of centralized utilization of coal resources in the industrial sector, the more conducive to the intensive use of coal resources and the improvement of industrial TCP. Therefore, promoting the intensive use of coal resources is a critical way to improve industrial TCP.
As the source of energy technology progress, R&D investment has a relatively consistent impact on industrial TCP in all provinces. The RIL plays a positive role in promoting industrial TCP, while RII has a negative impact on industrial TCP. The root cause lies in the imbalance of R&D investment structure, low efficiency of R&D investment, and fewer applications of R&D results. As the output of energy technology progress, the impact of ECI on industrial TCP has great regional differences. The impact of ECI on TCP is not significant in Beijing, Tianjin, Hebei, Liaoning, Zhejiang, Shandong, and other places. In Jiangsu, Guangdong, and Hainan, ECI has a significant negative impact on TCP, while in Shanghai and Fujian provinces, ECI positively impacts TCP. Considering the bias of energy intensity indicators, the promotion of regional energy efficiency does not mean the decrease of industrial TCP.
There are noticeable regional differences in the key influencing factors of industrial TCP in 11 provinces of eastern China. Therefore, it is necessary to adopt differentiated adjustment policies to improve the industrial TCP according to local conditions. Meanwhile, increasing the R&D expenditures, optimizing R&D investment structure, improving R&D utilization efficiency, and promoting the transformation and application of R&D results are generic ways to improve the industrial coal productivity in the eastern region.
It is necessary to note that RIL has different effects on industrial TCP. For example, RIL in Hainan is lower than that in eastern China, while RIL in Shanghai is higher than average level. Only when RIL is higher than the average R&D level, it will have a significant impact on industrial TCP, which indicates that RIL may have a threshold effect on TCP. This problem deserves further study. In addition, due to the close economic and trade relationship in the eastern region, whether the spatial spillover effect of technological progress will affect TCP also needs further research. Therefore, spatial measurement or threshold cointegration can be considered to test the interactive effects of spatial heterogeneity in our next study.
Data Availability Statement
The original contributions presented in the study are included in the article/Supplementary Material. Further inquiries can be directed to the corresponding authors.
Author Contributions
DW and YZ were responsible for conceptualization; DW, YZ, and ZZ for methodology; DW, YZ, ZZ, and XY for writing; YZ, ZZ, and XY for results; DW, XY, and XW for validation. XW was responsible for artwork. All authors contributed to the article and approved the submitted version.
Funding
The work described in this manuscript was supported by the National Natural Science Foundation of China (No. 71974191), the National Social Science Foundation of China (No. 19FGLB057), the Key Project of Jiangsu Universities' Philosophy and Social Sciences Research (No. 2017ZDIXM162), the Fundamental Research Funds for the Central Universities (No. 2020ZDPYSK05), and the Excellent Innovation Team Construction Project of China University of Mining and Technology (No. 2020QN004).
Conflict of Interest
The authors declare that the research was conducted in the absence of any commercial or financial relationships that could be construed as a potential conflict of interest.
Acknowledgments
The authors are thankful for the comments and advice given by the reviewers. They have improved the content of this work and pointed out some research directions of particular interest.
References
Adom, P. K., Amakye, K., Abrokwa, K. K., and Quaidoo, C. (2018). Estimate of transient and persistent energy efficiency in Africa: a stochastic Frontier approach. Energy Convers. Manag. 166, 556–568. doi:10.1016/j.enconman.2018.04.038
Aigner, D., Lovell, C. A. K., and Schmidt, P. (1977). Formulation and estimation of stochastic Frontier production function models. J. Econom. 6, 21–37. doi:10.1016/0304-4076(77)90052-5
Ang, B. W., and Xu, X. Y. (2013). Tracking industrial energy efficiency trends using index decomposition analysis. Energy Econ. 40, 1014–1021. doi:10.1016/j.eneco.2013.05.014
Battese, G. E., and Coelli, T. J. (1995). A model for technical inefficiency effects in a stochastic Frontier production function for panel data. Empir. Econ. 20, 325–332. doi:10.1007/BF01205442
Beyzanur, C. E., Selim, Z., and Dursun, D. (2018). A two-stage analytical approach to assess sustainable energy efficiency. Energy. 164, 822–836. doi:10.1016/j.energy.2018.08.213
Cao, L., Qi, Z., and Ren, J. (2017). China’s industrial total-factor energy productivity growth at sub-industry level: a two-step stochastic metafrontier malmquist index approach. Sustainability. 9, 1384. doi:10.3390/su9081384
Chen, Z. F., Barros, C. P., and Borges, M. R. (2015). A Bayesian stochastic Frontier analysis of Chinese fossil-fuel electricity generation companies. Energy Econ. 48, 136–144. doi:10.1016/j.eneco.2014.12.020
Feng, C., Wang, M., Liu, G. C., and Huang, J. B. (2017). Green development performance and its influencing factors: a global perspective. J. Clean. Prod. 144, 323–333. doi:10.1016/j.jclepro.2017.01.005
Gong, B. (2018). The shale technical revolution - cheer or fear? Impact analysis on efficiency in the global oil field service market. Energy Pol. 112, 162–172. doi:10.1016/j.enpol.2017.09.054
Guan, D., Su, X., Zhang, Q., Peters, G. P., Liu, Z., Lei, Y., et al. (2014). The socioeconomic drivers of China’s primary PM2.5 emissions. Environ. Res. Lett. 9, 24010. doi:10.1088/1748-9326/9/2/024010
Harris, D., Kew, H., and Taylor, A. M. R. (2020). Level shift estimation in the presence of non-stationary volatility with an application to the unit root testing problem. J. Econom. 219, 354–388. doi:10.1016/j.jeconom.2020.03.008
He, Y., Liao, N., and Zhou, Y. (2018). Analysis on provincial industrial energy efficiency and its influencing factors in China based on DEA-RS-FANN. Energy. 142, 79–89. doi:10.1016/j.energy.2017.10.011
Hou, Y. L., Long, R. Y., Chen, H., and Zhang, L. L. (2018). Research on the sustainable development of China’s coal cities based on lock-in effect. Res. Pol. 59, 479–486. doi:10.1016/j.resourpol.2018.09.002
Huang, H. F., and Wang, T. (2017). The total-factor energy efficiency of regions in China: based on three-stage SBM model. Sustainability. 9, 1664. doi:10.3390/su9091664
Iftikhar, Y., He, W. J., and Wang, Z. H. (2016). Energy and CO2 emissions efficiency of major economies: a non-parametric analysis. J. Clean. Prod. 139, 779–787. doi:10.1016/j.jclepro.2016.08.072
Jiang, C. L., and Zha, Y. (2015). Research on the influences of self-R&D activities on the industrial energy efficiency in China. China Popul. Resour. Environ. 25, 82–87. doi:10.3969/j.issn.1002-2104.2015.11.011
Kaya, Y. (1989). Impact of carbon dioxide emission control on GNP growth: interpretation of proposed scenarios. Paris, France: IPCC
Li, B., and Dewan, H. (2017). Efficiency differences among China's resource-based cities and their determinants. Res. Pol. 51, 31–38. doi:10.1016/j.resourpol.2016.11.003
Li, H., and Shi, J. F. (2014). Energy efficiency analysis on Chinese industrial sectors: an improved Super-SBM model with undesirable outputs. J. Clean. Prod. 65, 97–107. doi:10.1016/j.jclepro.2013.09.035
Liddle, B. (2015). What are the carbon emissions elasticities for income and population? Bridging STIRPAT and EKC via robust heterogeneous panel estimates. Global Environ. Change. 31, 62–73. doi:10.1016/j.gloenvcha.2014.10.016
Lima, F., Nunes, M. L., Cunha, J., and Lucena, A. F. P. (2016). A cross-country assessment of energy-related CO 2 emissions: an extended Kaya index decomposition approach. Energy. 115, 1361–1374. doi:10.1016/j.energy.2016.05.037
Liu, J. P., Wang, L., Qiu, M. H., and Zhu, J. (2016). Promotion potentiality and optimal strategies analysis of provincial energy efficiency in China. Sustainability. 8, 741. doi:10.3390/su8080741
Liu, W. S., and Lin, B. Q. (2018). Analysis of energy efficiency and its influencing factors in China’s transport sector. J. Clean. Prod. 170, 674–682. doi:10.1016/j.jclepro.2017.09.052
Liu, X., and Bae, J. (2018). Urbanization and industrialization impact of CO2 emissions in China. J. Clean. Prod. 172, 178–186. doi:10.1016/j.jclepro.2017.10.156
Long, R. Y., Wang, H. Z., and Chen, H. (2016). Regional differences and pattern classifications in the efficiency of coal consumption in China. J. Clean. Prod. 112, 3684–3691. doi:10.1016/j.jclepro.2015.07.025
Lu, C. Y., Meng, P., Zhao, X. Y., Jiang, L., Zhang, Z. L., and Xue, B. (2019). Assessing the economic-environmental efficiency of energy consumption and spatial patterns in China. Sustainability. 11, 591. doi:10.3390/su11030591
Mardani, A., Zavadskas, E. K., Streimikiene, D., Jusoh, A., and Khoshnoudi, M. (2017). A comprehensive review of data envelopment analysis (DEA) approach in energy efficiency. Renew. Sustain. Energy Rev. 70, 1298–1322. doi:10.1016/j.rser.2016.12.030
Medina, A., Cámara, Á., and Monrobel, J. (2016). Measuring the socioeconomic and environmental effects of energy efficiency investments for a more sustainable Spanish economy. Sustainability. 8, 1039. doi:10.3390/su8101039
Meng, M., Shang, W., Zhao, X. L., Niu, D. X., and Li, W. (2015). Decomposition and forecasting analysis of China's energy efficiency: an application of three-dimensional decomposition and small-sample hybrid models. Energy. 89, 283–293. doi:10.1016/j.energy.2015.05.132
Norman, J. B. (2017). Measuring improvements in industrial energy efficiency: a decomposition analysis applied to the UK. Energy. 137, 1144–1151. doi:10.1016/j.energy.2017.04.163
Ouyang, X. L., Mao, X. Y., Sun, C. W., and Du, K. R. (2019). Industrial energy efficiency and driving forces behind efficiency improvement: evidence from the pearl river delta urban agglomeration in China. J. Clean. Prod. 220, 899–909. doi:10.1016/j.jclepro.2019.02.206
Simar, L., and Wilson, P. W. (2007). Estimation and inference in two-stage, semi-parametric models of production processes. J. Econom. 136, 31–64. doi:10.1016/j.jeconom.2005.07.009
Teng, X. Y., Lu, L. C., and Chiu, Y. (2018). Considering emission treatment for energy-efficiency improvement and air pollution reduction in China’s industrial sector. Sustainability. 10, 4329. doi:10.3390/su10114329
Wang, D., He, W., and Shi, R. Y. (2019a). How to achieve the dual-control targets of China's CO2 emission reduction in 2030? Future trends and prospective decomposition. J. Clean. Prod. 213, 1251–2163. doi:10.1016/j.jclepro.2018.12.178
Wang, K. Y., Wu, M., Sun, Y. P., Shi, X. P., Sun, A., and Zhang, P. (2019b). Resource abundance, industrial structure, and regional carbon emissions efficiency in China. Res. Pol. 60, 203–214. doi:10.1016/j.resourpol.2019.01.001
Wang, N. N., Chen, J., Yao, S. N., and Chang, Y. C. (2018). A meta-frontier DEA approach to efficiency comparison of carbon reduction technologies on project level. Renew. Sustain. Energy Rev. 82, 2606–2612. doi:10.1016/j.rser.2017.09.088
Wang, Q. W., Hang, Y., Sun, L. C., and Zhao, Z. Y. (2016). Two-stage innovation efficiency of new energy enterprises in China: a non-radial DEA approach. Technol. Forecast. Soc. 112, 254–261. doi:10.1016/j.techfore.2016.04.019
Wang, S. B., Liu, H. M., Pu, H. X., and Yang, H. (2020). Spatial disparity and hierarchical cluster analysis of final energy consumption in China. Energy. 197, 117195. doi:10.1016/j.energy.2020.117195
Wu, Y., Shen, J., Zhang, X., Skitmore, M., and Lu, W. (2016). The impact of urbanization on carbon emissions in developing countries: a Chinese study based on the U-Kaya method. J. Clean. Prod. 135, 589–603. doi:10.1016/j.jclepro.2016.06.121
Xie, W., Sheng, P. F., and Guo, X. H. (2015). Coal, oil, or clean energy: which contributes most to the low energy efficiency in China? Util. Pol. 35, 67–71. doi:10.1016/j.jup.2015.05.003
Xiong, S. Q., Ma, X. M., and Ji, J. P. (2019). The impact of industrial structure efficiency on provincial industrial energy efficiency in China. J. Clean. Prod. 215, 952–962. doi:10.1016/j.jclepro.2019.01.095
Xu, G., Schwarz, P., and Yang, H. (2020). Adjusting energy consumption structure to achieve China’s CO2 emissions peak. Renew. Sustain. Energy Rev. 122, 109737. doi:10.1016/j.rser.2020.109737
Yang, M., Yang, F. X., and Chen, X. P. (2011). Effects of substituting energy with capital on China’s aggregated energy and environmental efficiency. Energy Pol. 39, 6065–6072. doi:10.1016/j.enpol.2011.07.006
Zhang, D. G., and Lu, Y. Q. (2017). Impact of market segmentation on energy efficiency. China Popul. Resour. Environ. 27, 65–72. doi:10.3969/j.issn.1002-2104.2017.01.008
Zhao, C. H., Zhang, H. N., Zeng, Y. R., Li, F. Y., Liu, Y. X., Qin, C. J., et al. (2018). Total-factor energy efficiency in BRI countries: an estimation based on three-stage DEA model. Sustainability. 10, 278. doi:10.3390/su10010278
Zhao, X. L., Yang, R., and Ma, Q. (2014). China’s total factor energy efficiency of provincial industrial sectors. Energy. 65, 52–61. doi:10.1016/j.energy.2013.12.023
Zhou, M., Wang, T., Yan, L., and Xie, X. B. (2018). Has economic competition improved China’s provincial energy ecological efficiency under fiscal decentralization? Sustainability. 10, 2483. doi:10.3390/su10072483
Keywords: total-factor coal productivity, driving factors, promotion paths, R&D expenditure, STIRPAT model
Citation: Wang D, Zhao Y, Zhang Z, Yang X and Wen X (2021) Drivers and Policy Choices of Industrial Total-Factor Coal Productivity: Evidence From Eastern China. Front. Energy Res. 8:627125. doi: 10.3389/fenrg.2020.627125
Received: 08 November 2020; Accepted: 14 December 2020;
Published: 20 January 2021.
Edited by:
Xu Tang, China University of Petroleum, ChinaReviewed by:
Zhang Hua, Nanjing Audit University, ChinaYanfang Zhang, Nanjing University of Aeronautics and Astronautics, China
Copyright © 2021 Wang, Zhao, Zhang, Yang and Wen. This is an open-access article distributed under the terms of the Creative Commons Attribution License (CC BY). The use, distribution or reproduction in other forums is permitted, provided the original author(s) and the copyright owner(s) are credited and that the original publication in this journal is cited, in accordance with accepted academic practice. No use, distribution or reproduction is permitted which does not comply with these terms.
*Correspondence: Di Wang, wangdi.js@cumt.edu.cn; Yueying Zhao, zhaoyueying@cumt.edu.cn