Transactive Energy in an Urban Environment: A Case Study of Local Generation and Flexibility Potentials in a Singaporean Urban District
 Kai Zhang1*
  Sebastian Troitzsch1
  Si-Yue Zhang2 Erine Siew Pheng Teh3
  Lalitha Subramanian2
  Tobias Massier1
- 1Electrification Suite and Test Lab, TUMCREATE, Singapore, Singapore
- 2EDF Lab Singapore, Singapore, Singapore
- 3Chemical Engineering and Food Technology (CEFT) Cluster, Singapore Institute of Technology, Singapore, Singapore
This article presents a case study of distributed generation and flexibility potential for a multienergy system in an urban district in Singapore. The analysis incorporates real-life data of a local energy system consisting of flexible loads (i.e., district cooling demand from air-conditioned buildings) and distributed generators (DGs) (i.e., waste-to-energy (W2E) generators and photovoltaic (PV) generators) from a representative study area. The demand-side flexibility (DSF) potentials from air-conditioned buildings are derived based on a state-space model and its underlying base load estimation. Besides the conventional consideration of PV system integration in the urban environment, we conducted a feasibility study of the distributed W2E technology deployment and estimated the generation potentials for the study area. Furthermore, to facilitate flexibility and energy exchange, market frameworks are proposed to harvest energy and flexibility from distributed energy resources (DERs) and in the real-time market context in Singapore.
1 Introduction
With the increasing integration of distributed energy resources (DERs), such as flexible loads (FLs) and distributed generators (DGs), into the electric distribution grid, power systems are slowly transforming into multiple-layered, cyber-physical systems. According to the Resnick Institute’s Grid 2020 report (Resnick Insitute, 2012), “The electric industry, driven by 30 years of energy policy, technology and commercial innovation, is experiencing significant growth in intermittent renewable resources, responsive demand, on-site generation and customer participation in markets. In essence, the electric industry is transitioning from the traditional vertical structure of deterministic centralized production and operations into a more horizontal structure that is increasingly variable and distributed in terms of productions and operations.” This trend and its underlying new business and regulation models are still emerging.
In this scope, the transactive energy paradigm has been proposed for power systems as a system of economic and control mechanisms to allow the dynamic balance of supply and demand (Lezama et al., 2019) across the entire electrical infrastructure using value as a key operational parameter (Melton, 2013). This does not only guarantee the integration of renewable energy in a cost-efficient manner but also provides incentives for investment to enable demand-side management, which can be a pillar to accommodate the stochastic nature of renewable generation. Through transactive energy system mechanisms, customers can be encouraged to invest in small and medium DERs in order to rapidly integrate DERs and take advantage of them in wholesale markets (Masiello and Aguero, 2016). In the research community, the transactive energy system frameworks cover a broad spectrum of research from market design, commodity analysis to coordination mechanisms study at various levels of power system operation layers. For example, at the distribution grid level, Sajjadi et al. (2016) presented a case study on energy trading in transactive energy markets, wherein distribution location marginal price (DLMP) was used for energy trading. For the application in a residential microgrid, energy trading priorities of consumers and prosumers were studied by Akter et al. (2017) using a game-theoretic approach, where flexibility was provided to households trading energy. Daneshvar et al. (2019) presented a transactive energy management framework for several networks of microgrids connected to the main grid. The objective was to maximize the profit of the microgrids, which could be achieved by optimal scheduling of DERs. For the expositions on business models of transactive energy frameworks, demand response business cases were analyzed by Good et al. (2019) using a transactive energy framework for distributed multienergy systems. The authors developed models for technical and economic analysis, economic assessment, profit sharing, and optimization of the system. An overview of transactive energy to coordinate electric distribution systems was given by Kok and Widergren (2016).
While transactive energy mechanisms have been extensively studied in the theoretical domain, their application and deployment potential in densely populated cities like the island nation of Singapore has yet to be understood. To this end, this article proposes to study the deployment of such frameworks for a specific study area. Particularly, this work seeks to 1) model the potentials of DERs in relation to the fixed base load, 2) identify the key operational challenges, and 3) study the benefits of deploying transactive energy mechanisms to operate DERs. An urban neighborhood in Singapore, the Punggol Digital District (PDD), is designated as the study area for this purpose. In the first step, the assessment of DER resources and flexibility potentials is needed for the study area.
Thermal building systems, e.g., HVAC systems, are important candidates for load flexibility as they account for a large share of the electricity demand in buildings, particularly in tropical cities such as Singapore (Chua et al., 2013). The thermal loads of a building can be shifted by leveraging its thermal inertia. This allows the electric load of the HVAC system to be shifted by precooling or preheating a building while maintaining an admissible interval of thermal-comfort constraints. To this end, control-oriented building models have been proposed for the deployment of model predictive control for air-conditioned buildings, thereby enabling load flexibility. Atam and Helsen (2016) reviewed the requirements and key methodologies for control-oriented building modeling. In line with this, Troitzsch and Hamacher (2020), Sturzenegger et al. (2014), and Gorecki et al. (2015) formalized the control-oriented building models, which are implemented in the open-source software frameworks CoBMo, BRCM, and OpenBuild, respectively. A key challenge in load flexibility assessment is to account for the occupancy schedule, which may introduce large fluctuations in the flexibility capacity provision. To this end, a few studies have provided results on building clusters. For example, Hu and Xiao (2020) quantified the uncertainty in the flexibility of residential building clusters, taking into account the occupancy and the behavior of occupants. Similarly, Di Somma et al. (2019) presented an optimization model considering uncertainties in DERs, including clusters of buildings with similar usage patterns. Patteeuw et al. (2019) also developed a method for clustering buildings, taking into consideration uncertainties in flexibility. A data-driven approach that allowed the simulation of building clusters, including different types of buildings and determining the buildings’ flexibility potential, was presented by Wang et al. (2018). In (Troitzsch et al., 2020), a whole neighborhood of air-conditioned buildings in Singapore was modeled and the impact of different occupancy types on the load flexibility was evaluated.
In addition to thermal building systems, waste-to-energy (W2E) technology may play an important role in providing a sustainable local energy supply for an urban district. In Singapore, approximately 7700 t/d of solid waste is incinerated at the four existing W2E plants (National Environment Agency, 2016). The incineration process reduces the waste volume by 90% and supplies 23% of the national electrical power need (National Environment Agency, 2016). There is a perpetual waste source that provides the opportunity to treat the waste near source and return useful products such as molecules and energy to the local community. Near source and decentralized treatment reduces transportation of waste and its products across the island city, hence lowering the transportation emission, cost, and risks associated with the goods (i.e., odor, explosiveness, and toxicity). A system optimization study on the efficiency of centralized and decentralized municipal waste management system in the Singapore context showed that the decentralized waste management system could halve the operation cost and reduce the land-capacity fragmentation and transportation fleet size by 74% and 15%, respectively (Kuznetsova et al., 2019). Even though the impact of W2E incineration plants has not been investigated, they have shown distinct waste profile evolution in many parts of Singapore. This indicates more opportunities to deploy and optimize W2E technologies and their operating conditions to maximize the yield and reduction of emission, tailored to the type of waste generated.
It also creates a distributed network as backup facilities. In this scope, hydrogen is identified as one of the potential molecules to be produced from waste. It is a zero carbon emission fuel for transportation. The hydrogen economy has also picked up its momentum recently with major support from the government and business sectors in its logistics (i.e., refueling, transportation of fueled vehicles, and cost reduction strategy in hydrogen production) (IEA 2019). High-purity hydrogen can be produced and stored to buffer the variable renewable power generation (e.g., from offshore wind farms), providing a robust and on-demand local electricity generation (Recalde Melo and Chang-Chien, 2014). To this end, only a few analyses provided feasibility studies for the distributed W2E generator technologies at the urban district level and their underlying generation potentials.
The study of W2E potential as DER for microgrid operation tends to be based on the mature technology of solid waste incineration or biogas combustion to run a gas or steam turbine (Baran et al., 2016; Badal et al., 2019). This option may be limited in terms of its robustness and flexibility due to the fact that it has to couple waste management need and microgrid response need. As a decentralized W2E plant, it usually does not have the luxury of huge waste holding capacity. The process of starting up and shutting down a thermochemical plant needs time and is often complex before it can achieve an efficient steady state. It also relies on batteries for excess power storage. There have been studies looking into hydrogen as a robust energy storage option. Synergetic control and economic optimization of a microgrid were modeled around a multienergy storage system (Garcia-Torres and Bordons, 2015), which includes hydrogen generation from electrolyzers and being stored for power generation by fuel cells. On the other hand, Badal et al. (2019) looked into control issues in renewable energy integration and microgrid, which involved syngas produced from biomass and power generation from solar photovoltaic (PV) and wind turbine. Power generation by hydrogen fuel cells for microgrid application can be modeled and operated independently of the hydrogen generation mode, which marks its robustness. Therefore, there is an opportunity stemming from the need to convert solid municipal waste generated within an urban district and the need for energy sources. In this work, we compare W2E technologies, their potentials in generating hydrogen from waste as an intermediate energy storage medium, and their operational profiles for stationary power generation with fuel cells. They complement other DERs, such as electrolyzers connected to wind, hydroelectric, and solar PV turbines, which generate hydrogen as an energy storage medium.
Building upon existing literature, we focus on the development of a holistic case study for demand-side flexibility (DSF) and distributed generation at the district level to enable the assessment of a transactive energy framework and its potential to mitigate operational challenges in the electric distribution grid. The main contributions of this work are as follows:
• The potential of distributed W2E deployment in an urban environment to generate hydrogen from waste and its operational flexibility for power generation with fuel cells is modeled.
• The above is complemented by the development of models for the base load and future EV charging demand in the study area, along with an assessment of the DSF from air-conditioned buildings and potential operational issues that may arise due to the latter.
• Under the transactive paradigm, market frameworks to harvest energy flexibility considering the real-time market context in Singapore are proposed.
The article is structured as follows. Section 2 presents the study area, which is a future urban district in Singapore. The base load estimation for air-conditioned buildings and the EV charging stations is presented in Section 3. Subsequently, the DSF potential from air-conditioned buildings is assessed in Section 4. In Section 5, we present the estimation results for distributed generation potentials based on solar PV and W2E technologies for the study area, respectively. Finally, we discuss the integration opportunities of DSF and the generation capacity from DGs considering the Singapore electricity context and stakeholders’ roles in the urban district.
2 Study Area
In the scope of this work, the PDD in Singapore, scheduled to operate from 2024 onward, is selected as the study area. The PDD area brings together the campus of the Singapore Institute of Technology (SIT) and industrial properties of the JTC’s business park spaces within the new community of at least 2000 families in Punggol North, Singapore. The infrastructure and services available in phase 1 of the PDD include a transportation hub (i.e., train station and bus interchange); commercial and industrial sectors (e.g., office, business park, retail, and workshop); public sectors (e.g., community center and childcare). This study focuses mainly on the electricity demand of the SIT campus and JTC industrial buildings. In phase 1 of the PDD, the total peak load of this study area is estimated to be 64.2 MVA for SIT and JTC only. Plenty of DERs are available for the microgrids (MGs) operating within this area, including building-integrated and rooftop PV systems, a W2E system, a battery energy storage system, and electric vehicles. A centralized District Cooling System (DCS) has been planned to supply the cooling demand to the whole district, which takes up 29 MW of electric load during peak hours. An overview of the study area is depicted in Figure 1.
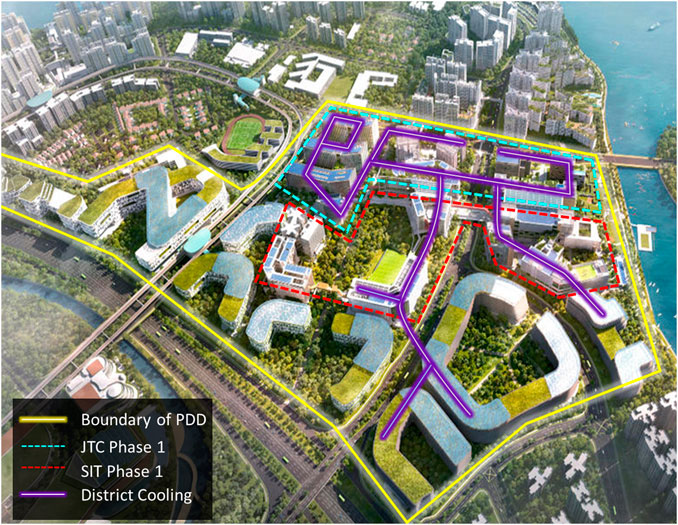
FIGURE 1. Punggol Digital District planning area in Singapore.
3 Base Load Modeling
Base load modeling of the study area serves as the basis for the DSF estimation and provides an insight into the energy demand portfolio of the urban district. To this end, data-driven demand estimation approaches for building clusters and EV charging are provided in this section.
3.1 Base Load Modeling of Air-Conditioned Buildings
Aiming at constructing an hourly load profile for one year for each building in the study area, we adopted a bottom-up approach, as illustrated in Figure 2. First, the area of each floor of the building is categorized by types of use. Each use type has a unique characteristic hourly load pattern. To obtain the exact amount of area for each type in each building, the gross floor area has been decomposed by use categories based on building design drawings. Second, the average electrical load, i.e., annual electricity consumption divided by the total number of hours in a year and floor area, is used to differentiate the level of energy consumption among floor area use categories. It consists of two components: 1) cooling load, i.e., electricity used for space cooling; 2) noncooling load, i.e., all other demands such as for ventilation, lighting, and plug loads. This parameter can be readily calculated for several use categories such as office, hotel, retail, and data center as they have been widely studied in Building Construction Authority (2018) and Salim and Pe (2012). For other use categories, we resort to specific examples in the context of Singapore and other countries. For example, input data such as lighting power density and equipment power density of classroom space were presented in an energy-saving potential study in (Jian et al., 2013). In the third step, using the average electrical load calculated before, the daily electricity consumption per floor area use category is calculated in kWh for each use category in the building. The daily consumption per area use is distributed over 24 h following a predefined load pattern of the corresponding use category, which is constructed based on existing referential buildings in Singapore or neighboring countries. Different load curves are generated for each type of floor use in each building. Based on that, the typical load curve of the building is obtained by aggregating these load curves of floor area use categories. This workflow has been conducted for cooling load and noncooling load for different building clusters on weekdays and weekends.
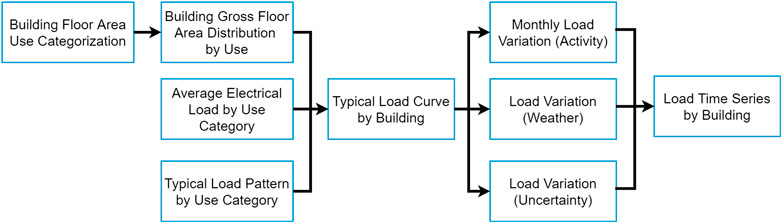
FIGURE 2. PDD load estimation workflow.
Further load variation techniques are applied to these typical load curves to reflect a realistic scenario. For this purpose, three types of load variations are considered in this study: variation due to activity, variation due to weather, and variation due to uncertainty. For example, the academic calendar has a significant impact on the load curve of the SIT campus. It represents the activity level of students and faculties on the campus. The metered monthly electricity consumption of similar building types is used to derive the load pattern of these buildings to quantify this impact. The second load variation is due to real-time weather conditions. Although the weather in Singapore is subject to only small variations, differences in temperature, solar irradiation, and humidity can be noticeable, e.g., between sunny and rainy days. The ambient temperature is directly linked to the cooling demand and chiller system efficiency. Irradiation contributes to solar heat gain in the building, which is also a part of the cooling load. Humidity impacts the need for ventilation and chiller system efficiency as well. An average weather profile has been constructed based on typical meteorological year (TMY) weather data. Any deviation from this average profile leads to load deviation from the typical load curve. The last part of load variation included is due to uncertainty, which can stem from human activity, performance of electrical appliances, unexpected events, etc. While it is hard to realistically quantify the extent of load variation due to uncertainty, it is essential to include this randomness, such that the robustness of the energy management system can be tested to supply different loads. Thus, the study introduces a few levels of load uncertainty to simulate different situations. Ultimately, all these factors put together yield the load time series for each building.
3.1.1 Base Load Estimation Results
One-year hourly load curves are obtained for each building in SIT and JTC. Note that the detailed building indices and floor area use type together with the monthly variation of the electricity demand of the reference building clusters can be found in the supplementary data (Supplementary Figures S1–S4). A typical one-day hourly weekday load curve of the SIT campus before introducing load variations is shown in Figure 3A. The green bars refer to buildings of the western plot of the SIT campus, whereas the blue bars refer to buildings of the eastern plot. The peak demand of 14.1 MW appears at 11:00 and the valley demand of 1.3 MW is observed during the first 4 h of the day. The load estimation results of JTC’s property are shown in Figure 3B. Compared to the SIT campus, the JTC property shows both a much higher peak load of 50.1 MW e and a much higher valley load of 12.6 MW e. There are three subzones of building towers in JTC. They are indicated by red, green, and blue bars in Figure 3B. More than half of the demand is located in the second zone depicted by green bars.
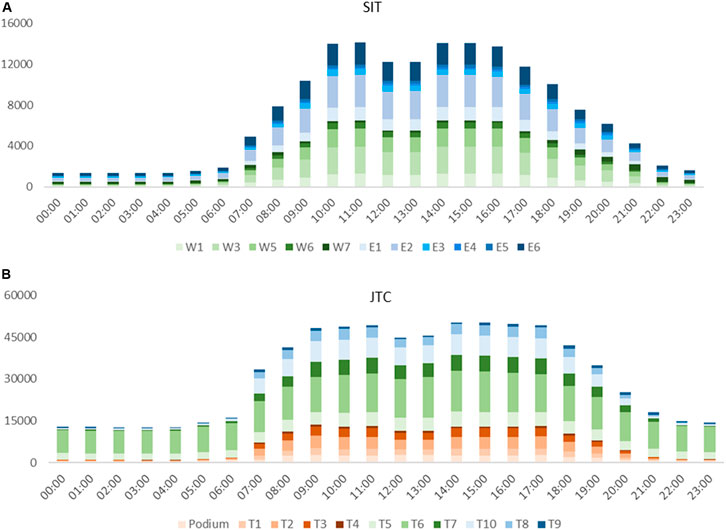
FIGURE 3. Typical hourly weekday load curve of block buildings in SIT campus (A) and JTC industrial property (B) (kW). The buildings are represented by different colors, e.g., W1–W7 for buildings of the western plot and E1–E6 for buildings of the eastern plot of the SIT campus.
3.2 Base Load Estimation of EV Charging
The EV charging demand for the study area is derived from historical car park data and information on the car park and EV charger deployment in the study area along with a definition of EV penetration scenarios (see supplementary data), as highlighted in Figure 4. First, the historical car park availability is used to derive representative vehicle inflow time series for different car park types through time series clustering and filtering. Second, the charging power time series is determined through a car park charging simulation based on the representative vehicle inflow, car park capacity, EV penetration scenario, and EV/charger parameters. The input data include information on historical car park availability and the individual car park capacity.
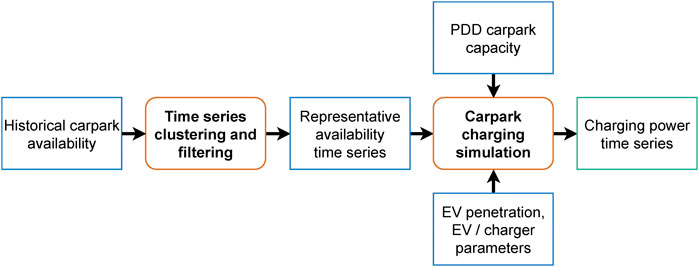
FIGURE 4. Workflow for EV charging demand modeling.
The historical car park availability time series is provided as time series for each week of the collected data. A prefiltering step is necessitated as the dataset may be incomplete and contain erroneous values. The filtered car park availability is then aggregated into a time series for a single week. The variability of the overall dataset is retained by obtaining the variance time series in addition to the mean time series for one week. Time series clustering is then utilized to differentiate different car park types. Time series clustering is a methodology from the operations research domain for generating a small number of representative time series which approximate the characteristics of the complete time series dataset, thus aggregating multiple time series with similar features to reduce the size of the dataset (Teichgraeber and Brandt, 2019).
The car park charging simulation serves to calculate the EV charging demand from the representative availability time series and further input parameters. As depicted in Figure 5, the simulation is formulated as an iterative process consisting of the following steps:
1. Determine the flow of incoming EVs by sampling the representative availability time series and scaling to the car park capacity and EV penetration scenario.
2. Assign EVs to free chargers or the waiting vehicle queue if all chargers are occupied.
3. Calculate the charging power based on the number of occupied chargers and then charge EVs and clear any EVs which have been fully charged to free up chargers.
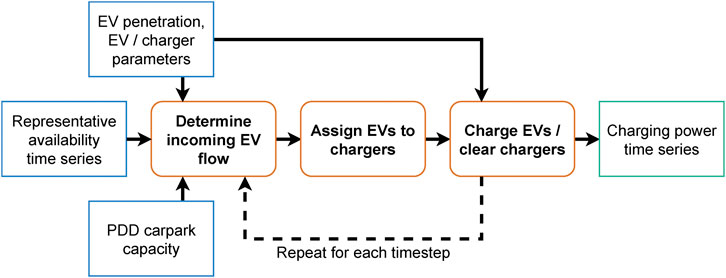
FIGURE 5. EV car park simulation.
To determine the flow of incoming vehicles, first, the car park availability time series is obtained by random sampling from a normal distribution that is characterized by the representative availability mean and variance time series. Note that there is a unique normal distribution of the car park availability for each time step in line with the mean and variance being described by a time series. Therefore, the sampled value for each time step does not take into account the value of the previous time steps. To address this shortcoming of the sampling technique, we smoothed the sampled availability distribution by taking the rolling mean value of 1 h. The vehicle inflow time series is then calculated by taking the positive part of the differential value between consecutive time steps of the availability time series and scaling to the car park capacity. The EV inflow is obtained by applying the EV penetration rate of the considered EV scenario, where the scenario definition can be referred to in supplementary data. The EVs are then assigned to free EV chargers. The number of EV chargers for each charger type, i.e., slow/medium/fast/ultrafast, is defined based on charger projections in the PDD car park capacity dat set (see Supplementary Table S3 in supplementary data). The charger assignment algorithm will allocate EVs to slow chargers first. Only if the slow chargers are filled up, then medium chargers are assigned, then fast chargers, and lastly ultrafast chargers. If the number of EVs arriving exceeds the number of free chargers, the unserved EVs are kept in a waiting queue and are assigned in later iterations once chargers are freed up. Lastly, the charging power is calculated by taking the total rated power of all occupied chargers. The EVs are then charged for the current time step. If any EV is fully charged, the corresponding charger is freed up for the next iteration. The three steps of the car park charging simulation are repeated until the complete charging power time series for a full week is obtained.
3.2.1 Results
The final charging power time series of each car park is shown in Figure 6, where the peak charging power demand scales with car park size and the EV penetration rate. Note that these plots depict only a 24 h time frame of one weekday for better visibility. The simulation of all car park/scenario combinations concludes successfully with no substantial number of EVs remaining in the waiting queue for charging at the end of the simulation. Note that individual vehicle arrivals and departures were not modeled. Therefore, conclusions about the sufficiency of chargers to meet the individual vehicle departure constraints cannot be drawn. Furthermore, the chosen charger assignment algorithm does not take into account “charger hogging,” i.e., chargers being occupied by fully charged EVs without being removed. Instead, we assume that fully charged EVs are immediately cleared from the chargers. Thus, no conclusions regarding the sufficiency of charger deployment should be drawn from these results. Instead, the results serve as a best-effort estimate of the charging power time series based on the available data.
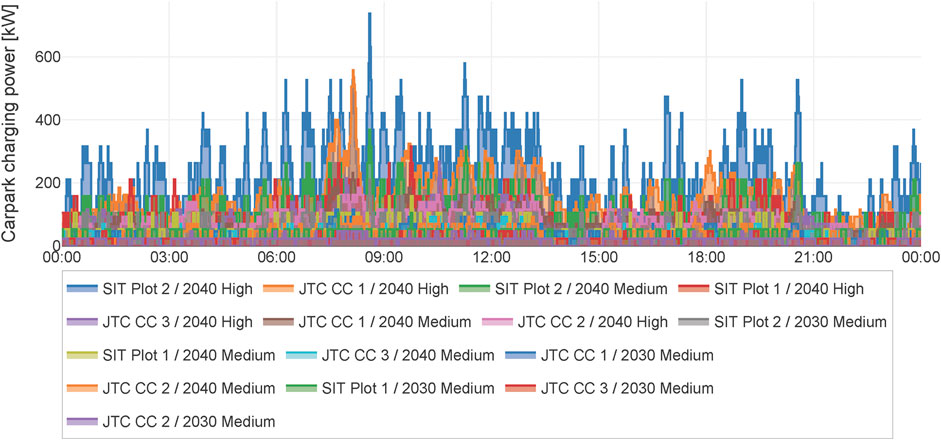
FIGURE 6. PDD car park charging power time series.
4 Demand-Side Flexibility
Building on the base load modeling, we study the demand-side flexibility in this section. The primary resources for DSF are considered to be the air-conditioned buildings in the district. To this end, we adopt a state-space model to describe the building operation problem and derive the demand reduction potentials for the study area.
4.1 Demand-Side Flexibility From Air-Conditioned Buildings
The DSF in air-conditioned buildings describes the flexible cooling demand due to centralized air-conditioning systems in the study area. The DSF in air-conditioned buildings arises from the inherent thermal inertia in the building structure, e.g., walls and floors. This allows the cooling load of the air-conditioning systems to be shifted, e.g., by precooling a building while keeping within occupant comfort requirements.
To express the DSF in air-conditioned office buildings, we choose a state-space model representation. In such a model formulation, the system states are expressed as a function of the cooling demand of the air-conditioning systems and comfort indicators are obtained as output variables. Furthermore, a constraint time series captures the minimum and maximum values for comfort indicators based on the requirements of the building occupants. Lastly, a disturbance time series describes uncontrollable influence factors such as weather and internal gains. The derived system of state-space model, constraint time series, and disturbance time series conveniently encapsulates the system dynamics of the air-conditioned building. This can be readily utilized to set up an optimal operation problem (Troitzsch et al., 2018) for the individual building or the complete PDD energy system. To this end, the Control-oriented Building Model (CoBMo) software framework (Troitzsch and Hamacher, 2020) is used to derive the state-space model.
The DSF modeling is based on information for building geometry, building zoning, and zone types for the PDD area, along with representative weather data. Figure 7 highlights the main steps for the derivation of models for the DSF in air-conditioned buildings in the PDD area. First, the required data items are preprocessed to derive a building definition in CoBMo scenario definition format. To this end, the geometric processing step translates the building geometry and building zoning data into surface definitions and zone definitions. The occupancy processing step transforms the building zoning and zone types data into zone type definitions and occupancy type, occupancy schedule, and constraint schedule definitions. The weather data are, in fact, readily available in CoBMo as weather type definition. Second, CoBMo is utilized to derive the final state-space model formulation, constraint time series, and disturbance time series.
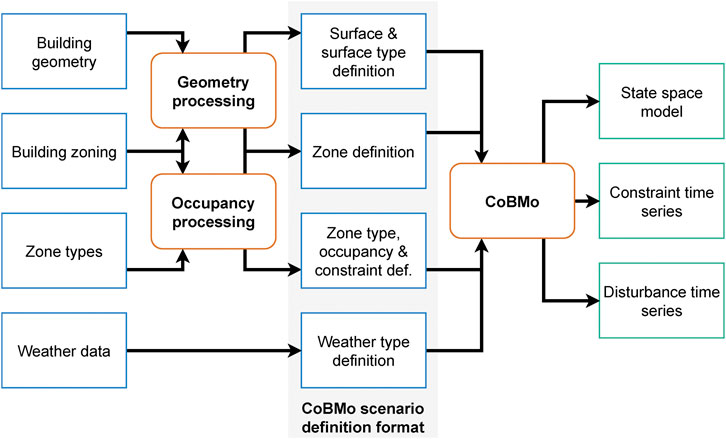
FIGURE 7. Workflow for modeling the demand-side flexibility in air-conditioned buildings.
4.1.1 State-Space Model
The DSF in air-conditioned buildings arises from the inherent thermal inertia, which can be utilized to defer cooling demand while keeping within thermal-comfort requirements. In this work, the thermal comfort of building occupants is expressed in terms of the indoor air temperature. Hence, the state-space model for DSF in air-conditioned buildings seeks to express the relationship between the indoor air temperature, the electric load of the HVAC system, the local weather conditions, and the building occupancy (see Supplementary Figure S6 in the supplementary data). The indoor air temperature, i.e., zone temperature, within each zone is assumed to be uniformly distributed.
As a starting point, the differential equation of the zone temperature
where
The individual heat transfer quantities are then further specified by individual models, which are omitted here for brevity, but can be obtained from (Troitzsch and Hamacher, 2020). Eventually, the differential equation in Eq. 1 is transformed into a state-space model by arranging the model variables into vectors and the model parameters into the appropriate matrices:
The matrices
The time-discrete form of the thermal building model that is required for the optimization problem is obtained by the application of zero-order hold discretization. The discrete-time state-space model is then expressed as follows:
where
4.2 Load Reduction Potential Calculation
To obtain a reference for load reduction potentials, we first calculate the cooling power demand based on the derived building models. To this end, an optimal operation problem is defined for each building as follows:
Scalars
The DSF can be characterized by the ability to defer load for a particular time period. To this end, the maximum load reduction for a fixed time period with respect to the baseline load is proposed as an indicator of DSF. The load reduction potential represents the maximum load reduction, which is feasible for a given load reduction time period while still respecting the comfort constraints. The load reduction time period is the fixed time period during which the load curtailment is being enforced. To this end, the load reduction is determined by the following optimization problem:
Scalar
Figure 8 depicts the average load reduction potential throughout a representative weekday across all PDD buildings for different load reduction durations. Note that the load reduction potential is always assigned to the start time of the load reduction period. The load reduction potential clearly decreases with increased load reduction duration. Furthermore, the average load reduction potential is higher during working hours because the PDD area consists largely of commercial and educational buildings. The peak load reduction potential is observed in morning and evening hours, which can be explained by the reduced occupancy during those time periods, allowing for a higher level of curtailment. Note that Figure 8 depicts the average load reduction across all buildings, although the peak load reduction of individual buildings may not coincide due to different occupancy schedules. To this end, Figure 9 presents the results for average load reduction potential per building, in this case taking the average across all time steps. It is observed that the buildings in the SIT campus generally offer a higher load reduction potential than JTC buildings. This may be due to classrooms and lecture halls experiencing peak occupancy only during limited time periods, which in turn allows a higher share of the load to be shifted.
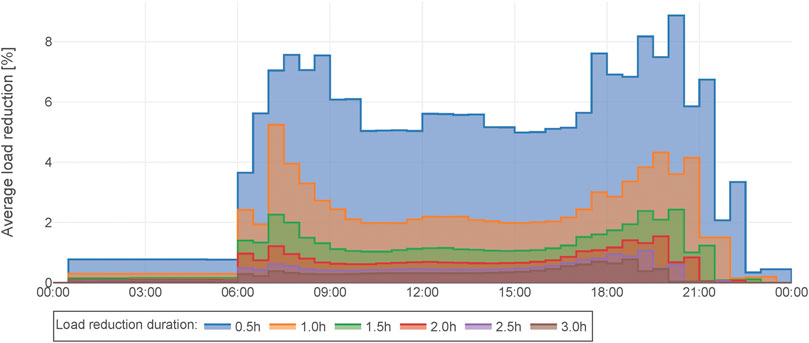
FIGURE 8. Average load reduction potential time series.
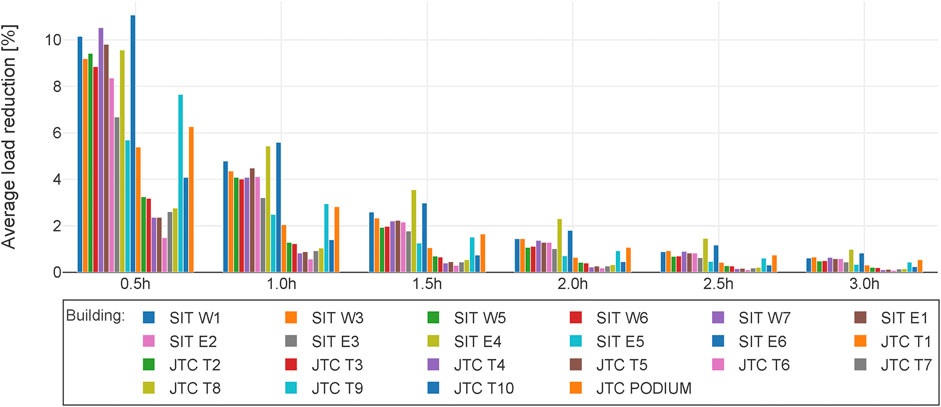
FIGURE 9. Average load reduction potential per building.
5 Distributed Generation Potentials
5.1 Solar PV Generation Potentials
With solar PV being the most significant renewable resource available in the urban environment of Singapore, assessing the PV potential of the study area is a crucial step to estimate the available resources that can be exploited. The PV potential is estimated by using the building data Section 4.1 of the study area and the annual weather data obtained from the TMY weather data of Singapore.
5.1.1 Methodology
To estimate the PV generation potentials, we processed the data by the steps depicted in Figure 10. The building shapes, orientation, height, and the available gross floor area (GFA) are the main properties that determine the PV potential. The annual weather estimate data are fed to the PV planting model in the TMY annual hourly weather data format. The TMY data are chosen as the representative set from a multiyear dataset representing median weather conditions. The raw building data are in the form of 2D top view drawings along with the elevation information. The 2D top view drawings on a geospatial data editor, QGIS (QGIS Development Team, 2009), and the information on the building elevation are combined into the 3D geography markup language (GML) data format. The GML format allows the 3D building data to be transformed into various surfaces with information on their respective orientation, elevation, and GFA. The geographic objects in GML format are integrated into the PostGIS-PostgreSQL relational database format for further PV potential computations.
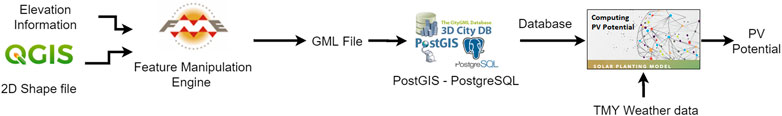
FIGURE 10. Workflow of the PV generation potential estimation.
The key component of the PV estimation method is the PV planting model, a Python application (Wieland et al., 2015) that computes the surface irradiances and estimates the PV potential of each building. The building relational database and the TMY weather data are input to the PV planting model. The steps involved in the computation are described below.
First, the surfaces from the database are split into various surface points based on the surface shape and the building data are represented in different spatial scales in the 3-coordinate system: buildings, surfaces, and surface points. As the entire rooftop area may not be available for PV installations, the percentage of the available area may be given based on user preferences. Surface points that are shared or less than 10 cm between two surfaces are identified and excluded for PV potential computation. The remaining surface points are checked if they are in the visible part of the Earth’s hemisphere, and the sky view factor is computed based on the surface orientation and the light incidence angle. The other building objects in the particular orientation that act as obstacles are identified to distinguish between the direct and diffused irradiances. The solar irradiance received at each surface point is computed as a function of time, latitude and longitude information, shading, sky view factor (SVF), global direct and diffused irradiation, solar panel properties, tilt angle, and the surrounding temperature, following which the corresponding PV power outputs and the involved capital expenditure (CAPEX) can be computed.
5.1.2 Results
The available area for PV installation, projected installed PV capacity, projected yearly energy output, and the respective CAPEX for the SIT campus in the PDD study area are presented in Figure 11. The rooftop area available for PV installation is much smaller than the overall rooftop area. The total PV installation potential in the SIT campus has been computed to be 1.09 MWp, which can potentially generate a yearly energy output of 1.2 GWh.
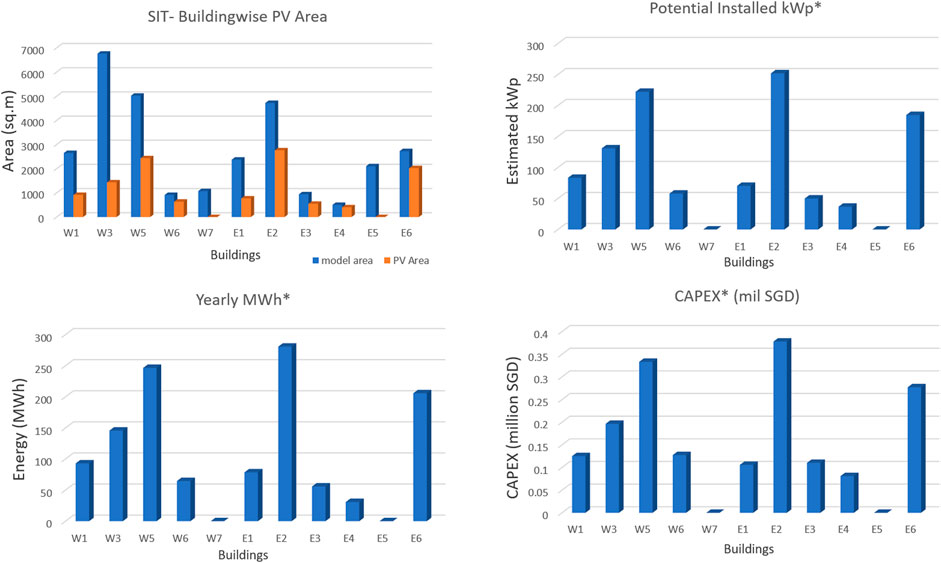
FIGURE 11. Building-wise estimates from the PV planting model.
PV is the largest resource in the study area and a weather-dependent intermittent resource. The main challenge in integrating such intermittent generation is to operate the power system in generation following mode, in addition to the current load following operation. The power system operation is hence challenged by the variability and unpredictability on both the generation and demand side. The solution is to bring in flexibility options that can compensate and support the intermittent source. Flexibility options may be extracted to an extent by deploying controls with interruptible or shiftable demands such as cooling loads, demand response, and electric vehicle charging stations with V2G capabilities, while further investment in storage technologies is required to flatten the renewable intermittency. The support of DSF technologies is also important for the participation of the PV resources as GERs in the energy market to exploit variability in the market price for economic viability. We will discuss this aspect in detail in Section 6.
5.2 Waste-to-Energy Generation Potentials
5.2.1 Feasibility Study of Distributed W2E Generators
The objective of the study on W2E is to identify opportunities and challenges to achieve carbon reduction with renewable and green hydrogen produced from decentralized municipal waste. The scope of the study is summarized in Figure 12.
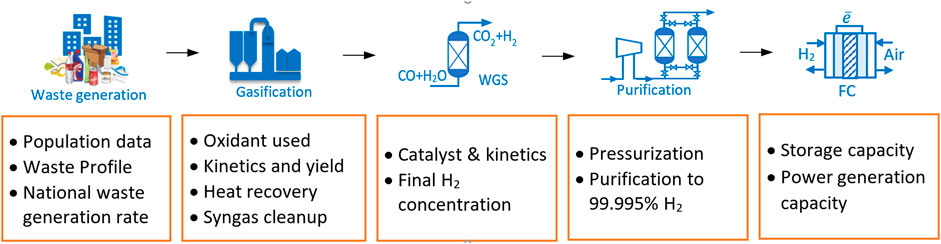
FIGURE 12. Workflow on the waste-to-hydrogen concept study.
First, the waste generation rate and its profile determine the fuel and energy generation quality and quantity, hence the feasibility. The study area expects 40,000 people to access the site for work, business, education, and services on a daily basis except for weekends. Solid waste generation is projected to be around
Gasification consists of a series of thermochemical evolution and involves competitive reaction paths. At the entrance of the gasifier, where the temperature is lower than 200°C, free water evaporates and dries up the solid waste. As the temperature increases to around 700°C, volatile components in the solid waste are released or broken up to produce light hydrocarbon, hydrogen, and tar vapors leaving behind chars. At around 1,000°C, partial oxidation occurs in the presence of oxidants (air, oxygen, or steam) to convert some of the hydrocarbons into carbon monoxide (CO), carbon dioxide (CO2), and water. This step provides the heat required for the endothermic reactions. The remaining chars will then be gasified by water and CO2 to produce more CO and H2. Water-gas shift (WGS) and methanation may also take place to produce methane and H2. After the gasification stage, the syngas produced requires cleanup to remove tar, particles, acid gases, and sulfur compounds to protect the downstream process from poisoning, blockage, and corrosion. A heat recovery module can be included in the cleanup design for process stream preheating. A wet scrubber with acid and alkali dosing and filters is a basic requirement. The hydrogen production rate from the gasification is calculated based on the kinetic data produced by a laboratory-scale steam gasification experiment (Zheng et al., 2018), extrapolated to the amount of waste projected for PDD, which is 10 tons (dry)/day. The hydrogen production rate from gasification is estimated to be 6.8 kmol/h or 33 vol% of the syngas. The hydrogen content will increase by another 57 vol% in the subsequent WGS process.
The WGS process is added after gasification to enhance the hydrogen yield and to reduce CO concentration, which poisons the platinum catalyst in the Proton Exchange Membrane Fuel Cell (PEMFC). A simulation study with Aspen HYSYS was conducted, using the gas composition and condition from the gasification process mentioned above. The kinetic data of the commercial WGS Catalyst (Low-Temperature Shift) reported by Choi and Stenger (2003) are employed to increase the final hydrogen concentration (dry basis) to 10.7 kg mol/h or 60 vol% of the syngas. The syngas exiting WGS process is cooled down to room temperature and has the water content removed. The dry syngas has 60 vol% H2, 29.1 vol% CO2, 8.1 vol% CH4, 2 vol% CO, and 0.7 vol% H2O. After going through a purification process with Pressure Swing Adsorption (PSA), assumed recovery rate of 95%, the estimated final hydrogen production rate is 10.2 kmol/h or 500 kg/day. The exhaust vent from the PSA will then consist mainly of CO2 at around 73 vol% and other gases such as CH4, CO, and H2O. The production rate of hydrogen of 500 kg/day per dry waste stream of 10 t/d (or 20 t/d of 50% moisture waste stream) is comparable to the value in the literature. A small-scale plant was reported to produce 30 kg/h hydrogen from 657 kg/h dry biomass (Binder et al., 2018). A pilot-scale gasification plant by Ways2H, Inc., has been reported to produce hydrogen from municipal solid waste (MSW) at a rate of 40–50 kg hydrogen/ton dry MSW (Jim Lane, 2020).
The experimental data and kinetic model were obtained with the Süd-Chemie Cu/ZnO/Al2O3 catalyst between 120 and 250°C. The hydrogenrich gas stream after WGS reactor requires further purification to 99.995 vol% H2 before it can be used in PEMFC. PSA has advanced from its maturity and reliability into a supercompact and fast cycle process to deliver high-purity H2 for fuel cell applications. A pressurized gas stream could reduce equipment and pipeline size. A gas stream pressure between 10 bar g and 30 bar g is also required for the purification stage to work efficiently. From a hydrogen storage perspective, a pressure between 50 and 100 bar g allows efficient space usage, but it would incur 65% more compression power than a 10 bar g system. Estimated compression powers for 10 bar g and 75 bar g systems are 45 kW e and 75 kW e, respectively.
Hydrogen storage for a stationary power generation in this study does not require ultrahigh pressure (around 300 bar g) as in the case of H2-PEMFC-powered vehicles. In this study, the 500 kg H2 generated per day if compressed to 75 bar g (room temperature density is
5.2.2 Power Generation Potential Based on W2E
Power generation using the 500 kg H2 produced per day was computed for four commercially available systems such as incineration, syngas engine, PEMFC, and PAFC (Phosphoric Acid Fuel Cell), as shown in Figure 13. Combustion technologies such as incineration and the syngas engine have higher energy yields (11.7 MWh and 7.9 MWh, respectively) due to complete carbon conversion. The thermal energy generated is also of a high-temperature range which could be further recovered with a heat recovery system such as a steam boiler turbine and an absorption chiller. While the return is high, more incentives have been given by the governments of many countries to reduce carbon emission from the flue gas stack of incinerators. With the WGS process, both PEMFC and PAFC experienced enhanced power generation of around 60%. PEMFCs can potentially generate 6.9 MWh of electricity per day (based on 40% efficiency of hydrogen fuel cells). The PEMFC’s greatest challenge lies in its sensitivity toward CO poisoning, and the thermal energy generated is of low grade (<70°C). PAFC has slightly higher power generation efficiency (higher grade waste heat can be recovered) and has the advantage of better resistance toward CO poisoning, but the downside is that it works at high operating temperatures (150°C–250°C) that require heating energy and warm-up time.
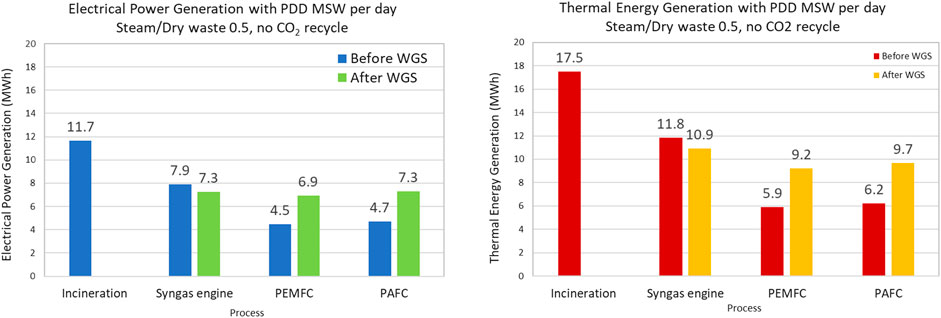
FIGURE 13. Electrical power and thermal energy generation from four types of systems (incinerator, syngas engine, PEMFC, and PAFC). Note that syngas generation kinetic data are taken from Zheng et al. (2018).
There are several challenges to be resolved before the waste-to-hydrogen system can be adopted near townships. The present MSW gasification technologies could benefit from 1) better waste stream quality, i.e., drier waste and waste sorting to exclude food waste and incombustible items; 2) enhanced oxidant efficiency where enriched oxygen stream or use of steam as an oxidant to increase hydrogen yield and concentration in gasifier outlet. As a result, capital investment in further hydrogen recovery processes such as WGS and purification via PSA can be minimized. Process safety in hydrogen storage and deployment has been one of the main hurdles to the hydrogen economy.
6 Market Models for the Integration of Urban District Ders
At urban district level, both the integration of DGs such as solar PV and EV charging bring challenges to the grid operation. On the one hand, uncontrolled EV charging may introduce higher peak demand that results in investment costs for upgrading current distribution grid infrastructures (Muratori, 2018). The rapid ramping of PV generation output due to changing atmospheric conditions reduces the power grid inertia (Denholm and Margolis, 2007) and additional reserve resources need to be procured to accommodate the intermittent nature of the renewable generation. To this end, this section identifies these potential challenges by analyzing the district-level energy portfolio and proposes solutions based on transactive energy frameworks, i.e., organizing a local market environment to enable energy exchange and grid services provision.
6.1 District-Level Energy Portfolio
Building on the load estimation results in the study area, we assess the total demand, as shown in Figure 14. It can be observed that the flexible cooling load contributes to a large extent to the electrical demand, whereby the DSF can be utilized to provide grid services. Based on the results in Section 4.2, there is DSF available from air-conditioned buildings, which may be utilized to achieve cost savings by reshaping the overall district energy demand. For example, Figure 14 demonstrates the in-principle ability to reduce the peak demand by 5%, e.g., to reduce contracted peak demand charges. Note that the 5% peak shaving is arbitrarily chosen here to motivate the need for an appropriate local market to harvest the DSF. This demonstrates the ability of the DSF to provide grid services, although there exists a need to evaluate whether remunerations for such services are sufficient to recover additional energy costs due to losses associated with load shifting. On the practical aspects of implementation, key figures such as ramp rate, holding duration, and power capacity (see Schott et al. (2019)) need to be further characterized for the air-conditioned buildings in the PDD area. This translates into the need to develop an operational framework for DSF, which enables individual loads to assess their available load shifting potential and determine offers for grid services.
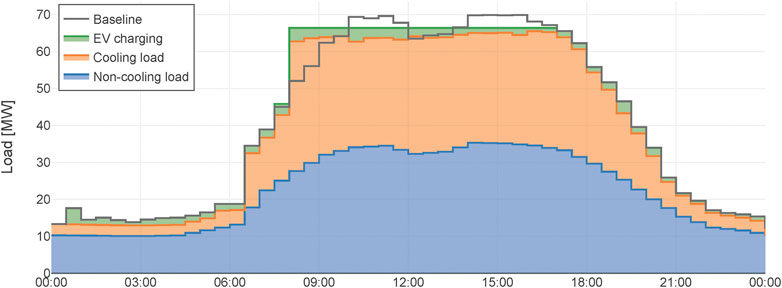
FIGURE 14. Demand-side management: peak shaving of 5% through DSF.
On the generation side, the PV generation capacity during peak hours is estimated to be 1.09 MW for the SIT campus, which is very small compared to the base load during weekdays. The estimation of distributed W2E also shows similar results, where 6.9 MW h of electricity per day is obtained based on PEMFC technology. To this end, the self-sufficient energy supply may not be achieved for most of the time for the study area, with possible exceptions to the weekends. Moreover, the DSF from air-conditioned buildings is considered the primary resource that can be harvested to support grid operation.
6.2 Market Integration Options
6.2.1 Singapore Electricity and Ancillary Service Market
Current Singapore’s wholesale market includes a real-time market (spot market) that consists of a half-hourly auction of energy and ancillary services (reserve and regulation) with demand-side bidding enabled by the demand response (DR) program introduced in 2016. On the supply-side bidding, given forecast information and their willingness to enter the market for the upcoming dispatch period, generation companies provide energy and regulation and reserve offers during each auction period (EMA, 2010). On the demand-side bidding, contestable consumers should offer a load curtailment of at least 0.1 MW to the market operator based on the forecast information. Note that a salient point of demand-side bidding in the Singapore wholesale market is that the DR program requires the load providers to bid on the energy curtailment rather than explicit energy consumption (Zhou et al., 2017). The spot market is cleared based on the bids received from the market participants and system requirements set by Power System Operator (PSO) for ensuring a reliable and secure energy supply.
For the study area, the actors to operate DGs and provide flexibility vary from a centralized microgrid operator in SIT campus, energy management system in JTC industrial properties (cooling load), third-party PV system operators in JTC, and distributed W2E generators. To this end, a regulatory framework that allows the market participation of the proactive consumers, the so-called prosumers, is needed to balance the generation and demand locally while enabling the grid operator to harvest the flexibility from the small-scale DERs. For the study area, where each DER asset is owned by the prosumers, we investigate the following options: 1) P2P marketplace and 2) virtual power plant (VPP) to facilitate the exchange of flexibility and generation capacities from small-scale DERs in the district with the wholesale market.
6.2.2 P2P Marketplace
The first option is considered as a local P2P marketplace to enable commodity exchange, where DER aggregators, MG operators, and other market participants directly interact with each other. In essence, the P2P market is a local electricity market that enables the energy prosumers’ market participation and promotes competition among small-scale market players while lowering electricity market volume barriers. The P2P market mechanisms can provide adequate short-term signals to match generation and consumption locally, while reducing energy costs and balancing needs (Tushar et al., 2020), and long-term signals to increase DER capacity investments adapted to local energy needs. Retailers can be introduced where the local demand can be met in case of insufficient local supply while increasing the local market liquidity. Ancillary services, such as flexibility for load following (balancing), can be exchanged between energy prosumers and retailers as well, which is envisioned as an important product in the study area.
The P2P marketplace concept and the interactions between actors are illustrated in Figure 15A, where each market participant provides their offers to the local P2P marketplace. A market operator is required to facilitate the market operation in different time scales, whereby it defines market clearing, payment rules, and bidding format for the market participants. Subsequent to market clearing, the local market operator provides market clearing results to the PSO. Note that at the low-voltage distribution grid level, one challenge when facilitating the P2P energy trade is the potential violation of the grid constraints. In this scope, PSO is held responsible for ensuring the local grid reliability. In return, potential grid usage fees can be charged for the P2P market participants, as discussed in our previous work (Zhang et al., 2020).
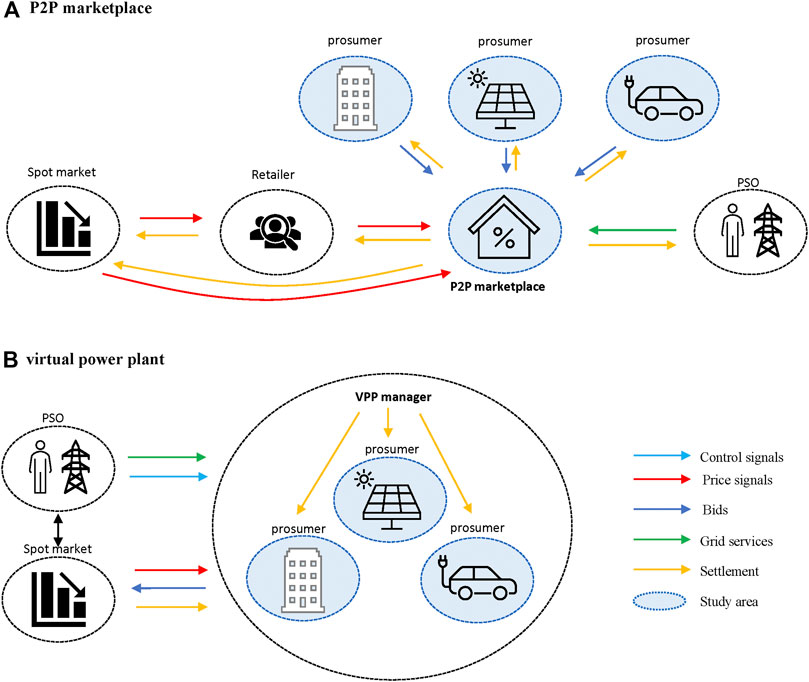
FIGURE 15. Market integration options including P2P marketplace (A) and virtual power plant (B) for DERs in the urban district.
Note that in this work, we do not target to provide any specific type of market design and its underlying pricing mechanism for the P2P market. In fact, for the P2P marketplace option, the market design and market clearing mechanisms constitute an active research area on two-sided markets (Einav et al., 2016). In the center of the market design, the matching mechanism can be implemented in various ways, including double-sided auction and centralized/distributed optimization (see, e.g., Zhang et al. (2020)), and needs to be determined for the P2P market deployment. The trading platform shall consider the heterogeneity in seller and buyer preference that also requires that platform to find a trade-off between low entry cost and information retrieval from big, heterogeneous, and dynamic information flow (Le Cadre et al., 2020).
6.2.3 Virtual Power Plant
For the second option, the VPP concept is motivated by forming a coalition of energy prosumers that may overcome market entry barriers and volume thresholds while allowing the system operators to harvest the generation and flexibility capacity from these small-scale energy prosumers. The VPP members are the local prosumers such as microgrids, FLs, EV charging station operators, distributed W2E generators, and solar PV generators. This type of VPP is regarded as commercial VPP in the literature (Saboori et al., 2011), where the impact of the distribution network is not considered in the aggregated VPP profile. The network constraints are assumed to be handled exogenously by PSO. The role of the VPP manager (third-party aggregator) is created as a representative agent of the prosumer consortium that manages the community’s energy portfolio, the exchange with the external market, and the financial settlement with its community members. In line with this, the VPP is considered to be operated by the VPP manager, where an optimal energy management system tool is to be deployed to coordinate the power dispatch for all energy consumers while maximizing the overall welfare of the underlying system and distribute the value stream by participation to the external market to each participant. The VPP concept is illustrated in Figure 15B. Considering the Singapore spot market context and the district-level energy portfolio, the VPP manager may provide reserve regulation offers to the wholesale market or participate in the DR programs. For providing regulation services, the maximum response period when increasing or decreasing output for the full amount of regulation capacity shall be 60 s, whereas response times for providing primary and contingency reserves for the Singapore spot market are 9 s and 10 min, respectively. Hence, communication infrastructure and control systems are necessitated for the VPP manager and DERs to comply with these technical requirements.
The fundamental difference compared to the P2P market option is that the VPP option in this work assumes a centralized organization imposed by an energy VPP manager without introducing competition and discrimination between the DERs. In some cases, the coalition formed by the VPP members may gain extra benefits when participating in the external market. The interaction of VPP with the wholesale market extracts the maximal benefits for all VPP members by developing a suitable strategy for market participation. The financial settlement between the VPP members can be handled separately in various ways, including long-term contracts and game-theoretical approaches (Tushar et al., 2020). For this, it is important to have a fair cost/benefit distribution system for the VPP members. The VPP option may not require significant regulatory changes to the current Singapore electricity market setup compared to the option where a local marketplace is created. Business opportunities arise when an optimal VPP management system is required, where different system architectures can be applied in both a decentralized and centralized manner to cover application scenarios such as plug-and-play (see, e.g., Zhang et al. (2019a); Zhang et al. (2019b)). Upon energy and ancillary service delivery, the power grid operator sends the control signal to the VPP manager, who is held responsible for redistributing the control signal to each energy prosumer.
6.2.4 Discussions
For the P2P market option, the business model can be an infrastructure provider to enable the transactions, including the provision of necessary software, metering, and services. In addition to recovering fixed infrastructure costs through access fees, incremental revenue might also be obtained from fees charged for managing transactions between market participants (PNNL, 2015). This would include market facilitating and clearing and settling multiparty transactions related to bilateral and auction-based deals for energy prosumers. An alternative business for a P2P market is to integrate the retailer function within the P2P market platform, which allows the operation of the P2P market as a price arbitrage and electricity retailer to the local prosumers. Park and Yong (2017) presented an overview of the potential business models that is summarized for existing P2P electricity transaction platforms. We provide the business model summary for the P2P marketplace as follows:
• Matching the preferences of renewable energy supply and consumers and provision of necessary information services at different timescales: the respective business opportunities are twofold, including 1) infrastructure provider (platform software, metering, and IT services) and 2) market operation (by collecting transaction fees)
• Price arbitrage by the integration of retail functions and energy storage services.
It is worth noticing that the P2P marketplace option still faces both technical and regulatory challenges. From the prosumers’ perspective, most examples shown by Park and Yong (2017) rely on the profitability model that can benefit both prosumers who sell electricity from renewable energy and consumers that purchase electricity. This is usually true when the current regulation provides the DER energy provision from renewable energy with a lower price than the retail price. Moreover, the volatile small-scale renewable generation makes it difficult for the practical implementation of the P2P market to provide real-time matching between the supply and demand side. The necessary infrastructure that enables real-time dispatch and tracking together with its underlying control technologies has to be put in place while metering services need to be upgraded to handle smaller market horizons and intervals. To accommodate the uncertain nature in both the supply and demand side, energy storage technologies are envisioned to play an essential part in the P2P market design as they can solve these technical issues of the P2P market in demand/supply balancing, delivery, and control (Park and Yong, 2017). In the long run, the cost decrement of the energy storage system may play a vital role in making the P2P market sustainable. For the VPP option, the business model can be based on providing customer solutions and energy portfolio management software tools to the VPP. The main reason for DER owners to participate in the energy flexibility market is monetary benefits. Therefore, the VPP manager needs to provide an efficient and fair payment system that also increases the DER owners’ satisfaction and motivation.
7 Conclusion
This article presents a holistic case study for renewable generation and DSF potentials for an urban district in Singapore. The case study covered a broad spectrum of technologies, including DSF from air-conditioned buildings, distributed W2E generators, and solar PV generators to enable the smart energy system in a local urban energy community. The major findings are summarized as follows. First, DSF from air-conditioned buildings provides a large potential for ancillary services in the study area in Singapore with up to 12% load reduction potential. Second, both W2E and PV are able to cover a small portion of local electricity demand, whereas the PV generation capacity is estimated to be 1.09 MW p and daily W2E electricity generation capacity ranges from 4.5 MW h to 11.7 MW h for different fuel cell technologies compared to 14.1 MW peak hour demand in the study area. Subsequently, the impact of intermittent PV generation is considered to be nonsignificant, particularly considering the dispatchable W2E generations to be able to buffer the PV generations. Third, to enable the procurement of flexibility to support grid operation, P2P marketplace and VPP are considered to be feasible market integration options for the current Singapore spot market context, where new roles need to be created to interact with traditional actors like PSO and retailers.
Data Availability Statement
The original contributions presented in the study are included in the article/Supplementary Material; further inquiries can be directed to the corresponding author.
Author Contributions
S-YZ, ST, ESPT, LS, and KZ conceived and designed the methodologies; TM contributed to the literature analysis and edited the manuscript before submission; the article was written by all the authors.
Funding
This research is supported by the National Research Foundation, Singapore, and the Energy Market Authority, under the Exploiting Distributed Generation (“EDGE”) Programme and administered by the EDGE Programme Office (EDGE Programme Award EDGE-GC2018-003).
Conflict of Interest
The authors declare that the research was conducted in the absence of any commercial or financial relationships that could be construed as a potential conflict of interest.
Acknowledgments
The authors would like to thank the JTC and SIT Punggol Campus Development team for their support throughout this work.
Supplementary Material
The Supplementary Material for this article can be found online at: https://www.frontiersin.org/articles/10.3389/fenrg.2021.632992/full#supplementary-material.
References
Akter, M. N., Mahmud, M. A., Haque, M. E., and Oo, A. M. T. (2017). Comparative analysis of energy trading priorities based on open transactive energy markets in residential microgrids. In Proceedings of the 2017 Australasian Universities Power Engineering Conference (AUPEC), Melbourne, Vic, Australia, November 19–22, 2017. 1–6. doi:10.1109/AUPEC.2017.8282400
Atam, E., and Helsen, L. (2016). Control-oriented thermal modeling of multizone buildings: methods and issues. IEEE Control. Syst. 36, 86–111. doi:10.1109/MCS.2016.2535913
Badal, F. R., Das, P., Sarker, S. K., and Das, S. K. (2019). A survey on control issues in renewable energy integration and microgrid. Prot. Control. Mod. Power Syst. 4. doi:10.1186/s41601-019-0122-8
Baran, B., Mamis, M. S., and Alagoz, B. B. (2016). Utilization of energy from waste plants for microgrids. In Proceedings of the 2016 4th International Istanbul Smart Grid Congress and Fair (ICSG), Istanbul, Turkey, April 20–21, 2016. 1–5. doi:10.1109/SGCF.2016.7492431
Binder, M., Kraussler, M., Kuba, M., and Luisser, M. (2018). Hydrogen from biomass gasification. Tech. rep., IEA Bioenergy: Task 33 December, 2018).
Building Construction Authority (2018). Building energy benchmarking report (statistics and figures). Tech. Rep., Singapore: Building Construction AuthorityAvailable: https://www.bca.gov.sg/GreenMark/others/BCA_BEBR_Abridged_FA_2018.pdf (Accessed October 26, 2020).
Choi, Y., and Stenger, H. G. (2003). Water gas shift reaction kinetics and reactor modeling for fuel cell grade hydrogen. J. Power Sourc. 124, 432–439. doi:10.1016/S0378-7753(03)00614-1
Chua, K. J., Chou, S. K., Yang, W. M., and Yan, J. (2013). Achieving better energy-efficient air conditioning - a review of technologies and strategies. Appl. Energy 104, 87–104. doi:10.1016/j.apenergy.2012.10.037
Daneshvar, M., Mohammadi-ivatloo, B., Asadi, S., Abapour, M., and Anvari-Moghaddam, A. (2019). A transactive energy management framework for regional network of microgrids. In Proceedings of the 2019 International Conference on Smart Energy Systems and Technologies (SEST), Porto, Portugal, September 9–11, 2019. 1–6. doi:10.1109/SEST.2019.8849075
Denholm, P., and Margolis, R. M. (2007). Evaluating the limits of solar photovoltaics (pv) in traditional electric power systems. Energy Policy 35, 2852–2861. doi:10.1016/j.enpol.2006.10.014
Di Somma, M., Graditi, G., and Siano, P. (2019). Optimal bidding strategy for a DER aggregator in the day-ahead market in the presence of demand flexibility. IEEE Trans. Ind. Electron. 66, 1509–1519. doi:10.1109/TIE.2018.2829677
Einav, L., Farronato, C., and Levin, J. (2016). Peer-to-peer markets. Annu. Rev. Econ. 8, 615–635. doi:10.1146/annurev-economics-080315-015334
EMA, (2010). Introduction to the national electricity market of Singapore. Tech. rep., Singapore: Energy Market Authority.
Garcia-Torres, F., and Bordons, C. (2015). Optimal economical schedule of hydrogen-based microgrids with hybrid storage using model predictive control. IEEE Trans. Ind. Electron. 62, 5195–5207. doi:10.1109/TIE.2015.2412524
Good, N., Ceseña, E. A. M., Heltorp, C., and Mancarella, P. (2019). A transactive energy modelling and assessment framework for demand response business cases in smart distributed multi-energy systems. Energy 184, 165–179. doi:10.1016/j.energy.2018.02.089
Gorecki, T. T., Qureshi, F. A., and Jones, C. (2015). OpenBuild: an integrated simulation environment for building control. in Proceedings of the IEEE Conference on Control Applications, Sydney, NSW, Australia, September 21–23, 2015, 1522–1527.
Hu, M., and Xiao, F. (2020). Quantifying uncertainty in the aggregate energy flexibility of high-rise residential building clusters considering stochastic occupancy and occupant behavior. Energy 194, 116838. doi:10.1016/j.energy.2019.116838
Jian, Z., Boranian, A., and Griego, D. (2013). Energy saving potential for retrofitting mixed-use buildings in Singapore: developing best practices at NTU campus. in Proceedings of the SB 13 Singapore – Realising Sustainability in the Tropics, Singapore, September 9–10, 2013. 95–101. Available: http://rpsonline.com.sg/rps2prod/sb13/pdf/053.pdf.
Kok, K., and Widergren, S. (2016). A society of devices: integrating intelligent distributed resources with transactive energy. IEEE Power Energy Mag. 14, 34–45. doi:10.1109/MPE.2016.2524962
Kuznetsova, E., Cardin, M.-A., Diao, M., and Zhang, S. (2019). Integrated decision-support methodology for combined centralized-decentralized waste-to-energy management systems design. Renew. Sustain. Energy Rev. 103, 477–500. doi:10.1016/j.rser.2018.12.020
Le Cadre, H., Jacquot, P., Wan, C., and Alasseur, C. (2020). Peer-to-peer electricity market analysis: from variational to generalized nash equilibrium. Eur. J. Oper. Res. 282, 753–771. doi:10.1016/j.ejor.2019.09.035
Lezama, F., Soares, J., Hernandez-Leal, P., Kaisers, M., Pinto, T., and Vale, Z. (2019). Local energy markets: paving the path toward fully transactive energy systems. IEEE Trans. Power Syst. 34, 4081–4088. doi:10.1109/TPWRS.2018.2833959
Masiello, R., and Aguero, J. R. (2016). Sharing the ride of power: understanding transactive energy in the ecosystem of energy economics. IEEE Power Energy Mag. 14, 70–78. doi:10.1109/MPE.2016.2524965
Melton, R. B. (2013). GridWise transactive energy framework (DRAFT version). Richland, WA: Pacific Northwest National LaboratoriesAvailable: https://www.osti.gov/biblio/1123244.
Muratori, M. (2018). Impact of uncoordinated plug-in electric vehicle charging on residential power demand. Nat. Energy 3, 193–201. doi:10.1038/s41560-017-0074-z
National Environment Agency (2016). Solid waste management technology roadmap. Tech. Rep. Singapore: National Environment Agency.
Park, C., and Yong, T. (2017). Comparative review and discussion on p2p electricity trading. Energy Proced. 128, 3–9. doi:10.1016/j.egypro.2017.09.003
Patteeuw, D., Henze, G. P., Arteconi, A., Corbin, C. D., and Helsen, L. (2019). Clustering a building stock towards representative buildings in the context of air-conditioning electricity demand flexibility. J. Building Perform. Simulation 12, 56–67. doi:10.1080/19401493.2018.1470202
PNNL (2015). GridWise transactive energy framework version 1.0. Tech. Rep. The GridWise Architecture Council.
QGIS Development Team (2009). QGIS geographic information system. Chicago, IL: Open Source Geospatial Foundation.
Recalde Melo, D. F., and Chang-Chien, L.-R. (2014). Synergistic control between hydrogen storage system and offshore wind farm for grid operation. IEEE Trans. Sustain. Energy 5, 18–27. doi:10.1109/TSTE.2013.2272332
Resnick Insitute, (2012). Grid 2020 – towards a policy of renewable and distributed energy resources. Tech. rep. Long Beach, CA: Resnick Institute Available at: https://resnick.sites.caltech.edu/documents/13352/R_Grid_SwNSkif.pdf.
Saboori, H., Mohammadi, M., and Taghe, R. (2011). Virtual power plant (vpp), definition, concept, components and types. in Proceedings of the 2011 Asia-Pacific Power and Energy Engineering Conference. Wuhan, China, March 25–28, 2011, 1–4. doi:10.1109/APPEEC.2011.5749026
Sajjadi, S. M., Mandal, P., Tseng, T.-L. B., and Velez-Reyes, M. (2016). Transactive energy market in distribution systems: a case study of energy trading between transactive nodes. in Proceedings of the 2016 North American Power Symposium (NAPS), Denver, CO, September 18–20, 2016. 1–6. doi:10.1109/NAPS.2016.7747895
Salim, M., and Pe, R. (2012). Data centre energy efficiency benchmarking – final report. Tech. rep. Singapore: National Environment AgencyAvailable at: https://www.e2singapore.gov.sg/DATA/0/docs/Resources/NEA%20DC%20Energy%20Benchmarking%20Summary-%20Final%20Report%20(3).pdf.
Schott, P., Sedlmeir, J., Strobel, N., Weber, T., Fridgen, G., and Abele, E. (2019). A generic data model for describing flexibility in power markets. Energies 12, 1893–1929. doi:10.3390/en12101893
Sturzenegger, D., Gyalistras, D., Semeraro, V., Morari, M., and Smith, R. S. (2014). BRCM MATLAB toolbox: model generation for model predictive building control. In Proceedings of the American Control Conference, Portland, OR, June 4–6, 2014. 1063–1069. doi:10.1109/ACC.2014.6858967
Teichgraeber, H., and Brandt, A. R. (2019). Clustering methods to find representative periods for the optimization of energy systems: an initial framework and comparison. Appl. Energy 239, 1283–1293. doi:10.1016/j.apenergy.2019.02.012
Troitzsch, S., and Hamacher, T. (2020). Control-oriented thermal building modelling. 2020 IEEE Power & Energy Society General Meeting (PESGM), Montreal, QC, Canada, 2020, pp. 1–5. doi:10.1109/PESGM41954.2020.9281503
Troitzsch, S., Hanif, S., and Hamacher, T. (2018). Distributed robust reserve scheduling in congested distribution systems. in Proceedings of the 2018 IEEE Power & Energy Society General Meeting (PESGM), Portland, OR, August 5–10, 2018, 1–5. doi:10.1109/PESGM.2018.8586650
Troitzsch, S., Krishna, B., Huynh, T. P., Moine, A., Hanif, S., Fonseca, J., et al. (2020). Optimal electric-distribution-grid planning considering the demand-side flexibility of thermal building systems for a test case in Singapore. Appl. Energy 273, 114917. doi:10.1016/j.apenergy.2020.114917
Tushar, W., Saha, T. K., Yuen, C., Smith, D., and Poor, H. V. (2020). Peer-to-peer trading in electricity networks: an overview. IEEE Trans. Smart Grid 11, 3185–3200. doi:10.1109/TSG.2020.2969657
Wang, A., Li, R., and You, S. (2018). Development of a data driven approach to explore the energy flexibility potential of building clusters. Appl. Energy 232, 89–100. doi:10.1016/j.apenergy.2018.09.187
Wieland, M., Nichersu, A., Murshed, S. M., and Wendel, J. (2015). Computing solar radiation on CityGML building data. in Proceedings of the 18th AGILE international conference on geographic information science 2015, Lisbon, Portugal, June 9–12, 2015.
Zhang, K., Hanif, S., Hackl, C. M., and Hamacher, T. (2019a). A framework for multi-regional real-time pricing in distribution grids. IEEE Trans. Smart Grid 10, 6826–6838. doi:10.1109/TSG.2019.2911996
Zhang, K., Hanif, S., Troitzsch, S., and Hamacher, T. (2019b). Day-ahead energy trade scheduling for multiple microgrids with network constraints. in Proceedings of the 2019 IEEE power energy society general meeting (PESGM), Atlanta, GA, August 4–8, 2019. 1–5. doi:10.1109/PESGM40551.2019.8973609
Zhang, K., Troitzsch, S., Hanif, S., and Hamacher, T. (2020). Coordinated market design for peer-to-peer energy trade and ancillary services in distribution grids. IEEE Trans. Smart Grid 11, 2929–2941. doi:10.1109/TSG.2020.2966216
Zheng, X., Ying, Z., Wang, B., and Chen, C. (2018). Hydrogen and syngas production from municipal solid waste (msw) gasification via reusing co2. Appl. Therm. Eng. 144, 242–247. doi:10.1016/j.applthermaleng.2018.08.058
Keywords: transactive energy, distributed energy resources, energy community, urban district, demand-side flexibility
Citation: Zhang K, Troitzsch S, Zhang S-Y, Teh ESP, Subramanian L and Massier T (2021) Transactive Energy in an Urban Environment: A Case Study of Local Generation and Flexibility Potentials in a Singaporean Urban District. Front. Energy Res. 9:632992. doi: 10.3389/fenrg.2021.632992
Received: 24 November 2020; Accepted: 15 January 2021;
Published: 29 March 2021.
Edited by:
GM Shafiullah, Murdoch University, AustraliaReviewed by:
Mohsen Khorasany, Monash University, AustraliaTaskin Jamal, Ahsanullah University of Science and Technology, Bangladesh
Copyright © 2021 Zhang, Troitzsch, Zhang, Teh, Subramanian and Massier. This is an open-access article distributed under the terms of the Creative Commons Attribution License (CC BY). The use, distribution or reproduction in other forums is permitted, provided the original author(s) and the copyright owner(s) are credited and that the original publication in this journal is cited, in accordance with accepted academic practice. No use, distribution or reproduction is permitted which does not comply with these terms.
*Correspondence: Kai Zhang, kai.zhang@tum-create.edu.sg