Influencing Factors, Energy Consumption, and Carbon Emission of Central Heating in China: A Supply Chain Perspective
 Guixian Liu1†
  Zhaoyang Kong2†*
  Jiajia Dong3
  Xiucheng Dong4 Qingzhe Jiang4 Ke Wang5 Jiaman Li4 Chade Li6 Xin Wan7
- 1School of Economics and Management, China University of Petroleum-Beijing, Beijing, China
- 2School of Business, University of International Business and Economics, Beijing, China
- 3Metropolitan College, Boston University, Boston, MA, United States
- 4School of International Trade and Economics, University of International Business and Economics, Beijing, China
- 5Haskayne School of Business, University of Calgary, Calgary, AB, Canada
- 6PowerChina Beijing Engineering Corporation Limited, Beijing, China
- 7China Nuclear Engineering Consulting Co., Ltd., Beijing, China
The rapid growth of energy demand in China’s central heating sector and the large differences in regions have posed challenges to its energy supply safety, which affected the progress of China’s energy transformation. From a supply chain perspective, this study uses the feasible generalized least squares method to conduct empirical research on the central heating data of 17 provinces in China from 2006 to 2017. The results shows that the main factors of central heating includes energy consumption structure, heat generation method, heat transport carrier, heating degree days and heating area; The main factor that increases the energy consumption of central heating in each province is the same, namely Heating area (HA). However, the main factors that reduce energy consumption in each province are different; using gas instead of coal for clean heating can reduce some greenhouse gas emissions while bringing huge gas supply pressure. According to the results, this study provides some policy suggestions.
Introduction
In recent decades, global warming has become an environmental issue of widespread concern (Dong et al., 2020a; Zhang et al., 2021b). The rapid increase in carbon dioxide emissions is considered to be one of the main causes of global warming (Dong et al., 2020b). Zhang et al. (2020a) points out that carbon emissions in the field of central heating are the main contributors to global greenhouse gas emissions.
Heating sector has been developing rapidly in recent years because it has been supported consistently by Chinese government as an important component of China’s infrastructure (Lin and Lin, 2017). In 2013, the State Council claimed that it would speed up central heating (The State Council, 2013). Central heating has gradually become the main type of winter heating in the Northern provinces. With the progress of urbanization, the construction of heating-related infrastructure has developed rapidly, and the growth rate of the heating area and the heat transport pipeline have been relatively high. As shown in Figure 1, from 2006 to 2017, total heating area in urban areas in China increased from 2,895 to 9,772 million m2, and the overall length of China's urban centralized heating pipelines increased from 104,800 to 337,081 km. As a result, the heat consumption in the district heating sector increased by 0.8 billion GJ(Giggio) from 2006 to 2017, reaching 6.6 billion GJ (Ministry of Housing and Urban-Rural Development. P.R. China, 2016).
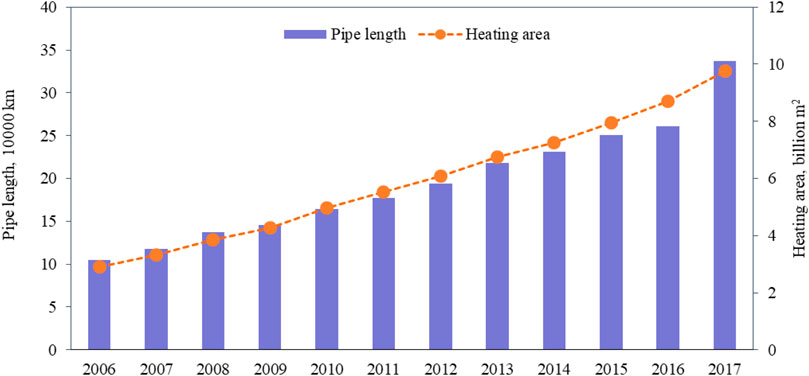
FIGURE 1. China’s urban district heating area and heating pipelines in 2006–2017.
The urbanization in China will maintain a relatively high speed (The State Council, 2014). As urbanization progresses, the urban population will increase at a relatively high speed (Zhang, et al., 2021a), and the “rigid demand” for heating energy consumption will increase. Therefore, the energy demand in the field of district heating will maintain rapid growth in the future. In addition, the energy demand for central heating varies from region to region due to the differences in climate, infrastructure, and energy consumption structure. As shown in Figure 2, in 2017, energy consumption of central heating in China’s various provinces differ substantially (Ministry of Housing and Urban-Rural Development. P.R. China, 2016). For instance, the energy consumption of central heating in Liaoning is higher than 1.2 billion GJ, whereas that in Gansu is only 0.05 billion GJ.
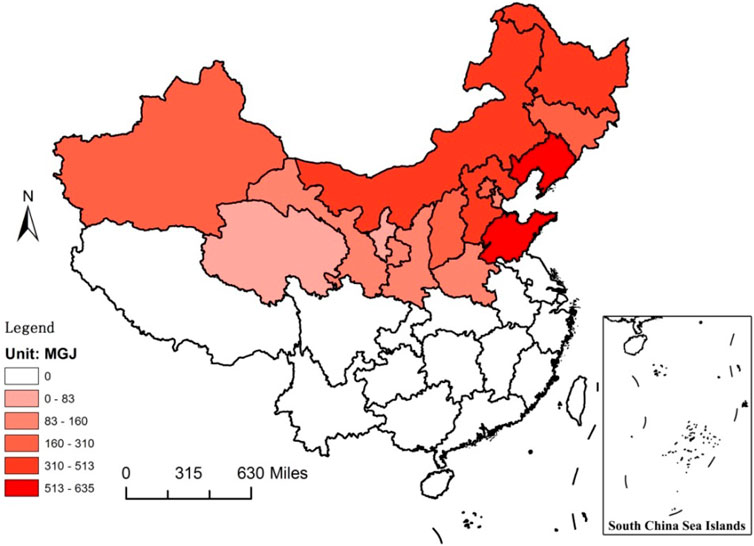
FIGURE 2. Distribution of central heating in various provinces in China in 2017.

FIGURE 3. Model framework.
The rapid growth of energy demand in China’s central heating sector and the large differences in regions have posed challenges to its energy supply safety, which affected the progress of China’s energy transformation. With the objective of improving air quality, On September 17, 2013, six departments including National Development and Reform Commission (NDRC) jointly issued “the Implementation Rules of the Action Plan for Prevention and Control of Air Pollution in Beijing–Tianjin–Hebei Region and the Surrounding Areas” to control the total amount of coal consumption and promoting the clean utilization of energy. In various provinces, especially in Beijing, Tianjin, and Hebei Provinces, the UGIC (Using gas instead of coal) project, which is regarded as an effective method of reducing air pollution, has been accelerated gradually, leading to the increase of gas demand in central heating. However, due to limited natural gas resources, the growth of natural gas supply is limited. Natural gas demand has obvious seasonal characteristics, that is, natural gas consumption in winter is much higher than in summer. The pipeline natural gas imported by China mainly comes from Central Asian countries. Natural gas consumption in Central Asian countries also has obvious seasonal characteristics. In winter, Central Asian countries would reduce their natural gas exports to China in order to ensure their natural gas supply, which would lead to a reduction in China's pipeline natural gas imports. As a result, in 2017, the imbalance between supply and demand of natural gas has led to gas shortages in large areas of China, and the gas supply for residents in some areas cannot be guaranteed (Li et al., 2021). Therefore, on December 4, 2017, the Ministry of Environmental Protection had to issue an urgent document that pointed out that in the heating season, the citizens lived in the places where UGIC projects have been accomplished can continue to use the past coal-fired heating methods or other alternatives (He, 2017).
Analysis of the impact of heating energy consumption is beneficial to predict accurately the future of energy consumption in the field of central heating, which will help in energy development planning to ensure energy supply security. In recent decades, more and more scholars have estimated the energy demand in the field of central heating. Previous research mainly used two methods: top-down method and bottom-up method (Swan and Ugursal, 2009; Wahlström and Hårsman, 2015).
The top-down studies are based on a systematic perspective and usually relate the energy consumption of the residential sector to GDP (Gross Domestic Product), fuel prices, building characteristics, and climatic conditions (Swan and Ugursal, 2009). This method is generally applicable to studying the energy consumption in the entire industry in countries and regions. For example, Lin and Lin (2017) hold that the energy demand in China's heating industry is affected mainly by economic development, urban population density, heating area, and fuel price. However, this method tends to overlook small but important factors such as house insulation (building structure and materials) and building user characteristics (population, literacy, and consumption). Therefore, there is bound to be some error in estimating the energy consumption needs of the heating sector by such methods. Such method is not suitable for accurate estimation of energy need in smaller areas (even a building).
The bottom-up methods treat housing in a disaggregated way and make it possible to analyze the impact of different housing attributes on energy consumption, in addition to household characteristics and occupant behavior. In general, this method first estimates the average energy usage per square meter and then multiplies the total building area to calculate the total heating consumption (Hu et al., 2016). Such methods are used widely in real life, especially when the estimation target is the energy needs of a building. It entails developing a deeper understanding of the interrelationships between the building’s basic physical properties and the heat transfer characteristics and then using computers for deterministic algorithm programming. As such methods are costly and computationally complex, they are not suitable as a common method of estimating the energy demand in the district heating field in a large area, such as either country or province (Caldera et al., 2008).
Based on the analysis of top-down and bottom-up methods, this study uses econometric methods to analyze the influencing factors of China's central heating and predict future energy consumption and carbon emission trends. The main contributions of this study are as follows: 1) this study constructs the influencing factor model of energy consumption demand in the central heating field in China from the perspective of the supply chain for the first time, thus providing a new idea for estimating the energy demand of district heating. 2) This study uses annual panel data from 17 central heating provinces in China from 2006 to 2015 and uses FGLS to calculate the impact of energy consumption and influencing factors at the provincial level in central heating. This article is the first to comprehensively consider the impact of PCH, PHW, HDD, HA, and PCC on energy consumption. 3) This study estimates energy consumption and carbon dioxide (CO2) emissions in the field of central heating. Through scenario simulation, this paper studies the possibility of replacing coal with natural gas as the main energy source in the field of central heating from the perspective of carbon emission reduction and energy supply security.
The rest of the paper is organized as follows: Methodology section introduces energy consumption model in central heating. Empirical Results and Discussion section provides the empirical results and discusses them. The last section introduces the findings and provides some policy implications.
Methodology
Model Framework
This section builds an estimation model of energy demand for central heating based on the national standard model (NSM) combined with the perspective of the macro estimation model. As shown in Figure 3, from the perspective of supply chain, the NSM considers the influencing factors in three stages such as production stage, transportation stage, and consumption stage. The production stage includes the standard coal heating value index (Hc) and boiler operating efficiency (η2). The transportation efficiency of the outdoor pipe network (η1) is mainly considered in the transportation stage. The consumption stage includes the building insulation efficiency (qH) and the number of days in the heating period (Z).
where, qc represents the energy consumption per unit heating area. Although the NSM is often used to estimate heating energy consumption in cities and even countries, in fact, it is more suitable for estimating heating energy consumption in specific buildings. For a specific building, these parameters can be obtained more accurately and easily. Because regional or even national central heating contains a large number of different types of buildings, the parameters of these buildings such as η1, η2 and qH are different. Moreover, with the passage of time, these parameters in the same area also change. In addition, the NSM is not applicable to certain regions such as underdeveloped regions in China. Because of the low level of regional development and insufficient central heating, regional heating is not sensitive to temperature. Some households (in areas covered by central heating) may have indoor temperatures lower than the design temperature.
With reference to the NSM, the model shown in Figure 2 is adopted to assess possible main influencing factors associated with central heating supply chain, which comprises three stages: production stage, transportation stage and consumption stage. The production stage involves energy consumption structure and heat generation method. The transportation stage includes heat transport carrier. The consumption stage mainly considers heating degree days and heating area. The detailed description of each factor is as follows:
Energy consumption structure (ECS): The energy consumption types of central heating mainly include coal, oil and natural gas. Different types of energy have different calorific values. As shown in the NSM, the calorific value of fuel will affect the energy consumption of central heating. In addition, there are obvious differences in the energy-to-heat conversion efficiency of different fuels (Mu et al., 2020). Therefore, the energy consumption structure in the field of central heating will directly affect energy consumption. Coal has always been the main energy source of central heating. In 2017, coal consumption in central heating accounted for 92.75%. This study uses the proportion of coal consumption in central heating sector to measure the energy consumption structure. The specific formula is as follows,
where, PCC indicates the proportion of coal consumption in the field of central heating;
Heat generation methods (HGM): Currently, the methods of central heating in China mainly include cogeneration heat generation and boiler heat generation (National Bureau of Statistics, 2018a; National Bureau of Statistics, 2018b). The heat production efficiency of cogeneration and boiler heat production is relatively stable, but the efficiency of the former is much higher than that of the latter (Chen et al., 2014). Therefore, the higher the proportion of cogeneration in an area is, the less energy consumption for heating. Therefore, the proportion of cogeneration heat generation (PCH) is used to measure the difference in heat generation methods. The specific formula is as follows,
where,
Heat transport carrier (HTC): The heat transfer of central heating is usually completed by pipeline transportation. In this process, different degrees of heat loss will occur (Du et al., 2018). The transportation carriers of central heating in China include hot water and steam. Because the former has a higher specific heat capacity, its heat transfer efficiency is higher. Then, the higher the proportion of heat transferred by hot water in a region, the higher the efficiency of heat transportation in the region. Therefore, this study uses the proportion of heat transferred by hot water (PHW) to measure the efficiency of transportation stage, and the formula is expressed by
where,
Heating degree days (HDD): The outdoor temperature affects the insulation effect of the building, and a lower outdoor temperature increases the energy consumption for heating (Wahlström and Hårsman, 2015). Compared with the average outdoor temperature, HDD could indicate the degree of coldness outside more accurately (Streicher et al., 2019). The HDD calculation method is expressed by
where,
Heating area (HA): Generally, the larger the heating area, the greater the energy consumption for heating. The NSM assumes that the heating area has a coefficient of influence on energy consumption of 1, that is, when the heating area increases by 1%, the total heating energy consumption increases by 1%. This assumption may be appropriate when estimating the energy consumption of central heating in a single building or buildings of the same type. However, when the research object is regional or national central heating energy consumption, the assumption may result in larger estimation errors because of the scale effect of central heating. For example, the heating energy consumption of a 50-square-meter building is less than that of two 25-square-meter building. Wahlström and Hårsman (2015) and Capozzoli et al., (2015) also pointed out that the coefficient of influence of heating area on energy consumption may be less than 1. In this study, HA was selected as one of the influencing factors of heating energy consumption, and the relationship between HA and energy consumption was evaluated. The data on HA comes from the China Urban and Rural Construction Statistical Yearbook (Ministry of Housing and Urban-Rural Development. P.R. China, 2016).
Based on the above analysis, this research finally builds an econometric model as follows,
where,
Currently, China’s main central heating provinces include 17 provinces such as Beijing, Tianjin, Hebei, Shanxi, Inner Mongolia, Liaoning, Jilin, Heilongjiang, Anhui, Shandong, Henan, Hubei, Shaanxi, Gansu, Qinghai, Ningxia, and Xinjiang (Ministry of Housing and Urban-Rural Development. P.R. China, 2016). The data of 17 provinces from 2006 to 2017 are used as samples for empirical analysis, and the statistical description of variables is shown in Table 1.
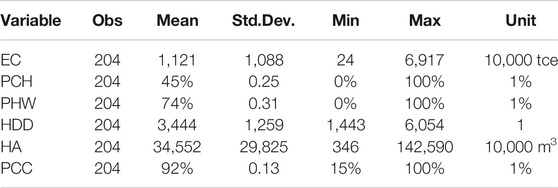
TABLE 1. Statistical description of variables.
Econometric Method
Panel data models include three models: hybrid model, fixed effects model and random effects model.
The hybrid model assumes that the intercept
The fixed effects model assumes that the intercept
This study selects specific model through the following three tests:
Test 1: Wald test, to determine whether to choose a fixed effects model or a hybrid model;
Test 2: B-P test, to determine whether to choose a random effects model or a hybrid model;
Test 3: Hausman test, to choose a fixed effects model or a random effects model.
The multicollinearity of variables will lead to the lack of stability of regression model, the loss of significance in the significance test of variables, the increase of the variance of the OLS (Ordinary Least Squares) estimator, and the difficulty in distinguishing the individual effects of each explanatory variable. Therefore, this study measured the VIF (Variance Inflation Factor) of the model to test whether the model has a multicollinearity problem to increase the robustness of results.
Empirical Results and Discussion
Regression Results
Table 2 summarizes the main regression results. The F value of the fixed effects model is 2.51, which is greater than the critical value of 1%, and the null hypothesis is rejected. This indicates that there are individual fixed effects, and the fixed effects model is better than the ordinary mixed regression model. The BP value of the random effects model is greater than the critical value of 1%, rejecting the null hypothesis, which means that the random effects model is better than the ordinary mixed regression model. The Hausman test results show that the null hypothesis cannot be rejected, that is, the random effects model is better than the fixed effects model. In summary, the random effects model is more suitable for this study. Table 3 shows the results of the multicollinearity test. It is found that the VIF values of all variables are less than 10, indicating that the economic model we constructed does not have the problem of multicollinearity.
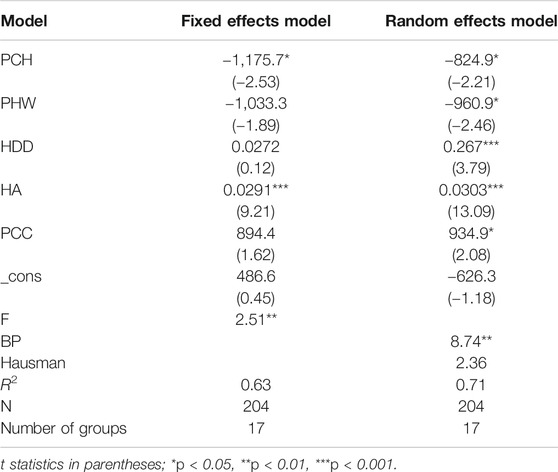
TABLE 2. The main regression results.
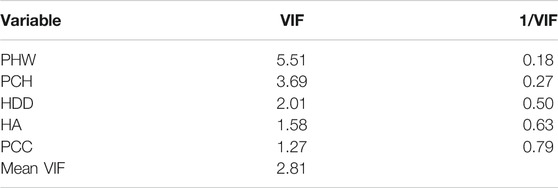
TABLE 3. The results of multicollinearity test.
The results (Table 2) show that the regression coefficients of PCH, PHW, HDD, HA and PCC are significant, and R2 is 0.71, which shows that the econometric model constructed here is reliable.
Specifically, when PCH increased by 1%, the energy consumption in the field of central heating will be reduced by 82,500 tce (tons of standard coal equivalent). This is in line with our expectation that the heat generation efficiency of cogeneration is higher than that of boilers, and increasing the ratio of cogeneration will reduce energy consumption. As of 2017, except for Anhui Province, all provinces in China have PCH below 80%, which has great potential for energy saving. Among them, Beijing, Shaanxi, Tianjin, Xinjiang and other provinces and cities PCH only reached 2, 30, 30, and 36%. When PHW increases by 1%, the energy consumption will be reduced by 96,100 tce. The heat transfer efficiency of hot water is higher than that of steam, and increasing its ratio will reduce energy consumption. In fact, in order to reduce energy consumption of central heating, Chinese government has tried to use hot water instead of steam as a heat transport carrier. The proportion of hot water increased from 74.7% in 2006 to 85.3% in 2017. If HDD increases by 1, the energy consumption will increase by 2,700 tce. It is easy to understand that the colder the outside, the more heat is needed for heating and the more energy is needed. In fact, as the global temperature rises, from 2006 to 2017, the average value of HDD in various provinces in China dropped from 3,429.4 to 3,325.4. If HA increases by 10,000 m2, the energy consumption could increase by 30,000 tce. From 2006 to 2017, the area of central heating in China increased rapidly, with an increase of 248%. If PCC increases by 1%, the energy consumption may increase by 93,500 tce.
Influencing Factors in Different Provinces
In this section, combined with the changes in PCH, PHW, HDD, HA, and PCC in various provinces of China from 2006 to 2017, this study uses the regression coefficients obtained in Regression Results section to calculate the contribution of each factor to the energy consumption of each province’s central heating sector. The specific formula is expressed by
where,
From 2006 to 2017, the annual HA growth rate of each province is between 4.8 and 35.1%, of which over 80% of the provinces are above 10% (Ministry of Housing and Urban-Rural Development. P.R. China, 2016). However, the main factors that reduce energy consumption in each province are different, and these provinces could be simply divided into four categories, as shown in Figure 4.
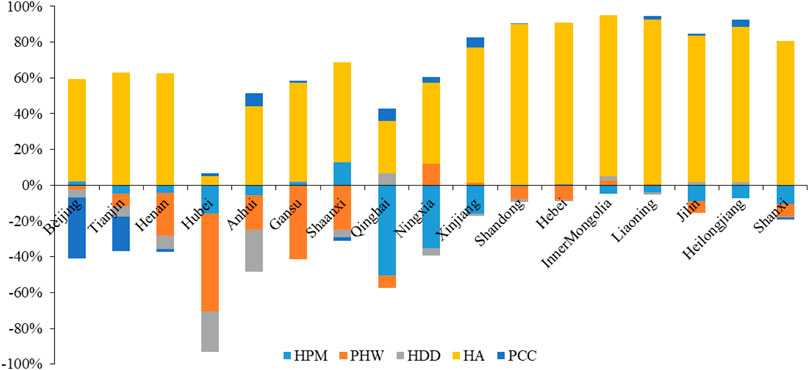
FIGURE 4. The contribution of each factor to the energy consumption of each province’s central heating sector.
The first category includes Beijing and Tianjin, where PCC is the main factor in lowering their energy consumption. From 2006 to 2017, the UGIC projects in the central heating sector in Beijing and Tianjin continued to be promoted, and PCC decreased annually by 13.5 and 3.5%, respectively.
The second category includes Henan, Hubei, Gansu, Shaanxi, Shandong, and Hebei. PHT is the main factor in lowering their energy consumption. From 2006 to 2017, the PHT of 7 provinces including Henan, Hubei, Gansu, Shaanxi, Shandong, and Hebei increased annually by 7.9, 23.8, 6.2, 11.7, 4.7, and 3.1%, respectively. The increase in PHT is the main factor in the reduction of energy consumption in these five provinces.
The third category includes Qinghai, Ningxia, Xinjiang, Inner Mongolia, Liaoning, Jilin, Heilongjiang, and Shanxi. PCH is the main factor that lowers their energy consumption. The PCH of Qinghai, Ningxia, Xinjiang, Inner Mongolia, Liaoning, Jilin, Heilongjiang and Shanxi provinces increased annually by 16, 11.7, 11.8, 2.3, 2.9, 3.8, 3.5, and 4.9% respectively.
The fourth category includes Anhui, where HDD is the main factor in reducing energy consumption. Compared to 2006, HDD in 2017 decreased by 9.9%.
Outlook of Energy Consumption in Central Heating
Predicting central heating energy is of great significance to formulate energy policy and ensure energy supply. In this section, this study forecasts the energy consumption of different provinces in China’s central heating sector in 2030. First, this study used linear regression to predict PCH, PHW, HDD, HA and PCC in each province in 2030. Among them, the values of PCH, TC and PC should be between 0 and 100%, so we have made corresponding corrections to the predicted values of PCH, PHW and PCC (Table A1). For example, from 2006 to 2017, Beijing’s PCC has dropped from 74.4 to 7.5%; therefore, in 2030, Beijing’s PC may be 0, not a negative value. In addition, Wang and Li (2020) use the long short-term memory neural network forecasting model to predict that China’s HA will reach 15.753 billion m2 in 2030. This is basically consistent with our prediction of HA (17.24 billion m2). Based on the more specific prediction results of each factor in Table A1 and the influence coefficients of various factors, the energy consumption in 2030 can be predicted. The forecast results in Figure 5 show that in 2030, the energy consumption for central heating in China may reach 427 Mtce (million tons of standard coal equivalent), with an increase of 101% compared to 2017.
TABLE A1. Predicted values of influencing factors in the field of central heating in 2030.
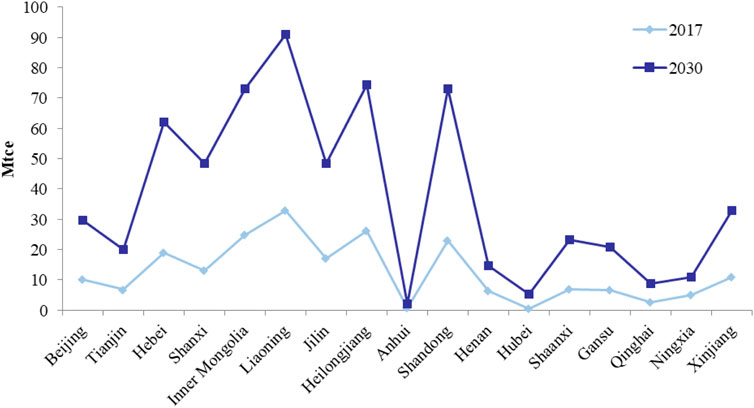
FIGURE 5. Energy consumption of central heating in different provinces in 2030.
Outlook of Gas Consumption in Central Heating
Based on Section 4.3.3, this section further predicts the natural gas consumption of central heating in different situations. Heating is one of the main causes of haze pollution in northern China in winter, causing serious environmental and health problems. Then, Chinese government formulated the “Clean heating plan in Northern region (2017–2021)” and officially listed clean heating as a national strategy (National Development Reform Commission, 2017). As a main method of clean heating, natural gas heating has been widely recognized and promoted (Zhang et al., 2020b), especially in the Beijing-Tianjin-Hebei region. Natural gas heating has led to a surge in natural gas demand in winter, increasing the difficulty of natural gas supply, and even leading to a national natural gas supply shortage, especially in 2017. The accurate prediction of natural gas consumption in the heating sector is a prerequisite for ensuring heating supply. Specifically, this study has set up three scenarios. Under these scenarios, total energy consumption of central heating in 2030 is the same, but the difference lies in the proportion of natural gas. Scenario 1 is the baseline scenario. Based on the data on the proportion of natural gas consumption in the central heating sector from 2006 to 2017, using the linear prediction method, this study predicts the proportion of natural gas consumption in each province in 2030, and then estimates the natural gas consumption in Scenario 1. This study assumes that the proportion of natural gas consumption in Scenario 2 and Scenario 3 is increased by 10% and 30% respectively on the basis of Scenario 1. The forecast results in Figure 6 show that under the three scenarios, natural gas consumption in central heating in 2030 will increase by 103, 402, and 1,001%, respectively, compared with 2017. In 2030, the province with the most natural gas consumption is Beijing, followed by Liaoning and Shandong.
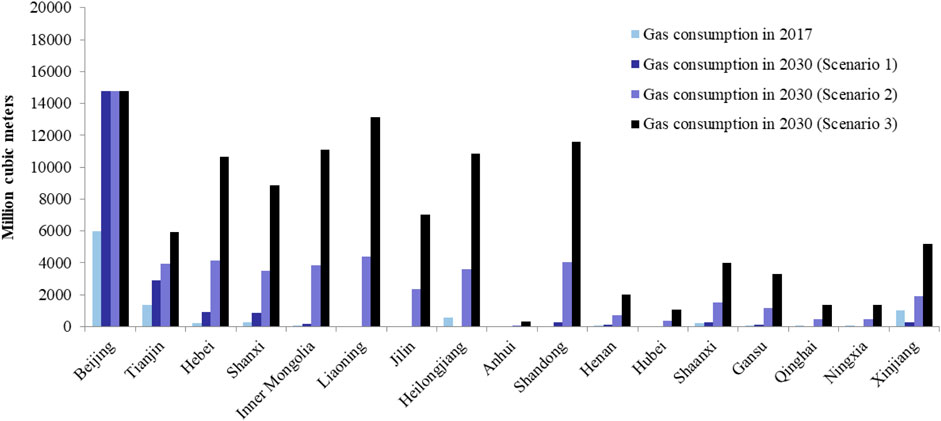
FIGURE 6. Gas consumption of central heating in 2030.
The increase in natural gas consumption of central heating will further increase the dependence on natural gas from foreign countries, thereby increasing the risk of natural gas supply. According to the “China Energy Prospects 2018–2050” published by the National Academy of Social Sciences, China's total natural gas consumption will reach 383.5 billion cubic meters in 2030, and its dependence on foreign sources is as high as 51.2%. For example, under Scenario 3, the degree of dependence on foreign countries will increase by 18.4–60.6% in 2030. In addition, the energy consumption of China’s central heating is in the winter (from November 15th to March 15th of the following year). At this moment, some natural gas exporting countries are also in the peak season of natural gas consumption. This means that when China's natural gas imports need to soar, the supply capacity of exporting countries may decline, which further increases the risk of natural gas supply. For example, one of the main reasons for the large-scale gas shortage in China in the winter of 2017 was the sudden decrease of natural gas exported from Central Asia to China (Ding et al., 2020).
Outlook of Carbon Emissions in Central Heating
In 2015, Chinese government has pledged to reduce its CO2 emissions per unit of GDP by 60–65% by 2030 compared with the level in 2005. Besides, it has signed the “Paris Agreement” on climate change and pledged to fulfill the commitments in the agreement (Du et al., 2018). Using gas instead of coal (UGIC) for heating, in addition to reducing environmental pollution, can also reduce carbon emissions. Eq. 9 is used to calculate the carbon emission reduction benefits brought by UGIC projects in the central heating sector under three scenarios. This helps the government to comprehensively consider the natural gas supply risks and environmental benefits brought about by the UGIC policy, so as to determine the promotion of UGIC.
where,
The forecast results in Figure 7 show that, in Scenario 1, CO2 emissions reached 1,105.2 Tg in 2030, which was an increase of 556 Tg compared to 549.2 Tg in 2017. Compared with scenario 1, scenario 2 and scenario 3 achieve 42.1 Tg and 126.4 Tg of CO2 emission reductions, respectively. In 2030, the province with the most CO2 emission from central heating is Liaoning, followed by Shandong and Heilongjiang.
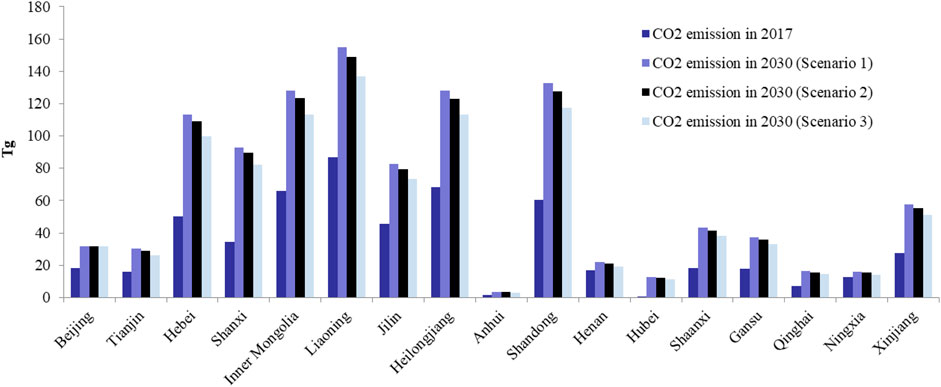
FIGURE 7. CO2 emissions of central heating in 2030.
Conclusion and Policy Implication
This study constructs the model of energy consumption in the central heating sector in China from the perspective of supply chain, thus providing a new idea for estimating the energy demand of central heating. With annual panel data from 17 central heating provinces in China from 2006 to 2015, this study uses FGLS to estimate the influencing factors of central heating at the provincial level and forecast its energy consumption and CO2 emissions in 2030.
This study found that PCH, PHW, HDD, HA and PCC are the main factors affecting the energy consumption of central heating. Among them, the increase of PCH and TC will reduce energy consumption, while the increase of HDD, HA and PCC will increase energy consumption. As shown in Figure 8, the PCH of seven provinces, including Beijing, Shaanxi, Tianjin, Xinjiang, Liaoning, Gansu and Ningxia, is less than 50%.

FIGURE 8. PCH and PHW in 2017.
The results show that the main factor that increases the energy consumption of central heating in each province is the same, namely HA. In the next ten years, HA may be still in a period of rapid growth. On one hand, as urbanization progresses, the increase of urban population would result in the increase of energy demand for central heating. On the other hand, the current central heating is mainly concentrated in the northern area of Qinling-Huaihe. In fact, in winter many southern cities have an average temperature below 6°C for 90–100 days. As the lack of central heating in winter leads to poor indoor thermal environment, the requirement for heating in the southern cities becomes more and more urgent. The problem of energy supply and carbon emissions in the field of central heating will be more severe, and it is imperative to improve the efficiency of energy supply.
The research results show that natural gas instead of coal for clean heating, although reducing some CO2 emissions, brings great pressure on natural gas supply. For example, compared with Scenario 1, Scenario 3 achieve 126.4 Tg of CO2 emission reductions, 11.4%. However, under Scenario 3, the degree of dependence on foreign countries will increase by 18.4–60.6% in 2030. In fact, UGIC in the Beijing-Tianjin-Hebei region was one of the main reasons for the nationwide gas shortage in 2017.
This research proposes the following policy recommendations.
First, in the face of rapidly increasing heating demand, China should develop multiple heating methods. Encourage the diversification of central heating sources. For example, support and encourage local and enterprises to develop heat sources such as solar energy, straw, and geothermal. In addition, enterprises are encouraged to make full use of corporate waste heat.
Second, the government should issue policies to promote cogeneration to replace boiler heat. For example, the establishment of special heating funds to transform heating methods. The special funds come from the provincial government. In particular, for eight provinces with relatively low PHW, such as Anhui, Hubei, Shandong, Henan, Hebei, Shaanxi, Liaoning and Ningxia, the central government can set up special funds to support the transformation of heat production methods.
Third, it is suggested that the natural gas development plan should be further optimized on the basis of fully considering the changes in natural gas consumption caused by central heating. In addition, to meet the rapid growth of natural gas demand after residential heating, China should increase investment in natural gas exploration and development, accelerate the construction of natural gas storage capacity, and improve peak shaving capabilities.
Fourthfaced with a shortage of natural gas resources, China should not regard UGIC as the main way to clean up the heating sector in the future. A better choice may be to support the clean use of coal in the heating sector, such as promoting the application of CCS (Carbon Capture and Storage) technology in the process of coal heating.
However, this study has some shortcomings and limitations. First, this study did not consider factors such as building structure, building type, and building insulation capabilities. Second, in the process of scenario simulation, only the scenario of natural gas replacing coal was considered, and other alternative heat sources were not considered. In addition, in future research, we consider the possibility of central heating in southern China. Focus on the study of the impact of central heating in southern China on carbon emissions.
Data Availability Statement
The original contributions presented in the study are included in the article/Supplementary Material, further inquiries can be directed to the corresponding author.
Author Contributions
GL: Methodology, Writing-Original draft preparation; ZK: Data curation, Writing-Original draft preparation; JD: Visualization, Investigation; XD: Visualization, Investigation; QJ: Conceptualization; KW: Writing, Data collection; JL: Data collection, Investigation; CL: Data collection, Investigation; XW: Editing, Language.
Funding
This study is supported by the Fundamental Research Funds for the Central Universities in UIBE (19QD03), the National Social Science Foundation of China (18VDL017), and the Innovation Methods Special Foundation of the Chinese Ministry of Science and Technology (2018IMO40100).
Conflict of Interest
CL was employed by Power China Beijing Engineering Corporation Limited.
XW was employed by China Nuclear Engineering Consulting Co., Ltd.
The remaining authors declare that the research was conducted in the absence of any commercial or financial relationships that could be construed as a potential conflict of interest.
Appendix
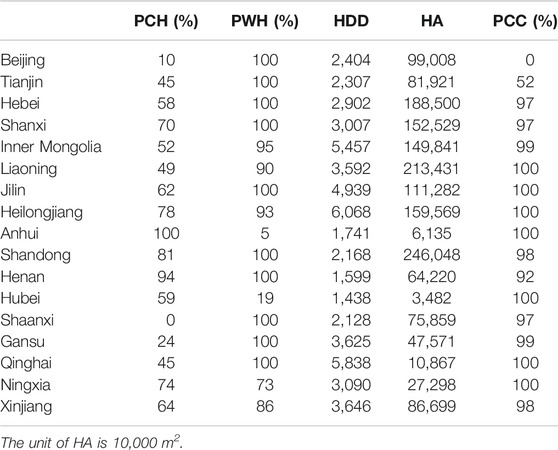
TABLE A1. Predicted values of influencing factors in the field of central heating in 2030.
References
Caldera, M., Corgnati, S. P., and Filippi, M. (2008). Energy demand for space heating through a statistical approach: application to residential buildings. Energy Build. 40, 1972–1983. doi:10.1016/j.enbuild.2008.05.005
Capozzoli, A., Grassi, D., and Causone, F. (2015). Estimation models of heating energy consumption in schools for local authorities planning. Energy Build. 105, 302–313. doi:10.1016/j.enbuild.2015.07.024
Chen, X., Wang, L., Tong, L., Sun, S., Yue, X., Yin, S., et al. (2014). Mode selection of China’s urban heating and its potential for reducing energy consumption and CO2 emission. Energy Policy 67, 756–764. doi:10.1016/j.enpol.2013.11.057
China Meteorological Administration (2016). China ground international exchange station climate data day data set (V3.0). Available at: http://data.cma.cn (Accessed February 21, 2021).
Ding, Y., Zhang, M., Chen, S., and Nie, R. (2020). Assessing the resilience of China’s natural gas importation under network disruptions. Energy 211, 118459. doi:10.1016/j.energy.2020.118459
Dong, K., Dong, X., and Ren, X. (2020a). Can expanding natural gas infrastructure mitigate CO2 emissions? Analysis of heterogeneous and mediation effects for China. Energy Econ. 90, 104830. doi:10.1016/j.eneco.2020.104830
Dong, K., Hochman, G., and Timilsina, G. R. (2020b). Do drivers of CO2 emission growth alter overtime and by the stage of economic development? Energy Policy 140, 111420. doi:10.1016/j.enpol.2020.111420
Du, M., Wang, X., Peng, C., Shan, Y., Chen, H., Wang, M., et al. (2018). Quantification and scenario analysis of CO2 emissions from the central heating supply system in China from 2006 to 2025. Appl. Energy 225, 869–875. doi:10.1016/j.apenergy.2018.05.064
He, J. (2017). The National Development and Reform Commission responds to the problem of “coal to gas”: coal is suitable for heating and gas is suitable for residents. Available at http://static.nfapp.southcn.com/content/201712/19/c855500.html. Accessed February 21, 2021.
Hu, S., Yan, D., Cui, Y., and Guo, S. (2016). Urban residential heating in hot summer and cold winter zones of China-Status, modeling, and scenarios to 2030. Energy Policy 92, 158–170. doi:10.1016/j.enpol.2016.01.032
Li, J., Dong, X., Jiang, Q., Dong, K., and Liu, G. (2021). Natural gas trade network of countries and regions along the belt and road: where to go in the future? Resour. Policy 71, 101981. doi:10.1016/j.resourpol.2020.101981
Lin, B., and Lin, J. (2017). Evaluating energy conservation in China’s heating industry. J. Clean. Prod. 142, 501–512. doi:10.1016/j.jclepro.2016.06.195
Ministry of Housing and Urban-Rural Development. P.R. China (2016). China urban-rural construction statistical Yearbook. Available at: http://www.mohurd.gov.cn/xytj/tjzljsxytjgb/jstjnj/. (Accessed February 21, 2021)
Mu, Y., Chen, W., Yu, X., Jia, H., Hou, K., Wang, C., et al. 2020). A double-layer planning method for integrated community energy systems with varying energy conversion efficiencies. Appl. Energy 279, 115700. doi:10.1016/j.apenergy.2020.115700
National Bureau of Statistics (2018a). China city statistical Yearbook. Available at: https://data.cnki.net/trade/Yearbook/Single/N2012020070?z=Z007. (Accessed February 21, 2021)
National Bureau of Statistics (2018b). China energy statistical Yearbook. Available at: https://www.yearbookchina.com/navibooklist-n3020013309-1.html. (Accessed February 21, 2021)
National Development and Reform Commission (2017). Clean heating plan in Northern region. Available at: http://www.gov.cn/xinwen/2017-12/20/content_5248855.htm. (Accessed February 21, 2021)
National Development and Reform Commission (2011). Guidelines for the preparation of provincial GHG inventories. Available at: http://www.cbcsd.org.cn/sjk/nengyuan/standard/home/20140113/download/shengjiwenshiqiti.pdf. (Accessed February 21, 2021)
Streicher, K. N., Padey, P., Parra, D., Bürer, M. C., Schneider, S., and Patel, M. K. (2019). Analysis of space heating demand in the Swiss residential building stock: element-based bottom-up model of archetype buildings. Energy Build. 184, 300–322. doi:10.1016/j.enbuild.2018.12.011
Swan, L. G., and Ugursal, V. I. (2009). Modeling of end-use energy consumption in the residential sector: a review of modeling techniques. Renew. Sust. Energy Rev. 13, 1819–1835. doi:10.1016/j.rser.2008.09.033
The State Council (2013). Action plan for prevention and control of atmospheric pollution. Available at: https://baike.baidu.com/item/%E5%A4%A7%E6%B0%94%E6%B1%A1%E6%9F%93%E9%98%B2%E6%B2%BB%E8%A1%8C%E5%8A%A8%E8%AE%A1%E5%88%92/10318682?fr=aladdin. (Accessed February 21, 2021).
The State Council (2014). National new urbanisation plan (2014–2020). Available at: http://www.gov.cn/zhengce/2014-03/16/content_2640075.htm (Accessed February 21, 2021).
Wahlström, M. H., and Hårsman, B. (2015). Residential energy consumption and conservation. Energy Build. 102, 58–66. doi:10.1016/j.enbuild.2015.05.008
Wang, W., and Li, F. (2020). Study on substitutable value of electric heating instead of coal heating in northern China under carbon constraints. J. Clean. Prod. 260, 121155. doi:10.1016/j.jclepro.2020.121155
Zhang, B., Zhang, H., Long, Y., Fang, K., Xu, N., Li, Z., et al. (2020a). Economic and environmental co-benefit of natural gas supply chain considering the risk attitude of designers. J. Clean. Prod. 272, 122681. doi:10.1016/j.jclepro.2020.122681
Zhang, W., Cui, Y., Wang, J., Wang, C., and Streets, D. G. (2020b). How does urbanization affect CO2 emissions of central heating systems in China? An assessment of natural gas transition policy based on nighttime light data. J. Clean. Prod. 276, 123188. doi:10.1016/j.jclepro.2020.123188
Zhang, H., Chen, J., Yan, J., Song, X., Shibasaki, R., and Yan, J. (2021a). Urban power load profiles under ageing transition integrated with future EVs charging. Adv. Appl. Energy 1, 100007. doi:10.1016/j.adapen.2020.100007
Keywords: central heating, energy demand, influencing factors, China, gas consumption
Citation: Liu G, Kong Z, Dong J, Dong X, Jiang Q, Wang K, Li J, Li C and Wan X (2021) Influencing Factors, Energy Consumption, and Carbon Emission of Central Heating in China: A Supply Chain Perspective. Front. Energy Res. 9:648857. doi: 10.3389/fenrg.2021.648857
Received: 02 January 2021; Accepted: 28 January 2021;
Published: 22 March 2021.
Edited by:
Qi Liao, University of Lisbon, PortugalReviewed by:
Minghao Zhuang, China Agricultural University, ChinaQing Ji, Beihang University, China
Shao-Chao Ma, China University of Geosciences, China
Copyright © 2021 Liu, Kong, Dong, Dong, Jiang, Wang, Li, Li and Wan. This is an open-access article distributed under the terms of the Creative Commons Attribution License (CC BY). The use, distribution or reproduction in other forums is permitted, provided the original author(s) and the copyright owner(s) are credited and that the original publication in this journal is cited, in accordance with accepted academic practice. No use, distribution or reproduction is permitted which does not comply with these terms.
*Correspondence: Zhaoyang Kong, 02896@uibe.edu.cn
†These authors have contributed equally to this work