The Role of Biowaste: A Multi-Objective Optimization Platform for Combined Heat, Power and Fuel
 Rafael Castro-Amoedo
 Nicolas Morisod
 Julia Granacher
 François Maréchal
- 1Industrial Process and Energy Systems Engineering (IPESE), École Polytechnique Fédérale de Lausanne, Lausanne, Switzerland
- 2Satom SA, Monthey, Switzerland
Biomass, bioenergy and negative emission technologies are inherent to the future design of energy systems. Urban clusters have a growing demand for fuel, heat and electricity, which is both a challenge and an opportunity for biomass-based technologies. Their deployment should meet demand, while minimizing environmental impact and staying cost-competitive. We develop a systematic approach for the design, evaluation and ranking of biomass-to-X production strategies under uncertain market conditions. We assemble state-of-the-art and innovative conversion technologies, based on feedstock, by-products and waste characteristics. Technical specifications, as well as economic and environmental aspects are estimated based on literature values and industry experts input. Embedded into a bi-level mixed-integer linear programming formulation, the framework identifies and assesses current and promising strategies, while establishing the most robust and resilient designs. The added value of this approach is the inclusion of sub-optimal routes which might outperform competing strategies under different market assumptions. The methodology is illustrated in the anaerobic digestion of food and green waste biomass used as a case study in the current Swiss market. By promoting a fair comparison between alternatives it highlights the benefits of energy integration and poly-generation in the energy transition, showing how biomass-based technologies can be deployed to achieve a more sustainable future.
1 Introduction
The global energy system is changing due to the need of curbing greenhouse gas emissions. The large majority of European countries have set ambitious goals by defining a carbon-neutral policy by 2050. Achieving a sustainable future relies not only on the introduction of renewable feedstocks and energy sources but also on efficient and integrated systems. Energy from biomass is one of the most widely explored research fields in energy and environmental science. Defined as a carbon-neutral energy source, biomass can be regarded as a promising energy storage option, compensating for the progressive phase-out of fossil fuels. In this context, Sepulveda et al. (Nestor, 2021) have recently highlighted the role of firm low-carbon technologies in balancing future energy systems, decisively contributing for cost-effective zero-emission systems. The policy-enhanced requirement to generate negative CO2 emissions places biomass in the center of renewable energy use (IRENA, 2016). As of 2018, modern bioenergy 1 roughly represented half of the generated renewable energy while accounting for only 5% of global final energy consumption (REN21, 2020). The potential to achieve a higher share exists: as a versatile feedstock, biomass has a large plethora of downstream processing options, including the production of different fuels, on top of heat and electricity.
Future energy strategies plan a massive deployment of renewable energy, intensifying periods of surplus electricity (summer) with periods of intense demand (winter). As pointed out by Candra, Hartmann, and Nelles (Candra et al., 2018) the greater the share of renewables, the more frequently the price of electricity will approach zero. For debottlenecking the offset of demand and supply and its implication on electricity price, chemical storage can be applied. In periods with surplus electricity, chemical storage - offered by thermochemical biomass conversion - benefits from a cheap (or even free) electricity market, while electricity production is economically unattractive. We should not be surprised then to find a growing need for flexible poly-generation systems that can easily accommodate seasonal fluctuations.
As a broad category, biomass is a limited resource disputed for food, feed and fuel as recently reviewed by Muscat et al. (2020). The ongoing debate pertains to the competition for land, water, labor and capital. Biowaste, however, does not suffer from such competition. A growing concern with sustainability metrics and circular economy regards it as a resource, questing for attractive economic and environmental conversion routes, beyond the prime safe disposal concern. Urban biowaste, in particular, represents the organic residue issuing from households, municipalities, and industries that is separately collected from other municipal solid waste fractions (Steubing et al., 2010). It accounts for food waste (FW) residues from either households or professionals and municipal residues such as garden leftovers and sweepings, commonly labeled as green waste (GW). In Switzerland, as pointed out by Burg et al. (2019), urban biowaste generation has been steadily increasing for the past 20 years. Steubing et al. (2010) noted that from a current sustainable energy potential of 8.2 PJ, only 5.5 PJ (67%) is presently used. The study does not mention, however, the efficiency of the conversion processes. The unused biowaste potential triggers, besides a clear energy loss, an additional problem from an environmental perspective due to the natural partial decomposition of organic fractions into nitrous oxide (N2O) and methane (CH4).
Burg et al. (2019) went further and estimated the long-term (up to 2050) potential of wet bioenergy resources in Switzerland by means of a Monte Carlo simulation. Based on an increasing trend in consumer patterns and waste generation, side by side with better management policies and consumer engagement, the study calls for and validates long-term investment in biomass-to-energy infrastructure. In particular, anaerobic digestion and biogas generation are expected to dominate biowaste management policy by 2050. However, the study does not explore different digestate (the remainder of anaerobic digestion) disposal alternatives or biogas downstream processing but rather assumes their use as a fertilizer and an energy source, respectively. Moreover, the approach foregoes the potential risk of soil contamination as highlighted in Nkoa (2014), and misses the important energy system perspective of employing biogas as a chemical building block.
Collection and transport of biomass to conversion facilities are non-negligible factors. Schnorf et al. (2021) studied key biomass transport chains in Switzerland and identified the cost as the main barrier to biomass transport, whereas energetic and environmental benefits largely justify the involved logistics. On economic grounds, break-even distances range from 36 to 477 km, depending on the feedstock, and requiring between 0.4 and 5% of its embodied energy. The decentralized fashion of urban biowaste collection, spatially distributed according to population demographics, sets an average distance between source nodes and treatment facilities below 30 km - thereby not jeopardizing the transportation of biomass from an economic point of view.
Current state-of-the-art technologies for energy production, such as combined heat and power (CHP), rely heavily on fossil fuels. The defossilization of the energy sector opens the door to new technologies, such as heat pumps or geothermal wells, along with more versatile feedstocks. Urban biowaste, in particular, can be converted to store energy products by a variety of means, such as digestion, gasification or liquefaction. As borne out by Celebi et al. (2019), a combination of technologies is particularly suitable not only to address high-temperature heat needs but also to boost system and conversion efficiency. While digestion produces biogas, the co-generation of digestate can be thermally valued in either gasification or liquefaction units, producing excess heat in the medium-to high-temperature range by cooling down producer gas and liquid products, respectively. Enhanced heat integration allows further recovery which can be used for electricity production (via expansion/steam turbine), process integration with different energy-intensive stages such as drying or even the integration with other industrial clusters.
Biomass gasification is a thermochemical process designed to obtain value-added products (CH4, H2, CO, CO2), from potentially low-cost feedstocks, combining high efficiency (Gassner and Maréchal, 2012) and desirably low investment and operating costs. Urban biowaste and digestate, oftentimes readily available, constitute a potentially free feedstock, making them a viable and promising energy source. Moreover, gasification is able to handle lignocellulosic rich streams which anaerobic digestion - the state-of-the art technology for biowaste - cannot. According to Sikarwar et al. (2016) the three most common gasifiers - the fixed bed, the fluidized bed and the entrained flow - contribute to the gasification capacity of handling a wide range of biomass compositions, making it a suitable technology to value seasonal-dependent waste fractions. Gasification comprises several steps prior to the gasifier such as feedstock drying, pyrolysis and partial combustion. Air is the most common gasifying media, but oxygen, steam of carbon monoxide are also used. However, investment costs can be as much as three times the one of incineration (Sikarwar et al., 2016).
Watery feedstocks, among which food waste or digestate, are better handled by catalytic hydrothermal gasification (CHTG), in which water is kept at supercritical conditions, prompting inorganic salts precipitation. It overcomes the need for the pre-drying step associated with conventional gasification, since it requires a pumpable (below 20 wt% solids) input material. CHTG, when compared to conventional gasification, shows higher overall conversion efficiency and reduced tar formation (Mian et al., 2015). However, it requires both high-pressure (above 220 bar) and high-temperature (above 400°c) conditions which impact the investment cost. Nevertheless, as pointed out by Sikarwar et al. (2016) the poly-generation concept of biomass gasification brings flexibility and increased efficiency due to potential mass and heat integration synergies.
Several authors, among which Granacher (2019), have addressed gasification and liquefaction technologies for biomass. Damartzis and Zabaniotou (2011) reviewed and ranked different biomass-to-biofuels gasification designs based on economic and environmental performance metrics. Korberg et al. (2021) highlighted the use of gasification to valorize different biomass types in a low-carbon future scenario, while Magagula et al. (2021) simulated and investigated ways to promote energy-neutral gasification processes. Segurado et al. (2019) reviewed polygeneration systems coupled with biomass gasification; although hindered from the economic perspective, biomass gasification requires more study and would profit from optimization frameworks that are able to capture different market realities. Mian et al. (2015) studied hydrothermal gasification of microalgae in a multi-objective optimization framework; Gassner and Maréchal developed a thermo-economic optimization decision-support methodology for lignocellulosic biomass, whereas Celebi et al. (2019) developed a similar concept for woody biomass. Castro-Amoedo et al. (2020) considered both gasification and liquefaction for sewage sludge. Together these studies provide important insights into the thermochemical pathways to convert different types of feedstock. Cheng et al. (2020) reviewed a large number of studies on urban biowaste and emphasized the need to develop a wide range of value-added products, promoting a bio-based circular economy, rather than focusing on the peculiar aspects of anaerobic digestion and composting.
Research Gaps and Objectives
Biomass treatment technologies are manifold and hold promising potential. Their combination and potential synergies are of uttermost importance in a fast and evolving energy system. The literature is abundant with examples of single conversion technologies, but rather neglects holistic and integrated approaches, especially when embedding uncertainty features.
In this work we provide a strategic perspective on how to move toward economically and environmentally sound biowaste conversion systems, by considering a systematic approach. Developing a methodology to simultaneously assess, compare and rank system designs, contributes to close the gap in the future bio-based economy. Indeed, the discussion is of particular relevance in the context of rapid urbanization, increasing environmental awareness and regulations, and the interaction between environment and energy systems. We critically assess, in an operational context, the economic, environmental and thermodynamic aspects of solutions. A two-level optimization framework, using a mixed-integer linear programming (MILP) model is built to study system designs under different pricing and market conditions - showing how they can provide benefits to the local energy ecosystem.
By applying our modeling framework to a cluster of 400,000 people equivalent, this work provides a prime example on the opportunities arising from the poly-generation of heat, electricity and fuels in urban biowaste treatment. We expand on the benefits of anaerobic digestion by showing that, when coupled with biogas upgrade and digestate treatment units, it opens the door to inexpensive fuel production, whether in the form of synthetic natural gas, formic acid or both. Constant biowaste generation and a non-limiting demand for each final product are assumed. Different economic assumptions introduce flexibility to handle volatile resource prices while profiting from changes across the year, such as carbon-free or zero-marginal cost renewable electricity production. The insights we derive are applicable to other biomass-based systems and should contribute to broadening the discussion on the best strategy for handling biomass feedstocks and meeting the current and future energy demand.
The paper is outlined as follows: in Section 2 the methodology is outlined, starting with the conversion modeling strategy, followed by the energy integration model and mathematical formulation, and leading to the evaluation and ranking system. The specifications of the case study are discussed alongside modeling options. In Section 3, we apply the methodology to the case study; system designs are clustered, analyzed, evaluated and ranked, highlighting the robustness of the procedure, but also bottlenecks and limitations. Section 4 concludes the work, arguing on the suitability of the methodology to handle biomass-based challenges and contribute to the future energy system.
2 Methods and Application
The optimization of complex integrated energy systems, as mentioned in Maronese et al. (2015) and Tock and Maréchal (2015), is very time consuming, underscoring the need to develop and use a methodology that sets-up simple parameterized models. Thermodynamic, economic and environmental aspects need to be considered simultaneously for identifying promising designs inside an intricate structure without requiring complex solving strategies. A master-slave partition on a bi-level optimization methodology (Figure 1) is developed for this purpose. The master level controls multi-objective framework by sending optimization inputs to the MILP - which works at the slave level - further retrieving design variables and performance indicators. It is a variation of the comprehensive Analyse Generate Interpret Report and React (AGIR) approach, first proposed by Maréchal and Kalitventzeff (1997). Therein, the Analyse step consists in the definition of system boundaries and identification of possible system units with their corresponding economic and environmental models. In the Generate step, optimization tools are used to create a list of system configurations by activating and sizing units while defining appropriate operating conditions. Interpret creates meaningful indicators for the associated values of decision values, whereas Report and React is responsible for the user interaction part, ultimate responsible to define, upon proper interpretation, a new AGIR procedure.
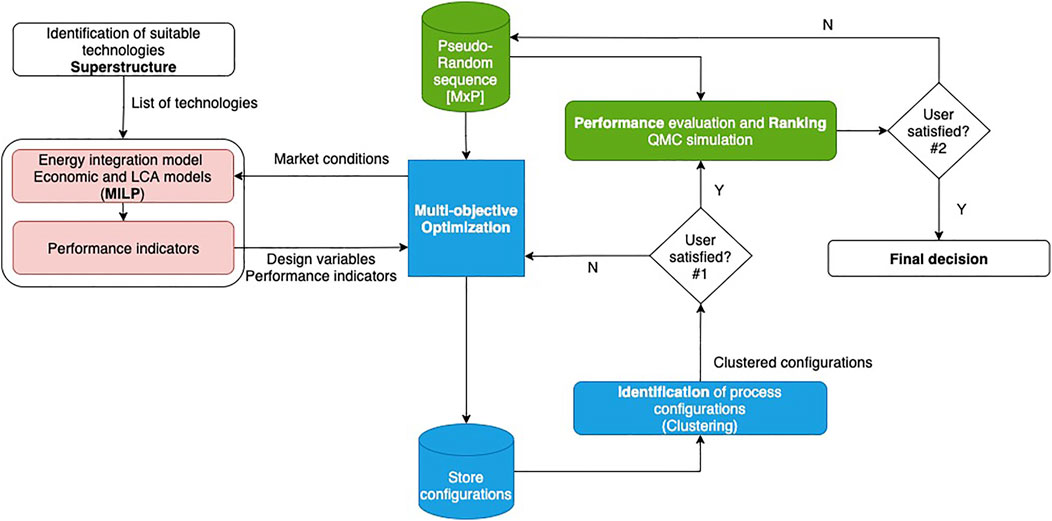
FIGURE 1. Solution generation procedure; blue and red shapes refer to the master and slave level, respectively. Green shapes are user controlled.
2.1 Superstructure
A superstructure is built by aggregating into a single entity all process models related to the conversion of the feedstock to different products and by-products. There is no practical limit to the number of process models to be added, provided they are suitable to handle the feedstocks and intermediate products.
A superstructure defines the main process steps - setting up thermodynamic and technically feasible operating conditions - while accounting for physical and chemical transformations, in addition to resource needs and heat requirements. Options for heat recovery and the energy conversion system (utility systems) are added, such as heat pumps, Rankine cycles and gas boilers. A similar superstructure concept was developed by Santibañez-Aguilar et al. (2013), Maronese et al. (2015) and Castro-Amoedo et al. (2020).
The quantity and quality of available data shapes the accuracy of the overall model. Flowsheeting software (e.g., Aspen) can be used for a conversion technology or a utility system, while models not involving thermodynamic considerations are based on literature values. Each model defines an interface with the rest of the process, with the internal mathematical formulation used to describe input/output relations appearing as a blackbox for the energy integration and process synthesis model. This feature allows combining models from different software and literature sources. The major challenge is the accurate representation of operating conditions on mass and energy balances; these balances define material conversion but also heat (with corresponding temperature levels θk, if applicable) and power requirements, further used for energy integration. To build a thermo-environomic representation for the energy integration optimization problem, an economic model is used to estimate operating and investment costs, whereas a life cycle assessment one links material and energy flows with the corresponding life cycle inventory process. A key attribute of this approach is the embedded linearity of all features with respect to a reference size - therefore assuming constant efficiency.
2.2 Energy Integration Model
The total cost of the process is minimized by computing thermodynamically feasible energy targets. These targets are achieved by optimizing heat recovery and combining heat, power and fuel generation while activating different conversion units - hence defining the least expensive energy conversion system. The problem is solved using a MILP (described in Section 2.3).
The energy integration model relies on the definition and identification of hot and cold stream profiles and respective minimum approach temperature, which allows to define hot and cold composite curves. Pinch identification (Linnhoff and Hindmarsh, 1983; Maréchal and Kalitventzeff, 1998a) and graphical analysis enable further process suggestions and improvements regarding conversion technologies and heat integration. The quality of process integration has a direct impact on the process performance, and should be tackled by key performance indicators.
2.3 Mathematical Formulation
The overall problem follows a MILP formulation, allowing for the inclusion of the discrete (binary) and continuous behavior of the system, while ensuring the required robustness. Discrete time intervals t ∈ T = {1, 2, … , tt}, with duration
The MILP objective is the minimization of total cost - Tc (Eq. 1). Operating expenditures - Opex (Eq. 2) account for fixed (
The ϵ constraint method is used for multi-objective optimization, by constraining the environmental impact (Eq. 5). Sobol sampling is used to generate different values of ϵm; sm,ϵ refers to the entrances on the sampling matrix SM,P; ϵmax and ϵmin, to upper and lower boundaries coming from single optimization of the environmental impact, respectively. The approach works as a grid in the objective domain, with M market scenarios generation and P uncertain parameters, the latter identified by a ( ˜) on the respective definition.
with:
Material and energy flow models contain physical properties used to define both mass and energy requirements.
The approach developed in Maréchal and Kalitventzeff (1998b), based on the work of Linnhoff and Hindmarsh (1983) is used to satisfy the minimum energy requirements. The energy balance is closed in each temperature interval k (Eq. 14) and residual heat (
∀k ∈ K with θk+1 ≥ θk
The MILP problem is written in AMPL (AMPL et al., 2013) and solved by IBM ILOG CPLEX Optimization Studio (IBM ILOG Cplex, 2009). Indices, sets, variables and parameters used in the formulation are resumed in the Nomenclature section.
2.4 Performance Indicators
Distinct process options are evaluated on thermodynamic, economic and environmental aspects (Table 1). They are suitable to compare and rank solutions, allowing for simultaneous bench-marking with similar studies and publications. Thermodynamic indicators such as efficiencies are able to capture the quality and extent of process integration and heat recovery, but also the efficiency of a chemical conversion. Electrical (Eq. 16), thermal (Eq. 17), chemical (Eq. 18) and global (Eq. 19) efficiencies are thus considered. Δh0 reports to the lower heating value on a dry basis of the respective products. Economic metrics comprise financial indicators (Capex, Opex and Tc) but also the pay-back time (Eq. 20), which evaluates the time needed for investment recovery. A complexity factor (Eq. 21) accounts for the number of activated technologies, with lower values representing simpler systems.
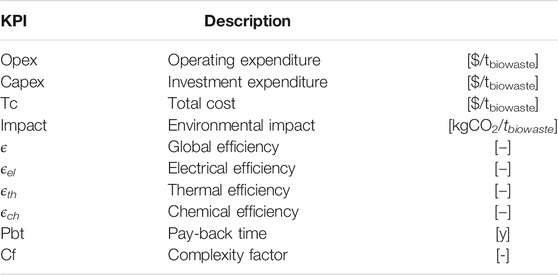
TABLE 1. Key performance indicators.
2.5 Solution Generation and Clustering
Varying market settings - at the random sequence generator level - ensures the generation of configurations which, under constant/nominal market conditions, would not emerge. The procedure is controlled by the master (multi-objective optimization) level and executed by the slave MILP model. The former is responsible for receiving random Sobol parameters and forward them to the latter that minimizes total cost, while deciding on the existence and size of each superstructure unit. The master level stores configurations and repeats the procedure for the M market scenarios generated.
The generation procedure is neither sensitive to repeated solutions nor to numerically-close ones. Indeed, solutions exist with designs close enough to be considered identical in practical applications. By applying clustering, the number of relevant solutions is reduced according to a similarity measure. The number of clusters is decided based upon state-of-the-art Silhouette (Rousseeuw, 1987) and Elbow (Davies and Bouldin, 1979) methods, following data normalization, which removes the mean and scales data to unit variance. The K-medoids algorithm is used for clustering, relying upon the set of existing solutions for centroid representation, avoiding therefore non-realistic centroids as provided by the k-means algorithm. As clustering is not based on KPIs but rather on configurations, sub-optimal solutions under current market conditions are selected, which might then become optimal on a different set of market values.
2.6 Ranking and Performance Evaluation
The use of a quasi Monte-Carlo (QMC) simulation, making use of a low-discrepancy Sobol sequence, recomputes performance indicators for each cluster centroid and for each set of market conditions. The use of a quasi-random sequence is associated with higher sampling efficiency, compared to classic pseudo-random methods (Hou et al., 2019), which justifies its increasing use in sensitivity and uncertainty analysis. This procedure allows to bound and rank solutions, but also to produce statistical insights. For each set of market conditions and for each KPI, a solution is rewarded with 1 point if it is among the top-three performances. Scores are then normalized, outlining the design with the best probabilistic performance globally (defining a total score) and per KPI - thus promoting a robust, informed and reliable decision-making procedure. As design problems involve decisions on a long time-horizon (normally 10–20 years), the need to account for market variability and unpredictability is paramount. In that regard, et al. (Moret et al., 2017) highlighted the relevance of economic scenarios on energy planning systems and signaled the risk of using a priori selection of uncertain parameters.
2.7 Main Highlights of the Methodology
Although our method can run with no user intervention, it would benefit from an interactive user - focusing on providing thoughtful and subjective insight. Based upon the solutions ranking, the user evaluates the suitability of each configuration while taking into account the objective criteria provided by optimization (user satisfied #2, Figure 1). If satisfied, the process ends and proceeds for decision. If not, provided the designs are judged adequate, the user can control and change the parameters at the QMC simulation step, recomputing performance indicators and retrieving new results until an acceptable outcome is reached. On the other hand, if a reasonable design is not reached (user satisfied #1, Figure 1), steering market conditions at the master level will generate a new set of configurations. The robustness of the model allows for minimal involvement, mainly circumscribed to a phase when a large set of solutions is available. This reinforces the confidence of non-specialists in optimization tools and promotes engagement, reducing the likelihood of missing good solutions.
2.8 Case-Study Application
A biowaste superstructure is depicted in Figure 2, with connections for different combined heat, power and fuel strategies. The units in gray require investment, updated to 2019 values using the chemical engineering plant cost index (CEPCI). Biowaste generation of 3.75 t/h and 4.5 MW corresponds to 400,000-person equivalent, which is used as the reference population. The network diagram (Supplementary Appendix Figure A9) shows both the source nodes and the biowaste treatment facility. A monthly resolution (twelve time steps) covering a full year of operation is used to capture the variation of seasonal parameters and make use of data provided by the industrial partner.
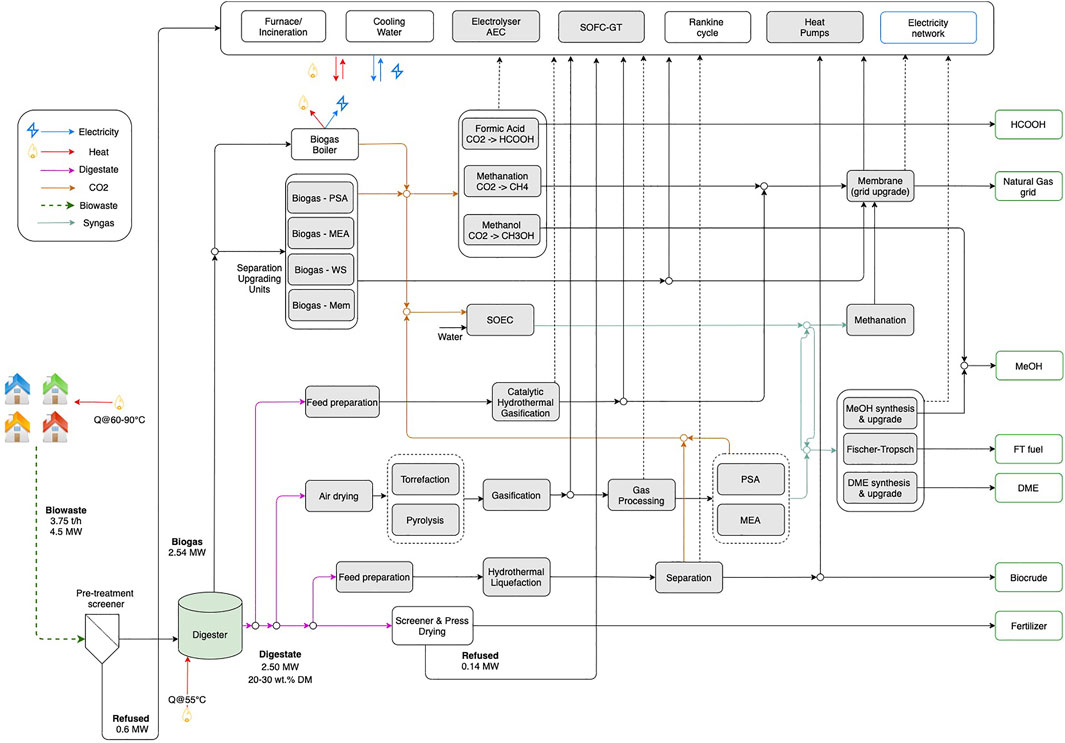
FIGURE 2. Urban biowaste superstructure with average yearly values. Gray fill units are proposed investments. WS - water scrubbing; Mem - polymeric dry membranes.
Superstructure Modeling
Models are the core of the conversion process description, allowing to formulate the transformation from feedstock to final value-added products. Surrogate and blackbox models, which are simplified representations of complex systems, originate from literature values, experts input or detailed simulation models in flowsheet software. Belsim (2018) and Al-Malah (2016), both simulation software, use compositions and characteristics of digestate to generate simplified models. Each model has a reference flow or size (e.g., reference input digestate) that is linearly scaled considering input/output of mass and energy flows. Regardless of the size, constant efficiency is assumed; costs have a linear dependency with unit’s size. Supplementary Appendix Tables A7 and A8 summarize key assumptions and input/output values. In particular, temperature-enthalpy profiles are defined and fixed for each conversion unit, therefore not subjected to optimization. Supplementary Appendix Tables A5 and A6 describe environmental and economic assumptions, respectively. In this section only the most relevant modeling strategies are presented.
Our case study limits impact categories to global warming potential (GWP) using the IPCC 2013 GWP100a impact method. Its widespread use and bench-marking potential motivated the choice. However, it might not be the most adequate indicator to tackle digestate use as a fertilizer or even future concerns with the use and production of some conversion technologies; impact categories relative to land, waste or other biological levels could be considered. Subsidies and gate-fees, which are difficult to estimate, were also excluded.
Feedstock and Pre-treatment
Anaerobic digesters are able to handle different organic waste fractions, provided contamination is kept to a minimum. Three biowaste fractions (s ∈ S) are considered: green waste (GW), food waste (FW) and whey. GW is ground and sieved to guarantee a maximum particle size of 10 cm, and FW is ground and mixed with water - ensuring a pumpable sludge prior to digester inlet. Whey does not undergo any pre-treatment prior to its use.
Digester
The digester is modeled as a semi-continuous reactor, working on the thermophilic range (55°c), with a variable residence time. Biowaste quantities and composition (Figure 3A) reflect seasonality, which impacts the digester residence time, while external temperature influences digester heat demand (Figure 3B). Following the approach of Wellinger, Murphy et al. (2013) and Castro-Amoedo (2019), biogas generation is modeled as a first-order kinetic reaction (Eq. 22).
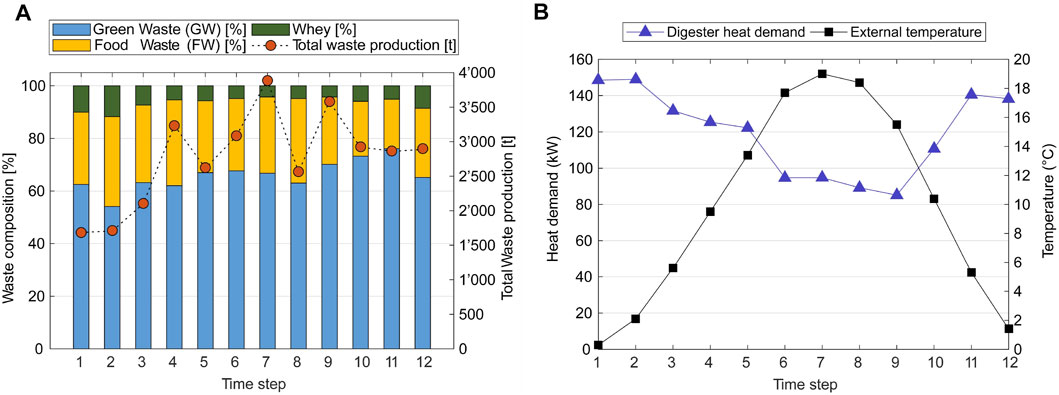
FIGURE 3. Seasonal effect on: (A) biowaste quantities and composition identified by total production and sub-biowaste type; (B) external temperature and digester heat demand.
Ms,t, TSs,t, VSs,t, BMPs,t and ks,t represent respectively the mass, total solids, volatile solids, bio-methane potential and the kinetic parameter of feedstock s in time-step t. trt represents the residence time per time-step t and CH4 fraction corresponds on average to 0.5344. All parameters have been reconciled by mean square error minimization using real data from 2019 (Supplementary Appendix Figure A10). The values are in line with those reported by Holliger et al. (2017) for the same treatment facility.
Biogas and CO2 Upgrade
Biogas can be used on a conventional boiler to co-generate heat and electricity or in separation units which are able to split its main components - CH4 and CO2 - for additional upgrading. Pressure Swing adsorption (PSA), monoethanolamine (MEA), Water scrubbing and polymeric dry membranes were considered according to their suitability for biogas upgrading, as discussed by Allegue and Hinge (2012) and Wien Institute of Chem (2012). These technologies were not the object of detailed flowsheet simulation, but properties described by Murphy et al. (2013), Kohl and Nielsen (1997), Huertas et al. (2011) and Urban (2009) were used and summarized accordingly. Production of SNG requires at least 96% CH4 fraction (Celebi et al., 2019), with the level of H2S below 5 ppm, to avoid corrosion and potential oxidation to sulfur dioxide, a highly environmentally impactful gas (Allegue and Hinge, 2012).
Different C1-chemicals can be obtained by promoting CO2-based upgrading routes:
• Formic acid: produced according to the process described in Jens et al. (2019) comprising the reaction of CO2 and H2 at 50°c and 94 bar, with subsequent by-products removed by distillation. A reactive distillation column at 200 mbar and 180°c produces formic acid with adequate market purity.
• Methane: The Sabatier reaction which combines CO2 and H2 as described in Suciu et al. (2019).
• Methanol: Adiabatic reactor as described in Rihko-Struckmann et al. (2010) working at 220°c and 50 bar, followed by a flash unit and a distillation column for methanol purification.
Digestate
The digestate, a carbon- and oxygen-rich sludge, is mainly composed of undigested volatile fractions and lignocellulosic components, and contains approximately 50% of the biowaste inlet energy. Four different conversion pathways are considered:
• Catalytic hydrothermal gasification (CHTG): the main steps involved are feedstock preparation (hydrolysis), salt separation, fixed bed catalytic reaction, water absorption tower and membrane upgrade. The modeling follows the description of Mian et al. (2015) and is adapted to digestate characteristics.
• Gasification: comprises air drying and optional torrefaction and pyrolysis which reduces the amount of heat needed for gasification. Circulated fluidized bed and entrained flow reactors with both indirect- and direct-heat were considered for the intermediate syngas production. The modeling approach described in Gassner and Maréchal (2012) and Celebi et al. (2019) was used. Depending on the gasifier technology, different compositions of syngas are to be expected; a gas processing step, comprising a water-gas shift reactor finely tunes the composition for downstream fuel generation coupled with CO2 separation units. Final specification is fuel dependent. Di-methyl ether (DME) should be produced with 99.88 vol%, at 25°c and 1 bar; Fischer-Tropsch (FT) fuel at 25°c and 1 bar; Methanol (MeOH) with 99.4 vol%, at 25°c and 1 bar, and substitute natural gas (SNG) at 96%, 25°c and 50 bar. Thermal profiles are described in Supplementary Appendix Table A8.
• Hydrothermal liquefaction (HTL): Liquefaction has a filtration preparation step to ensure a cake with 20 wt% solids followed by a reactor, which operates at 340°c and 220 bar. A three-phase separation stage originates biocrude, a CO2-rich gaseous stream and a solid residue (biochar) routed to thermal valorisation. The values and structure used are adapted from Castro-Amoedo et al. (2020) and Biller et al. (2018) to the digestate characteristics.
• Discard/Fertilizer: State-of-the-art digestate disposal comprising screening, mechanical water removal step and air drying, with a fraction thermo-valorized and the remaining disposed as fertilizer.
Utilities
The utilities section consists of additional technologies that allow closing the energy balance. The co-generation solid oxide fuel cell-gas turbine (SOFC-GT) is modeled according to Facchinetti et al. (2011) and Suciu et al. (2019) whereas the co-generation solid oxide electrolysis cell (SOEC) and the alkaline electrolyser (AEC) are adapted from Wang et al. (2018) and Suciu et al. (2019). Celebi et al. (2019) used a steam boiler fired by natural gas as a representative proxy of the European boiler family. The same consideration and modeling approach is taken in this work. Steam, produced in a Rankine cycle, is the industrial heat carrier per excellence due to good heat transfer properties, as well as preferable prices and high safety. The generation level is set at high pressure (50 bar) and distributed according to different pressure levels, chosen according to the temperature-enthalpy profiles. A superstructure approach as described in Wallerand et al. (2018), is used for heat pumps with pressure levels chosen to fit the temperature requirements of digester and district heating network. Neither the refrigeration fluid (ammonia) nor the pressure levels are subject to optimization.
2.9 Market Conditions
Distinct configurations are expected under different market conditions and economic assumptions. Resource prices, such as electricity, SNG and heat, have a seasonality trend which is particularly relevant for energy systems design. Figure 4 shows the monthly average resource prices obtained from industry and local providers for 2019 - used as the representative year - alongside the electricity grid carbon intensity for Switzerland, obtained using the tool described in Kantor and Santecchia (2019). The use of heating oil, heat pumps, electricity and natural gas contribute to the price of heat according to their share, retrieved from the Ecoinvent database (Wernet et al., 2016).
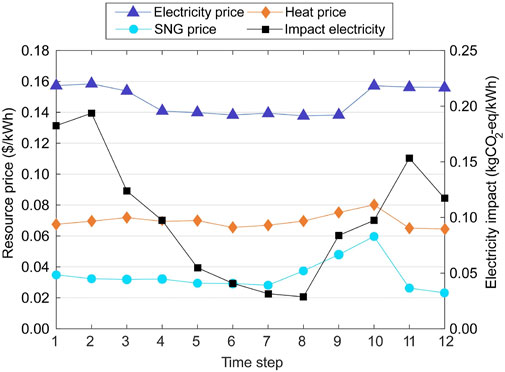
FIGURE 4. Seasonal effect on electricity, heat and SNG price and electricity environmental impact for the reference year 2019.
Motivated by growing electricity demand and renewable energy penetration, uncertainty associated with energy systems is considered to be on the high-level. Therefore a 50% variation on the seasonal trend is considered (Table 2). Prices for different fuels are the average between 2016 and 2019 (Comtrade Comtrade, 2021), and a medium-level uncertainty (30%) is considered. We further assume that Fischer-Tropsch fuels can replace diesel and therefore show a similar market cost, while biocrude, due to the need of a pre-processing step, replaces crude oil on a 50% basis. Kim et al. (2013) considered three levels of investment cost uncertainty linked with biomass-to-fuels technology maturity and complexity; the medium range value of 30% is here taken. The interest rate is employed to discount investment and assess project profitability, taking an average value of 0.08, which should reflect the risk and premium associated with investment. Due to a low level of maturity associated with some technologies, 50% variation is used.
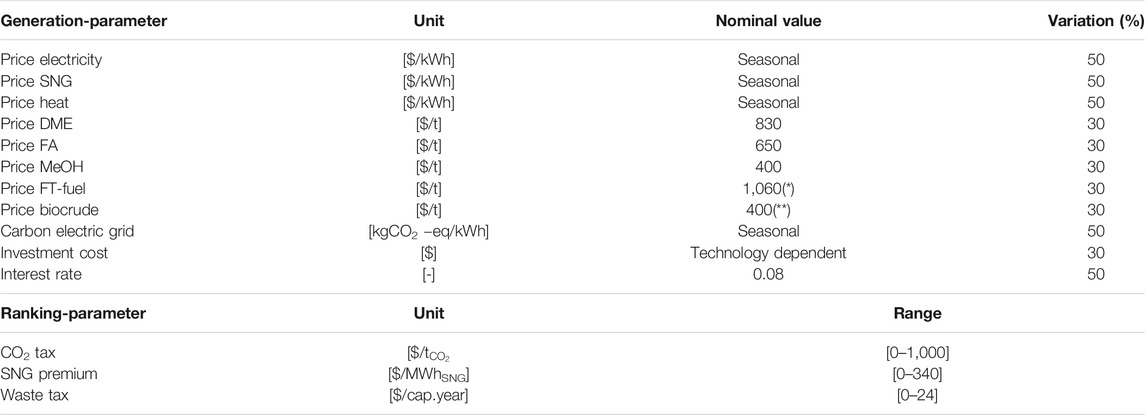
TABLE 2. Market considerations and parameter uncertainty range; * diesel price; ** half of crude oil price. Uniform distribution are assumed for all parameters.
The ranking and evaluation phase (Section 2.6) counts, in addition to all the parameters from the generation phase, with three additional taxation-based parameters: 1) a CO2 tax which allows to translate into monetary units a solution’s environmental impact; 2) a premium on SNG that is common practice in Europe to promote the upgrade of biogas to grid-level quality and 3) an additional waste tax, that could be used to help financing greener solutions. The values were chosen based upon the generation phase: for each solution and market condition the value of the three taxes were computed to break-even with the solution with the lowest total cost. The values are within acceptable market ranges and prospect policies.
3 Results and Discussion
The continuous generation of biowaste and the ongoing pressure on natural resources urges for flexible energy systems, whereas increasing complexity claims for comprehensive approaches. Our two-stage approach embraces the challenge and attempts to provide useful insight and quantitative decision support, leaving subjective duties to the user. An urban biowaste case-study validates the pertinence of the methodology. The MILP formulation comprises 74,650 variables (3,978 binary) and 47,873 constraints. The mipgap was set to 0.01% and the solving time is 23 min on a 8-Core Xeon 2.4 GHz processor with 16.0 Gb of RAM. The MILP is solved 1,000 (M = 1,000) times for different generation parameters (p = 11) combination.
3.1 Solutions Clustering and Solution Identification
The original solutions were sorted based on thirty-seven dimensions in the feature space, which correspond to the used MILP decision variables. Based upon the Silhouette and Elbow methods - Supplementary Appendix Figure A11 - 10 clusters are chosen to conveniently represent the set of 197 unique solutions. The optimization procedure, as described in our methodology, is used to generate a database of solutions built on different market assumptions, instead of relying on a fixed (and highly uncertain) set of market values. Solutions are characterized by their intrinsic aspects: energy flows (Figure 5A), technology activation (Figure 5B) and efficiencies (Figure 5C), rather than by performance indicators.
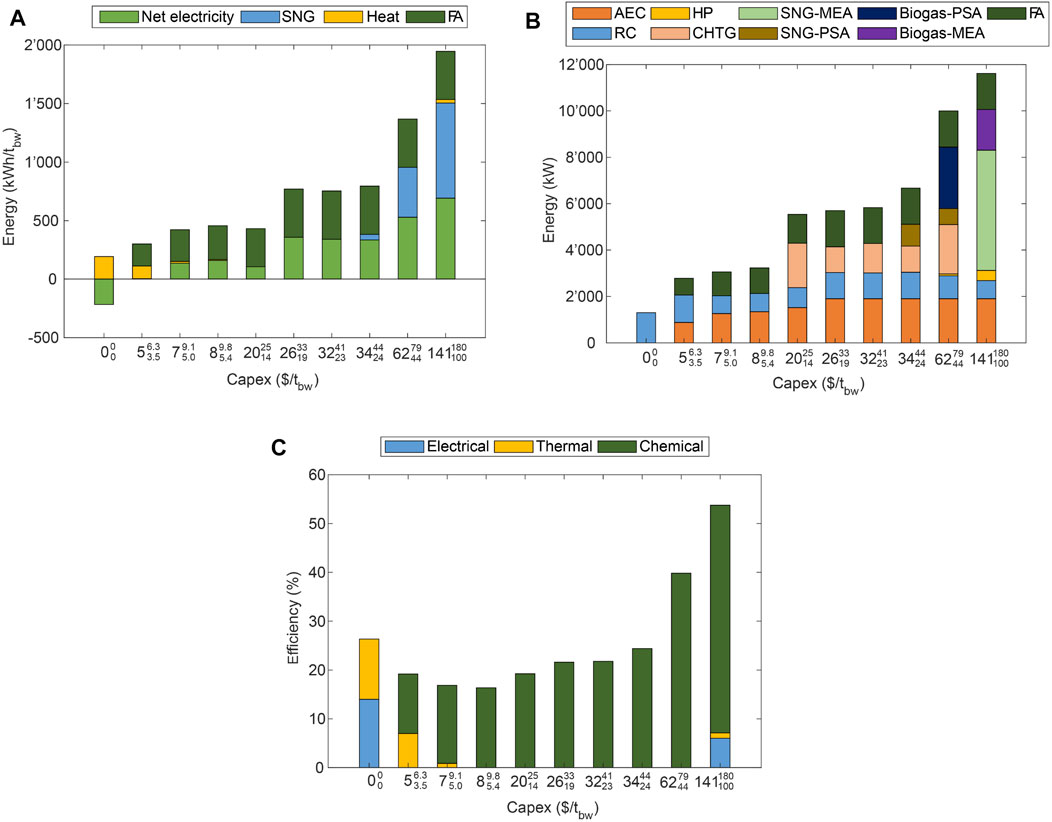
FIGURE 5. System configurations, highlighting (A) energy flows, (B) technology activation and (C) efficiencies as a function of Capex: central value represents the average, whereas sub- and superscript represent the 95% CI.
Investment foreshadows a shift from biogas as a fuel to its use as a chemical building block. Indeed, configurations with moderate investments rely on importing electricity - profiting from periods with low costs and excess supply - to maximize the production of formic acid. Higher investments also entail the co-production of SNG. This trend is further supported by an increasingly complex technology mix (b): formic acid production and electrolysis are the first investments, whereas for higher values, gasification technologies and biogas purification units are activated; the use of heat pumps is activated for the highest values of investment, which are simultaneously associated with the highest global efficiency. The shift toward fuel production is notorious for a wide range of investment, corroborated by a large chemical contribution to the global efficiency (c).
Figure 6 depicts the grand composite curve of two configurations: without investment (corresponding to the current scenario) and with the largest average one (141 $/tbw). In the former, biogas is used as a fuel to drive a Rankine cycle which supplies both the internal digester needs and a district heating system, whereas the use of gasification units coupled with heat pumps on the latter changes the heat integration configuration. The system is better integrated with low temperature heat supplied by heat pumps, biogas upgrade, and digestate headed toward gasification units, further enhancing heat recovery and integration, while simultaneously producing SNG.
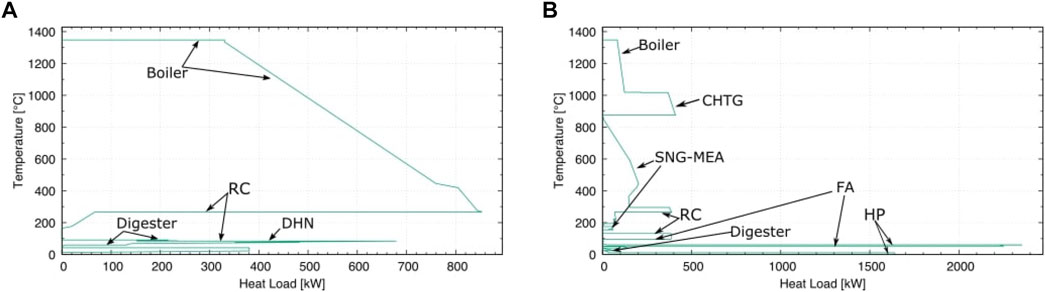
FIGURE 6. Grand composite curves (GCC) of (A) reference case (no investment) and (B) maximum average investment. GCC are a graphical representation of the heat cascade, showing the excess heat availability at each temperature interval. RC - Rankine cycle, HP - heat pumps, DHN - district heating network, FA - formic acid production.
Solutions are further evaluated by economic criteria which use the same parameters distribution (although not mandatory) of the generation stage, accrued by a tax on CO2 emissions, a premium on SNG, and a waste tax.
3.2 Market Conditions and Ranking
Market conditions are used for solution generation but are also part of performance indicator calculation. The use of different market conditions renders solutions more or less attractive, depending on the list of performance indicators and priorities. Figure 7 shows Opex, Tc and Impact as a function of Capex, resulting from a QMC simulation. Increasing investment entails on average, as expected, a reduction in operating cost; however, for the low range of investments (below 26 $/tbw), the environmental impact follows an increasing trend. This can be explained by a shift toward electricity import and a low quantity of added-value chemical production, which is nevertheless enough to justify a significant average decrease in total cost performance. Filled markers identify two relevant solutions for decision-makers and practitioners: the solution with average minimum total cost (blue, diamond) and the solution with average minimum environmental impact (green, square). The wide confidence interval range depicts overlapping situations in which other solutions might have lower total cost and environmental impact. A robust approach is thus warranted to rank and choose among solutions.
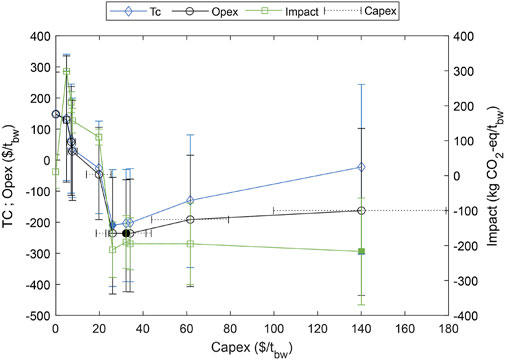
FIGURE 7. Pareto trade-off. Vertical lines represent the 95% confidence interval (CI) in total cost (Tc), operating cost (Opex) and environmental impact (impact). Horizontal dashed lines represent the 95% CI on capital expenditures (Capex). Filled markers portray solutions with the average lowest values. Trend lines are for visual support only.
The use of traditional Pareto trade-off analysis hinders the comparison between more than three KPIs, constraining the amount of information that can be obtained. Table 3 expands on the graphical information by including all the considered KPIs: the central position corresponds to the average value and the 95% confidence interval is represented by the sub- and superscript values; values are sorted by increasing Capex and negative values correspond to profit (or negative emissions) situations.
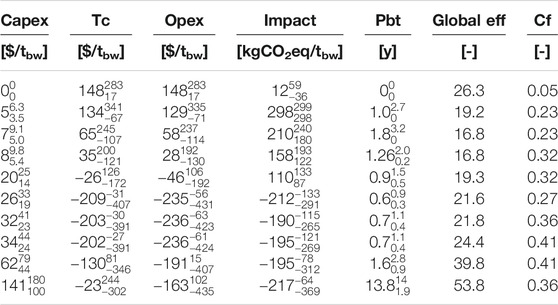
TABLE 3. Quasi Monte-Carlo simulation results (10,000) per solution and per KPI. The central value represents the mean; sub- and superscript account for the upper and lower range of the 95% CI.
The reference configuration, entailing zero investment, is the most penalizing design in average economic terms. Increasing investment, even as little as 5 $/tbw, promotes a 10% average reduction reduction in total cost, associated with the added-value of formic acid production. However, the impact substitution credit is not enough to either cover the burden associated with production or the electricity imports. Only for higher investments (greater than 26 $/tbw), and thus increased formic acid production, does the system convert itself into a net negative emission system; for these set of solutions not only environmental impact but also costs reach their average minimum. If we take a closer look, environmental impact is consistently negative above 26 $/tbw, which is a remarkable result: properly managed, urban biowaste constitutes a net CO2 sink, asserting its relevance in the prospective environmental policies. Solutions’ pay-back time (except the largest investment) does not surpass 3 years, which stands low compared with typical lifetime of engineering projects.
As a thermodynamic KPI, global efficiency only reaches higher than the reference value for the highest investments which are associated with SNG co-production and also with a greater number of units, which can be understood as a need for more process equipment, workers and safety measures. In all the intermediate investments, despite a more complex system, the shift toward value-added chemicals does not encompass a more efficient system.
Decision-making based on averages is commonplace in engineering applications. However, using averages forestalls deeper analyses and relations. The use of confidence intervals instead, protects against uncertainty to a much higher degree, which is paramount in energy systems. For example, depending on market conditions the reference solution can be either an environmental burden or a net emissions sink. Other solutions and KPIs show a similar dichotomy.
The use of a ranking system allows arguing then on a probabilistic base, conditioned to the set of market parameters (Table 4). Based upon the parameters distribution, each configuration is ranked according to the probability of belonging to the three best alternatives for the set of KPIs - which are ultimately a user-defined choice. Due to the absence of investment, the reference solution outperforms all the others in Capex, pay-back time and complexity factor, although statistically underperforming in other economic and environmental impact categories. On the other end of the spectrum, solutions with the highest investment perform statistically better on Impact, Opex, total cost, and global efficiency, albeit with an increased complexity degree.
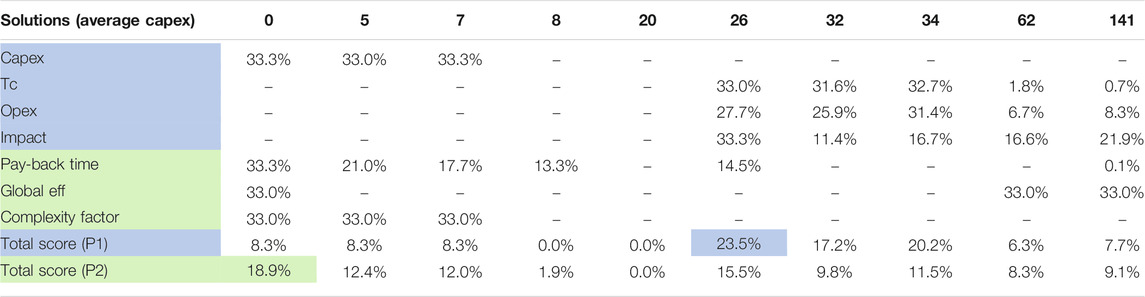
TABLE 4. Solutions probabilistic ranking (normalized) ranged by increasing capex and pertaining to two ranking systems: P1, containing only MILP objectives; P2 adding thermodynamic and configuration indicators. Highlighted scores achieve the highest global performance assuming uniform weights.
Some caveats on the interpretation are warranted: the number and type of KPIs, their weighting on the total score and the assumed parameters distribution, all of which play a significant role in ranking and evaluation. For instance, a different set of priorities is likely to radically change the decision: based only on mathematical objectives (ranking P1, blue), the solution with the average investment of 26 $/tbw outperforms in approximately one quarter of all market scenarios. The inclusion of other user indicators (P2), under the assumption of uniform weights, sharply decreases the interest of that design while promoting the reference one, which performs statistically better in 19% of the cases. The solution with an average investment of 20 $/tbw is never amid the top-three configurations in any KPI, which perfectly showcases the decouple of solution generation and ranking. Decision-maker intervention and subjective analysis is crucial for fine tuning and analysis.
The user has available a large set of parameters that are ultimately responsible for solution ranking and might serve as guidelines in policy-making. Figure 8 shows solutions (identified by their average investment) that achieve the lowest total cost for each market configuration. Only 1,000 points and four parameters are shown for the sake of clarity and simplicity. The right side underlines the role of the CO2 tax as the main driver in total cost. For values above 300
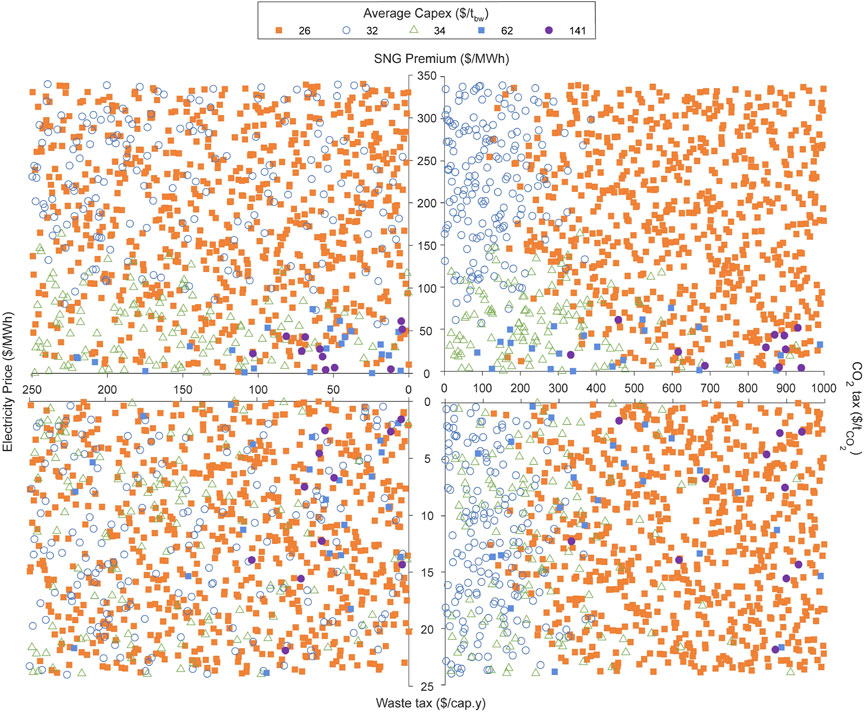
FIGURE 8. Solutions achieving the lowest total cost for different parameters combination. Symbols represent design configurations labeled according to their average capex ($/tbw).
4 Conclusion
Sustainable development goals comprise the gradual replacement of fossil fuels, progressive deployment of renewable energy and negative CO2 emissions. Biomass is able to address all of these dimensions, thus its critical role in the energy transition. In this work we propose a two-stage optimization approach for the design of robust energy systems, applied to an anaerobic digestion plant which is, according to Burg et al. (2019), the present and future dominant conversion technology for urban biowaste treatment in Switzerland.
The applied methodology addresses the challenge of biogas separation and upgrading, while dealing with complex and difficult to digest lignocellulosic fractions. Biogenic CO2 and surplus electricity periods promote fuel synthesis, contributing to close the gap between electricity supply and demand, and therefore improving the system resilience. We show that greater diversity, which is represented by activating different technologies, reduces costs, emissions and promotes efficiency. The use of heat pumps - activated on the high-range of investment - associated with heat integration strategies, greatly contributes for a far superior system with increased efficiency. Synergies are explored and translated into user-defined metrics, showcasing the added-benefit to the local energy ecosystem.
The main advantage of our approach lies in the use of different market conditions for solution generation and clustering, avoiding the bias toward configurations that marginally outperform under prevailing market conditions. Indeed, the uncertainty associated with existing energy systems asks for frameworks that allow a systematic analysis of market settings - enabling the emergence of sub-optimal designs. As performance indicators are not the driver for solution generation, but are rather used for ranking and evaluation, their number can be easily adapted to account for user preferences or multi-stakeholders positions. The robustness of the approach is highlighted in the use of an approach for design ranking and evaluation. Moderate investment solutions (between 26 and 34 $/tbw) are more robust, as they statistically achieve lower values of total cost and lower environmental impacts, by combining gasification units (dry and hydrothermal options) with biogas separation and CO2 upgrade to formic acid.
Policy-makers could also benefit from our approach. Feed-in tariffs, institutional incentives for substitute natural gas production, a CO2 tax or a consumer waste tax can be calculated from this work. The developed methodology is thus appropriate to handle exogenous uncertainty embedded in a multi-period framework, with systematic generation, evaluation and ranking of system configurations. With our approach, we believe and hope to contribute for an interdisciplinary effort to address the clean energy transition in which cutting-edge biomass-based models are paramount.
Data Availability Statement
The raw data supporting the conclusions of this article will be made available by the authors, without undue reservation.
Author Contributions
RC-A: conceptualization, methodology, modeling, results generation and analysis; data validation and visualisation; writing - original draft preparation and corrections. NM: modeling and data visualisation. JG: conceptualization, validation, writing-reviewing and editing. FM: supervision and conceptualization; writing-reviewing and editing.
Conflict of Interest
Author NM was employed by company Satom SA.
The remaining authors declare that the research was conducted in the absence of any commercial or financial relationships that could be construed as a potential conflict of interest.
Publisher’s Note
All claims expressed in this article are solely those of the authors and do not necessarily represent those of their affiliated organizations, or those of the publisher, the editors and the reviewers. Any product that may be evaluated in this article, or claim that may be made by its manufacturer, is not guaranteed or endorsed by the publisher.
Acknowledgments
The authors would like to acknowledge SATOM SA, especially Mr. Daniel Baillifard and Mr. Julian Dovat for the precious discussions on organic waste valorization and detailed technical information which contributed to the accuracy of this study. The authors financially acknowledge the European Union’s Horizon 2020 research and innovation programme under the Marie Sklodowska-Curie grant agreement No 754354 and No SEP-210500079, and the Swiss Competence Center for Energy Research SCCER-EIP.
Supplementary Material
The Supplementary Material for this article can be found online at: https://www.frontiersin.org/articles/10.3389/fenrg.2021.718310/full#supplementary-material
Footnotes
1excludes biomass used for cooking and heating in inefficient stoves.
2Director of SATOM SA.
3Responsible of the organic waste valorization in SATOM SA.
References
Allegue, L. B., and Hinge, J. (2012). Biogas and Bio-Syngas Upgrading. Danish Technological Institute. Tech. Rep. Dec.
“AMPL” (2013). Encyclopedia of Operations Research and Management Science. Editor I. Saul, and C. F. Gass and Michael Boston, MA: Springer US, 52. doi:10.1007/978-1-4419-1153-7283
Al-Malah, K. I. (2016). Introducing aspen plus in Aspen PlusⓇ (Hoboken, NJ: John Wiley & Sons, Inc), 1–47.
Belsim (2018). Software – Belsim Vali v4. Available at: https://belsim.com/2021.
Biller, P., Johannsen, I., dos Passos, J. S., and Ottosen, L. D. M. (2018). Primary Sewage Sludge Filtration Using Biomass Filter Aids and Subsequent Hydrothermal Co-liquefaction. Water Res. 130, 58–68. doi:10.1016/j.watres.2017.11.048
Burg, V., Bowman, G., Hellweg, S., and Thees, O. (2019). Long-Term Wet Bioenergy Resources in Switzerland: Drivers and Projections until 2050. Energies. 12, 3585. doi:10.3390/en12183585
Candra, D., Hartmann, K., and Nelles, M. (2018). Economic Optimal Implementation of Virtual Power Plants in the German Power Market. Energies. 11, 2365. doi:10.3390/en11092365
Castro-Amoedo, R. (2019). “Wastewater Management towards a Sustainable futureDairy Production: A Study Case”. en. In Proceedings of the 32nd International Conference on Efficiency, Cost, Optimization, Simulation and Environmental Impact of Energy Systems - ECOS 2019. CONF. Wroclaw, PolandInstitute of Thermal Technology, Silesian University of Technology, 565.
Castro-Amoedo, R., Damartzis, T., Granacher, J., and Maréchal, F. (2020). System Design and Performance Evaluation of Wastewater Treatment Plants Coupled with Hydrothermal Liquefaction and Gasification. Front. Energ. Res. 8, 2296–598X. doi:10.3389/fenrg.2020.568465
Celebi, A. D., Sharma, S., Ensinas, A. V., and Maréchal, F. (2019). Next Generation Cogeneration System for Industry - Combined Heat and Fuel Plant Using Biomass Resources. Chem. Eng. Sci. 204, 59–75. doi:10.1016/j.ces.2019.04.018
Cheng, S. Y., Tan, X., Show, P. L., Rambabu, K., Banat, F., Veeramuthu, A., et al. Incorporating Biowaste into Circular Bioeconomy: A Critical Review of Current Trend and Scaling up Feasibility. In: Environ. Technology Innovation 19 (2020), p. 101034. doi:10.1016/j.eti.2020.101034
Comtrade Comtrade (2021). UN Comtrade: International Trade Statistics. Available at: https://comtrade.un.org/data/. 2021.
Damartzis, T., and Zabaniotou, A. (2011). Thermochemical Conversion of Biomass to Second Generation Biofuels through Integrated Process Design-A Review. Renew. Sustainable Energ. Rev. 15 (1), 366–378. doi:10.1016/j.rser.2010.08.003
Davies, D. L., and Bouldin, D. W. (1979). A Cluster Separation Measure. IEEE Trans. Pattern Anal. Mach. Intell. PAMI-1, 224–227. doi:10.1109/TPAMI.1979.4766909
Facchinetti, E., Favrat, D., and Marechal, F. (2011). Innovative Hybrid Cycle Solid Oxide Fuel Cell-Inverted Gas Turbine With CO2 Separation. Fuel Cells. 11 (4), 565–572. doi:10.1002/fuce.201000130
Gassner, M., and Maréchal, F. (2012). Thermo-Economic Optimisation of the Polygeneration of Synthetic Natural Gas (SNG), Power and Heat from Lignocellulosic Biomass by Gasification and Methanation. Energy Environ. Sci. 5 (2), 5768–5789. doi:10.1039/C1EE02867G
Gassner, M., Vogel, F., Heyen, G., and Maréchal, F. (2011). Optimal Process Design for the Polygeneration of SNG, Power and Heat by Hydrothermal Gasification of Waste Biomass: Process Optimisation for Selected Substrates. Energ. Environ. Sci. 4 (5), 1742–1758. doi:10.1039/C0EE00634C
Granacher, J. (2019). “Potential of Hydrothermal Black Liquor Gasification Integrated in Pulp Production Plant”. en. In Proceedings of ECOS 2019. CONF. Wroc0142aw, PolandSilesian University of Technology, 2299.
Henchoz, S., Weber, C., Maréchal, F., and Favrat, D. (2015). Performance and Profitability Perspectives of a CO2 Based District Energy Network in Geneva's City Centre. Energy. 85, 221–235. doi:10.1016/j.energy.2015.03.079
Holliger, C., Fruteau de Laclos, H., and Hack, G. (2017). “Methane Production of Full-Scale Anaerobic Digestion Plants Calculated From Substrate’s Biomethane Potentials Compares Well with the One Measured On-Site”. English. Front. Energ. Res. 5, 2296–598X. doi:10.3389/fenrg.2017.00012
Hou, T., Nuyens, D., Roels, S., and Janssen, H. (2019). Quasi-Monte Carlo Based Uncertainty Analysis: Sampling Efficiency and Error Estimation in Engineering Applications. Reliability Eng. Syst. Saf. 191, 106549. doi:10.1016/j.ress.2019.106549
Huertas, J. I., Giraldo, N., and Izquierdo, S. (2011). ““Removal of H2S and CO2 from Biogas by Amine Absorption”. en,” in Mass Transfer in Chemical Engineering Processes (Rijeka, Croatia: InTech).
IBM ILOG Cplex (2009). “V12. 1: User’s Manual for CPLEX”. Int. Business Machines Corporation. 46 (53), 157.
IRENA (2016). Global Renewables Outlook: Energy Transformation 2050. Available at: www.irena.org/publications/2020/Apr/Global-Renewables-Outlook-2020.
Jens, C. M., Scott, M., Liebergesell, B., Westhues, C. G., Schäfer, P., Franciò, G., et al. (2019). Rh-Catalyzed Hydrogenation of CO2 to Formic Acid in DMSO-Based Reaction Media: Solved and Unsolved Challenges for Process Development. Adv. Synth. Catal. 361 (2), 307–316. doi:10.1002/adsc.201801098
Jørgen, H., and Laura Bailon, Al. (2014). Biogas Upgrading Evaluation of Methods for H2S Removal. Danish Technological Institute. en. Tech. Rep. Danish Technol. Inst. , 31.
Kantor, I., and Santecchia, A. (2019). Ecological Risk Assessment. en. Tech. Rep. 1669, 27–51. doi:10.1002/9781119483342.ch4
Kim, J., Sen, S. M., and Maravelias, C. T. (2013). An Optimization-Based Assessment Framework for Biomass-To-Fuel Conversion Strategies. Energ. Environ. Sci. 6 (4), 1093–1104. doi:10.1039/C3EE24243A
Korberg, A. D., Mathiesen, B. V., Clausen, L. R., and Skov, I. R. (2021). The Role of Biomass Gasification in Low-Carbon Energy and Transport Systems. Smart Energy. 1, 1000062666–1000069552. doi:10.1016/j.segy.2021.100006
Linnhoff, B., and Hindmarsh, E. (1983). The Pinch Design Method for Heat Exchanger Networks. Chem. Eng. Sci. 38 (5), 745–763. doi:10.1016/0009-2509(83)80185-7
Magagula, S., Han, J., Liu, X., and Sempuga, B. C. (2021). Targeting Efficient Biomass Gasification. Chin. J. Chem. Eng. 33, 268–278. doi:10.1016/j.cjche.2020.11.027
Maréchal, F., and Kalitventzeff, B. (1997). Identification of the Optimal Pressure Levels in Steam Networks Using Integrated Combined Heat and Power Method. Chem. Eng. Sci. 52 (17), 2977–2989. doi:10.1016/S0009-2509(97)00102-4
Maréchal, F., and Kalitventzeff, B. (1998a). Process Integration: Selection of the Optimal Utility System. Comput. Chem. Eng. 22, S149–S156. doi:10.1016/s0098-1354(98)00049-0
Maréchal, F., and Kalitventzeff, B. (1998b). Energy Integration of Industrial Sites: Tools, Methodology and Application. Appl. Therm. Eng. 18 (Nov), 921–933. doi:10.1016/S1359-4311(98)00018-0
Maronese, S., Ensinas, A. V., Mian, A., Lazzaretto, A., and Maréchal, F. (2015). Optimum Biorefinery Pathways Selection Using the Integer-Cuts Constraint Method Applied to a MILP Problem. Ind. Eng. Chem. Res. 54 (28), 7038–7046. doi:10.1021/acs.iecr.5b01439
Mian, A., Ensinas, A. V., and Marechal, F. (2015). Multi-objective Optimization of SNG Production from Microalgae Through Hydrothermal Gasification. Comput. Chem. Eng. 76, 170–183. doi:10.1016/j.compchemeng.2015.01.013
Moret, S., Codina Gironès, V., Bierlaire, M., and Maréchal, F. (2017). Characterization of Input Uncertainties in Strategic Energy Planning Models. Appl. Energ. 202, 597–617. doi:10.1016/j.apenergy.2017.05.106
Murphy, J., and Baxter, D. (2013). The Biogas Handbook: Science, Production and Applications. Woodhead Publishing Series in Energy Number 52. Editor A. Wellinger(Oxford: Woodhead Publishing).
Muscat, A., de Olde, E. M., de Boer, I. J. M., and Ripoll-Bosch, R. (2020). The Battle for Biomass: A Systematic Review of Food-Feed-Fuel Competition. Glob. Food Security. 25, 100330. doi:10.1016/j.gfs.2019.100330
Nestor, A. (2021). Sepulveda et al. “The Design Space for Long-Duration Energy Storage in Decarbonized Power Systems”. Nat. Energ. 6, 506–516. doi:10.1038/s41560-021-00796-8
Nkoa, R. (2014). Agricultural Benefits and Environmental Risks of Soil Fertilization with Anaerobic Digestates: a Review. Agron. Sustain. Dev. 34, 473–492. doi:10.1007/s13593-013-0196-z
Rihko-Struckmann, L. K., Peschel, A., Hanke-Rauschenbach, R., and Sundmacher, K. (2010). Assessment of Methanol Synthesis Utilizing Exhaust CO2for Chemical Storage of Electrical Energy. Ind. Eng. Chem. Res. 49 (21), 11073–11078. doi:10.1021/ie100508w
Rousseeuw, P. J. (1987). Silhouettes: A Graphical Aid to the Interpretation and Validation of Cluster Analysis. J. Comput. Appl. Mathematics. 20, 53–65. doi:10.1016/0377-0427(87)90125-7
Rubio-Maya, C., Uche-Marcuello, J., Martínez-Gracia, A., and Bayod-Rújula, A. A. (2011). Design Optimization of a Polygeneration Plant Fuelled by Natural Gas and Renewable Energy Sources. Appl. Energ. 88, 449–457. doi:10.1016/j.apenergy.2010.07.009
Santibañez-Aguilar, J. E., Ponce-Ortega, J. M., Betzabe González-Campos, J., Serna-González, M., and El-Halwagi, M. M. (2013). Optimal Planning for the Sustainable Utilization of Municipal Solid Waste. Waste Management 33, 2607–2622. doi:10.1016/j.wasman.2013.08.010
Schmidt, O., Gambhir, A., Staffell, I., Hawkes, A., Nelson, J., and Few, S. (2017). Future Cost and Performance of Water Electrolysis: An Expert Elicitation Study. Int. J. Hydrogen Energ. 42 (52), 30470–30492. doi:10.1016/j.ijhydene.2017.10.045
Schnorf, V., Trutnevyte, E., Bowman, G., and Burg, V. (2021). Biomass Transport for Energy: Cost, Energy and CO2 Performance of forest wood and Manure Transport Chains in Switzerland. J. Clean. Prod. 293, 125971. doi:10.1016/j.jclepro.2021.125971
Segurado, R., Pereira, S., Correia, D., and Costa, M. (2019). Techno-economic Analysis of a Trigeneration System Based on Biomass Gasification. Renew. Sustainable Energ. Rev. 103, 501–514. doi:10.1016/j.rser.2019.01.008
Sikarwar, V. S., Zhao, M., Clough, P., Yao, J., Zhong, X., Memon, M. Z., et al. (2016). An Overview of Advances in Biomass Gasification. Energ. Environ. Sci. 9, 2939–2977. doi:10.1039/C6EE00935B
Snowden-Swan, L. J., Zhu, Y., Jones, S. B., Elliott, D. C., Schmidt, A. J., Hallen, R. T., et al. (2016). Hydrothermal Liquefaction and Upgrading of Municipal Wastewater Treatment Plant Sludge: A Preliminary Techno-Economic Analysis. en. Tech. Rep. Pnnl-25464, 1258731. doi:10.2172/1258731
Steubing, B., Zah, R., Waeger, P., and Ludwig, C. (2010). Bioenergy in Switzerland: Assessing the Domestic Sustainable Biomass Potential. Renew. Sustainable Energ. Rev. 14, 2256–2265. doi:10.1016/j.rser.2010.03.036
Suciu, R., Stadler, P., Kantor, I., Girardin, L., and Maréchal, F. (2019). Systematic Integration of Energy-Optimal Buildings With District Networks. Energies. 12, 2945. doi:10.3390/en12152945
Tock, L., Gassner, M., and Maréchal, F. (2010). Thermochemical Production of Liquid Fuels from Biomass: Thermo-Economic Modeling, Process Design and Process Integration Analysis. Biomass and Bioenergy 34 (12), 1838–1854. doi:10.1016/j.biombioe.2010.07.018
Tock, L., and Maréchal, F. (2015). Decision Support for Ranking Pareto Optimal Process Designs under Uncertain Market Conditions. Comput. Chem. Eng. 83, 165–175. doi:10.1016/j.compchemeng.2015.06.009
TU Wien Institute of Chemical engineering (2012). Biogas to Biomethane: Technology Review. Eng. Tech. Rep.
Turton, R. (2018). Analysis, Synthesis and Design of Chemical Processes. en. 5th edition. Boston, MA: Prentice-Hall.
Urban, W. (2009). Technologien und Kosten der Biogasaufbereitung und Einspeisung in das Erdgasnetz : Ergebnisse der Markterhebung 2007-2008. German: Results of Market Survey 2007-2008. Fraunhofer UMSICHT, 123.
Wallerand, A. S., Kermani, M., Kantor, I., and Maréchal, F. (2018). Optimal Heat Pump Integration in Industrial Processes. Appl. Energ. 219, 68–92. doi:10.1016/j.apenergy.2018.02.114
Wang, L., Pérez-Fortes, M., Madi, H., Diethelm, S., herle, J. V., and Maréchal, F. (2018). Optimal Design of Solid-Oxide Electrolyzer Based Power-To-Methane Systems: A Comprehensive Comparison between Steam Electrolysis and Co-electrolysis. Appl. Energ. 211, 1060–1079. doi:10.1016/j.apenergy.2017.11.050
Wernet, G., Bauer, C., Steubing, B., Reinhard, J., Moreno-Ruiz, E., and Weidema, B. (2016). The Ecoinvent Database Version 3 (Part I): Overview and Methodology. Int. J. Life Cycle Assess. 21 (9), 1218–1230. doi:10.1007/s11367-016-1087-8
Zhu, Y., Biddy, M. J., Jones, S. B., Elliott, D. C., and Schmidt, A. J. (2014). Techno-Economic Analysis of Liquid Fuel Production From Woody Biomass via Hydrothermal Liquefaction (HTL) and Upgrading. Appl. Energ. 129, 384–394. doi:10.1016/j.apenergy.2014.03.053
Nomenclature
u ∈ U Units U = {Gasification, CHTG,HTL,PSA, MEA, … } Utility Units UU = U \PU
u ∈ PU Process Units PU = {urbanbiowaste generation}
u ∈ U Units U = {Gasification, CHTG,HTL,PSA, MEA, … } Utility Units UU = U \PU
i ∈ SU Supply Units SU = {Gasification, CHTG,HTL,PSA, MEA, … }
j ∈ CU Consuming Units CU = {Gasification, CHTG,HTL,PSA, MEA, … }
r ∈ R Resources R = {electricity, cooling water,SNG,biocrude,FA, … }
k ∈ K Temperature intervals K = {1 … nk}
t ∈ T Time steps T = {1 … tt}
fu/fu,t Sizing factor of unit u/in time step t [-]
yu/yu,t Binary variable to use or not unit u/in time step t [-]
gi,j Binary variable connecting producing unit i to consuming unit j [-]
n/i Investment lifetime/Investment interest rate [years]/[-]
bw biowaste
SNG substitute Natural gas
FA formic acid
DME di-methyl ether
MeOH methanol
FT fischer-Tropsch fuel
WW wastewater
AEC alkaline Electrolysis cell
FW food waste
GW green waste
Opex operational expenditures
Capex capital expenditures
Tc total cost
Cf complexity factor
Pbt pay-back time
KPI key performance indicator
QMC quasi Monte-Carlo
MEA monoethanolamine
PSA pressure swing adsorption
HTL hydrothermal liquefaction
CHTG catalytic hydrothermal gasification
DHN district heating network
RC rankine cycle
HP heat pump(s)
Keywords: multi criteria decision analysis, energy system design, biomass, decision-making, uncertainty analysis, robust design, decision support, environmental policy
Citation: Castro-Amoedo R, Morisod N, Granacher J and Maréchal F (2021) The Role of Biowaste: A Multi-Objective Optimization Platform for Combined Heat, Power and Fuel. Front. Energy Res. 9:718310. doi: 10.3389/fenrg.2021.718310
Received: 31 May 2021; Accepted: 20 July 2021;
Published: 01 September 2021.
Edited by:
Ana Somoza-Tornos, University of Colorado Boulder, United StatesCopyright © 2021 Castro-Amoedo, Morisod, Granacher and Maréchal. This is an open-access article distributed under the terms of the Creative Commons Attribution License (CC BY). The use, distribution or reproduction in other forums is permitted, provided the original author(s) and the copyright owner(s) are credited and that the original publication in this journal is cited, in accordance with accepted academic practice. No use, distribution or reproduction is permitted which does not comply with these terms.
*Correspondence: Rafael Castro-Amoedo, rafael.amoedo@epfl.ch