Techno-Economic Analysis of a Flexible Process Concept for the Production of Transport Fuels and Heat from Biomass and Renewable Electricity
 Felix Habermeyer
 Esa Kurkela2
  Simon Maier
 Ralph-Uwe Dietrich
- 1DLR e.V., Institute of Engineering Thermodynamics, Stuttgart, Germany
- 2VTT Technical Research Centre of Finland Ltd., Teknologian Tutkimuskeskus VTT Oy, Espoo, Finland
Different processes have been proposed to meet the global need for renewable fuel. The Biomass to Liquid process (BtL) converts biomass via the Fischer-Tropsch route to hydrocarbon chains that can be refined to transport fuel. With the addition of electrolytic hydrogen to the Power and Biomass to Liquid process (PBtL), the carbon efficiency can be increased relative to the BtL process. It was shown in previous studies that the PBtL concept has an economic edge over BtL when cheap electricity is available to maximize the fuel yield. In this study, a techno-economic analysis is conducted for a hybrid process concept which can switch operation modes from electrolysis enhanced to only biomass conversion. In case studies the effect of the Fischer-Tropsch conversion, H2/CO ratio of the Fischer-Tropsch feed and the biomass feed rate in the electrolysis enhanced mode are analyzed. Every process configuration is modeled based on experimentally validated unit models from literature in the commercial software Aspen Plus and analyzed using DLR’s software tool TEPET. For a 200 MWth biomass input plant, production costs of 1.08 €2019/L for the hybrid concept with a carbon efficiency of 53.3% compared to 0.66 €2019/L for BtL with 35.4% and 1 €2019/L for PBtL with 61.1% were found based on the Finnish day-ahead market for the base case. The net production cost for the hybrid concept can be decreased by 0.07 €2019/L when a Fischer-Tropsch H2/CO ratio of 1.6 instead of 2.05 is used.
Introduction
With the European Green Deal, the European Union (EU) aspires to become carbon neutral by 2050. To that end, the share of renewable fluctuating electricity production is aimed to be ramped up from 32% today to 65% by 2030 (European Commission, 2020). This poses a challenge to the existing energy system, as short-term and seasonal mismatches of energy supply and demand have to be addressed. Various energy scenarios show that only a combination of measures, involving energy storage and flexible demand, enable an efficient energy transition (Mathiesen et al., 2015; Papaefthymiou and Dragoon, 2016; Blanco and Faaij, 2018; Kotzur et al., 2018).
The increasing share of renewables on the energy market has displaced already installed infrastructure. Especially, in Northern Europe the combined heat and power (CHP) plant infrastructure is under financial pressure competing on the power market (Helin et al., 2018). As a result, district heating is prioritized over the combined heat and electricity production. Thus, a solution for the continued operation of biomass fired CHP plants is needed to avoid idling existing infrastructure.
At the same time, the EU aims to reduce the carbon emissions from the transport sector. Here, the electrification of light-duty vehicles is only one step. Heavy-duty transportation, especially aviation and shipping, will continue to rely on liquid fuels for their higher energy density. Therefore, the European commission states that the technology development and deployment for renewable, low-carbon fuels has to be achieved by 2030 (European Commission, 2020).
The process concept proposed in the EU-project FLEXCHX offers a solution for the three fields of the energy transition: The fuel process converts biomass to liquid hydrocarbons via the Fischer-Tropsch (FT) route. Whenever cheap renewable electricity is available from the grid, an electrolysis unit is operated to enhance the fuel yield. In an adjacent CHP plant the process off-heat is used to generate district heating and electrical power (Kurkela et al., 2020). The two operation modes are shown in Figure 1.
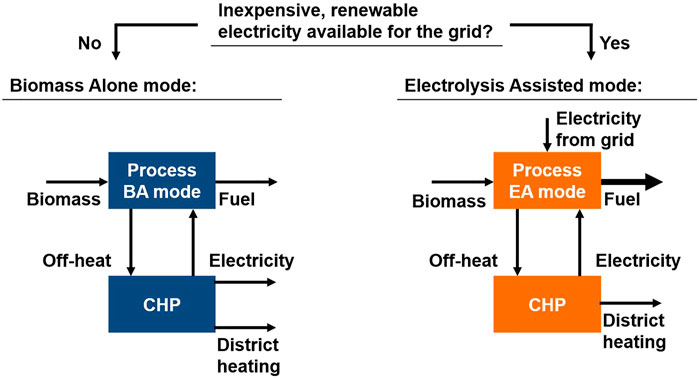
FIGURE 1. Operation modes for the hybrid process concept.
The conversion of biomass to liquid fuels has been widely discussed in literature under the acronym BtL. The term includes all conversion routes, i.e. methanol, ethanol or DME (Olofsson et al., 2005). Yet, here it is only used to refer to the FT route. In a review of 15 different techno-economic BtL studies, Haarlemmer et al. found the realistic production cost range to be 1–.4 €2011/L for a 400 MWth biomass input plant (Haarlemmer et al., 2012). The BtL process is continuously approaching a higher technological maturity. Successful demo plants (Ail and Dasappa, 2016) are waiting for market entry, until sustainable fuels get promoted for commercial implementation.
Processes with the addition of electrolytic hydrogen to a BtL plant are referred to as power biomass to liquid (PBtL) (Albrecht et al., 2017). Hillestad et al. show that production costs for a PBtL process can be lower compared to a BtL plant of the same biomass input of 435 MWth, if electricity is available for less than 100 $2018/MWh (Hillestad et al., 2018). A similar result was found by Albrecht et al. (Albrecht et al., 2017). Here, the PBtL concept has lower production costs at electricity prices below 70 €2018/MWh when comparing two plants with the product capacity of 240 kt/year. Further, both studies point out that the carbon efficiency for the PBtL is significantly higher than for BtL. Therefore, a smaller amount of the finite biomass feedstock has to be consumed per amount of fuel. Hannula and Reiner argue that not only biomass supply will be a limiting factor but also the availability of renewable power (Hannula and Reiner, 2019). Thus, PBtL might offer a middle way between feeding only biomass with BtL or relying solely on electrical energy with process concepts such as carbon capture and utilization (CCU).
Process concepts with flexible electricity sourcing have also gained attention in literature. Müller et al. show that it is experimentally possible to integrate H2 from a wind park profile into an FT-BtL process (Müller et al., 2018). To attain a constant H2/CO ratio at the FT input, the gasification train is continuously controlled responding to the electrolyzer H2 profile. Sigurjonsson and Clausen analyze a system that switches operation modes. Here, a system composed of a gasifier, an SOEC/SOFC unit and a methane reactor is simulated (Sigurjonsson and Clausen, 2018). Depending on the electricity price, the process is either used to produce synthetic natural gas (SNG) or electricity and heat. A techno-economic analysis shows that the hybrid system can be operated more economically than a stand-alone SNG plant, especially if electricity prices are highly volatile. For the same system Butera et al. show an energy efficiency of 70.5% in the SNG mode and 37.5% in the electricity mode (Butera et al., 2020).
Hybrid processes have higher investment costs than steady-state processes because part of the equipment is inactive or only used in part-load. The advantage of a hybrid system lies in the lower operation costs. The PBtL concept can produce fuel at lower cost and with lower biomass consumption compared to BtL, if inexpensive electricity is available (Albrecht et al., 2017; Hillestad et al., 2018). In a market with fluctuating energy prices, a cost advantage for the hybrid system can be gained by avoiding high electricity prices with the temporary shut-down of the electrolyzer. To understand the trade-off between higher investment and lower operation costs, this study estimates the conversion efficiency and production cost for the presented hybrid process concept in comparison to the BtL and the PBtL concept. The evaluation is based on the electricity price profile on the Finnish day-ahead market for the reference year 2019. Further, the techno-economic impact of key process parameters, H2/CO ratio at the FT inlet, FT reactant conversion and biomass feed rate in the electrolysis assisted mode, are studied. To evaluate a broader set of energy market conditions, a sensitivity analysis over the electricity price and the share of operation hours in each mode is conducted.
Process Concept
The concept studied here describes a process operated in two modes: In the biomass alone mode (BA), biomass is converted to fuel via the FT synthesis. In the electrolysis assisted mode (EA), hydrogen is produced by a grid-connected electrolyzer, which is used to enhance the fuel output of the process. For both modes, off-heat is converted to electricity and district heating in a CHP plant. A schematic flow diagram of the two operation modes is depicted in Figure 2. The operation concept is based on the EU project FLEXCHX (Kurkela et al., 2020).
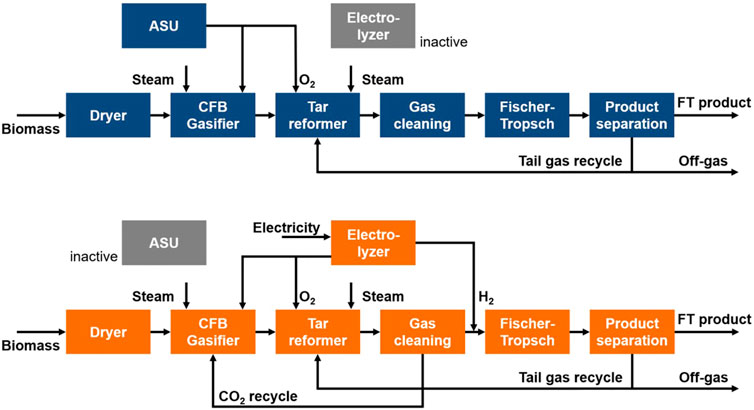
FIGURE 2. Schematic flow diagram for the biomass alone operation mode (BA) (top) and electrolysis assisted mode (EA) (bottom).
Biomass Alone Operation Mode
The biomass alone mode is depicted in a schematic flow diagram in Figure 2. In a first step, the biomass moisture content is reduced in the dryer. With the addition of oxygen and steam, the dry biomass is then converted to raw syngas in a circulating fluidized bed (CFB) gasifier. Besides hydrogen and carbon monoxide the syngas also contains carbon dioxide, steam, tars, ash and other trace components like ammonia or hydrogen sulfide. Components poisoning the FT catalyst have to be removed. The auto-thermal tar reformer reduces the tar content while simultaneously increasing the H2/CO ratio of the syngas. Oxygen for gasifier and reformer is produced in a cryogenic air separation unit (ASU).
In the gas cleaning section water, CO2 and trace components are removed from the syngas. The clean syngas then reacts over the FT catalyst to hydrocarbon chains. Here, hydrocarbon chains with a chain length higher than five are considered product and are separated from the shorter hydrocarbons. Further upgrading steps such as cracking of longer chains is not considered in this study. The separated tail gas consisting of short hydrocarbons and unconverted syngas is partly recycled to the reformer. The remaining tail gas leaves the process and is burned. The energy content of the off-gas is used in the CHP.
Electrolysis Assisted Operation Mode
In contrast to the BA mode, the electrolysis assisted mode features a CO2 recycle. As can be seen in Figure 2, CO2 from the gas cleaning section is reintroduced into the gasifier. This leads to a higher carbon efficiency. However, it also lowers the H2/CO ratio in the FT feed. To reach the stoichiometric H2/CO ratio of ∼2, hydrogen from an electrolyzer is added. In addition, the oxygen produced in the electrolyzer can be used in gasifier and reformer.
Overall, the EA mode requires less biomass feedstock to produce an equal amount of FT product compared to the BA mode. Yet, the higher biomass conversion has to be weight against the additional cost for the electrolysis power demand.
Process Flowsheet
The flowsheet for the FLEXCHX process concept is depicted in Figure 3. It contains the equipment for BA and EA mode. In addition, equipment types selected for this study are highlighted.
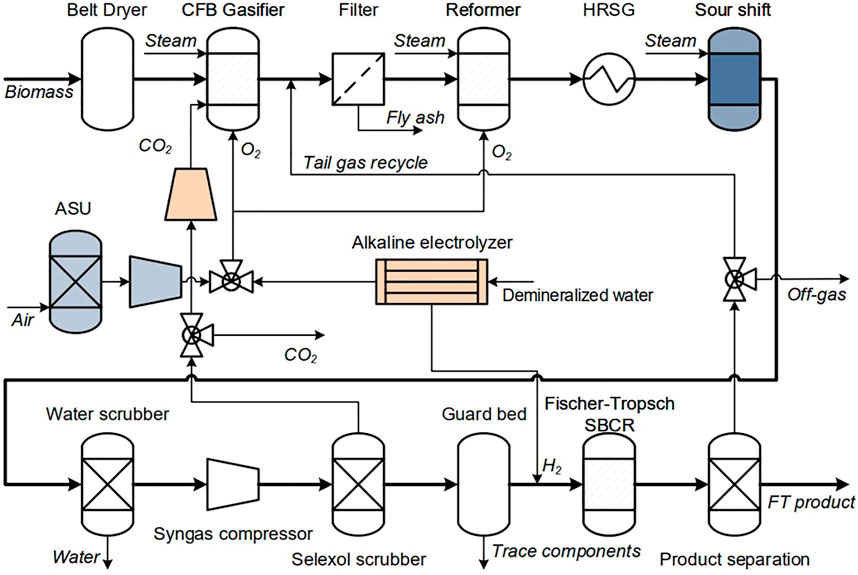
FIGURE 3. Process flowsheet–blue signifies equipment only operated during BA mode, orange during EA mode.
A CFB gasifier is used to convert the dried biomass into syngas. This gasifier type is suitable for the FLEXHCX operation strategy because of its high load flexibility. Warnecke reports an operation rage of 50%–120% relative to standard load for a CFB gasifier (Warnecke, 2000). Moreover, CFB gasifiers feature a high carbon efficiency (Warnecke, 2000; Molino et al., 2016). The steam/oxygen gasification is selected here for its higher carbon efficiency compared to steam gasification (Hannula, 2016). Fly ash produced in the gasifier is removed from the syngas in a hot gas filtration unit. The gasification pressure of 4 bar and temperature of 900°C are selected based on experimental results (Kurkela et al., 2014), which show that under these conditions high carbon efficiency is achieved and the calcium-based bed material catalyzes initial tar decomposition and helps to avoid filter blinding by soot and heavy tars.
The catalytic tar reformer not only lowers the tar content but also the hydrocarbon gas content produced in gasifier and FT reactor. With the addition of oxygen, both component types undergo an autothermal reformation reaction (Shen and Yoshikawa, 2013). An alternative technology to tar reforming is organic solvent scrubbing. With it, only tar components are removed from the syngas. It can therefore be argued that for fuel processes the catalytic tar reformation is a more suitable technology due to the significantly higher yields of CO and H2 attained by the hydrocarbon gas reformation (Hannula, 2016; Kurkela et al., 2020).
A cryogenic ASU is used for the oxygen production for gasifier and reformer. This production method is reported to be the most economical option for large scale oxygen production (Smith and Klosek, 2001; Hillestad et al., 2018). In the EA mode the oxygen is mainly produced in the electrolyzer. Only in cases where the electrolytic oxygen does not suffice, the remaining oxygen is produced in the ASU. The pure oxygen feeding instead of air is chosen in this study because it allows for higher syngas recycle ratios. This leads to a higher product output and lower production costs as shown for a BtL process in (Ostadi and Hillestad, 2017).
To adjust the syngas H2/CO up to a stoichiometric ratio of ∼2 (Hillestad et al., 2018), a sour shift reactor is used. For that the gas is firstly cooled in the heat recovery steam generation system (HRSG). Then, the syngas reacts in the sour shift reactor according to the water gas shift equilibrium (Unde, 2012):
The addition of steam in the shift reactor entails the reaction of CO to CO2, which decreases the overall carbon efficiency of the process. To avoid the additional formation of CO2 in the EA mode the sour shift reactor can be bypassed. In this mode the H2/CO is adjusted by adding hydrogen from the electrolyzer.
The gas cleaning train consists of a water scrubber, syngas compression, Selexol scrubber and a guard bed (Hannula, 2016). As the FT pressure level typically is higher than the gasification pressure, a compressor is required for the process. A higher FT pressure level is associated with higher catalyst productivity (Van Der Laan and Beenackers, 1999). Further, a Selexol scrubber is chosen for its economic and energy efficiency advantages compared to other physical absorption methods (Padurean et al., 2012). As the FT catalyst is sensitive to impurities, a guard bed is required to lower their concentration in the syngas feed (Kurkela et al., 2020).
The FT reaction can be characterized as a polymerization reaction. The reactants H2 and CO form hydrocarbon molecules of different chain lengths. The production of paraffines and olefins can be described with the chemical reactions in Eqs 2, 3 (Van Der Laan and Beenackers, 1999).
Although a multitude of reactor types have been presented in the past, the most notable designs are the slurry bubble column reactor and the fixed bed reactor (Ail and Dasappa, 2016). Both reactor types are of high technical maturity as they are utilized in large scale Gas-to-Liquid plants (Hillestad et al., 2018). Recently, the FT microchannel reactor design has gained some attention (LeViness et al., 2014; Piermartini et al., 2017). Although arguments can be made for all of the aforementioned reactor designs, in this study a slurry bubble column is modeled. The advantages of this reactor type are low capital cost for large plant sizes and a high thermal stability (LeViness, 2013).
At the outlet hydrocarbon products C5+ are separated from water and tail gas. Tail gas, consisting of short chained hydrocarbon gases C1–4 as well as unconverted syngas, is partly recycled to the filter unit.
In this study the alkaline electrolysis AEL technology is chosen for the production of hydrogen and oxygen in the EA mode. Compared to other technologies, specifically proton exchange membrane electrolysis (PEMEL) and solid oxide electrolysis (SOEL), AEL is the most mature technology with the lowest investment costs (Schmidt et al., 2017). The SOEL technology features the highest system efficiency, up to 81%LHV compared to 60%LHV for AEL and 60%LHV PEM (Buttler and Spliethoff, 2018). However, an SOEL is not suitable for intermittent operation. Thermal stress during start-up and shut-down are detrimental to stack lifetime (Buttler and Spliethoff, 2018). The PEMEL might become a more suitable technology for the proposed process in the future as investment costs are predicted to decrease and system efficiency to increase (Schmidt et al., 2017).
Comparison Cases BtL and PBtL
To give reference points, a BtL and PBtL process are simulated and techno-economically evaluated. Both processes rely on the same equipment and flowsheet layout as the hybrid concept. The hybrid plant requires additional investment costs compared to BtL and PBtL. This is due to units that are only active in one mode and over-dimensioned units.
The BtL plant is comprised of all units operated in the BA mode, i.e. no electrolyzer and CO2 compressor are needed for this process. For the PBtL, on the other hand, only equipment types that are used in the EA mode are required. Therefore, ASU and sour shift reactor are excluded.
One hybrid operation mode defines the equipment size. If e.g. the syngas stream in the EA mode is larger than in the BA mode, a larger water scrubber is needed for the EA mode. Therefore, the water scrubber is over-dimensioned for the BA mode. For the comparison cases, BtL and PBtL, no equipment has to be over-dimensioned.
Process Modeling and Simulation
The process was simulated using the commercial software Aspen Plus® (V10). The Soave-Redlich-Kwong equation of state is chosen (Hannula, 2016). This method is recommended for hydrocarbon processes (Aspen Technology Inc., 2013). All unit operation models are based on experimentally validated literature models.
Biomass and Dryer
The biomass properties are taken from Hannula et al. (Hannula, 2016) and displayed in Table 1. Here, forest residue chips are considered as feedstock. Forest residue is composed of bark, needles and stem wood from harvesting and industrial wood residues (Hannula, 2016). Annually 40 Mt forest residue are estimated to be available in the EU (Searle and Malins, 2013). In Aspen Plus biomass is defined as a non-conventional component with a higher heating value (HHV) of 20.67 MJ/kg based on dry matter.
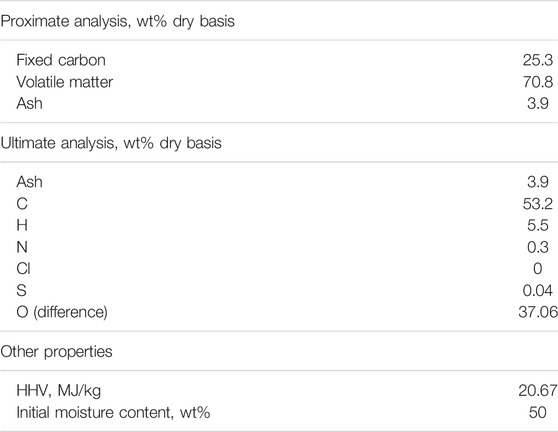
TABLE 1. Properties of biomass feedstock (Hannula, 2016).
The initial moisture content of 50 wt% is reduced in a belt dryer to 12 wt%. For the dryer an electrical power consumption of 32 kWh/t based on dry feedstock mass and a heat demand of 1,300 kWh/t based on the evaporated water mass is assumed (Hannula, 2016).
Gasification and Air Separation Unit
The CFB gasifier is modeled as a combination of an RYield reactor and an RGibbs reactor (Hannula and Kurkela, 2010). The yield for the first reactor at an operation point of 4 bar and 900°C is displayed in Table 2. Conversion and selectivity values for the biomass components are taken from the experimental results published in (Kurkela et al., 2014). Here, unconverted biomass nitrogen is passed to fly ash.
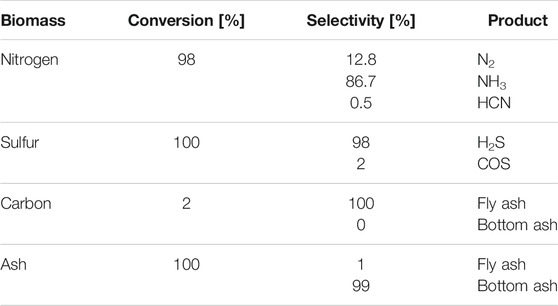
TABLE 2. Gasifier yield model (Kurkela et al., 2014).
The yield for the carbon species formed during gasification can be taken from the Supplementary Material. Here, benzene and naphthalene are modeled for the larger variety of tar species. The modeled tar yield amounts to a molar concentration of 0.3% in the gasifier output. The remaining carbon, hydrogen and oxygen atoms react according to the water gas shift equilibrium in the RGibbs reactor.
The gasifier is assumed to have a heat loss of 1% of the dry biomass input LHV (Hannula, 2016). To fulfill this constraint, the oxygen feed rate is iterated. Further, the steam to oxygen feed mass ratio, or the steam to oxygen and CO2 ratio in the EA mode, is fixed to 1.3. CO2 is recycled to the gasifier in such a way that the mass ratio of CO2 to steam and CO2 is equal to 65%wt..
Gasification ash is completely removed from the syngas. Bottom ash can be removed from the gasifier directly. For fly ash the filter unit is required. At a high syngas temperature filter blinding may occur due to the sooth formation tendency of the tar components (Hannula, 2016). To avoid this, the raw gas temperature is lowered to 600°C before filtration (Kurkela et al., 1993). This is partly accomplished by adding the cooler tail gas recycle stream.
The ASU is assumed to have an energy demand of 1 MWe/(kg/s) with an output pressure of 1 bar (Clausen et al., 2010). The oxygen purity is assumed to be 100% for the simulation. This is a reasonable assumption given the reported oxygen purity of >99 mol% (Smith and Klosek, 2001; Clausen et al., 2010). Subsequently, ASU oxygen is compressed to the gasification pressure of 4 bar by an 80% isentropic efficiency one-stage compressor.
Tar Reforming and Sour Shift
The tar reformer is modeled as an adiabatic RGibbs reactor with an operation temperature of 900°C. In the autothermal reformer oxygen is added to attain this temperature level. The steam to oxygen feed mass ratio is set to 1 (Hannula, 2016). All input components C2+ and tars are simulated to reach chemical equilibrium (Hannula, 2016). Only for the components CH4, NH3 and HCN a conversion limit of 80% is assumed.
In the subsequent sour-shift reactor steam at 4 bar is added to attain a defined H2/CO ratio in the syngas. It is modeled as an REquil reactor in which only the water gas shift reaction is taking place (cf. Eq. 1). To avoid catalyst deactivation steam is added to reach a molar steam/CO input ratio of 1.8. The output temperature for the adiabatic reactor is also limited by the catalyst to 404°C (Hannula, 2016). To meet this constraint the outlet temperature in the HRSG is iterated. Further, the sour shift reactor has a by-pass stream. The amount of bypassed syngas is iterated to attain the defined H2/CO ratio (Hannula, 2016). In the EA mode the sour shift reactor is bypassed entirely.
Gas Cleaning
The water scrubber is modeled as two flash units with an outlet temperature of 60°C for the first and 30°C for the second stage. The syngas is cooled to 200°C at the scrubber inlet by the HRSG system in both modes (Hannula, 2016).
The subsequent syngas compression is modeled as a five-stage compressor with equal pressure ratio and intercooling to 80°C (Hannula, 2016). The outlet pressure is 25 bar as defined by the upper limit of the used FT model. The isentropic efficiency is assumed as 80% for every stage.
For a 90% CO2 removal rate the energy consumption for the Selexol process is assumed to be 74 kJ/kgCO2,removed (Hamelinck and Faaij, 2006; Albrecht and Dietrich, 2018). The pressure in the desorption column is set to 1 bar. Therefore, a re-compression of CO2 to the gasification level of 4 bar is modeled with a one-stage compression with an isentropic efficiency of 80%.
As the reduction of H2S to an acceptable level for the FT reactor, below 10 ppb (Hillestad et al., 2018), cannot be accomplished with the Selexol scrubber alone, a ZnO adsorption bed is needed at the end of the gas cleaning train. For that a separator block removing all trace components is simulated.
Electrolyzer
The AEL unit is modeled as a splitter with a system energy demand of five kWh/Nm3, which amounts to a system efficiency of 70.8%HHV (Buttler and Spliethoff, 2018). The demineralized water input is assumed to be split into pure oxygen and hydrogen streams at 25 bar and 60°C. The hydrogen is introduced into the syngas stream prior to the FT reactor where the gas mixture is heated to reaction temperature of 230°C. The oxygen stream is used in gasifier and reformer. The power input is calculated such that a defined H2/CO is reached in the FT feed.
Fischer-Tropsch
In this study, the kinetic reaction model proposed in Todic et al. (Todic et al., 2013) is used to describe the FT reaction in a slurry bubble column reactor over a Co.−Re/Al2O3 catalyst. The model is based on the carbide mechanism and fitted to experimental data for a temperature range of 478–503 K, a pressure range of 15–25 bar, an H2/CO ratio in the range of 1.4–2.1 and a weight hourly space velocity (WHSV) in the range of 1–22.5 Nl/(gcat h).
The model describes the production rate of n-paraffins and 1-olefins up to a carbon length of 30 as a differential-algebraic system of equations. The system has six input variables reactor temperature, pressure and total molar feed rate as well as the partial pressure of H2, CO and H2O at the reactor output and one design parameter, catalyst loading. Further, the kinetic reaction model assumes that the slurry bubble column reactor can be idealized as a continuously stirred tank reactor (CSTR) (Todic et al., 2013). In Aspen Plus the FT reactor is represented by an RCSTR block. The reaction rate functions are listed in Eqs 4–7. For each product molecule a reaction rate is determined based on its respective growth probability α and the fraction of vacant catalyst sites [S], which in turn is a function of all growth probabilities α in the model. Due to its complexity the reaction model is implemented in a FORTRAN user kinetic subroutine. The code can be found in the Supplementary Material.
In this study, the operation conditions for the FT reactor are set to 230°C and 25 bar. Higher pressure level has been shown to increase the selectivity and reaction rate for the FT Co. catalyst (Van Der Laan and Beenackers, 1999; Todic et al., 2014). The upper temperature limit was selected as the operation point because the catalyst activity increases with temperature (Todic et al., 2014).
To avoid a large recycle stream the FT reactor should be designed to maximize the CO conversion and the product selectivity C5+ i.e. the selectivity for hydrocarbons with a chain length higher than 4. Given the reactor’s operation conditions, the gas hourly space velocity (GHSV) can be adjusted to maximize product output. Lowering the GHSV leads to an increased CO conversion and product selectivity (Schanke et al., 2001). However, the product selectivity drops sharply when surpassing a certain threshold. Commonly, this limit can be found at 75%–80% CO conversion for an SBCR (Rytter and Holmen, 2015). In this conversion range, the increased water-gas-shift activity leads to catalyst oxidation and consequently to its deactivation (Rytter and Holmen, 2015).
For the reactor simulation the H2 conversion is set to a value as defined in the case studies cf. Process Analysis. This is achieved by iterating the catalyst mass in the reactor and thereby the GHSV.
Since the FT reactor is operated in two modes, BA and EA, one requires a lower catalyst mass. It is therefore assumed that the reactor consists of two modules, of which one can be by-passed. For the cost analysis the larger catalyst mass is considered.
Product Separation and Syngas Recycle
An idealized complete separation is assumed for the reaction water, tail gas and product C5+. Part of the longer hydrocarbon products accumulate in the FT slurry and have to be removed by a filter unit (Schweitzer and Viguié, 2009). However, this filtration process is not included in the simulation. For the economic analysis an auxiliary flash unit is simulated at 5°C to gauge the necessary flash volume. The C5+ fraction is viewed as the main product of the process. Any additional processing steps are assumed to be carried out in a central processing facility.
To increase the process carbon efficiency, tail gas containing hydrocarbon gases C1–4 and the unconverted syngas is recycled to the reformer. A recycle rate of 95% of the total tail gas is modeled here. Various studies point out that to avoid the accumulation of inert gas content the recycle ratio has to be below 100% (Albrecht et al., 2017; Hillestad et al., 2018). As a reference, the recycle ratio is set to 93% for the BtL process in the study by Hillestad et al. For PBtL the recycle ratio is kept in a range of 98.5%–91.8% depending on the process design (Hillestad et al., 2018). Since only small amounts of nitrogen are produced in the gasifier and the 90% CO2 removal is sufficient to avoid CO2 accumulation, the 95% recycle assumption can be justified here.
Combined Heat and Power Plant
The CHP plant is modeled as a steam cycle fed by the process off-heat. In addition, the heat from burning FT off-gas, which is not recycled, is counted as a source for the CHP plant. It is assumed that 90% of the off-gas’s LHV can be recovered. The electrical efficiency for the CHP system is set to 40% relative to its heat input (Wang et al., 2019). The remaining energy is converted to district heating. Surplus electrical power is fed to the grid.
Process Analysis
Definition Of Case Studies
Table 3 shows the parameters varied for every simulation case. In this study the effect of H2 conversion in the FT reactor, H2/CO ratio in the FT feed and the biomass feed rate for EA mode on the process performance and economics is gauged. In the base case (1.1) the FT reactor is modeled with a conservative H2 conversion of 70% at the stoichiometric H2/CO ratio of 2.05 (Hillestad et al., 2018). BA and EA have an equal biomass feed of 200 MWth.
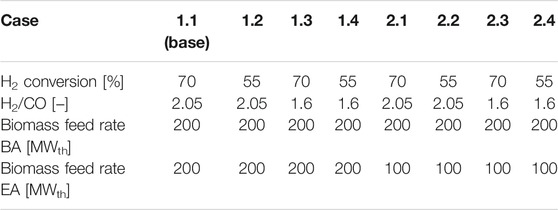
TABLE 3. Case definition for the simulation.
Lowering the H2/CO ratio to 1.6 has several positive effects on the process. Firstly, a lower H2/CO is associated with a higher product selectivity (Van Der Laan and Beenackers, 1999; Todic et al., 2014). Secondly, in the EA mode less hydrogen is needed to reach the H2/CO ratio. Thereby, lower costs for electricity and the electrolyzer can be expected. Thirdly, in the BA mode less CO has to be converted to CO2 in the water gas shift reactor to reach the higher H2/CO ratio. Consequently, the process will have a higher carbon efficiency.
The conversion limit for the FT reactor is lower for operation points with an under-stoichiometric H2/CO ratio (Lillebø et al., 2017). Yet, to the author’s knowledge no study quantifies the impact of H2/CO ratio on the conversion limit. To account for this, the H2 conversion is simulated at 55% and 70% for both H2/CO ratios. Here, the H2 conversion is used instead of the commonly used CO conversion to make cases with different H2/CO ratios more comparable. In Table 3 all odd cases have a conversion of 70%.
Feeding 100 MW instead of 200 MW biomass in the EA mode is advantageous in two aspects: For the smaller syngas stream less hydrogen is needed to attain the defined H2/CO ratio. Therefore, the electrolyzer, which is not operated for a part of the year, can be designed with a lower capacity. On the other hand, the plant is over dimensioned for the EA mode. All cases with 100 MWth biomass input are listed under case 2.1–2.4 in Table 3.
Definition Of Efficiencies
Three performance indicators are used to evaluate the simulated process performance: carbon efficiency ηC, fuel efficiency and process efficiency (Albrecht et al., 2017).
Carbon efficiency ηC, as defined in Eq. 8, can be interpreted as the fraction of carbon molecules in the biomass that is converted to FT product.
The energetic fuel efficiency is stated in Eq. 9. It describes the ratio of chemical energy in the product based on its lower heating value (LHV) to the input energy streams. Here, the input is regarded as the energy content of the biomass feed and the electrolysis power input PAEL.
The energetic plant efficiency (Eq. 10) also takes the by-products heat and electricity into account.
Economic Analysis
The economic analysis is conducted with the DLR software tool TEPET. The tool retrieves stream and unit dimension data from Aspen Plus. By linking the modelled units with according cost data within the TEPET database, a transparent cost estimation can be obtained. The calculation method is described in depth by Albrecht et al. (Albrecht et al., 2017) and has been extended to allow the estimation of a flexible process operation. All applied estimation parameters are detailed in the Supplementary Material.
In this study investment costs are updated using the Chemical Engineering Place Cost Index (CEPCI) for the year 2019 taken from (Jenkins, 2020). The plant lifetime is assumed to be 20 years with 8,100 full load hours to be divided between the two modes. For the timespan the interest rate is fixed to 7% (Albrecht et al., 2017). The number of total employee hours is estimated according to the heuristic outlined in (Peters et al., 1968) as 39,200 h/a with labor costs of 43.83 €/h (Krebs, 2015).
The investment cost E for the process equipment is estimated according to Eq. 11. Here, the equipment size S is set into relation with a reference unit of size Sref and equipment cost Eref. To account for the economy-of-scale effect, a cost degression exponent k is considered (Albrecht et al., 2017). All investment cost assumptions can be found in the Supplementary Material.
The net production costs (NPC) are calculated according to Eq. 12 from the capital expense CAPEX and the operational expense OPEX. The NPC are stated as €/l. To that end, the costs have to be divided by the production rate and the product density ρProd, which is assumed to be 0.729 kg/L for FT product (Albrecht et al., 2017). The CAPEX for the process is found by adding cost factors to the equipment costs obtained from Eq. 11 yielding the fixed capital investment costs FCI. That way, indirect capital expenses such as the installation cost for the units is included. Besides the utility and labor costs, the OPEX also entail indirect operational expenses. Cost items, such as administrative cost, are considered in this category. The corresponding estimation method for indirect operation and capital expenses can be found in the Supplementary Material.
All utility prices are listed in Table 4. Further, the electricity prices for the year 2019 are taken from the day-ahead market provided by Nord Pool AS (Nord Pool AS, 2021). The Finnish electricity tax of 0.5 €/MWh (class II) and the electricity price of 8.84 €/MWh in winter months (Dec.–Feb.) and 12.3 €/MWh for the rest of the year are added to the electricity price ((HSV, 2021; Verohallinto, 2021) as cited in (Helen, 2021)). The resulting price profile can be found in the Supplementary Material. The yearly average price amounts to 55.49 €/MWh.
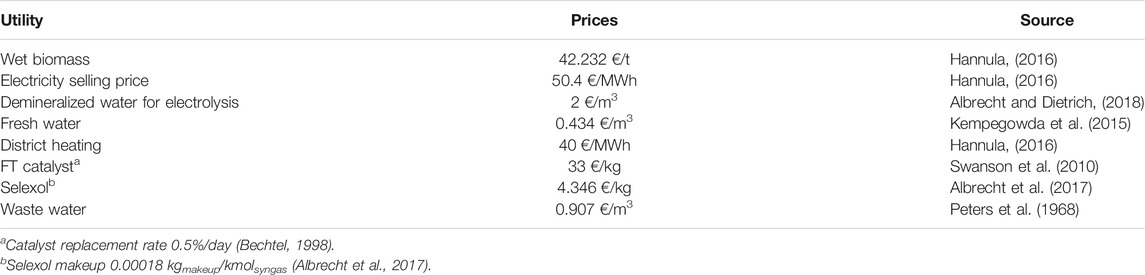
TABLE 4. Utility prices.
Economic Analysis of the Hybrid Process
For the hybrid capital expense estimation, the characteristic size S (cf. Eq. 11) is defined by the mode with the larger equipment. For the mode with the smaller characteristic size, part load operation is assumed. For example, the gasifier in case 2.1 has twice the capacity in BA compared to EA mode. The gasifier investment costs for both modes are defined by the BA mode. In the EA mode the gasifier is operated on part load as an over-dimensioned unit.
The operation costs are defined by each mode independently. Therefore, net production costs (NPC) can be calculated assuming that one mode is active for all 8,100 h. This is subsequently denoted as NPCBA/EA. The NPChy for the hybrid operation of both modes follows from Eq. 13. Here, cfBA and cfEA stand for the capacity factors in BA and EA mode, i.e. the share of all 8,100 h spent in each mode.
To calculate the hours spent in BA and EA mode according to the electricity price profile on the Finnish day-ahead market, the electricity price for which BA and EA mode have the same NPC has to be found. Days with electricity prices below this threshold are operated in EA, above in BA mode. For further calculations, the average electricity price in BA and EA mode operation have to be determined. It is assumed that the hours the plant is not operated do not affect these average electricity costs.
Economic Analysis of the Reference Processes
The cases defined in Table 3 are also applicable to the BtL and the PBtL concept. To keep the cases comparable, all cases are analyzed with a biomass input of 200 MWth. For the analysis the same flowsheets are used. Therefore, no difference in terms of carbon, fuel or process efficiency can be found and thus also in direct operation costs. Only the investment costs will differ for BtL and the BA mode for the same case, because the BtL process does not require an electrolyzer and a CO2 compressor. Also, certain equipment types are over-dimensioned for the BA mode since the EA mode requires the larger equipment size. Here, the BtL process also has lower investment costs.
Correspondingly, the PBtL will require lower investment costs compared to the EA mode. Sour shift reactor and ASU are not included. This extends to cases were the oxygen from the electrolyzer not sufficient. For the small oxygen stream only the energy demand for its production is included in the calculation.
Sensitivity Analysis
The aim of this study is to analyze a hybrid process over a broad range of operation conditions. To that end, a sensitivity study over the electricity price and the capacity factor of each mode is conducted. Here, only the electricity price for the energy input is varied. Further, to provide a reference point to BtL, the electricity price for which the hybrid concept and the BtL process have equal NPC is calculated.
The production costs are estimated for a specific set of economic parameters which may change in the future. To account for this possible change, a sensitivity analysis is conducted for the largest cost contributors biomass price, electrolyzer investment cost and investment costs for the BtL plant.
The investment costs for the BtL plant entail all equipment except the electrolyzer and CO2 recycle. Haarlemmer et al. find investment costs in the range of 300–1200 M€2011 for 400 MW BtL plants (Haarlemmer et al., 2012). To assess what BtL plant investment costs mean for the hybrid process NPC, they are increased by + 100%.
The biomass cost contributes substantially to the overall NPC in the BtL and PBtL concept (Hillestad et al., 2018). Haarlemmer et al. report biomass prices in the range of 7.2–37.08 €2011/MWh (Haarlemmer et al., 2012). In this study a biomass price of 18 €2019/MWh is used. To gauge the effect of a higher biomass price, it is increased by 100%.
Lastly, the electrolyzer investment costs are predicted to fall in the coming years (Schmidt et al., 2017). The technology could reach investment cost levels below 0.6 M€/MW (Schmidt et al., 2017). To account for this the AEL investment costs are reduced by—50% to around 0.6 €/MW.
Results and Discussion
This section presents carbon and energy efficiency alongside the production costs for all simulation cases, as shown in Table 3. The reference processes BtL and PBtL are also analyzed. It should be noted that in terms of carbon and energy efficiency the results for BtL are equivalent to BA cases. The same applies for PBtL and EA cases. Only the economic results differ for the hybrid process and the reference processes.
Carbon Efficiency
In the base case a carbon efficiency of 35.4% was found for the BA mode. As depicted in the Sankey diagram in Figure 4, the remaining carbon is converted to CO2 (60.3%), off-gas (1.9%) and ash (2.4%).
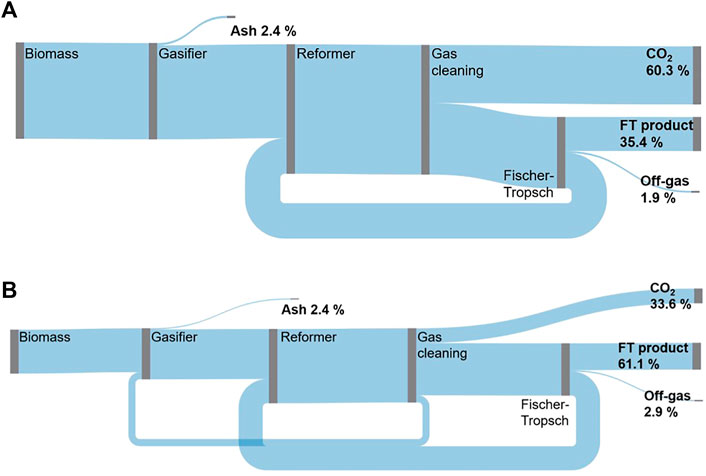
FIGURE 4. Carbon flow Sankey diagram for case 1.1 BA mode (A), EA mode (B).
An advantage of the EA mode over the BA mode is the higher carbon efficiency. In the base case, 61.1% of the biomass carbon instead of 35.4% is converted into FT product. The higher carbon efficiency is mainly due to the amount of carbon converted to CO2—a similar share of carbon leaves the process in the form of ash and FT off-gas in both modes. For the BA mode almost twice the amount of CO2 is produced in the WGS reaction (cf. Table 5). This is caused by the steam addition needed to reach the defined H2/CO ratio in the sour shift reactor. In the EA mode no additional steam is introduced. Instead the H2/CO ratio is adjusted with electrolytic H2.
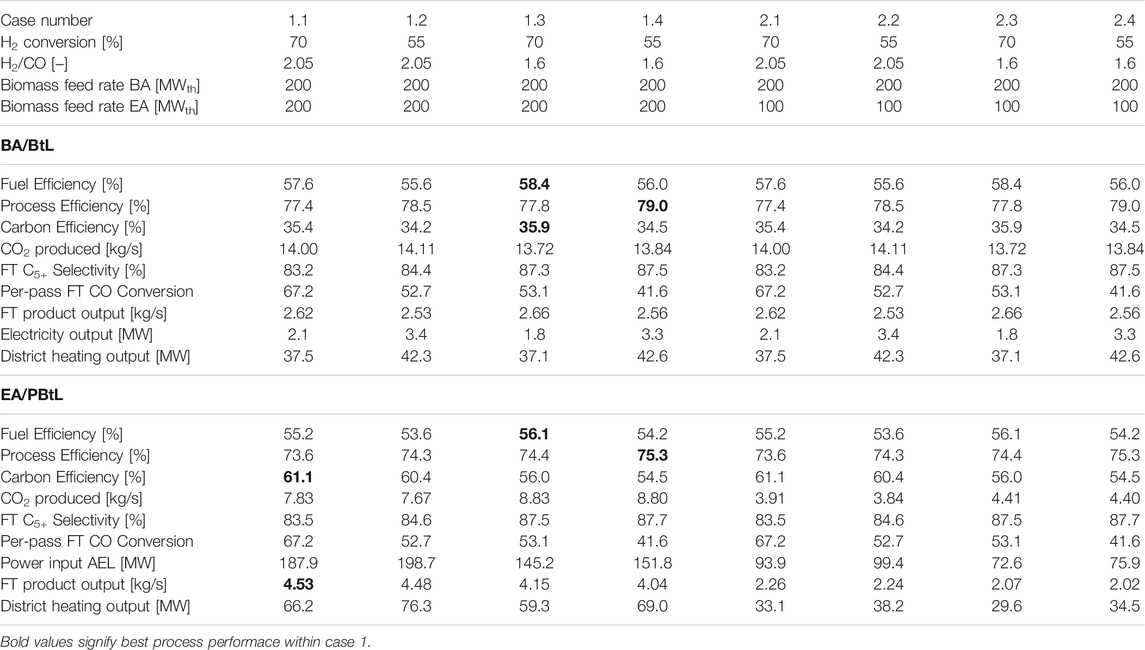
TABLE 5. Efficiency values and key process results for all simulated cases.
As highlighted in Table 5, the highest carbon efficiency for the BA mode can be found for case 1.3 or 2.3 at 35.6%. This can be attributed to the lower amount of CO2 produced to reach an H2/CO ratio of 1.6. Further, a higher FT yield, CO conversion multiplied with C5+ selectivity, affects the carbon efficiency positively, because the amount of FT-off gas is reduced.
In the EA mode the highest carbon efficiency is found for case 1.1. at 61.1%. The combination of high FT yield and low CO2 production lead to the highest carbon efficiency. In both modes, the EA biomass feed amount has no influence on the carbon efficiency.
Fuel and Process Efficiency
For all analyzed cases fuel and process efficiency is found to be higher in the BA mode compared to the EA mode cf. Table 5. This is mainly due to the additional energy loss in the electrolyzer. The energy streams for case 1.1 BA and EA mode are depicted in Figure 5. Here, it can be seen that of the 200 MWLHV biomass input in BA mode 57.6% is converted to fuel, 18.8% to district heating and 1.1% to electricity. The bulk of the generated electricity is used for the auxiliary process power requirement. In the EA mode the remaining electricity is fed to the AEL. Thereby, the electricity demand from the grid can be reduced from 187.9 to 160.2 MWel. With that 55.2% of process power input can be converted to FT fuel, while 18.4% are converted to district heating.
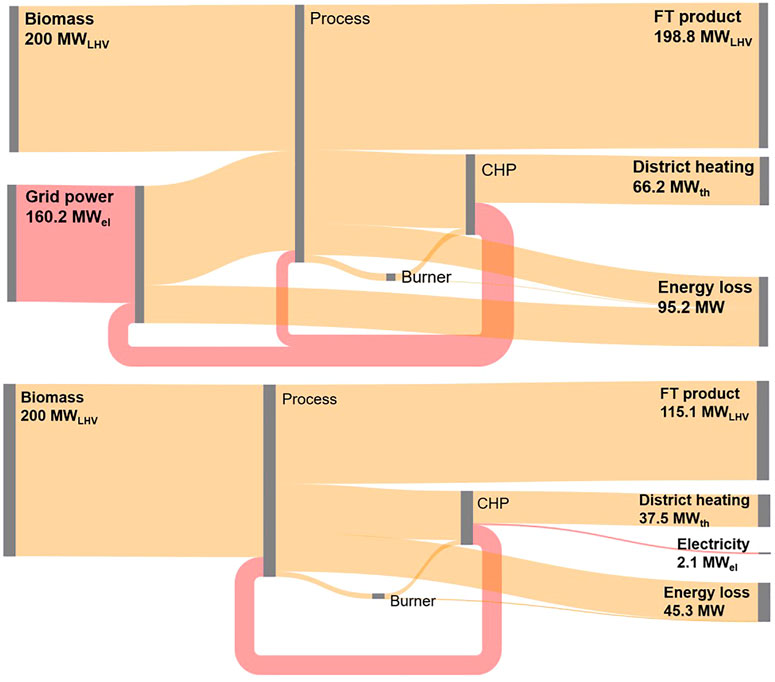
FIGURE 5. Energy flow Sankey diagram for case 1.1 BA mode (top), EA mode (bottom) (chemical or thermal power in orange, electrical power in red).
The highest fuel efficiency is found for cases with high H2 conversion and a low H2/CO ratio i.e. case 1.3 and 2.3. In the BA mode a fuel efficiency of 58.4% and 56.1% in the EA mode is reached as shown in Table 5. Like for the carbon efficiency, the biomass feed rate in the EA mode has no influence on the fuel or process efficiency. High FT conversion and low H2/CO ratio lead to the highest fuel efficiency in the BA mode, because these conditions have the highest FT product output. For the EA mode, on the other hand, case 1.3 does not feature the highest product output. However, the lower feed rate of hydrogen, needed for the H2/CO ratio of 1.6, results in the highest fuel efficiency.
When including the by-products district heating and electricity for the process efficiency, the highest process efficiency values can be found for case 1.4 and 2.4. With the lower H2 conversion of 55% and an H2/CO ratio of 1.6 a process efficiency of 79% BA and 75.3% EA can be attained (cf. Table 5). As less reactant can be converted to FT product, the process output is shifted towards heat and electricity production. This affects the process efficiency positively.
Economic Results
For the base case NPC of 1.08 and 1.04 €2019/L for continuous operation in BA and EA mode are found. The average electricity price of 55.49 €/MWh is used to determine the continuously operated EA NPC. BtL and PBtL, in contrast, have NPC of 0.66 and 1 €2019/L (cf. Table 6). The difference in NPC for BA and BtL or EA and PBtL is due to the lower investment cost. As the electrolysis unit and CO2 recycle are not needed for a BtL plant, only 50.9% of the FCI has to be considered relative to the hybrid plant. Similarly, PBtL has 92.2% of the FCI for the hybrid plant.
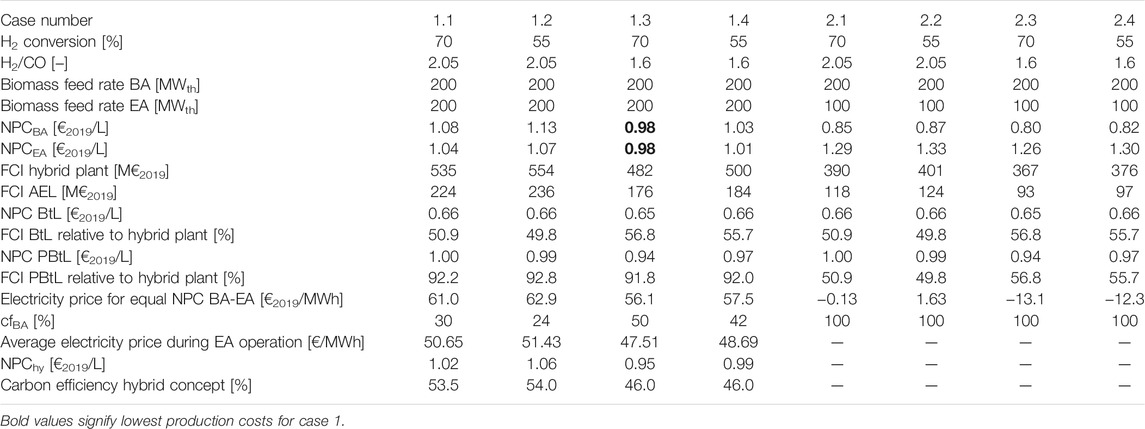
TABLE 6. Net production cost NPC and fixed capital investment FCI for all studied cases.
When applying the Finnish day-ahead price profile, the NPC for the hybrid process in the base configuration is found to be 1.02 €2019/L. If the electricity price is lower than 61 €/MWh, the hybrid process is operated in EA mode. The remaining 30% of the year the process is operated in BA mode. The resulting electricity price for all hours operated in EA mode amounts to 50.65 €/MWh. Under this operation regime the hybrid process has a carbon efficiency of 53.5%.
The lowest production costs are found for case 1.3. Figure 6 juxtaposes the net production costs for the EA and BA mode for case 1.1 and case 1.3. In the BA mode case 1.3 has production costs of 0.98 €2019/L. This is 0.10 €/l lower than for case 1.1. For the EA mode, this difference is only 0.06 €/l. The lower production costs are due to the lower H2/CO ratio leading to reduced investment costs for the electrolyzer. Compared to the base case the electrolyzer investment costs are 21% lower for case 1.3. At the same time, the fuel efficiency is increase by around 1% in both modes. However, the lower H2/CO ratio comes at the cost of a reduced carbon efficiency.
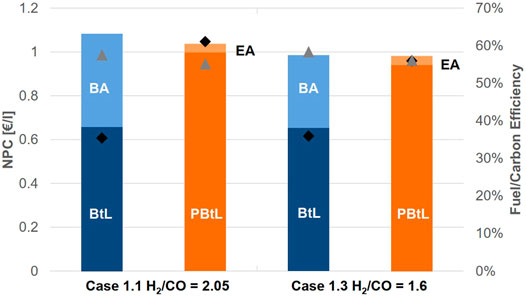
FIGURE 6. Breakdown for net production cost NPC for the FT product in case 1.1 and 1.3 and corresponding fuel (▲) and carbon efficiency (◆).
The hybrid process in case 1.3 operated under the conditions of the Finnish day-ahead market has the lowest NPC of 0.95 €2019/L—0.07 €2019/L less than in case 1.1. With 50% operation in EA mode, the average price for electricity is 47.51 €/MWh. The overall carbon efficiency amounts to 46%.
The reduced EA biomass feed rate in cases 2 leads to a decrease in the BA NPC at the expense of the EA NPC. The cost reduction for the BA mode can be attributed predominantly to the lower capital investment for the electrolyzer, as less hydrogen is needed for 100 MW biomass input. On the other hand, the higher NPC in the EA mode is due to the lower product output for all cases with 100 MW input.
On the Finnish day-ahead market cases 2 could not be sensibly applied. The NPC of the EA mode are only lower than BA NPC, when electricity is available at negative prices. Since this is not the case for 2019, the process would only be operated in the BA mode. Consequently, on the present energy markets of Finland, the electrolyzer would have to be inactive for the entire year.
Sensitivity Analysis
To assess under what conditions on the energy market the hybrid operation principle is economical, a sensitivity analysis is conducted for the electricity price. Figure 7 displays the production costs for case 1.1 in EA and BA mode for an electrical price range from—40 to 80 €/MWh. The resulting production costs of the plant operated half a year in BA and half a year EA mode is denoted as 50-50. Further, the production costs for a BtL and a PBtL plant of the same size are shown.
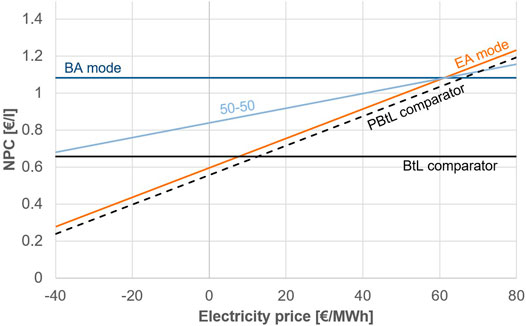
FIGURE 7. Variation of electricity price for case 1.1 EA and BA mode in comparison to BtL and PBtL. The light blue line (50-50) signifies the production costs if the process is operated half a year in BA mode.
The PBtL and BtL comparator production costs stay below those of EA and BA mode respectively. This is due to investment costs of inactive equipment. The inactive electrolyzer accounts for most of the price spread between BA mode and BtL comparator.
The EA mode would have to be operated for the entire year at a price of 8 €/MWh to reach the same production costs of a BtL plant. If the EA mode is only operated for half a year electricity prices of below—40 €/MWh would have to be available for the same time period to reach the BtL price level.
In Figure 8 the share of operation hours in the BA mode are varied for cases 1.1 and 2.1. Based on this, the diagram shows the electricity price for the EA operation hours such that the hybrid process concept reaches equal NPC as the corresponding BtL plant.
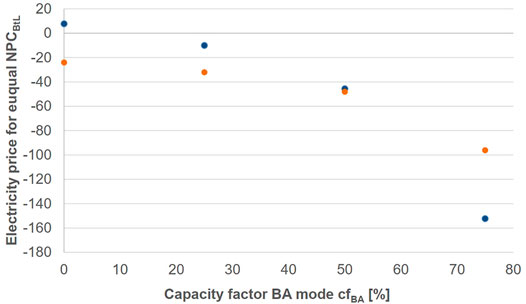
FIGURE 8. Electricity price required to attain equal NPC to BtL as a function of time operated in BA mode for case 1.1 (blue) and case 2.1 (orange).
It can be seen that none of the cases reaches an equal electricity price above—40 €/MWh at 50-50 operation. For a lower EA operation share the required electricity prices asymptotically approach negative infinity. Further, it can be taken from Figure 8 that the cost advantage for cases 1 over 2 can only be found, if BA operation shares stay below 50%. When the process is predominantly operated in BA mode, designing the process with a lower EA biomass input is advantageous.
In Figure 9 three economic parameters are varied and compared to the cases 1.1 and 2.1. For all parameter changes the electricity price is calculated with which the hybrid process concept, operated in 50% EA and 50% BA mode, reaches an equal NPC with the corresponding BtL plant. As seen in Figure 7, equal production costs to BtL are reached at an electricity price below—40 €/MWh for half a year.
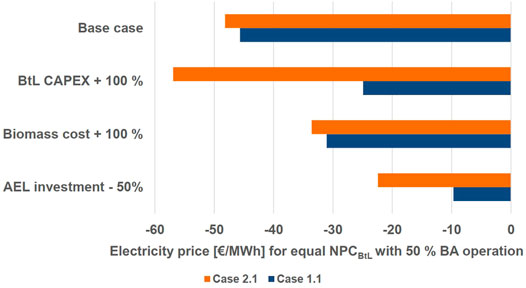
FIGURE 9. Variation for key economic parameters applied to case 1.1 and 2.1.
The investment costs for the BtL plant, which entail all equipment except the electrolyzer and CO2 recycle, are estimated as 272 M€2019 for case 1.1 at 200 MW biomass input. Therefore, the BtL investment costs increased by + 100% would be 544 M€ at 200 MW biomass input. This estimate is in line with the upper range of the cost estimates of 1200 M€2011 for 400 MW input reported by (Haarlemmer et al., 2012). For case 1.1, BtL and the hybrid process have equal NPC at an electricity price of around—22 €/MWh. For case 2.1, however, this has an adverse effect pushing the electricity price to below—50 €/MWh. This is due to the over-dimension BtL equipment in the EA mode.
Increasing the biomass price by +100% has a positive effect on the hybrid process. For case 1.1 and 2.1 it reduces the electricity price to around—30 €/MWh. Further, the electrolyzer investment costs reduction decreases the electricity price to around—10 €/MWh for case 1.1 and—20 €/MWh for case 2.1. The effect on case 1.1 is stronger, because in this case a larger AEL is required (cf. Table 5).
Overall, it can be seen that only a combination of the discussed parameter variations would increase the electricity price to a positive value. Seeing that negative electricity prices for half a year are not likely, it seems probable that a BtL plant is more economical than the presented hybrid process concept.
Conclusion
In this study a techno-economic analysis is conducted for a hybrid operation concept of an electrolysis enhanced biomass-to-liquid process. The electrolysis enhanced mode, which increases the overall product yield, is only activated when the prices on the Finnish day-ahead market for 2019 make it more profitable than feeding only biomass. To that end a cost calculation method for hybrid processes was applied within DLR’s software tool TEPET. Eight process design cases are analyzed to study the economic impact of FT conversion, H2/CO ratio and the biomass feeding rate in the electrolysis enhanced mode. To do so a FT kinetic model was implemented in Aspen Plus. All cases are compared to the steady-state alternatives BtL or PBtL. To gain a broader understanding of the process concept, a sensitivity analysis over electricity price and share of operation hours in each mode as well as key economic parameters is conducted. Based on the results presented here, the following conclusions can be drawn:
• Production costs of 1.08 €2019/L for the hybrid concept compared to 0.66 €2019/L for BtL and 1 €2019/L for PBtL were found based on the Finnish day-ahead market for the base case.
o Under these conditions, an overall carbon efficiency for the hybrid process of 53.5% is found compared to 35.4% for BtL and 61.1% for PBtL.
o The production cost difference is mainly due to the lower capital investment requirement for the reference processes. Only 51% and 92% of the investment costs for the hybrid process are required for BtL and PBtL respectively.
• The lowest NPC and highest fuel efficiency are found for cases with low H2/CO ratio (1.6 instead of 2.05)
o Fuel efficiency can be increased by + 1% for BA/BtL and EA/PBtL for cases with equal H2 conversion.
o The NPC for the hybrid concept can be decreased by 0.07 €2019/L
• A 100 MWth biomass feed in the EA mode is sensible, if the process is predominantly operated in the BA mode.
• The BtL concept appears to be the most economic process alternative given the current renewable electricity price. However, changing economic conditions, i.e. power and biomass prices, and technology development like the reduction of electrolyzer investment cost could make the hybrid concept economically feasible in the future.
The following points should be investigated further to either validate the assumptions made in this study or improve the efficiency and profitability of the two processes: The H2/CO ratio and FT conversion can improve the overall process performance. However, a correlation between H2/CO ratio and the conversion limit was not presented in literature so far. An experimental study on this correlation would help to better assess the optimal yield for the FT reactor.
Further, the CO2 recycling rate was not discussed in this study. With a higher recycling rate, the hydrogen demand of the process would be greater and a higher product yield can be expected. The amount of product yield can even be increased further when hydrogen is added to the reformer directly. This was simulated in (Hillestad et al., 2018). Finding the optimal amount of hydrogen to add to the process would be highly dependent upon the electricity price, electrolyzer investment and efficiency among other factors.
The FT recycle was assumed to have a recycle ratio of 95%. Increasing this value comes at the cost of accumulation of inert gas content in the syngas. However, it also leads to higher fuel yield. An upper limit to the recycling rate should be found experimentally.
Data Availability Statement
The original contributions presented in the study are included in the article/Supplementary Material, further inquiries can be directed to the corresponding author.
Author Contributions
The study is based on EK process design as studied in the EU project FLEXCHX. Modeling, simulation and analysis was done by FH under the guidance of R-UD and EK. The software tool TEPET was provided by SM. The authors FH and SM prepared the manuscript. R-UD, EK, and SM discussed and commented the manuscript.
Funding
This study is part of the FLEXCHX project, which has received funding from the European Union’s Horizon 2020 research and innovation Programme under Grant Agreement No 763919.
Conflict of Interest
The author EK is employed by VTT Technical Research Centre of Finland Ltd.
The remaining authors declare that the research was conducted in the absence of any commercial or financial relationships that could be construed as a potential conflict of interest.
Publisher’s Note
All claims expressed in this article are solely those of the authors and do not necessarily represent those of their affiliated organizations, or those of the publisher, the editors and the reviewers. Any product that may be evaluated in this article, or claim that may be made by its manufacturer, is not guaranteed or endorsed by the publisher.
Acknowledgments
Further, the authors would like to thank Julia Weyand, Moritz Raab and Dr. Marc Linder for their valuable inputs.
Supplementary Material
The Supplementary Material for this article can be found online at: https://www.frontiersin.org/articles/10.3389/fenrg.2021.723774/full#supplementary-material
References
Ail, S. S., and Dasappa, S. (2016). Biomass to Liquid Transportation Fuel via Fischer Tropsch Synthesis - Technology Review and Current Scenario. Renew. Sustain. Energ. Rev. 58, 267–286. doi:10.1016/j.rser.2015.12.143
Albrecht, F. G., and Dietrich, R.-U. (2018). “Technical and Economic Optimization of Biomass-To-Liquid Processes Using Exergoeconomic Analysis,” in 26th European Biomass Converence & Exhibition (EUBCE), Copenhagen, Denmark.
Albrecht, F. G., König, D. H., Baucks, N., and Dietrich, R.-U. (2017). A Standardized Methodology for the Techno-Economic Evaluation of Alternative Fuels - A Case Study. Fuel 194, 511–526. doi:10.1016/j.fuel.2016.12.003
Aspen Technology Inc (2013). Aspen Physical Property System - Physical Property Methods. Burlington, Massachusetts: Aspen Technology Inc.
Bechtel, (1998). Aspen Process Flowsheet Simulation Model of a Battelle Biomass‐Based Gasification, Fischer–Tropsch Liquefaction and Combined‐Cycle Power Plant. Pittsburgh, Pennsylvania: US Department of Energy (DOE Bechtel corporation).
Blanco, H., and Faaij, A. (2018). A Review at the Role of Storage in Energy Systems with a Focus on Power to Gas and Long-Term Storage. Renew. Sustain. Energ. Rev. 81, 1049–1086. doi:10.1016/j.rser.2017.07.062
Butera, G., Højgaard Jensen, S., Østergaard Gadsbøll, R., Ahrenfeldt, J., and Røngaard Clausen, L. (2020). Flexible Biomass Conversion to Methanol Integrating Solid Oxide Cells and TwoStage Gasifier. Fuel 271, 117654. doi:10.1016/j.fuel.2020.117654
Buttler, A., and Spliethoff, H. (2018). Current Status of Water Electrolysis for Energy Storage, Grid Balancing and Sector Coupling via Power-To-Gas and Power-To-Liquids: A Review. Renew. Sustain. Energ. Rev. 82, 2440–2454. doi:10.1016/j.rser.2017.09.003
Clausen, L. R., Elmegaard, B., and Houbak, N. (2010). Technoeconomic Analysis of a Low CO2 Emission Dimethyl Ether (DME) Plant Based on Gasification of Torrefied Biomass. Energy 35 (12), 4831–4842. doi:10.1016/j.energy.2010.09.004
European Commission (2020). Stepping up Europe’s 2030 Climate Ambition Investing in a Climate-Neutral Future for the Benefit of Our People. [Online]. Available: https://eur-lex.europa.eu/legal-content/EN/TXT/PDF/?uri=CELEX:52020DC0562&from=EN (Accessed May 3, 2021).
Haarlemmer, G., Boissonnet, G., Imbach, J., Setier, P.-A., and Peduzzi, E. (2012). Second Generation BtL Type Biofuels - a Production Cost Analysis. Energy Environ. Sci. 5 (9), 8445. doi:10.1039/c2ee21750c
Hamelinck, C. N., and Faaij, A. P. C. (2006). Outlook for Advanced Biofuels. Energy policy 34 (17), 3268–3283. doi:10.1016/j.enpol.2005.06.012
Hannula, I., and Kurkela, E. (2010). A Semi-empirical Model for Pressurised Air-Blown Fluidised-Bed Gasification of Biomass. Bioresour. Technol. 101 (12), 4608–4615. doi:10.1016/j.biortech.2010.01.072
Hannula, I., and Reiner, D. M. (2019). Near-term Potential of Biofuels, Electrofuels, and Battery Electric Vehicles in Decarbonizing Road Transport. Joule 3 (10), 2390–2402. doi:10.1016/j.joule.2019.08.013
Hannula, I. (2016). Hydrogen Enhancement Potential of Synthetic Biofuels Manufacture in the European Context: A Techno-Economic Assessment. Energy 104, 199–212. doi:10.1016/j.energy.2016.03.119
Helen Oy (2021). Confidential Deliverable Report D8.5 - Techno-Economic Assessment Report for the Finnish Case Studies. Finland.
Helin, K., Jaãskelaincn, J., and Syri, S. (2018). “Energy Security Impacts of Decreasing CHP Capacity in Finland,” in 2018 15th International Conference on the European Energy Market (EEM): (IEEE), Piscataway, NJ, 1–5. doi:10.1109/eem.2018.8469786
Hillestad, M., Ostadi, M., Alamo Serrano, G. d., Rytter, E., Austbø, B., Pharoah, J. G., et al. (2018). Improving Carbon Efficiency and Profitability of the Biomass to Liquid Process with Hydrogen from Renewable Power. Fuel 234, 1431–1451. doi:10.1016/j.fuel.2018.08.004
HSV (2021). Sähkön Siirtohinnasto 110 kV -asiakkaille. [Online]. Available: https://www.helensahkoverkko.fi/globalassets/hinnastot-ja-sopimusehdot/hsv/sahkon-siirtohinnasto-110kv.pdf (Accessed May 2, 2021).
Jenkins, S. (2020). 2019 Chemical Engineering Plant Cost Index Annual Average. [Online]. Available: https://www.chemengonline.com/2019-chemical-engineering-plant-cost-index-annual-average/(Accessed March 24, 2021).
Kempegowda, R. S., del Alamo, G., Berstad, D., Bugge, M., Matas Güell, B., and Tran, K.-Q. (2015). CHP-integrated Fischer-Tropsch Biocrude Production under Norwegian Conditions: Techno-Economic Analysis. Energy Fuels 29 (2), 808–822. doi:10.1021/ef502326g
Kotzur, L., Markewitz, P., Robinius, M., and Stolten, D. (2018). Time Series Aggregation for Energy System Design: Modeling Seasonal Storage. Appl. Energ. 213, 123–135. doi:10.1016/j.apenergy.2018.01.023
Krebs, S. (2015). Arbeitskosten Pro Stundeim Verarbeitenden Gewerbe. Volkswirtschaft und Statistik. VDMA. Available at: http://www.waterwastewatertechnology.info/documents/105628/778064/Internationaler%20Arbeitskostenvergleich%20Verarbeitendes%20Gewerbe/05a1a0bf-ea29-4a7a-b905-37fffec17957 (Accessed November 10, 2021).
Kurkela, E., Ståhlberg, P., and Laatikainen, J. (1993). Pressurized Fluidized-Bed Gasification Experiments with wood, Peat and Coal at VTT in 1991-1992: Part 1. Test Facilities and Gasification Experiments with Sawdust. Espoo, Finland: VTT Technical Research Centre of Finland.
Kurkela, E., Kurkela, M., Hiltunen, I. J. E. P., and Energy, S. (2014). The Effects of wood Particle Size and Different Process Variables on the Performance of Steam‐oxygen Blown Circulating Fluidized‐bed Gasifier. Environ. Prog. Sustain. 33 (3), 681–687. doi:10.1002/ep.12003
Kurkela, E., Kurkela, M., Frilund, C., Hiltunen, I., Rollins, B., and Steele, A. (2020). Flexible Hybrid Process for Combined Production of Heat, Power and Renewable Feedstock for Refineries: Managing seasonal energy supply and demand for heat and power in Europe. Johnson Matthey Technol. Rev. 65 (2), 333–345.
LeViness, S., Deshmukh, S. R., Richard, L. A., and Robota, H. J. (2014). Velocys Fischer–Tropsch Synthesis Technology—New Advances on State-Of-The-Art. Top. Catal. 57 (6-9), 518–525. doi:10.1007/s11244-013-0208-x
LeViness, S. (2013). “Velocys Fischer-Tropsch Synthesis Technology–Comparison to Conventional FT Technologies,” in AIChE 2013 Spring Meeting, San Antonio, TX.
Lillebø, A., Rytter, E., Blekkan, E. A., and Holmen, A. (2017). Fischer–Tropsch Synthesis at High Conversions on Al2O3-Supported Co Catalysts with Different H2/CO Levels. Ind. Eng. Chem. Res. 56 (45), 13281–13286. doi:10.1021/acs.iecr.7b01801
Mathiesen, B. V., Lund, H., Connolly, D., Wenzel, H., Østergaard, P. A., Möller, B., et al. (2015). Smart Energy Systems for Coherent 100% Renewable Energy and Transport Solutions. Appl. Energ. 145, 139–154. doi:10.1016/j.apenergy.2015.01.075
Molino, A., Chianese, S., and Musmarra, D. (2016). Biomass Gasification Technology: The State of the Art Overview. J. Energ. Chem. 25 (1), 10–25. doi:10.1016/j.jechem.2015.11.005
Müller, S., Groß, P., Rauch, R., Zweiler, R., Aichernig, C., Fuchs, M., et al. (2018). Production of Diesel from Biomass and Wind Power–Energy Storage by the Use of the Fischer-Tropsch Process. Biomass Convers. Biorefin. 8 (2), 275–282. doi:10.1007/s13399-017-0287-1
Nord Pool AS (2021). Finnish Day-Ahead Market Data 2019. [Online]. Available: https://www.nordpoolgroup.com/Market-data1/Dayahead/Area-Prices/ALL1/Hourly1/?view=table (Accessed May 6, 2021).
Olofsson, I., Nordin, A., and Söderlind, U. (2005). Initial Review and Evaluation of Process Technologies and Systems Suitable for Cost-Efficient Medium-Scale Gasification for Biomass to Liquid Fuels. Umeå, Sweden: Umeå Universitet.
Ostadi, M., and Hillestad, M. (2017). Enriched Air or Pure Oxygen as Oxidant for Gas‐to‐Liquid Process with Microchannel Reactors. Chem. Eng. Technol. 40 (10), 1946–1951. doi:10.1002/ceat.201700269
Padurean, A., Cormos, C.-C., and Agachi, P.-S. (2012). Pre-combustion Carbon Dioxide Capture by Gas–Liquid Absorption for Integrated Gasification Combined Cycle Power Plants. Int. J. Greenhouse Gas Control. 7, 1–11. doi:10.1016/j.ijggc.2011.12.007
Papaefthymiou, G., and Dragoon, K. (2016). Towards 100% Renewable Energy Systems: Uncapping Power System Flexibility. Energy Policy 92, 69–82. doi:10.1016/j.enpol.2016.01.025
Peters, M. S., Timmerhaus, K. D., West, R. E., Timmerhaus, K., and West, R. (1968). Plant Design and Economics for Chemical Engineers. New York: McGraw-Hill.
Piermartini, P., Boeltken, T., Selinsek, M., and Pfeifer, P. (2017). Influence of Channel Geometry on Fischer-Tropsch Synthesis in Microstructured Reactors. Chem. Eng. J. 313, 328–335. doi:10.1016/j.cej.2016.12.076
Rytter, E., and Holmen, A. (2015). Deactivation and Regeneration of Commercial Type Fischer-Tropsch Co-catalysts—A Mini-Review. Catalysts 5 (2), 478–499. doi:10.3390/catal5020478
Schanke, D., Lian, P., Eri, S., Rytter, E., Sannæs, B. H., and Kinnari, K. J. (2001). “Optimisation of Fischer-Tropsch Reactor Design and Operation in GTL Plants,” in Studies in Surface Science and Catalysis (Fogelsville: Elsevier), 239–244. doi:10.1016/s0167-2991(01)80310-4
Schmidt, O., Gambhir, A., Staffell, I., Hawkes, A., Nelson, J., and Few, S. J. I. J. o. H. E. (2017). Future Cost and Performance of Water Electrolysis. An Expert Elicitation study 42 (52), 30470–30492. doi:10.1016/j.ijhydene.2017.10.045
Schweitzer, J., and Viguié, J. (2009). Reactor Modeling of a Slurry Bubble Column for Fischer-Tropsch Synthesis. Oil Gas Sci. Technol. Revue de l'IFP 64 (1), 63–77. doi:10.2516/ogst/2009003
Searle, S., and Malins, C. (2013). Availability of Cellulosic Residues and Wastes in the EU. Washington, DC, USA: nternational Council on Clean Transportation.
Shen, Y., and Yoshikawa, K. (2013). Recent Progresses in Catalytic Tar Elimination during Biomass Gasification or Pyrolysis—A Review. Renew. Sustain. Energ. Rev. 21, 371–392. doi:10.1016/j.rser.2012.12.062
Sigurjonsson, H. Æ., and Clausen, L. R. (2018). Solution for the Future Smart Energy System: A Polygeneration Plant Based on Reversible Solid Oxide Cells and Biomass Gasification Producing Either Electrofuel or Power. Appl. Energ. 216, 323–337. doi:10.1016/j.apenergy.2018.02.124
Smith, A., and Klosek, J. (2001). A Review of Air Separation Technologies and Their Integration with Energy Conversion Processes. Fuel Process. Technol. 70 (2), 115–134. doi:10.1016/s0378-3820(01)00131-x
Swanson, R. M., Platon, A., Satrio, J. A., and Brown, R. C. (2010). Techno-economic Analysis of Biomass-To-Liquids Production Based on Gasification. Fuel 89, S11–S19. doi:10.1016/j.fuel.2010.07.027
Todic, B., Bhatelia, T., Froment, G. F., Ma, W., Jacobs, G., Davis, B. H., et al. (2013). Kinetic Model of Fischer–Tropsch Synthesis in a Slurry Reactor on Co–Re/Al2O3 Catalyst. Ind. Eng. Chem. Res. 52 (2), 669–679. doi:10.1021/ie3028312
Todic, B., Ma, W., Jacobs, G., Davis, B. H., and Bukur, D. B. (2014). Effect of Process Conditions on the Product Distribution of Fischer–Tropsch Synthesis over a Re-promoted Cobalt-Alumina Catalyst Using a Stirred Tank Slurry Reactor. J. Catal. 311, 325–338. doi:10.1016/j.jcat.2013.12.009
Unde, R. B. (2012). Kinetics and Reaction Engineering Aspects of Syngas Production by the Heterogeneously Catalysed Reverse Water Gas Shift Reaction. Dissertation Universität Bayreuth.
Van Der Laan, G. P., and Beenackers, A. A. C. M. (1999). Kinetics and Selectivity of the Fischer–Tropsch Synthesis: a Literature Review. Catal. Rev. 41 (3-4), 255–318. doi:10.1081/cr-100101170
Verohallinto, (2021). Tax Rates on Electricity and Certain Fuels. [Online]. Available: https://www.vero.fi/en/businesses-and-corporations/taxes-and-charges/excise-taxation/sahko-ja-eraat-polttoaineet/Tax-rates-on-electricity-and-certain-fuels/(Accessed March 2, 2021).
Wang, J., You, S., Zong, Y., Træholt, C., Dong, Z. Y., and Zhou, Y. (2019). Flexibility of Combined Heat and Power Plants: A Review of Technologies and Operation Strategies. Appl. Energ. 252, 113445. doi:10.1016/j.apenergy.2019.113445
Keywords: power and biomass to liquid, biomass to liquid, fischer-tropsch, techno-economic analysis, alternative fuel process, dynamic process operation
Citation: Habermeyer F, Kurkela E, Maier S and Dietrich R-U (2021) Techno-Economic Analysis of a Flexible Process Concept for the Production of Transport Fuels and Heat from Biomass and Renewable Electricity. Front. Energy Res. 9:723774. doi: 10.3389/fenrg.2021.723774
Received: 11 June 2021; Accepted: 07 October 2021;
Published: 23 November 2021.
Edited by:
Erik Furusjö, Research Institutes of Sweden (RISE), SwedenReviewed by:
Ganapati D. Yadav, Institute of Chemical Technology, IndiaAbu Yousuf, Shahjalal University of Science and Technology, Bangladesh
Copyright © 2021 Habermeyer, Kurkela, Maier and Dietrich. This is an open-access article distributed under the terms of the Creative Commons Attribution License (CC BY). The use, distribution or reproduction in other forums is permitted, provided the original author(s) and the copyright owner(s) are credited and that the original publication in this journal is cited, in accordance with accepted academic practice. No use, distribution or reproduction is permitted which does not comply with these terms.
*Correspondence: Felix Habermeyer, felix.habermeyer@dlr.de