Techno-Economic Evaluation of Biological and Fluidised-Bed Based Methanation Process Chains for Grid-Ready Biomethane Production
 Andreas Gantenbein
 Oliver Kröcher1,2
  Tilman J. Schildhauer
- 1Paul Scherrer Institut (PSI), Villigen, Switzerland
- 2Institute for Chemical Sciences and Engineering, École polytechnique fédérale de Lausanne (EPFL), Lausanne, Switzerland
Three different power-to-methane process chains with grid injection in two scales (1 MWel and 6 MWel) were analysed regarding their investment and operation cost. The process chains were based on biological or catalytic bubbling fluidised bed methanation in combination with proton exchange membrane or solid oxide electrolyser cells. A bottom-up techno-economic analysis showed a cost benefit of around 17–19% lower biomethane production cost for the bubbling fluidised bed technology as less than a third of the reactor volumes is required for catalytic methanation. This cost benefit is only given in combination with PEM electrolysis, as the high-temperature electrolyser stacks currently result in high investment cost. Based on electricity cost of 5 €-ct/kWhel and a plant size of 6 MWel, biomethane production cost of 13.95 €-ct./kWh for catalytic and 17.30 €-ct/kWh for biological methanation could be obtained, both including PEM electrolysis. A significant efficiency increase by integrating the heat of catalytic methanation reaction with the high-temperature electrolysis can be achieved; however investment cost have to decrease below 1000 €/kWel to obtain economically feasible production cost of biomethane. Under current economic and technological circumstances, CO2 methanation using the bubbling fluidised bed technology is the most cost effective.
1 Introduction
The integration of biomass in the future energy system bears a large potential for the decarbonisation of society. Switzerland’s gas providers agreed on increasing the share of renewable gas in the distribution grid to 30% of the residential heating consumption by 2030 (Schmid and Decurtins, 2018). The largest potential in unused domestic bio-resources is associated with biogas from digestion processes (Thees et al., 2017). In order to make use of this potential, biogas upgrading and utilisation processes on a relatively small scale are necessary. Methanation of such biogenic gases also enables a flexible way of integration and seasonal storage of renewable electricity in the future energy system. The Power-to-Gas technology can provide a large, yet unused potential for such chemical energy storage (Götz et al., 2016; Böhm et al., 2020). The technology allows the coupling between different energy sectors (i.e. electricity, gas, and heat) and has also a large potential in reducing the carbon footprint of the existing gas grid (Kober et al., 2019). The underlying methanation reaction is currently being tested in a variety of lab-scale and demonstration-scale projects (Thema et al., 2019). The technologies investigated involve mostly fixed-bed and biological methanation concepts (Thema et al., 2019).
In previous work, Witte et al. compared the cost structure of catalytic fixed bed and catalytic bubbling fluidised bed (BFB) methanation. It could be shown, that also fluidised bed methanation and subsequent membrane upgrading can provide a cost-efficient way to produce biomethane (Witte et al., 2018b). The maturity of the technology could be demonstrated by stable operation for more than 1,000 h with subsequent grid injection (Witte et al., 2019), but no demonstration project is in operation yet.
While biogas proved to be a cost-efficient carbon source for direct methanation of biogas, any other CO2 source can be used (Witte et al., 2018a; Calbry-Muzyka and Schildhauer, 2020). Direct air capture and similar technologies to obtain CO2 are associated with high cost. However, also waste streams of almost pure CO2 are available and can be used for methanation. These include for example the off-gas streams of conventional biogas upgrading units. The Store&Go demonstration plants make use of different technologies, such as direct air capture, waste-CO2 from a waste water treatment plants, as well as a CO2 stream from a bioethanol plant (Store and Go Project, 2016b). The carbon source, as well as the source of electricity for the electrolysis highly influence the profitability of the overall process, as a higher selling price for biomethane can be achieved by renewable sources (Energie360°, 2021).
Due to the high share in operation cost, the efficiency of the electrolyser technology has a large influence on the overall production cost of the biomethane (Witte et al., 2018a). Alkaline electrolysis (AEL) is the most commonly used technology (Posdziech et al., 2019). Nevertheless, proton exchange membrane (PEM) technology allows for higher current densities and higher operation pressures than conventional alkaline electrolysis. This technology is increasing its industrial maturity and commercial applications are now available on the market. The solid oxide electrolysis cell (SOE) technology is still under development, mainly because stack lifetime issues due to material degradation need to be solved (Posdziech et al., 2019). SOE technology allows an increase of electrolyser efficiency by integration of an external heat source, for example catalytic methanation (Gruber et al., 2018).
This work provides a bottom-up techno-economical evaluation of three different Power-to-Gas (PtG) process chains in two different scales. For each of these processes the size and performance of the main equipment is determined, and its capital and operation costs are evaluated. The study compares the cost structure of the bubble column-based biological methanation and catalytic bubbling fluidised bed methanation. Furthermore, the influence of electrolyser technology and cost is investigated.
2 Methods
2.1 Process Design
The processes evaluated in this work are divided into two scales corresponding to the electrolyser power of two demonstration projects. The first scale corresponds to the 1 MWel BioCat plant in Avedøre (Denmark), based on biological methanation (Electrochaea.dk ApS, 2014). The second scale refers to the 6 MWel Audi e-gas project in Werlte (Germany), which operates alkaline electrolysers with cooled, fixed-bed methanation reactors (Götz et al., 2016). Furthermore, two methanation technologies are compared, namely bubbling fluidised bed methanation and biological methanation in a stirred bubble column.
As electrolyser technologies, proton exchange membrane, as well as high-temperature electrolysis by solid oxide electrolysis cells are considered. Based on the available electrolysis power and subsequent H2-feed, a CO2 feed stream is calculated according to the respective needs of the methanation technology. For the cases including the SOE technology, the hydrogen output of the electrolyser is kept the same as in the PEM-cases. Therefore, plant costs are comparable to the PEM-BFB case.
An overview on the considered cases is given in Table 1.
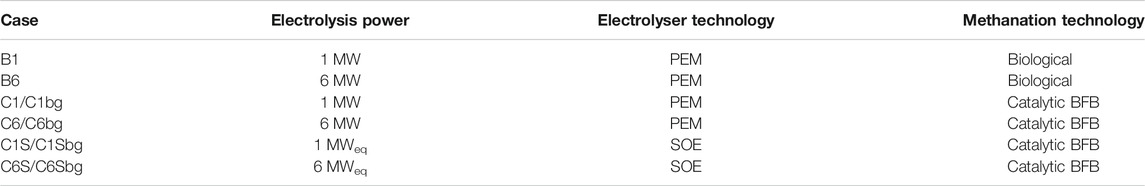
TABLE 1. Power-to-Gas process chains for CO2 methanation considered in this study. The processes abbreviated with a “B” refer to the biological methanation, those abbreviated with “C” to the catalytic case. The numbers indicate the 1 MW and 6 MW-scale respectively. The variations marked with “bg” use biogas as feed instead of pure CO2. The processes based on SOE instead of PEM electrolysis are indicated with “S”.
The combination of biological methanation with solid oxide electrolysis is not considered in this work since the temperature level of excess heat from biological methanation is too low for integration with high temperature electrolysis. Such a process would either require the addition of an external high temperature heat source or result in a decreased electrical efficiency of the SOE.
The two catalytic processes were furthermore evaluated for the case of direct methanation of biogas. In this case, the electrolyser power is fixed to the respective CO2-case and a biogas-feed containing the necessary CO2 is provided to the process. The raw biogas is assumed to have a methane content of 60 vol.-%. The cases with biogas as feed are marked with “bg.”
2.1.1 Cases B1 and B6: Biological Methanation With PEM Electrolysis (PEM-Bio)
The process in cases B1 and B6 consist of a biological methanation unit fed by a PEM electrolyser in the 1 MW and 6 MW-scale, as shown in Figure 1. A purified CO2 feed stream is compressed to the operation pressure of the reactor and mixed with hydrogen from the electrolyser. The CO2 feed stream to the plant and the water feed stream to the electrolyser are chosen according to the electrolyser power and the H2/CO2-ratio required in the feed of the reactor. The water feed stream is compressed to the operation pressure of the PEM-electrolyser, which is 30 bar. The valorisation of oxygen produced by the electrolyser is optional, but not part of this work.
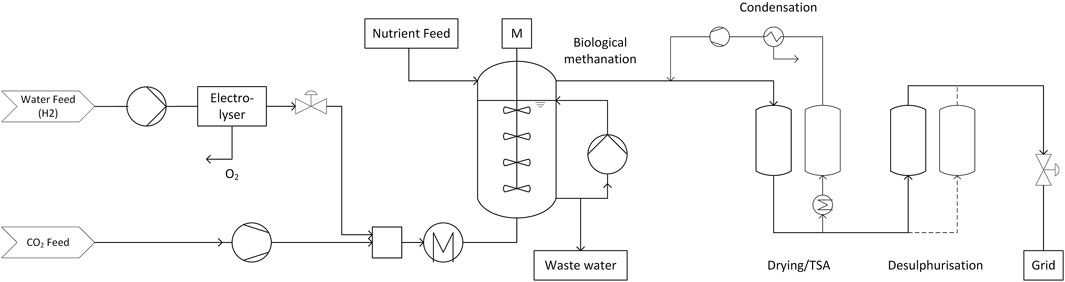
FIGURE 1. Process chain for the biological methanation of CO2.
The feed gas mixture is then pre-heated to the reactor inlet temperature, which is 60°C in the case of biological methanation. As this temperature level is low and temperature differences of the feed gases relatively small compared to the required temperature, no heat exchanger equipment is considered in the upstream part of the plant. Furthermore, the feed gas is injected into a large volume of liquid, which allows for fast adjustment of the temperature.
The biological methanation reactor is a tall continuously stirred tank reactor (CSTR) unit with multiple stirrer stages. The design of the sizing of the unit is given by the data in the work of Inkeri et al. (Inkeri et al., 2018), summarised in Table 2. The rate-based model developed in this study was validated by comparison of model predictions with literature data. The biological methanation kinetics itself are based on the growth of the archaeon Methanobacter thermoautotrophicum obtained from the work of Schill et al. (Schill et al., 1996). The up-scaled reactor system operates at a temperature of 60–65°C.
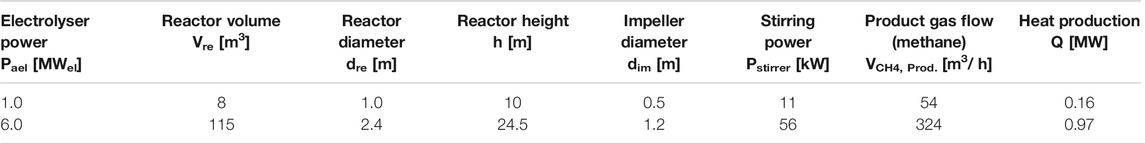
TABLE 2. Data used to estimate the performance of the biological methanation system according to Inkeri et al. (Inkeri et al., 2018). The methane production rate was corrected according to Eqs 2, 3.
The reactor geometry is fixed for both scales to 1:2:20 for the stirrer diameter (
In biological methanation, the reaction is catalysed by one or multiple strains of microorganisms. In addition to the suitable temperature and pressure conditions, those organisms also have to be provided with nutrients in order to foster their growth. Therefore, these nutrients are provided as solution to the reactor. To avoid the accumulation of potentially toxic metabolites in the liquid phase, a part of the slurry has to be discarded as wastewater. This wastewater stream furthermore contains the water produced by the methanation reaction according to Eq. 1. To ensure a proper distribution of nutrients and microorganisms along the reactor height, a part of the slurry is pumped from the bottom of the reactor to the top. Inkeri et al. provides a liquid feed rate DL of 0.05 h−1 and a recycle ratio of 0.75, which allows the calculation of the required nutrient feed.
The wastewater flow also contains a small amount of dissolved gases. In order to avoid insufficient CO2 supply at the top of the reactor, 1% excess CO2 is fed to the system (Inkeri et al., 2018). For the calculations, a H2/CO2 ratio of 3.96 is chosen. The methane production rates published by Inkeri et al. are slightly above the stoichiometric possible values. They were corrected for this work by Eqs 2, 3 and listed in Table 2. We assumed that the CO2 is fully dissolved in the liquid phase and the raw biomethane leaving the reactor only contains CH4 and unreacted H2. This assumption can be confirmed by measurements at the Solothurn pilot plant (Huettenrauch et al., 2020).
The hydrogen production rate
The product gas stream contains around 98% CH4 and fulfils grid injection limitations. Nevertheless, it is saturated with water and contaminated with volatile metabolites from the biological process. Therefore, a temperature swing adsorption (TSA) process for drying and a sorption step for desulphurization is considered. The TSA consists of two vessels operated alternatingly, one in the main product gas stream in adsorption mode and the other in regeneration mode. The adsorption process occurs at ambient temperature, whereas for desorption the vessel is electrically heated to 200°C and flushed with a part of the dried product gas stream. This water-saturated stream is then fed to a condenser and recompressed to be fed to the main stream again. This procedure allows to regenerate the sorbent without losing product gas or contaminating the product gas with other components, such as air or nitrogen. In the TSA, silica gel is used as a sorbent.
The desulphurisation step consists also of two vessels which are filled with a specialised sorbent for biogas polishing. The first vessel is in operation mode and fed with the main gas stream whereas the second one serves as back up in case of maintenance or sorbent replacement.
The now cleaned and dried biomethane can be expanded to the required pressure and injected to the gas distribution grid.
2.1.2 Cases C1 and C6: Bubbling Fluidised Bed Methanation With PEM Electrolysis (PEM-BFB)
The process consisting of the bubbling fluidised bed methanation is designed as shown in the process flow diagram in Figure 2. It consists of the same upstream equipment as the process in PEM-bio case and is based on a previous study by Witte et al. (Witte et al., 2018b) on direct methanation of biogas. Again, cleaned CO2 and water for electrolysis are fed to the plant and compressed to the operation pressures of the electrolyser and reactor. Hydrogen is mixed to the main CO2 stream. This feed gas has to be pre-heated to the minimal feed temperature of the reactor, which is set to 280°C. This temperature is the minimum useful operation temperature of the nickel-based catalyst. The catalyst has to be protected from contamination with sulphur compounds and subsequent deactivation (Witte et al., 2019). Since biogenic CO2 still contains a small amount of such contaminants a gas polishing step is introduced in the CO2 feed stream (Calbry-Muzyka et al., 2019).
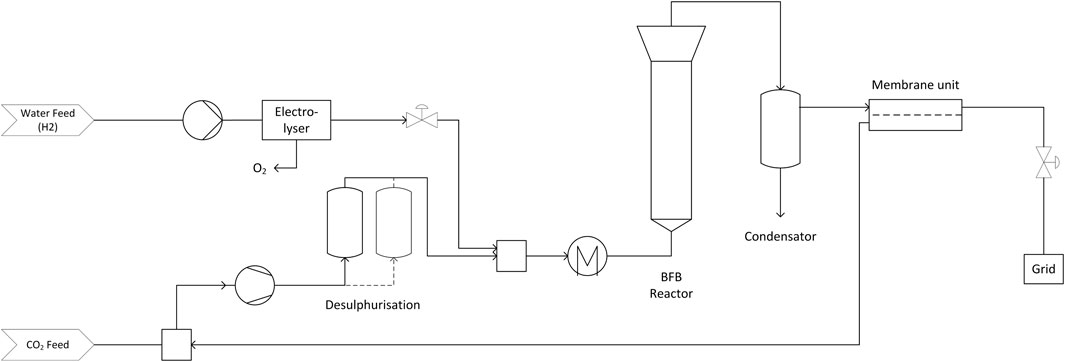
FIGURE 2. Process chain for bubbling fluidised bed methanation of CO2 using a PEM electrolyser as hydrogen source.
In order to avoid coking and subsequent deactivation of the catalyst, an over-stoichiometric ratio of H2/CO2 of 4.01 is fed to the reactor. The product gas of the reactor is led to a heat exchanger and a condenser, which allow the valorisation of the off gas heat and removal of product water. The heat removed in these units is used to pre-heat the feed streams of CO2 and H2.
The heterogeneous methanation reaction is limited by the thermodynamic equilibrium, which results in hydrogen concentrations of more than 2 vol.-% in the dry product gas. In order to fulfil grid injection limitations, excess H2 has to be removed to allow the use of the biomethane in CNG cars whose tanks are certified for 2% H2 fraction at maximum. As previous work showed, membrane separation can be a cost efficient way to do so (Witte et al., 2018a). We implemented a counter-current hollow fibre membrane upgrading system to obtain full grid compliance. The resulting H2-rich recycle stream, which also contains CH4 and CO2, is fed to the CO2 feed stream before the main compressor. This recycle stream directly influences the gas composition in the reactor feed, which demands an adjustment of the CO2 feed stream in such way that the required H2/CO2 is fulfilled.
2.1.3 Cases C1S and C6S: Bubbling Fluidised Bed Methanation With High Temperature Electrolysis (SOE-BFB)
This case represents a modification of the previous system: the PEM electrolyser is replaced by a high-temperature solid oxide electrolyser system. This allows the comparison of the cost structure, when BFB methanation is combined with an SOE system. Instead of liquid water, steam is used for electrolysis, which allows the provision of heat by an external heat source. The stack itself can be operated at a thermoneutral voltage, where the heat flux from the stack is zero (Giglio et al., 2015). This allows a very high electrical efficiency of the stack, as a part of the energy for the electrolysis is provided by the thermal energy of the steam (Buttler and Spliethoff, 2018). In this study, a stack efficiency
Such SOE systems are under experimental investigation in pilot scale, such as in the Helmeth project (2021). In this project, a hot-box is used to keep the temperature of the stack constant and to allow heat integration between the feed streams and hot product gas streams. Furthermore, this box allows the pressurisation of the sensitive high temperature components and enables an operation pressure up to 15 bar Helmeth project (2021). For this work, a similar design is assumed, where heat exchangers allow the pre-heating of the feed water and superheating of the steam by the product gas streams (H2 + H2O and O2). The heat required for evaporation of the feed water is provided by the off-heat from the methanation reactor.
Instead of scaling this process by the electrical input, the electrolyser was scaled by the same hydrogen output as in the previous cases. This allows a direct comparison of the plant cost structure and indicates the benefits of including a SOE system in the methanation process.
All other process units are designed the same way as in case PEM-BFB.
2.2 Main Models
2.2.1 Bubbling Fluidized Bed Reactor
This work considers an internally cooled, bubbling fluidised bed reactor with a nickel-based methanation catalyst. The model of this unit is based on a pseudo-homogeneous two-phase approach according to Kopyscinski et al. (Kopyscinski et al., 2011), which applies hydrodynamic correlations of freely bubbling fluidised beds. This model was already modified and used in previous studies by Witte et al. (Witte et al., 2018b). A more detailed description can be found in the Supplementary Material.
The reaction kinetics implemented in the reactor model are expressed as Langmuir-Hinshelwood-type rate equations. The kinetics of CO2 methanation are expressed as a water-gas-shift (WGS) reaction coupled with CO methanation as shown in Eqs 4, 5:
The temperature dependence of rate and adsorption coefficients are based on the Arrhenius and Van’t Hoff approach according to Eqs 6, 7:
The values of kinetic parameters are listed in Supplementary Table S1.
Hydrodynamics in the reactor is the second main influence on the performance. This influence is expressed through bubble size correlations, from which bubble rise velocities and the bubble hold-up
A variety of bubble size correlations exist in literature, but they are only valid for conditions with no heat exchanger internals present in the reactor. Therefore, the bubble growth correlation with the smallest overall bubble size
As shown in Eq. 8, the bubble diameter
The reactor model is based on the following assumptions:
- Steady-state conditions and ideal gas behaviour
- No reaction in the bubble phase
- Laminar boundary layers around the catalyst particles and influence of pore diffusion are neglected. Therefore, the gas concentration in and on the particles equals the dense phase concentrations.
- Radial gas concentrations are neglected
Catalyst deactivation is not considered in the model. The economic analysis includes an annual replacement of the full catalyst load in order to compensate for minor deactivation effects. Field experiments showed that a stable operation of fluidised bed methanation in biogas is possible for more than 1000 h (Calbry-Muzyka et al., 2019; Witte et al., 2019). In order to account for deactivation effects and the additional reactor height needed for particle settling, the reactor height and catalyst mass was multiplied by a design factor of 1.5 prior to cost calculations.
2.2.2 Biological Methanation Reactor
Data published by Inkeri et al. (Inkeri et al., 2018) was used to estimate the process performance in the work presented here. The study chose the scale of well-known demonstration projects for methanation, namely the Danish BioCat project (Electrochaea.dk ApS, 2014), the Audi e-gas project (Specht et al., 2016) in Germany, as well as a large electrolysis plant in Finland, which is not considered in this work. The BioCat project consists of a biological methanation reactor, which is fed by a 1 MWel electrolysis unit. The Audi e-gas project is a pilot plant consisting of a fixed bed methanation reactor in the 3 MWCH4 scale.
The work of Inkeri et al. estimates the gas-liquid mass transfer by a lumped mass transfer coefficient, taking into account the reactor height, stirring energy and stirrer geometry. Furthermore, the influence of physical properties of gas and liquid phase components on the bubble size and subsequently the gas-liquid mass transfer are approximated. This approach, based on simplified fundamental equations describing physical phenomena allows a scale-up of the reactor model.
Inkeri et al. verified the scale-up of their model using estimated dimensions of the plant in Avedøre (Denmark). In the meantime another pilot plant by the same technology was operated in Solothurn (Switzerland) as part of the Store&Go-project (Store and Go Project, 2016b). This plant was designed for a hydrogen input corresponding to a 700 kWel electrolysis unit, which required a vessel volume of around 7 m3. Furthermore, a second biological methanation plant of 2.5 MWel is currently under construction in Switzerland. This plant uses the technology of microbEnergy (microbEnergy GmbH, 2019), which is also based on a stirred bubble column, but makes use of strains of microorganisms already present in the waste water treatment plant. Limited technical information is accessible, but based on the available illustrations, we estimate the reactor size to around 45 m3 (Limeco, 2020). These values indicate that the dimensions given by Inkeri et al. are in a valid range for such systems.
Biological systems, where substantial gas formation occurs in the liquid phase, tend to form large amounts of foam. This foam formation has to be minimised, as it can cause severe problems in the downstream part of the plant. Usually, anti-foaming agents are added to the slurry and technical equipment for de-foaming is used (Store and Go Project, 2016a). These measures are beyond the scope of this work, nevertheless, we assumed an additional 2 m of reactor height for foam protection.
The data used is summarized in Table 2.
2.2.3 Hollow Fibre Gas Separation Membrane
For the gas separation unit required for the removal of excess hydrogen after BFB methanation, a rate-based model from literature was implemented. Makaruk et al. published an algorithm simulating a counter-current hollow fibre membrane (Makaruk and Harasek, 2009). This algorithm is based on an iterative finite difference Gauß–Seidel method. A more detailed description can be found in the Supplementary Material.
The counter-current membrane model is based on the following assumptions:
- Ideal gas behaviour
- Axial dispersion is neglected
- Pressure drop on bore and shell side is neglected
- The influence of the gas composition on the permeability is neglected. Therefore, the permeability parameter is set constant.
In this work, a constant value for membrane permeance is introduced, based on the commercial polymer type Matrimid. Permeability data for the relevant species were taken from Zhang et al. (Zhang et al., 2008). Since there was no permeability determined for water, we assumed it to be equal to the permeability of hydrogen. This is justified by other commercial biogas upgrading membranes, which indicate a higher permeability for water than for hydrogen (Evonik Industries AG SEPURAN, 2021). In order to obtain the permeance parameter, the permeability has to be divided by the effective thickness of the separation layer. The actual separation layer is only a fraction of the wall thickness of the membrane fibre and has to be estimated for this case. These thicknesses range from 500 to even less than 100 nm (Baker, 2002). In this work, we assumed the effective thickness to be 100 nm.
2.2.4 Auxiliary Units
For all auxiliary process units, short-cut models are used, which are based on correlations (Witte et al., 2018b).
For the PEM electrolysers, a specific electricity consumption of 4.6 kWh/m3 (H2, NTP) is considered, which is an average value for PEM and alkaline technology (Buttler and Spliethoff, 2018). This value corresponds to an efficiency of 65% (LHV). The data used to calculate the stack performance of SOE is given in Table 3.
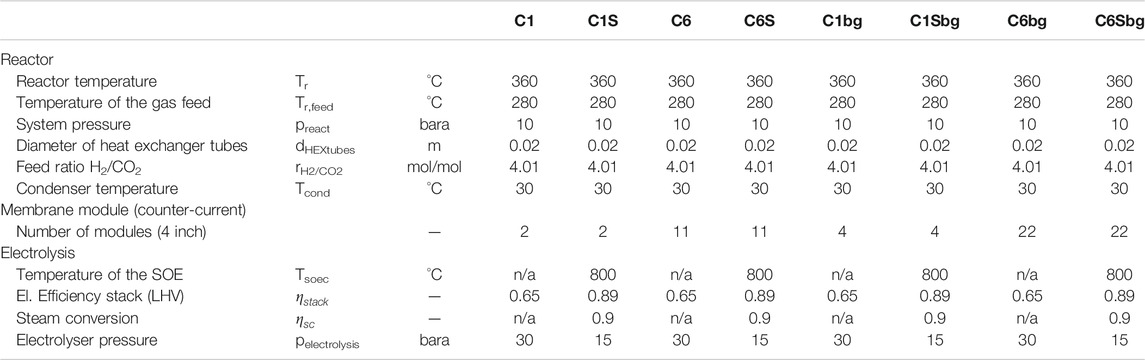
TABLE 3. Input parameters for the bubbling fluidised bed-based processes for CO2 methanation, including the parameters for the sub-systems reactor, membrane upgrading and electrolyser.
The TSA unit is based on a zeolite sorbent with a maximum capacity of 0.15 kgH2O/kgsorbent. A cycle time of 8 h and a regeneration temperature of 200°C is assumed.
For the desulphurisation after the biological methanation and in the feed of the BFB methanation, we assume an inlet concentration of 50 ppm H2S. Vessel size calculations are based on a conservative maximum load of 7 wt.-% H2S on the sorbent. Further data is based on the commercially available sorbent Sulfatrap R7 (Calbry-Muzyka et al., 2019).
Pumps and compressors are based on thermodynamic correlations, with an electrical efficiency of 0.8.
The heat exchanger equipment was sized based on heat transfer coefficients available as correlations for different systems (Ulrich and Vasudevan, 2004). The exchangers are assumed to be shell and tube systems in counter-current operation.
All volumetric flow rates reported in this work refer to standard conditions at 1 atm and 0°C according to DIN 1343 (DIN, 1990).
2.3 Cost Calculations
The comparison of the cost structure of the three processes is performed by determining the operational cost (OPEX) and capital cost. Based on the technical performance and size of the units, cost functions for the units are applied, which were obtained from Ulrich and Vasudevan (Ulrich and Vasudevan, 2004) and already part of previous work (Witte et al., 2018a). These functions have the following structure:
The bare module cost
In order to obtain the investment cost
The investment cost also include a factor FCEPCI, which quantifies the cost increase of equipment (Ulrich and Vasudevan, 2004) according to Eq. 11. It consists of the Chemical Engineering plant cost index (CEPCI, I2019), listed in Supplementary Table S3. The reference value Iref(2004) was 400 in 2004 (Ulrich and Vasudevan, 2004).
The annualised capital expenses (CAPEX,
The cost for the nutrient solution for biological methanation was estimated based on a total nutrient concentration of 2 g/L of slurry (Rachbauer et al., 2016; Rusmanis et al., 2019). In case of an artificial nutrient solution fed to the reactor, this growth medium has to be mixed from a variety of chemicals at an estimated cost of around 20 €/kg. We therefore estimate the cost for growth media provision to around 40 €/m3. Alternatively, the reactor can also be supplied with digester efflux, which provides all necessary nutrients (Ullrich and Lemmer, 2019). Nevertheless, also the integration of such a waste stream and its conditioning is associated with certain costs, which may be in a similar range as shown above.
For the membrane unit, a module geometry of 1 m length and 4″ diameter is considered. This corresponds to a commercial biogas upgrading membrane. A 2″ version of such a module was tested in previous work for its capability for hydrogen recycle in Power-to-Gas applications (Gantenbein et al., 2021). The separation area of this module was estimated to be around 65.12 m2, which corresponds to a fourfold area of the 2” module (Witte, 2018). The module consists of a cartridge fixed into a tubular, pressure-resistant case, which itself provides all the connections to the plant. The cartridge contains the hollow fibres and is sealed with a resin. Due to ageing effects, the cartridges have to be replaced after a certain time interval. The replacement cost were obtained from Ulrich and Vasudevan (Ulrich and Vasudevan, 2004), which indicate 50 $/m2 in 2004. As the cartridges also maintain pressure and require specialised sealing, we assumed a twice as high cost for the membrane material. Considering the CEPCI, this cost is 126 €/m2, which is in a similar range as a quote obtained by a supplier. This cost refers to the replacement cost of the membrane cartridge, which does not include further installations. We consider this replacement cost as operational expenses, analogously to sorbent and catalyst replacement cost. For the initial installation cost of the membrane modules, we consider the same amount, but include also the plant cost factors.
For the two methanation reactor types, a detailed cost analysis was performed, based on the reactor vessel itself, as well as the auxiliary units required for operation and heat utilisation. For the fluidised bed system, this includes the cooling cycle, the internal heat transfer tubes and a vessel for catalyst activation as already used by Witte et al. (Witte et al., 2018a). The biological system also includes an external cooling system, internal cooling coils, which also serve as baffles, as well as the multi-stage stirring system.
3 Results and Discussion
All process options evaluated produce biomethane which is ready for grid injection at a level of 10 bar (absolute). The input parameters were taken from the publication of Inkeri et al. (Inkeri et al., 2018) in the case of biological methanation, or based on previous work of Witte et al. (Witte et al., 2018b; 2018a) for BFB methanation. Compared to the earlier studies, the input parameters for the BFB cases were slightly modified to result in a process which is comparable to the biological one. These were namely the BFB reactor temperature (360°C) and the system pressure (10 bar). Nevertheless they are in a comparable range to the optimal conditions reported by Witte et al. A summary of the input parameters for the process simulations can be found in Table 3. The values obtained from the process simulation are given in Table 4; Supplementary Table S4. Based on these parameters, further cost analysis was performed.
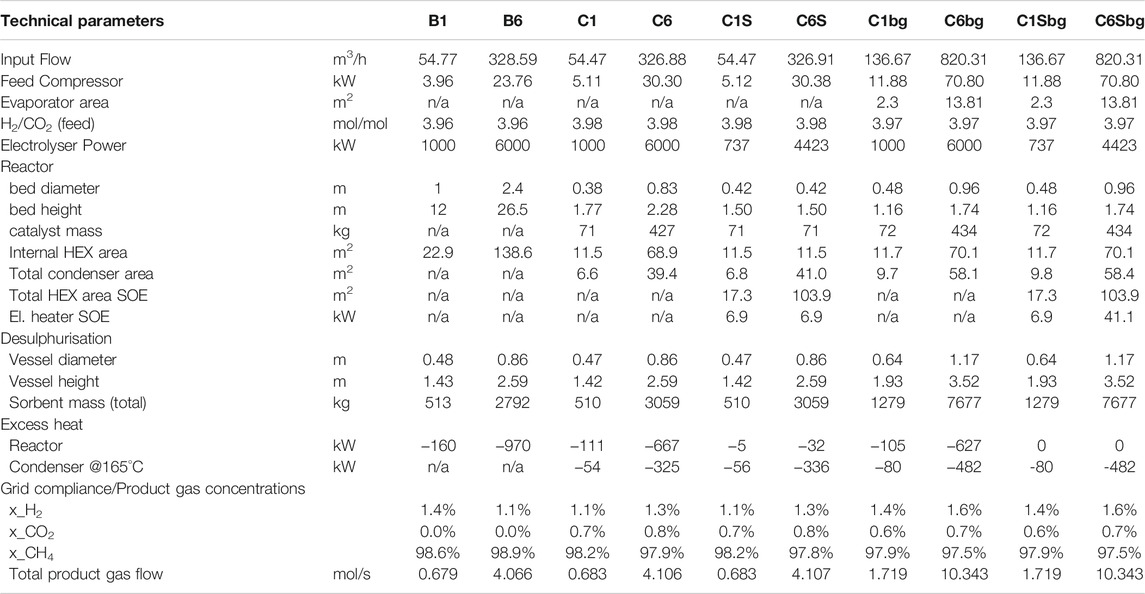
TABLE 4. Technical data for the considered processes. The processes marked with “bg” are operated using biogas as feed.
For each process, investment cost, operation cost and revenues from gas and heat sales are determined. The costs are grouped according to system compartments. The H2-path contains the electrolyser and required water feed. In the main reactor section, the main vessel is considered as well as all units and heat exchanger equipment, which are required to remove the reaction heat. In the case of biological methanation, this also includes the stirrer. Membrane upgrading is required to ensure grid injection compliance and is only needed in the case of BFB methanation. The membrane upgrading also removes water, which replaces TSA drying in the BFB cases. As supporting modules, the units required for grid injection are considered, i.e. process analytics and gas odorisation. These units are assumed to be independent of methanation technology and scale. The cost for external heat exchanger equipment considers the equipment required for heat integration between feed gas and product gas (condenser). In the case of high temperature electrolysis, this also includes the heat exchangers required to recover the off-heat of the SOE stack and pre-heat feed steam. For the biogas cases, a water evaporator is considered to add steam to the feed gas. This steam is required to reduce catalyst stress due to the high methane content.
3.1 Heat Integration
The high-temperature BFB methanation processes presented here allow two ways of heat utilisation: The pre-heating of the feed gases using the off-heat of the water condenser and in the case of high-temperature electrolysis the steam generation via the use of off-heat from the reactor. The second option was justified via pinch point analysis, as shown in Supplementary Figure S1. The cold streams (blue) correspond to the heat requirement of the feed water to the electrolyser. Water enters the plant at 20°C and is heated to 193°C, which corresponds to the vaporisation temperature at the operation pressure of 15 bara. The heat requirement in the evaporator is indicated by the horizontal part. The steam is then superheated to the operation temperature of the electrolyser. The last 50 K of temperature increase have to be provided by an electrical heater, whose energy demand is indicated by a horizontal shift of the curves. This point also corresponds to the minimal temperature approach of the hot and cold streams, which was set to 50 K. The hot streams correspond to the combined heat provision by the product gas streams from the electrolyser (hydrogen and oxygen). Specialised heat exchanger equipment is necessary to valorise the heat of both gases efficiently. Concepts for such equipment are under development (Flaviana et al., 2016).
The hot streams (red) correspond to the product gas streams cooled to 60°C. In the first step, the hot product gases are cooled to 287°C, where the freed enthalpy is used to superheat the incoming steam to 750°C. The reactor provides heat at a temperature level of 287°C, which is sufficient in quality and quantity to provide heat to the evaporator. Subsequently, the product gases are further cooled by the incoming water feed. Part of the steam remains in the hydrogen product gas, as it is not fully converted in the electrolyser. This steam is condensed at a temperature level of 193°C, visible as small horizontal part in the hot composite curve (red). The remaining cooling duty can be provided by air cooling, which is not further discussed in this work.
The reactor analysed in this work is cooled by a thermo-oil system and internal heat exchangers. This cooling system is directly connected to the evaporator providing an efficient heat transfer. The remaining heat after the water evaporation can be further utilised at a temperature level of around 280°C. Other concepts combining fixed bed methanation with high-temperature electrolysis make use of direct, internal steam generation in the reactor (Giglio et al., 2018; Dannesboe et al., 2020). In order to provide an efficient heat transfer, the water has to be kept in a boiling state. Depending on the reactor temperature, this requires high operation pressures, which increases equipment cost substantially and decreases cost efficiency.
As shown in this pinch point analysis, the heat provided by the off-gas streams and the reactor is sufficient to produce and superheat the steam required for the high-temperature electrolysis. Additional electrical heating is necessary to reach isothermal conditions in the stack. Nevertheless, the corresponding electrical energy demand represents only a small share of the total electrolyser power.
3.2 Investment Cost
As shown in previous work (Witte et al., 2018a), the investment cost of Power-to-Gas systems are highly dominated by the electrolyser cost. The cases considered in this work are shown in Figures 3, 4 and summarised in Supplementary Table S5. The hydrogen path contributes to at least 50% of the total cost in case of 1 MW biological methanation, and to up to 92% in the case of BFB methanation with 6 MWeq SOE. This extreme originates mainly in the high assumed cost for the SOE stack in the base-case. Nevertheless, even in the case of a commercial PEM electrolyser, the cost share amounts to 69% in the 1 MW and 86% in the 6 MW scale.
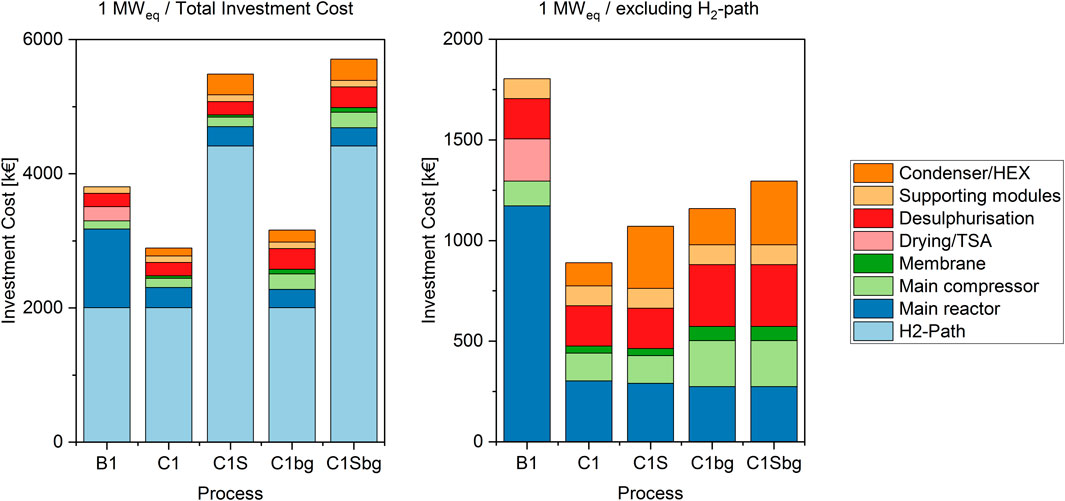
FIGURE 3. Investment cost structure in the 1 MWel cases. The left hand side shows the total investment cost including the H2-path, the right side shows the cost structure of the methanation equipment only.
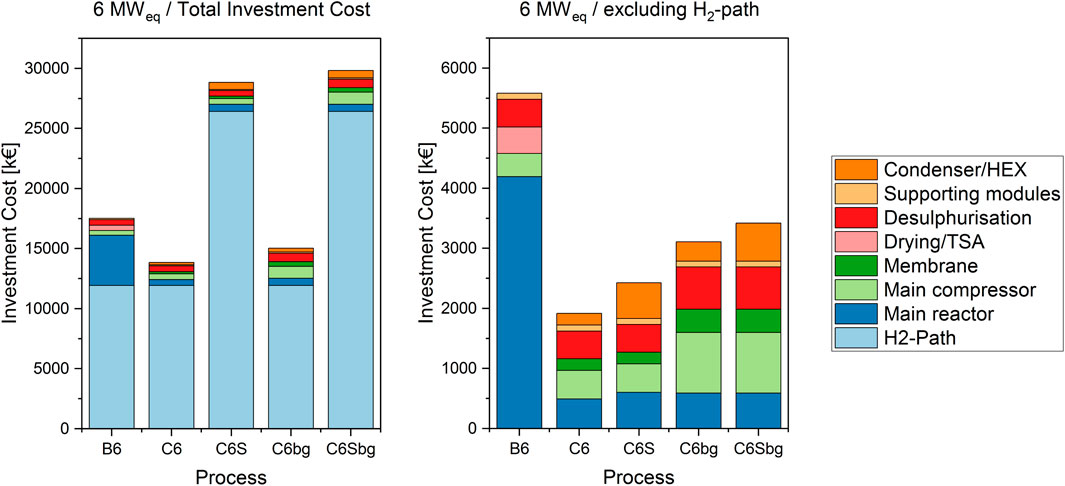
FIGURE 4. Cost structure of the 6 MWeq cases, including the H2-path (left) and focused on the methanation equipment only (right).
When a Power-to-Gas plant is in planning, two main considerations can be identified: An overall cost analysis for a newly installed plant, or a retrofit project, where the decision between methanation technologies has to be taken. In the first case, the hydrogen path has to be included in the considerations. For the second case, as the hydrogen path is identical for all methanation technologies, it can be excluded from the consideration. In some of these cases, existing electrolyser units are retrofitted with PtG equipment. It is therefore important to compare technologies based on total investment cost, as well as only based on methanation equipment cost.
The second-largest share of investment cost is the reactor vessel itself. As shown in previous work (Inkeri et al., 2018) and pilot plant projects, biological methanation requires a large reactor volume to produce utility-scale biomethane. This is also represented in the data discussed in this work, as for the operation with pressurised hydrogen and potentially corrosive slurries, i.e. CO2 dissolved in water, a pressure resistant stainless steel tank is required. Although BFB methanation needs a smaller reactor volume, it also requires pressure and corrosion resistance at high temperatures. Nevertheless, mainly due to the size difference, the investment cost for the BFB vessel is less than a third of the cost of the bioreactor.
The data provided by the simulations of Inkeri et al. indicate a methane evolution rate of 168 vvd in the 1 MW case and 70 vvd in the 6 MW case, based on the reactor sizes given in Table 2. Other biological reactor concepts are available and under investigation (Rusmanis et al., 2019). For fixed film reactors, which include trickle bed reactors, the projects reported by Rusmanis et al. show an average methane evolution rate of around 18 vvd (Rusmanis et al., 2019). Compared to the total methane formation in CSTR systems, such rates would result in large vessel sizes. Even though these reactors are operated at atmospheric pressure, such volumes will result in high investment cost for the main reactor, exceeding the system considered in this study. The demonstration project ORBIT is a trickle bed reactor operated at pressures up to 12 bar, but also here, a methane formation rate of only 8.4 vvd is reported (Thema et al., 2021). This indicates that further development towards higher methane formation rates is necessary.
For catalytic BFB methanation, a larger main compressor is required than for biological methanation, since the membrane upgrading unit creates a recycle stream, which increases compression duty.
A further cost factor in the BFB-based processes is the heat exchanger equipment required for utilisation of the product gas stream and subsequent integration with the feed gas stream. This cost is not considered in the bioreactor, since the latter is operated at a low temperature level, which results in a low water content in the product gas. In the case with SOE electrolysis, more exchangers are required for heat management in the electrolyser. In the 1 MW-case, this doubles the cost for heat exchanger equipment compared to the PEM-BFB case, for the 6 MW-case this results even in a three-fold increase.
In addition to the CO2 base cases, the process was furthermore simulated using biogas as carbon source. The feed stream was adjusted to match the CO2 content with the electrolyser power. This results in a 2.5 times higher total feed flow rate than in the pure CO2-cases due to the additional methane. This higher total flow rate causes a cost increase of the supporting units, namely the compressor and desulphurisation. The reactor cost on the other hand is almost not affected. As the absolute amount of CO2 remains identical, the same amount of catalyst is required for the methanation unit. Furthermore, the internal heat exchanger area remains equal, as the same reaction heat has to be dissipated. The gas composition itself has therefore less influence on the reactor dimension and subsequently on the corresponding investment cost than on the supporting units.
Rough estimates for plant scaling are obtained by relating the capacity increase of equipment to the cost increase by an exponential law according to Eq. 13 (Tribe and Alpine, 1986):
Such scaling exponents are obtained for all three processes and listed in Table 5. For the electrolyser we assumed a linear relationship of cost to the rated power, implying that there is no economy of scale applicable. Again, due to the dominance of the expenses for the H2-path, this somewhat conservative assumption has a high influence on the scaling exponent. For the total plant, the exponent is close to unity. When only the methanation plant is considered, the exponent for the biological system is close to 0.6, which is a common rule of thumb value for the scaling of vessels and therefore reflects the dominance of the cost for the reactor vessel. The scaling exponents for the catalytic system are in the range of 0.4–0.5, which implies that there is a strong decrease in specific expenses with increase of the scale.
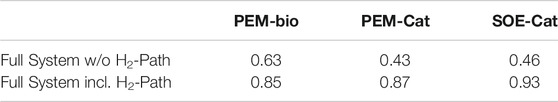
TABLE 5. Scaling exponents for the considered methanation processes.
The annualised capital cost is calculated according to Eq. 12.
The specific investment cost for the biological methanation without the hydrogen path amount to 2975 €/kW in the 1 MWel-case (B1) and 1538 €/kW in the 6 MWel-case (B6), related to the energy output of the produced biomethane. Schlautmann et al. (Mörs et al., 2020; Schlautmann et al., 2021) estimate the specfic investment cost for the pilot plant in Solothurn, which corresponds to a biomethane output of 0.325 MW, to 4320 €/kW. They furthermore provide estimates for specific investment cost for plants scaled to 1 MWbiomethane and 5 MWbiomethane, which amount to 2172 €/kW and 940 €/kW. In Supplementary Figure S2, the estimates of the Store&Go project are compared to the results provided in this study. Although the estimates provided in the current study fit well within the estimates reported by Schlautmann et al., they are slightly more conservative. Especially the value for the larger plant size indicates that the cost-related scaling factor provided in this study is lower than the one by Schlautmann et al. It is difficult to assess such differences in detail, as the full cost assessment and detailed methodology of the Store&Go project is not known to the authors.
3.3 Operational Expenses (OPEX)
The annual operational expenses for the processes are shown in Figures 5, 6 and summarised Supplementary Table S6.
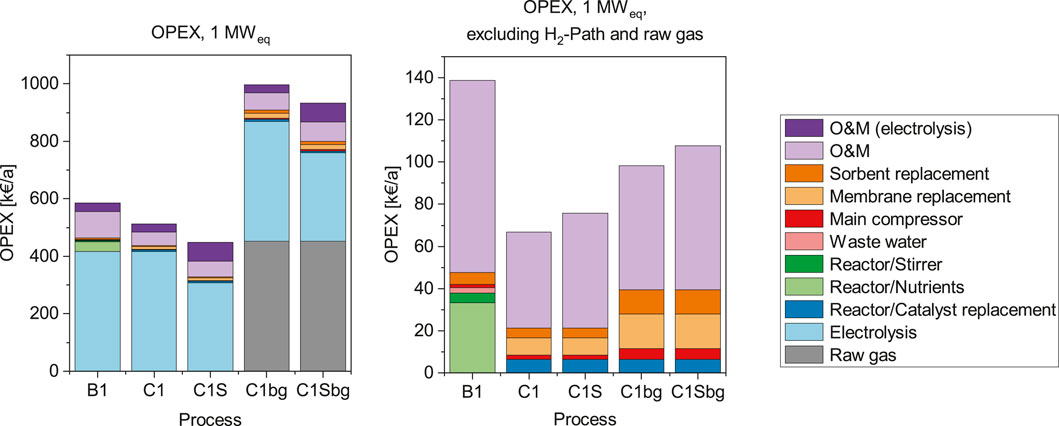
FIGURE 5. Operation cost (OPEX) of the 1 MWel processes in k€ per year. The OPEX including the H2-path are shown on the left, the right side shows the cost structure without the H2-path and the corresponding O&M cost.
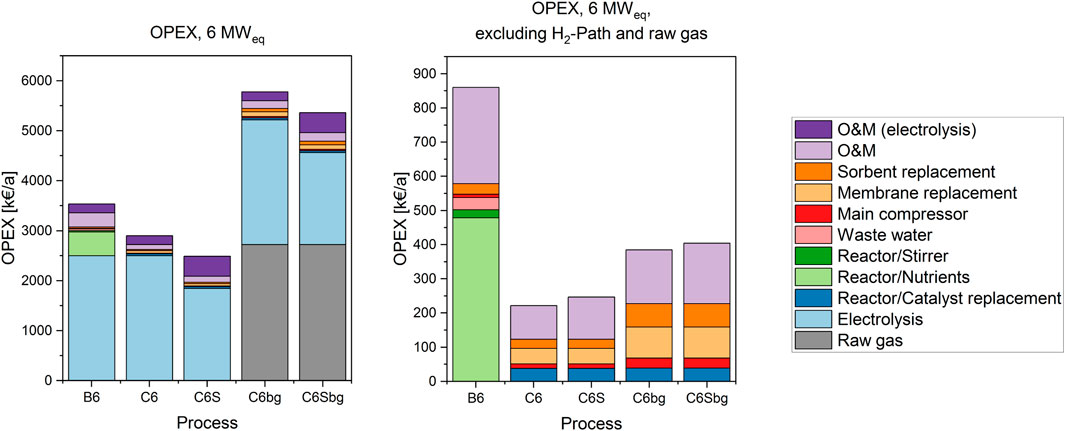
FIGURE 6. Operation cost (OPEX) of the 6 MWel processes in k€ per year. The OPEX including the H2-path are shown in on the left, the right side shows the cost structure without the H2-path and the corresponding O&M cost.
The obvious main driver for operational cost of the Power-to-Gas process is the electricity cost. In both scales, the cases PEM-Bio (B1 and B6) and PEM-BFB (C1 and C6) are comparable in terms of electricity consumption. The SOE introduced in cases C1S and C6S has a higher electrical efficiency, which can be considered as a reduction of electricity use per hydrogen produced.
The annual operation cost also includes labour and maintenance cost (O&M), which are estimated by 1.5% of the investment cost for the electrolyser and 5% of the total investment cost for the rest of the plant. This differentiation takes into account that electrolysers do not have any moving parts and require therefore less servicing. Due to the dominance of electrolyser costs, the O&M costs are also separated in two parts.
When excluding the H2-path in this analysis, the main contribution to the OPEX is the O&M cost for the rest of the plant. The actual consumables and utilities used in the process amount only to around one half of the remaining OPEX. For the biological methanation, the largest share of its OPEX are related to the nutrient cost. In the BFB processes, the largest contribution comes from the bi-annual membrane replacement, followed by the catalyst replacement, which occurs on an annual basis. According to our assumptions, the nutrient provision cost are around 4 times higher than the annual catalyst replacement cost in the 1 MW catalytic case. For the 6 MW case the amount increases tenfold. The amount of nutrients required scales with the volume of the biological system, subsequently there is a disproportionate increase compared to the energy scale.
The stirring power required for the bioreactor amounts to 0.9–1.1% of the electrolyser power, as shown in Table 2. This corresponds to less than 1% of the total OPEX, but remains in a similar range as the cost caused by other supporting units, such as the main compressor and sorbent replacement costs.
Nevertheless, when including the H2-path in the calculation of the pure CO2 cases, the costs for utilities and consumables are marginal. The cost for the H2-path, including the corresponding O&M expenses make up 76–92% of the total.
The charges for membrane replacement have a direct influence on the OPEX, however it represents only a minor part of the total OPEX. Therefore, the sensitivity towards the replacement interval is only low. An annual replacement would double the share of membrane replacement cost compared to the base-case represented in Figures 5, 6.
The total OPEX for catalytic methanation operated with biogas are almost twice as high as in the corresponding base cases. The additional cost originates from the price paid for the raw biogas, which can be considered as an opportunity cost for biogas upgrading through an alternative method. Apart from the increase of the total OPEX, the influence on the OPEX related to the methanation equipment is also visible: Due to higher gas throughput, the electricity consumption of the compressor increases, as well as the amount of sorbent required each year. Additionally, the membrane replacement cost approximately doubles. Although roughly the same amount of CO2 and H2 has to be separated from the product gas stream a larger amount of membrane modules is required. The increased number of modules compensates for the higher total gas flow rate, as the permeation rate of CO2 and H2 remains constant.
3.4 Revenues and Production Cost
The energy content of the biogas injected to the grid is determined according to Eq. 14 from the higher heating values of the species CH4 and H2.
The total revenues from biogas sales are then obtained by multiplication with the biogas selling price. The heat revenues are calculated by considering the high and mid temperature level off-heat. In order to account for heat losses in the heat extraction equipment, we assumed that only 70% of the heat produced can be sold. The specific production cost per kWh of gas injected to the grid are calculated by dividing the total annual cost of the plant (OPEX + CAPEX) by the biogas sales. The values obtained for the different processes is summarised in Supplementary Table S7.
The absolute production cost per kWh of biomethane injected to the grid are indicated in Figure 7. The values correspond to the base-case scenario represented by the input parameters in Supplementary Table S3. For this case, neither of the pure CO2 processes can be operated economically. Using biogas as feed reduces production cost by around 26–39%. This causes the two PEM-based catalytic processes to reach a profitable range (cases C1bg and C6bg) at a production cost of 10.2 and 9.5 €-ct./kWh. The process including high-temperature electrolysis is right at the profit margin at a scale of 6 MW.
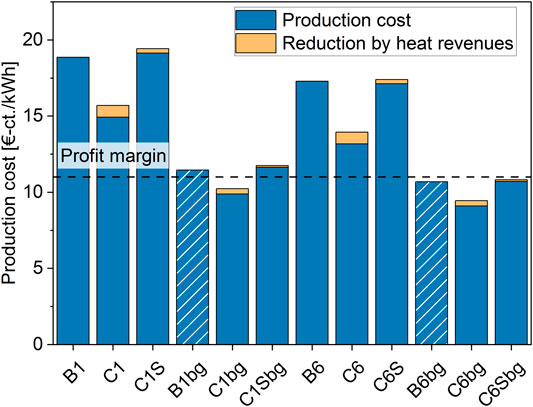
FIGURE 7. Production cost of biomethane for each considered process under the base-case assumptions indicated in Supplementary Table S3. The projected cost for biological methanation operated with biogas is indicated with shaded bars.
As we have no full model for biological methanation available, the production cost for biological methanation (cases B1 and B2) using biogas were projected as shown in Figure 7. The analysis of the investment and operation expenses showed that for the catalytic cases, the change of the feed gas to biogas does hardly affect the cost related to the reactor but increases the expenditures for auxiliary units. We therefore assume that approximately the same cost decrease occurs for the biological system as for the catalytic technology. Even though there is a significant step towards profitability possible, the margin is not yet reached under base-case assumptions.
The 1 MW-scale SOE-BFB process has the highest production cost, mostly caused by high investment cost for the SOE stack. The cost decreases with scale, but remains the highest among the technologies. When switching to biogas methanation, the production cost decreases by 39%, which is the highest relative decrease among the technologies. This is a result of the higher electrical efficiency of the SOE stack, which reduces the relative OPEX due to lower expenses for electricity while still producing the same amount of biomethane.
For both feed gases, the 6 MW PEM-BFB case indicates the lowest production cost, which is a result of scaling effects, lower-cost electrolyser technology, as well as a small reactor size. Therefore, switching the technology from biological methanation to BFB-based technology can lead to a cost reduction of 17% (1 MW) and 19% (6 MW) in the case of pure CO2 methanation. When using biogas, this benefit even increases to 24% (1 MW) and 26% (6 MW).
A further decrease of production cost is achieved by valorizing the process heat. For the PEM-BFB cases a cost reduction of around 5%, and for the SOE-BFB cases a reduction of around 2% is possible. The latter cases do have a limited heat output due to the heat requirement of the SOE. Furthermore, when biogas is used only very limited heat sales are possible, as part of it is redirected to feed water evaporation. The valorization of the oxygen produced in the electrolysis would be another opportunity to decrease cost. However, this is challenging to realize at most sites and is therefore not considered in this work.
3.5 Sensitivity on Electricity Price and SOE Investment Cost
The electricity cost states the largest influence on the operation cost of the processes. The base-case used above is based on an electricity price of 5 €-cts./kWh. This value is comparable to the production cost of wind and large-scale photovoltaic electricity (Bauer et al., 2017). Figure 8 indicates the production cost for each process as a function of the electricity price. The profit margin corresponds to the selling price of renewable gas indicated at 0.11 €/kWhbiomethane. As shown in Figure 7 for the pure CO2 cases, the 6 MW PEM-BFB case shows the lowest production cost and therefore reaches profitability at the highest electricity cost of approximately 3.2 €-cts./kWhel. The corresponding 1 MW-case with the second-lowest production cost reaches profitability at 2.2 €-cts./kWhel, whereas the larger-scale biological methanation process requires an electricity price as low as 1.2 €-cts./kWhel to reach the profit margin. The 1 MW-scale biological process only reaches a profitable range when electricity is provided at 0.3 €-cts./kWhel. The performance of the SOE-based processes is inferior, as no profitability is reached, even if no electricity cost is considered. Nevertheless, it is notable, that the SOE-based processes are less sensitive towards electricity cost, i.e. the production cost do not rise as fast with the electricity price as in the PEM-based cases. This is a direct consequence of the higher efficiency of the SOE stack and the heat integration with the BFB reactor.
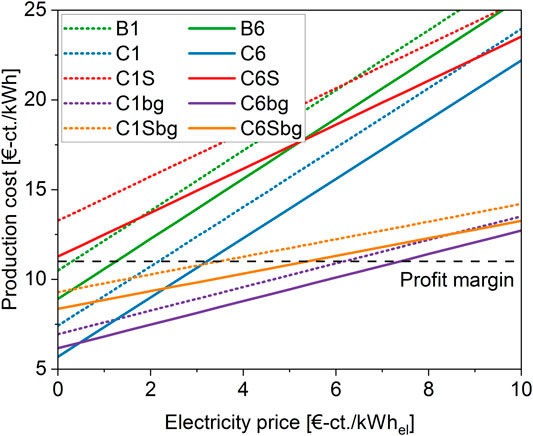
FIGURE 8. Production cost in cents per kWh of biomethane as a function of the electricity price for each considered process. The profit margin is indicated as line at 11 €-ct/kWhbiomethane, which indicates the selling price for renewable gas.
Biogas as feedstock increases the total amount of methane produced per kWh of electricity. Generally, the processes are therefore less sensitive towards the electricity price than in the case of pure CO2 methanation. This can be seen in Figure 8 by a decreased slope of the corresponding lines. The 6 MW-scale PEM-BFB process reaches profitability at 7.4 €-cts./kWhel and at 6.2 €-cts./kWhel in the 1 MW case. Lower, but still above the pure CO2 processes, the methanation with high temperature electrolysis reaches the margin: At 5.4 €-cts./kWhel for the 6 MW case and 3.5 €-cts./kWhel for the 1 MW scale, respectively.
In order to make the SOE-based processes profitable, the investment cost and subsequent CAPEX for the SOE stack have to decrease considerably. Schmidt et al. (Schmidt et al., 2017) estimate the cost for the SOE technology to be in a range of 3000–1900 €/kWel in the year 2030, depending on R&D funding and production scale. This is still around three times as high as their estimate for PEM electrolysers. Figure 9 shows the influence of the investment cost of the SOE stack on the production cost of biomethane. Electricity prices of 5 €-cts./kWhel or 2.5 €-cts./kWhel are taken into account.
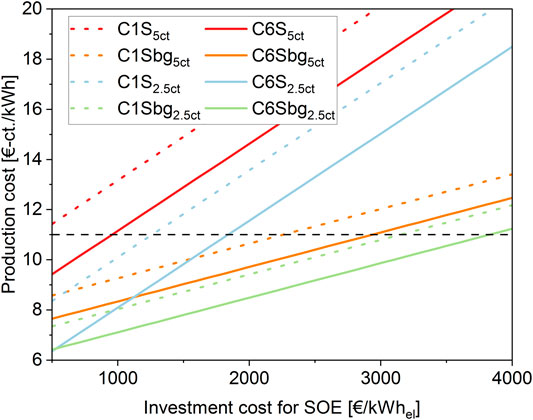
FIGURE 9. Production cost in €-ct/kWhbiomethane of the SOE-based processes as a function of investment cost for the SOE stack. Two different electricity prices are considered: 5 €-ct/kWhel and 2.5 €-ct/kWhel.
Depending on the feed gas, two further cost ranges can be identified: The case for pure CO2 methanation and the case for direct methanation of biogas. As in the latter a larger amount of methane is fed to the grid based on the same nominal power of the electrolyser, biogas methanation has a higher profitability range and allows for higher investment cost for the electrolyser. For the same reason, the production cost for direct methanation is less sensitive towards the electrolyser investment cost and the corresponding lines appear with a reduced slope in Figure 9.
As shown in Figure 7, the two SOE-based processes for CO2 methanation exhibit production costs of 19.4 €-cts./kWhel for the 1 MW-scale and 17.4 €-cts./kWhel for the 6 MW-scale respectively. To reach a profitable range, the production cost has to be reduced to below 11 €-cts./kWhel. As shown in Figure 9, for the higher electricity price this will be at investment costs lower than 500 €/kWel for the 1 MW case and lower than 960 €/kWel for the 6 MW-scale. This is a very ambitious cost decrease, nevertheless, under favourable circumstances, a capital cost lower than 1000 €/kWel in future is considered possible (Schmidt et al., 2017; Adam Christensen, 2020). Literature indicates that capital cost for SOEs may adjust to a similar range as PEM or AEC technology (Schmidt et al., 2017; Buttler and Spliethoff, 2018). A halving of the electricity cost to 2.5 €-cts./kWhel results in an increase of the allowed investment cost in the 1 and 6 MW case of approximately 2.6-fold to 1260 €/kW and 1.9-fold to 1840 €/kW, respectively.
Due to the reduced production expenses for direct methanation, the maximum allowed electrolyser investment increases to 2260 €/kWel (1 MWel) and 2930 €/kWhel (6 MWel) for the two scales based on an electricity price of 5 €-cts./kWhel. Using the lower electricity cost, this numbers increase to 3150 €/kWel and 3820 €/kWel. This indicates, that even with moderate improvements in the investment cost of the SOE, profitability of the process can be achieved.
Again, the profitability range can be further extended by also including heat utilisation and oxygen sales. For the heat utilisation, a production cost decrease of around 2% is possible in the pure CO2 case.
4 Conclusion
A techno-economic analysis of three CO2 methanation process chains in two different scales (1 MWel and 6 MWel) was performed. The focus was set on the comparison of biological CO2 methanation in a stirred bubble column with catalytic bubbling fluidised bed methanation. Furthermore, the benefits of including high-temperature electrolysis compared to industrially mature PEM electrolysis was investigated. For all investigated cases, fulfilling the grid injection requirements (mainly a H2-content of <2%) was required. For the investigated catalytic processes, we also included the case of direct methanation of biogas, which showed a clear cost benefit over CO2 methanation.
In general, the investment and operation cost of the process chains are highly dominated by the hydrogen path. On one hand, there is the high specific investment cost for the electrolyser unit, which is more than twice as high in the case of high-temperature electrolysis. On the other hand, electricity cost directly influences the operation cost of the process. Nevertheless, these costs are specific to the electrolyser technology applied and are independent from the methanation technology. Therefore, for cost comparison in between the technologies, a focussed view on the respective cost without the H2-path may be advisable.
The investment cost for biological methanation is highly dominated by the large reactor vessel required. The investment cost benefit for the BFB technology mainly originates from the significantly smaller reactor vessel required for catalytic methanation. The investment cost of biological methanation can only be reduced when smaller reactor volumes are applicable. The required reactor volume on the other hand is directly linked to the gas-to-liquid mass transfer. As long as this coefficient cannot be increased, the methane formation per volume is limited. A possibility of decreasing the vessel cost would be the reduction of the operation pressure. Nevertheless, this results in a reduced mass transfer rate and therefore again to a larger required reactor volume.
The nutrient provision for biological methanation states the largest influence on the OPEX of that process option. This cost causes the OPEX to exceed the annual cost of the PEM-BFB process. Concepts exist where nutrients are provided by feeding digester efflux to the reactor, which may cause a cost decrease. Still, even when no cost is associated with nutrient provision the production cost for the biological system remains inferior to the catalytic system.
The integration of high-temperature electrolysis leads to a higher electrical efficiency of the Power-to-Gas process chain. Nevertheless, the reduction in electricity cost does not compensate for added capital expensed due to the high stack investment cost and additional heat transfer equipment needed. Currently, SOE cells are still under investigation, which results in high investment cost in near future. Based on an electricity price of 5 ct./kWhel and a biomethane selling price of 0.11 €/kWh, the investment cost for SOE technology have to decrease to 950 €/kWel for 6 MW plant size to reach profitability. However, such a cost decrease is not unfeasible if the technology is further developed.
Direct methanation of biogas reduced the production cost in all investigated cases by 26–39%, which resulted in biomethane production cost of less than 11 ct/kWh for the 1 MWel and 6 MWel PEM-BFB cases, as well as the 6 MWel SOE-BFB case. Even though direct methanation showed also great cost reduction potential in biological methanation, profitability could not be reached in the 1 MWel case. In the 6 MWel-scale, our calculations indicate a production cost slightly below the profitability limit, in the same range as the 6 MWel SOE-BFB case.
Methanation of CO2 and biogas are technologies on a high TRL (catalytic 6-7, biological 7-8) and allow for fast integration of biogenic gases into the future energy landscape. This study shows that the underlying technologies can play a cost-efficient role in the seasonal storage of renewable electricity.
Data Availability Statement
The original contribution presented in the study are included in the article/Supplementary Material, further inquiries can be directed to the corresponding author.
Author Contributions
AG: Investigation, Methodology, Calculations and Software, Writing—original draft. TS: Conceptualization, Writing—review and editing, Funding acquisition, Supervision, Validation, Methodology. SB: Funding acquisition, Project administration, Resources. OK: Funding acquisition, Supervision, Writing—editing.
Conflict of Interest
The authors declare that the research was conducted in the absence of any commercial or financial relationships that could be construed as a potential conflict of interest.
Publisher’s Note
All claims expressed in this article are solely those of the authors and do not necessarily represent those of their affiliated organizations, or those of the publisher, the editors and the reviewers. Any product that may be evaluated in this article, or claim that may be made by its manufacturer, is not guaranteed or endorsed by the publisher.
Acknowledgments
This research project is financially supported by the Swiss Federal Office of Energy within the project “CarbonATE”. Wolfgang Merkle (ZHAW) is sincerely thanked for their contribution to discussion on nutrients.
Supplementary Material
The Supplementary Material for this article can be found online at: https://www.frontiersin.org/articles/10.3389/fenrg.2021.775259/full#supplementary-material
References
Adam Christensen (2020). Assessment of Hydrogen Production Costs from Electrolysis: United States and Europe. Available at: https://theicct.org/sites/default/files/publications/final_icct2020_assessment_of_hydrogen_production_costsv2.pdf.
Baker, R. W. (2002). Future Directions of Membrane Gas Separation Technology. Ind. Eng. Chem. Res. 41, 1393–1411. doi:10.1021/ie0108088
Bauer, C., Hirschberg, S., Bäuerle, Y., Biollaz, S., Calbry-Muzyka, A., Cox, B., et al. (2017). Potentials, Costs and Environmental Assessment of Electricity Generation Technologies. Villigen PSI. Available at: https://www.psi.ch/lea/HomeEN/Final-Report-BFE-Project.pdf.
Bertuccioli, L., Chan, A., Hart, D., Lehner, F., Madden, B., and Standen, E. (2014). Study on Development of Water Electrolysis in the EU. Available at: https://www.fch.europa.eu/sites/default/files/FCHJUElectrolysisStudy_FullReport_(ID_199214).pdf.
Böhm, H., Zauner, A., Rosenfeld, D. C., and Tichler, R. (2020). Projecting Cost Development for Future Large-Scale Power-To-Gas Implementations by Scaling Effects. Appl. Energ. 264, 114780. doi:10.1016/j.apenergy.2020.114780
Buttler, A., and Spliethoff, H. (2018). Current Status of Water Electrolysis for Energy Storage, Grid Balancing and Sector Coupling via Power-To-Gas and Power-To-Liquids: A Review. Renew. Sustain. Energ. Rev. 82, 2440–2454. doi:10.1016/j.rser.2017.09.003
Calbry-Muzyka, A. S., Gantenbein, A., Schneebeli, J., Frei, A., Knorpp, A. J., Schildhauer, T. J., et al. (2019). Deep Removal of Sulfur and Trace Organic Compounds from Biogas to Protect a Catalytic Methanation Reactor. Chem. Eng. J. 360, 577–590. doi:10.1016/j.cej.2018.12.012
Calbry-Muzyka, A. S., and Schildhauer, T. J. (2020). Direct Methanation of Biogas-Technical Challenges and Recent Progress. Front. Energ. Res. 8. doi:10.3389/fenrg.2020.570887
Chemical Engineering Plant Cost Index (CEPCI) (2020). Process Integration, Simulation and Economics. Chem. Eng.. Available at: https://www.chemengonline.com/pci-home 127, 72.
Dannesboe, C., Hansen, J. B., and Johannsen, I. (2020). Catalytic Methanation of CO2 in Biogas: Experimental Results from a Reactor at Full Scale. React. Chem. Eng. 5, 183–189. doi:10.1039/C9RE00351G
DIN 1343:1990–01 (1990). Reference Conditions, Normal Conditions, Normal Volume; Concepts and Values. doi:10.31030/2333155
Electrochaea.dk ApS (2014). BioCatProject. Available at: http://biocat-project.com/ (Accessed February 11, 2020).
Energie360° (2021). Gaspreise. Available at: https://www.energie360.ch/de/energie-360/wissen/erdgas-biogas/gaspreise/.
Evonik Industries AG SEPURAN® (2021). Efficient Gas Separation Using Hollow-Fiber Membranes. Available at: https://www.membrane-separation.com/en/efficient-gas-separation-with-sepuran-by-evonik.
Flaviana, C., Monaco, F., Michele, C., Marchese, G., Ambrosio, P. E., Lorusso, M., et al. (2016). “Selective Laser Melting for Heat Exchanger,” in Proceeding 6th Int. Conf. Addit. Technol., 383–388.
Gantenbein, A., Witte, J., Biollaz, S. M. A., Kröcher, O., and Schildhauer, T. J. (2021). Flexible Application of Biogas Upgrading Membranes for Hydrogen Recycle in Power-To-Methane Processes. Chem. Eng. Sci. 229, 116012. doi:10.1016/j.ces.2020.116012
Garrett, D. E. (1989). Chemical Engineering Economics. Dordrecht: Springer Netherlands. doi:10.1007/978-94-011-6544-0
Giglio, E., Deorsola, F. A., Gruber, M., Harth, S. R., Morosanu, E. A., Trimis, D., et al. (2018). Power-to-Gas through High Temperature Electrolysis and Carbon Dioxide Methanation: Reactor Design and Process Modeling. Ind. Eng. Chem. Res. 57, 4007–4018. doi:10.1021/acs.iecr.8b00477
Giglio, E., Lanzini, A., Santarelli, M., and Leone, P. (2015). Synthetic Natural Gas via Integrated High-Temperature Electrolysis and Methanation: Part I-Energy Performance. J. Energ. Storage 1, 22–37. doi:10.1016/j.est.2015.04.002
Götz, M., Lefebvre, J., Mörs, F., McDaniel Koch, A., Graf, F., Bajohr, S., et al. (2016). Renewable Power-To-Gas: A Technological and Economic Review. Renew. Energ. 85, 1371–1390. doi:10.1016/j.renene.2015.07.066
Gruber, M., Weinbrecht, P., Biffar, L., Harth, S., Trimis, D., Brabandt, J., et al. (2018). Power-to-Gas through thermal Integration of High-Temperature Steam Electrolysis and Carbon Dioxide Methanation - Experimental Results. Fuel Process. Techn. 181, 61–74. doi:10.1016/j.fuproc.2018.09.003
Huettenrauch, J., Hoffmann, M., and Föcker, H. (2020). Innovative Large-Scale Energy Storage Tech-Nologies and Power-To-Gas Concepts after Optimisation. Report on Economic Analysis of Test Cases (D5.10). Available at: https://www.storeandgo.info/publications/deliverables/.
Inkeri, E., Tynjälä, T., Laari, A., and Hyppänen, T. (2018). Dynamic One-Dimensional Model for Biological Methanation in a Stirred Tank Reactor. Appl. Energ. 209, 95–107. doi:10.1016/j.apenergy.2017.10.073
Helmeth project (2021). Karlsruher Institut für Technologie (KIT) Helmeth Project. Available at: http://helmeth.eu/.
Kober, T., Bauer, C., Bach, C., Beuse, M., Georges, G., Held, M., et al. (2019). Perspectives of Power-To-X Technologies in Switzerland - A White Paper. doi:10.3929/ethz-b-000352294
Kopyscinski, J., Schildhauer, T. J., and Biollaz, S. M. A. (2011). Methanation in a Fluidized Bed Reactor with High Initial CO Partial Pressure: Part II- Modeling and Sensitivity Study. Chem. Eng. Sci. 66, 1612–1621. doi:10.1016/j.ces.2010.12.029
Limeco (2020). Project Web Page: Power-To-Gas Plant Dietikon. Available at: https://www.powertogas.ch/.
Makaruk, A., and Harasek, M. (2009). Numerical Algorithm for Modelling Multicomponent Multipermeator Systems. J. Membr. Sci. 344, 258–265. doi:10.1016/j.memsci.2009.08.013
Maurer, S., Gschwend, D., Wagner, E. C., Schildhauer, T. J., Ruud van Ommen, J., Biollaz, S. M. A., et al. (2016). Correlating Bubble Size and Velocity Distribution in Bubbling Fluidized Bed Based on X-ray Tomography. Chem. Eng. J. 298, 17–25. doi:10.1016/j.cej.2016.02.012
microbEnergy GmbH (2019). microbEnergy. Available at: https://www.microbenergy.de/ (Accessed February 11 2020).
Mörs, F., Schlautmann, R., Gorre, J., Leonhard, R., and Graf, F. (2020). Innovative Large-Scale Energy Storage Technologies and Power-To-Gas Concepts after Optimisation. Final Report on Evaluation of Technologies and Processes (D5.9). Available at: https://www.storeandgo.info/publications/deliverables/.
Posdziech, O., Schwarze, K., and Brabandt, J. (2019). Efficient Hydrogen Production for Industry and Electricity Storage via High-Temperature Electrolysis. Int. J. Hydrogen Energ. 44, 19089–19101. doi:10.1016/j.ijhydene.2018.05.169
Rachbauer, L., Voitl, G., Bochmann, G., and Fuchs, W. (2016). Biological Biogas Upgrading Capacity of a Hydrogenotrophic Community in a Trickle-Bed Reactor. Appl. Energ. 180, 483–490. doi:10.1016/j.apenergy.2016.07.109
Rusmanis, D., O’Shea, R., Wall, D. M., and Murphy, J. D. (2019). Biological Hydrogen Methanation Systems - an Overview of Design and Efficiency. Bioengineered 10, 604–634. doi:10.1080/21655979.2019.1684607
Schill, N., van Gulik, W. M., von Stockar, U., and von Stockar, U. (1996). Continuous Cultures Limited by a Gaseous Substrate: Development of a Simple, Unstructured Mathematical Model and Experimental Verification with Methanobacterium Thermoautotrophicum. Biotechnol. Bioeng. 51, 645–658. doi:10.1002/(SICI)1097-0290(19960920)51:6<645:AID-BIT4>3.0.CO;2-H
Schillinger, F., Maurer, S., Wagner, E. C., van Ommen, J. R., Schildhauer, T. J., and Schildhauer, T. J. (2017). Influence of Vertical Heat Exchanger Tubes, Their Arrangement and the Column Diameter on the Hydrodynamics in a Gas-Solid Bubbling Fluidized Bed. Int. J. Multiphase Flow 97, 46–59. doi:10.1016/j.ijmultiphaseflow.2017.07.013
Schlautmann, R., Böhm, H., Zauner, A., Mörs, F., Tichler, R., Graf, F., et al. (2021). Renewable Power-To-Gas: A Technical and Economic Evaluation of Three Demo Sites within the STORE&GO Project. Chem. Ingenieur Technik 93, 568–579. doi:10.1002/cite.202000187
Schmidt, O., Gambhir, A., Staffell, I., Hawkes, A., Nelson, J., and Few, S. (2017). Future Cost and Performance of Water Electrolysis: An Expert Elicitation Study. Int. J. Hydrogen. Energ. 42, 30470–30492. doi:10.1016/j.ijhydene.2017.10.045
Specht, M., Brellochs, J., Frick, V., Stürmer, B., and Zuberbühler, U. (2016). The Power to Gas Process. Synthetic Natural Gas from Coal, Dry Biomass, and Power‐to‐Gas Applications. John Wiley & Sons, Ltd, 191–220. doi:10.1002/9781119191339.ch7
Store and Go Project (2016b). Available at: https://www.storeandgo.info/ (Accessed February 11, 2020).
Store and Go Project (2016a). Store&Go Demonstration Site in Switzerland. Available at: https://www.storeandgo.info/demonstration-sites/switzerland/(Accessed February 11, 2020).
Teske, L. S. (2014). Integrating Rate Based Models into a Multi-Objective Process Design & Optimisation Framework Using Surrogate Models, 6302. doi:10.5075/epfl-thesis-6302
Thees, O., Burg, V., Erni, M., Bowman, G., and Lemm, R. (2017). Biomassepotenziale der Schweiz für die energetische Nutzung. Ergebnisse des Schweizerischen Energiekompetenzzentrums SCCER BIOSWEET. WSL Berichte 57, 299. Available at: https://www.dora.lib4ri.ch/wsl/islandora/object/wsl:13277.
Thema, M., Bauer, F., and Sterner, M. (2019). Power-to-Gas: Electrolysis and Methanation Status Review. Renew. Sustain. Energ. Rev. 112, 775–787. doi:10.1016/j.rser.2019.06.030
Thema, M., Weidlich, T., Kaul, A., Böllmann, A., Huber, H., Bellack, A., et al. (2021). Optimized Biological CO2-methanation with a Pure Culture of Thermophilic Methanogenic Archaea in a Trickle-Bed Reactor. Bioresour. Techn. 333, 125135. doi:10.1016/j.biortech.2021.125135
Tribe, M. A., and Alpine, R. L. W. (1986). Scale Economies and the “0.6 Rule”. Eng. Costs Prod. Econ. 10, 271–278. doi:10.1016/0167-188X(86)90053-4
Ullrich, T., and Lemmer, A. (2019). Performance Enhancement of Biological Methanation with Trickle Bed Reactors by Liquid Flow Modulation. GCB Bioenergy 11, 63–71. doi:10.1111/gcbb.12547
Ulrich, G. D., and Vasudevan, P. T. (2004). Chemical Engineering Process Design and Economics: A Practical Guide. 2nd ed. Durham: N.H.: Process Publishing.
Werther, J. (1976). Die Bedeutung der Blasenkoaleszenz für die Auslegung von Gas/Feststoff-Wirbelschichten. Chem. Ingenieur Technik 48, 339. doi:10.1002/cite.330480421
Witte, J. (2018). Experimental and Techno-Economic Assessment of Catalytic Methanation of Biogas for Power-To-Gas Processes. doi:10.3929/ETHZ-B-000304900
Witte, J., Calbry-Muzyka, A., Wieseler, T., Hottinger, P., Biollaz, S. M. A., and Schildhauer, T. J. (2019). Demonstrating Direct Methanation of Real Biogas in a Fluidised Bed Reactor. Appl. Energ. 240, 359–371. doi:10.1016/j.apenergy.2019.01.230
Witte, J., Kunz, A., Biollaz, S. M. A., and Schildhauer, T. J. (2018a). Direct Catalytic Methanation of Biogas - Part II: Techno-Economic Process Assessment and Feasibility Reflections. Energ. Convers. Manag. 178, 26–43. doi:10.1016/j.enconman.2018.09.079
Witte, J., Settino, J., Biollaz, S. M. A., and Schildhauer, T. J. (2018b). Direct Catalytic Methanation of Biogas - Part I: New Insights into Biomethane Production Using Rate-Based Modelling and Detailed Process Analysis. Energ. Convers. Manag. 171, 750–768. doi:10.1016/j.enconman.2018.05.056
Keywords: biogas, power-to-gas, methanation, cost, biological methanation, catalytic fluidised bed methanation
Citation: Gantenbein A, Kröcher O, Biollaz SMA and Schildhauer TJ (2022) Techno-Economic Evaluation of Biological and Fluidised-Bed Based Methanation Process Chains for Grid-Ready Biomethane Production. Front. Energy Res. 9:775259. doi: 10.3389/fenrg.2021.775259
Received: 13 September 2021; Accepted: 23 December 2021;
Published: 24 March 2022.
Edited by:
Ilkka Hannula, International Energy Agency, FranceReviewed by:
Sunil A. Patil, Indian Institute of Science Education and Research Mohali, IndiaKristian Melin, LUT University, Finland
Copyright © 2022 Gantenbein, Kröcher, Biollaz and Schildhauer. This is an open-access article distributed under the terms of the Creative Commons Attribution License (CC BY). The use, distribution or reproduction in other forums is permitted, provided the original author(s) and the copyright owner(s) are credited and that the original publication in this journal is cited, in accordance with accepted academic practice. No use, distribution or reproduction is permitted which does not comply with these terms.
*Correspondence: Tilman J. Schildhauer, tilman.schildhauer@psi.ch