Quantitative Analysis of the Interactive Influence for Harmonic Emission in Wind Farms
 Jinhui Shi
 Wei Chen*
 - College of Electrical and Information Engineering, Lanzhou University of Technology, Lanzhou, China
In the process of integrating large-scale wind farms into the power system, the harmonic interaction among wind farms causes potential safe and stable operation threats to the power grid. To effectively control the harmonics of the wind power grid-connected system, quantitative analysis of the harmonic interaction is very necessary and meaningful. Therefore, this paper firstly explains the harmonic interaction among wind farms from the perspective of the primary and secondary emission. We use the concept of harmonic impedance to analyze the mechanism of harmonic interaction and proposed a calculation method for quantitative analysis of the harmonic interaction. Using the calculation method, the influence caused by the wind farm self-impedance, the contact impedance, and Static Var Generator to the harmonic interaction are quantitatively analyzed. Finally, taking multiple wind farms in actual operation as a case, the effectiveness of the method is verified by time domain simulation.
Introduction
Wind energy is a clean, renewable, and high-quality energy with large-scale development potential (Bak et al., 2013). However, the centralized operation of large-scale wind power also brings many power quality problems (Xu et al., 2019; Kunjumuhammed et al., 2016), of which Harmonic is the most important one in wind power grid connection (Badrzadeh et al., 2012; Kong et al., 2014). Harmonic emissions of variable speed wind turbines are a well-known issue (Tentzerakis and Papathanassiou, 2007). The harmonic of the point of common coupling (PCC) in the wind farm network is resulted from the combination of the one emitted by itself and the one caused from the external system (Ravindran et al., 2021; Tan et al., 2019). The closer the distance between the harmonic sources, the more obvious the harmonic interaction phenomenon (Arghandeh et al., 2013). When large-scale wind farms are integrated into the grid, their electrical distance is shorter, and the corresponding harmonic interaction is more obvious. Because of the interaction of harmonics, the uncertainty and complexity of harmonics are aggravated (Herberta and Amutha, 2014; Liang, 2017), which makes the evaluation of wind farm harmonics more complex. The interaction between wind farms may lead to the decline of system stability margin and even the unstable operation of local systems. Its randomness and uncertainty will also affect the optimal dispatching of power grid with new energy (Li et al., 2021) and multi-energy complementary energy management (Li et al., 2021). To better suppress the harmonic of wind power grid-connected system and improve the stability of wind power grid-connected system, it is necessary to quantitatively analyze the harmonic interaction of multiple wind farms.
To explain the interaction and propagation of harmonics, Bollen et al. (2011) proposed the concepts of primary emission and secondary emission. The interaction between harmonic sources is interpreted as primary emission and secondary emission, and it is further pointed out that the primary and secondary emissions of harmonics are not only applicable to the ultra-high harmonics (Gil-De-Castro a et al., 2014). The harmonic emission and the corresponding interaction in the wind farms can be interpreted as the primary and secondary emissions (Bollen and SK, 2016). Yang et al. (2014) explained the harmonic emission of wind turbine by using the primary emission and secondary emission and pointed out that the harmonic emission of wind turbine is a combination of the primary and secondary emissions. Primary and secondary emissions are very useful when quantifying the interaction between devices.
At present, several studies have focused on the harmonic interaction evaluation. The main research studies focus on two aspects: harmonic interaction between flexible AC transmission system (FACTS) devices and harmonic interaction between FACTS devices and power grid. On the basis of the Norton equivalent model of multiple grid-connected inverters, He et al. (2013) quantitively analyzed the interaction between different current control loops using the transfer function matrix. Yahyaie and Lehn (2016) employed the frequency coupling matrix method to analyze the harmonic interaction between grid-connected inverter and power grid. The existence of multiple harmonic sources leads to the increase in the order of the coupling matrix, which makes the matrix decoupling become difficult. On the basis of the equivalent output impedance method, Chen et al. (2017) established two parallel active power filter (APF) equivalent models to explain the two APF harmonic interactions from the perspective of control theory. Xu and Teng (2020) took two wind turbine clusters in a wind farm as the research object and established its admittance model. Considering the parameters of the phase-locked loop and the number of wind turbines, the interaction between the two wind turbine clusters is qualitatively analyzed on the basis of the generalized Nyquist criterion. The above research studies mainly make a qualitative analysis of harmonic interaction.
In contrast to quantitative analysis, the qualitative analysis methods only determine which side of the PCC dominates the harmonic and cannot provide specific contribution levels. Quantitative methods have thus drawn more attention. The existing quantitative analysis methods for harmonic interaction are the relative gain array (RGA) method and the measurement method. At present, the quantitative analysis methods of harmonics mainly include RGA and measurement method. The quantitative analysis of harmonic interaction is mainly focused on multi-infeed high-voltage direct current (HVDC) systems and multiple inverters. Guo et al. (2020) defined the harmonic current influence coefficients of the converter station based on the harmonic impedance method. The degree of harmonic interaction between converter stations is analyzed, and the feasibility and effectiveness of harmonic impedance in analyzing harmonic interaction is verified by simulation results. The absorption and amplification of harmonic current at AC side in multi-infeed HVDC systems are defined, and it is concluded that equivalent harmonic self-impedance in the converter station is the main factor affecting harmonic absorption and amplification (Yang G et al., 2016). Tang et al. (2016) used the diagonal relative gain of the RGA to quantitatively analyze the interaction between multiple inverters. However, the passive damping is used to suppress LCL filter resonance in its control strategy, which will increase active power loss and is not applicable to high-power grid-connected inverters. Han et al. (2020) established a wind farm transfer function model and quantitatively analyzed the harmonic interaction among the current control loops of multiple wind turbines based on the RGA. However, the RGA is mainly aimed at the coupling analysis of multivariate control processes. Zhao et al. (2020) used complex independent component analysis to quantitatively analyze the harmonic contribution of multiple wind farms at the grid-connected point. On the basis of the concept of harmonic propagation, Yang K et al. (2016) used the measurement method to explain the harmonic influence of wind turbines on other turbines in wind farms and the public grid but lacked quantitative theoretical analysis. The measurement of harmonic emission from different wind farms shows that there is broadband harmonic emission in the wind farm, and the harmonic emission changes with time and measurement points (Yang et al., 2011). It is difficult to determine the source of harmonics and quantitative analysis using measurement methods.
On the basis of the above research studies’ status, this paper makes a quantitative analysis of the harmonic interaction between wind farms from the perspective of system analysis. The contribution of this paper is the following four aspects. Firstly, we explained the harmonic interaction from the perspective of the primary and secondary emissions about wind farms. Secondly, on the basis of the concept of harmonic impedance, a harmonic impedance model of the multiple wind farms is established, and the mechanism of harmonic interaction between wind farms is analyzed. A calculation method for quantitative analysis of the interaction degree for the primary emission and secondary emission of harmonic current is proposed, and the quantitative index of the interaction degree is defined. Thirdly, this method is utilized for the quantitatively analyzing the influence of the wind farm self-impedance, contact impedance, and Static Var Generator (SVG) on the harmonic interaction from the mechanism. Finally, taking multiple wind farms in Northwest China as the practical case, we constructed the harmonic interactive simulation models of multiple wind farms with the PSCAD/EMTDC platform and verified the effectiveness of the method by the time domain simulation. The research results of this paper have reference significance for effective harmonic control and power quality improvement of wind power grid-connected systems.
The follow-up of the paper is organized as follows. Primary Emission and Secondary Emission of Harmonics Between Wind Farms elaborates the primary emission and secondary emission of harmonic sources and analyzes the interaction mechanism and main influencing factors. Quantitative Interaction Mechanism of Primary and Secondary Emissions for the Harmonic Current establishes the analysis model for harmonic interaction of multiple wind farms. On basis of this, the quantitative analysis method of harmonic interaction is given, and the quantitative mechanism of harmonic interaction is theoretically analyzed. Influence Analysis of the Primary and Secondary Harmonic Interaction Factors gives a quantitative analysis of the main reason, which is the influence of harmonic interaction. Simulation Analysis verifies the effectiveness of the proposed quantitative analysis method through time domain simulation combined with actual cases. In Conclusion, conclusions related to our work are summarized.
Primary Emission and Secondary Emission of Harmonics Between Wind Farms
Primary Emission and Secondary Emission
The equivalent model of interaction generated between the primary and secondary emissions is shown in Figure 1 (Bollen et al., 2011). The two harmonic sources are equivalent to the current source models in case that the background harmonics are ignored. The two harmonic sources are denoted by
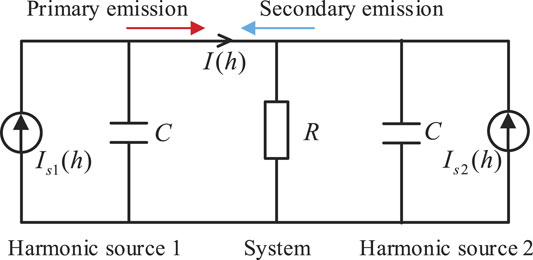
FIGURE 1. The model of primary and secondary emission.
Primary emission: As shown in Figure 1, when only harmonic source 1 existed in the system, the flow harmonic current, which is denoted by
where
In practical terms, the primary emission is affected by many factors, such as the topological formation of the harmonic source and the impedance within the common connection point.
Secondary emission: When there are two harmonic sources in the system,
Reasonably, the secondary emission is mainly affected by the emission intensity of the external harmonic source and the impedance among the harmonic sources.
Primary and Secondary Harmonic Emission Among the Wind Farms
When multiple wind farms are connected to the grid, the wind farm has the characteristics of the primary emission and secondary emission (Yang et al., 2014). The primary emission is the distortion generated within the wind farm itself, whereas the secondary emission is the distortion generated from other wind farms. The interactive propagation relationship of the primary and secondary emissions for the wind farms is concretely shown in Figure 2.
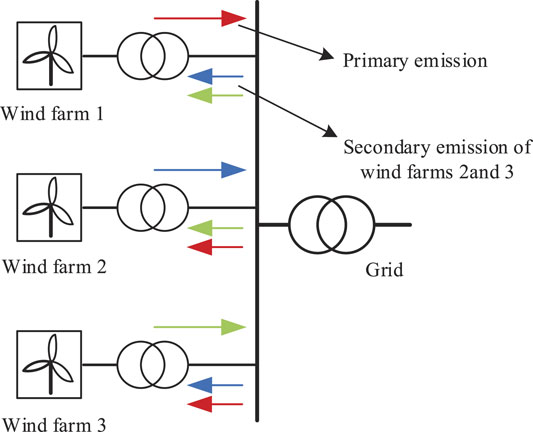
FIGURE 2. Primary emission and secondary emission of wind farm.
As distinctly seen from Figure 2, the harmonics generated by wind farms affect the adjacent wind farms, thus causing the interaction of the primary and secondary emissions in wind farms. Taking the 13th harmonic as the analysis object, the harmonic influence of wind farm 2 on wind farm 1 before and after wind farm 2 is shown in Figure 3. Compared to wind farm 1 operating alone, the harmonic current of wind farm 1 is oscillated more obviously when the wind farm 2 is incorporated. Therefore, there is interaction between the primary and secondary harmonics in wind farms.
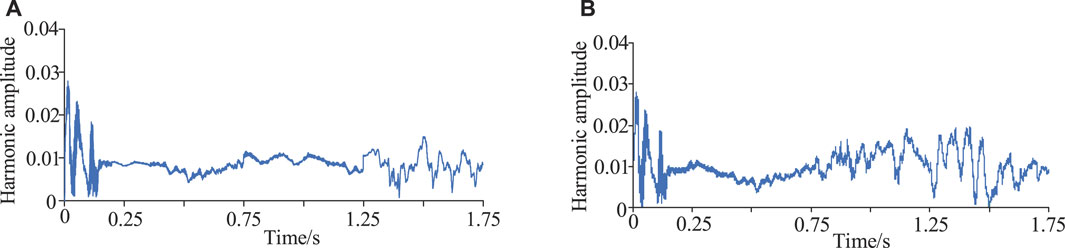
FIGURE 3. Harmonic effect of wind farm 2 on wind farm 1. (A) Before wind farm 2 put into. (B) After the wind farm 2 put into.
It can be seen from Figure 4 that, when wind farm 1 operates alone, its primary emission distortion rate is 3.37%. Affected by the harmonic emission of wind farm 2, the secondary emission distortion rate of wind farm 1 increases to 4.26%.
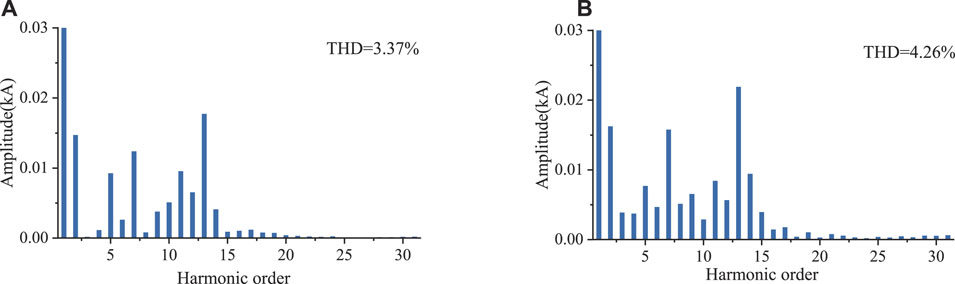
FIGURE 4. Harmonic current amplitude of wind farm 1. (A) Before wind farm 2 put into. (B) After the wind farm 2 put into.
The primary emission and secondary emission of wind farms can distinguish the source of harmonics, which is conducive to the quantitative analysis of harmonic interaction. The primary emission of the wind farms mainly depends on the topological formation and the harmonic impedance of the wind farms, reactive power compensation devices, and other power quality control devices. The key factors influencing the secondary emission of wind farms are the harmonic emission intensity of adjacent wind farms, the size of the interconnection impedance between wind farms, and the impedance size of the external system.
Quantitative Interaction Mechanism of Primary and Secondary Emissions for the Harmonic Current
As the new energy base with large-scale wind farms is always far away from the load center, the harmonics generated by power grids are much smaller when compared with the harmonics generated by wind farms. The electrical coupling of wind farms is close together due to the approaching electrical distance within the wind farms when large-scale wind farms are connected to the grid. Therefore, the harmonic interaction among wind farms becomes more obvious.
To quantitatively analyze the interaction influence of the primary harmonic emission and the secondary harmonic emission between multiple wind farms, the interaction factor of harmonic current is defined, in Eq. 3 in this paper. More specifically, the defined interaction coefficient is calculated with the ratio that the primary harmonic current of the connection point in the integrated wind farm grid to the secondary harmonic current of the adjacent wind farm.
where
The magnitude of
When the electrical distance between harmonic sources is close, the electrical coupling is close, and the harmonic interaction between harmonic sources is more serious (Gil-De-Castro b et al., 2014). Therefore, the harmonic interaction generated from the wind farm and electrified wire netting is not considered in our analysis. In addition, when the power grid runs stably, the harmonic grid impedance can be approximately viewed as constant. At this point, the harmonics is mainly originated from the wind farm. The hth-order interaction model of multiple wind farms is shown in detail in Figure 5.
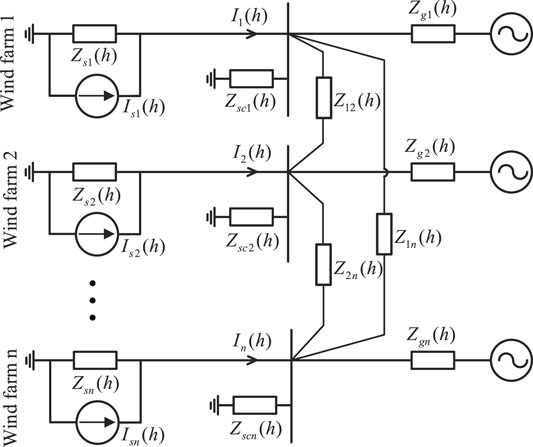
FIGURE 5. Harmonic interaction analysis model for multiple wind farms.
In Figure 5,
Taking wind farm 1 and wind farm 2 as shown in Figure 5 as the research objects, Eqs 4–7 can be obtained as follows when the influence of background harmonics in the AC system is ignored:
Substituting Eqs 6, 7 into Eqs 4, 5, respectively, we can get Eq. 8 as follows:
Therefore, Eq. 9 can be obtained with the combination of Eq. 3:
In the right end of Eq. 9,
With the same reason, Eq. 12 is derived as follows:
In Eq. 12,
where the self-impedance of the harmonic is separately denoted by
It can be known from Eqs 9, 12 that the interaction originated from wind farm
Influence Analysis of the Primary and Secondary Harmonic Interaction Factors
The Influence of Contact Impedance on Harmonic Interaction
The contact transformers and transmission lines between wind farms can be equivalent to contact impedance, representing the electrical distance between different wind farms. The wind farms are coupled through the contact impedance and result in the interaction between wind farms. The simplified analysis model of the contact impedance is given in Figure 6.

FIGURE 6. Harmonic impedance model of contact impedance.
With the observation from Figure 6, Eq. 15 can be obtained as follows:
where the equivalent impedance is denoted by
By Eq. 15, the harmonic current relationship between the first and last two ends of the contact impedance can be obtained as Eq. 16:
The admittance form of the Eq. 16 is expressed as Eq. 17:
It can be known from Eq. 16 that the electrical distance between wind farms and the degree of electrical connection between wind farms are featured with the contact impedance located at wind farms. Moreover, the value of
Taking the 11th characteristic harmonic in a wind farm as an example, the relationship between the contact impedance and the interaction factor of the harmonic current is shown in Figure 7. It can be known from the figure that the interaction factors, i.e.,
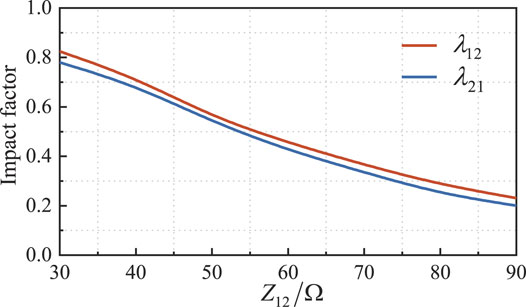
FIGURE 7. Influence of contact impedance on
The Influence of Compensation Device on Harmonic Interaction
Because of the structural characteristics of the power electronics of SVG, the switching will cause changes in the primary emission of the grid-connected harmonic currents in wind farms and then affects the varieties in the secondary emission of adjacent wind farms. When SVG is incorporated into operation, the harmonic impedance model of the wind farm is clearly shown in Figure 8.
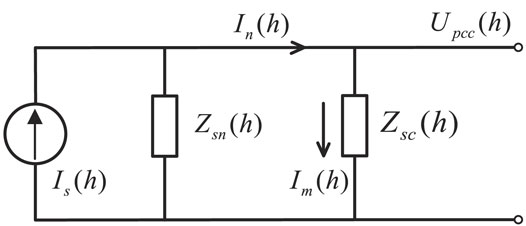
FIGURE 8. Harmonic analysis model of SVG.
In Figure 8,
It can be known from Eq. 18 that the harmonic current poured into the system is tightly affected through the compensator of the wind farm. The value of the harmonic current injected into the grid is varied from
The influence of SVG on the harmonic current of the grid connection point before and after the input is shown in Figure 9.
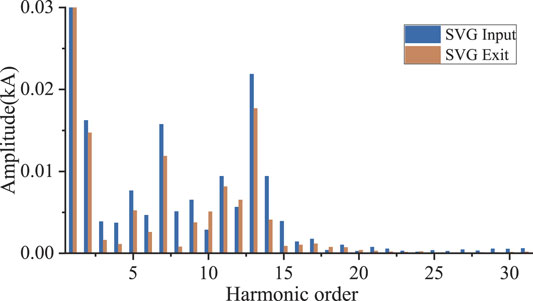
FIGURE 9. Harmonic current spectrum of wind farm before and after SVG operation.
Figure 9 shows that the total harmonic current distortion rate of wind farm decreases from 4.9% before SVG input to 2.8% after SVG input. SVG can inhibit the primary emission of wind farms and reduce the harmonic interaction between wind farms.
Influence of Equivalent Impedance on Interaction Factors
The variation of wind turbines number will cause the variation of the equivalent harmonic impedance of the wind farms. To reflect the influence of the equivalent impedance on the interaction factors of harmonic currents in wind farms, two typical wind farms 1 and 2 are selected as the analysis objects. As a result, when the reactive power and contact impedance unchanged, the magnitude of the harmonic self-impedance, which is denoted by
When the 13th-order characteristic harmonics is considered, the variation trend of relationship curves for
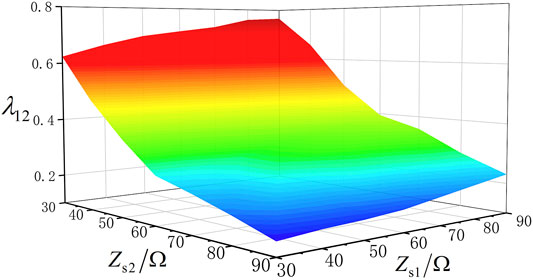
FIGURE 10. Relationship curve among
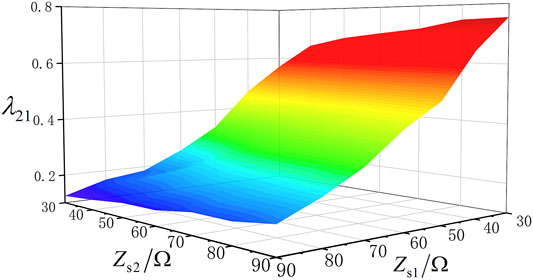
FIGURE 11. Relationship curve among
It can be seen from Figure 10 that the value of
It can be seen from Figure 11 that the value of
Simulation Analysis
In this section, multiple wind farms existing in Northwest China are modeled in PSCAD. This wind farm base is rather typical for northwest areas in China, and it is far away from the load center. The harmonics generated by power grids are much smaller when it is compared with the harmonics generated by wind farms. In this wind farm base, the electrical coupling of wind farms is close together due to the approaching electrical distance within the wind farms.
It is assumed that the control parameters of the selected wind farm are all operated under the rated state. The maximum installed capacity of the wind farm is 120 MW, and the outlet voltage of the wind turbine generator is collected into the 35-kV bus through the boosted 0.69/35 kv box transformer and is transmitted to the 35/330 step-up transformer through the 35-kV line. Finally, it is accessed into the AC system. In addition, the SVG is paralleled at the 35-kV bus side. The topological structure of the wind farm base is shown in Figure 12. The main electrical equipment parameters in the wind power base are shown in Table 1. To make the simulation analysis closer to reality, simulation parameters are set according to the actual electrical parameters in simulation modeling.
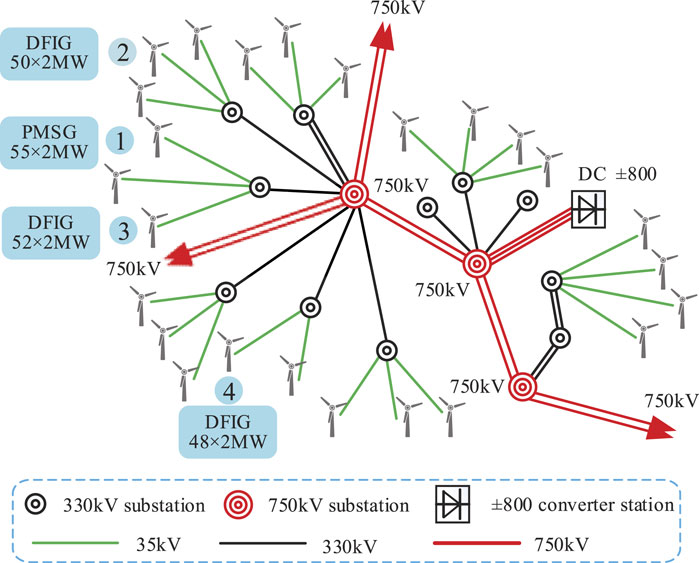
FIGURE 12. The topological structure of wind farms in Northwest China.
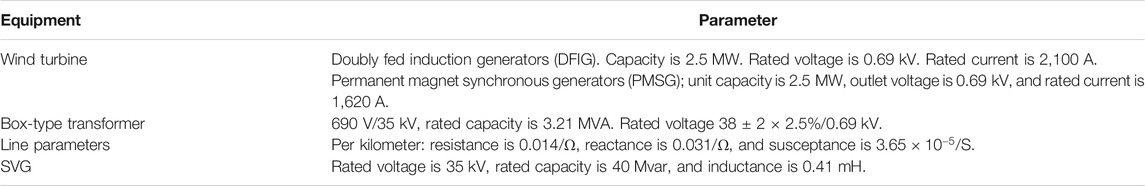
TABLE 1. The Main equipment parameters.
The Influence of Contact Impedance
The size of the contact impedance is closely related to the distance of the transmission line, and the distance of the transmission line can be used to characterize the size of the contact impedance. To reflect the relationship between the contact impedance and the harmonic interaction factors, three wind farms, i.e., wind farm 1, wind farm 3, and wind farm 4, are selected as research objects. The electrical distance sourced from wind farm 1 to wind farm 3 is 15 km, and the electrical distance between wind farm 1 and wind farm 4 is 65 km. Regardless of the impact of the number of grid-connected wind turbines, the number of wind turbines is set to 40 in the three wind farms. The relationship between the interaction factors of the primary and secondary emissions and contact impedance is shown in Figure 13.
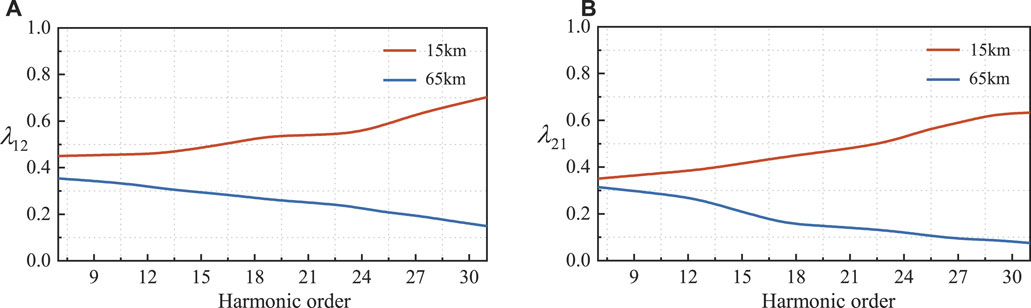
FIGURE 13. The influence of contact impedance. (A) The relationship between
It can be known from Figure 13 that the interaction degree of each harmonic between wind farm 1 and wind farm 3 is significantly greater than the influence factors between wind farm 1 and wind farm 4. Furthermore, the interaction factors, i.e.,
The Self-Impedance of Wind Farm Changes
To analyze the relationship between the self-impedance of wind farms and the influence factors. Wind farm 1 and wind farm 3 are taken as the research objects, and the electrical distance between them is 15 km. That is,
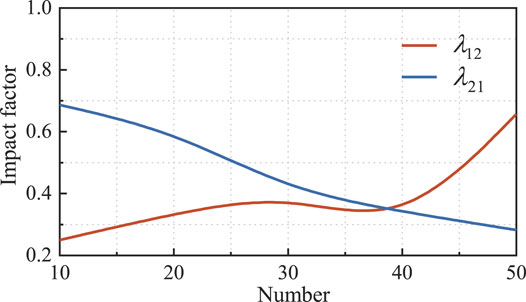
FIGURE 14. The relationship among the number of wind turbines,
It can be known from Figure 14 that the changing trends of
Impacts of SVG Operating Modes
To analyze the impact of SVG on interaction factors, in this case, taking wind farm 1 and wind farm 2 in Figure 10 as the research objects, the number of wind turbines in both wind farms is 35. The electrical distance between two wind farms is 45 km, that is, the self-impedance and contact impedance of the two wind farms remain unchanged. Before, the SVGs of the two wind farms were put into use. The current total harmonic distortion (THD) of wind farm 1 is 3.37%, and the current THD of wind farm 2 is 4.89%. There are three operation modes that existed in the SVG. The current THD of two wind farms under the different modes is shown in Table 2.
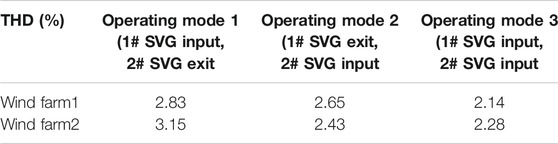
TABLE 2. Harmonic current distortion rate under 3 operating modes.
According to the data analysis in Table 2, under three different operating modes, the current THD of the two wind farms has decreased, which also shows that SVG can play a positive role in harmonic suppression. The current THD of wind farm 1 decreases more obviously in operation mode 1, and the current THD of wind farm 2 decreases more obviously in operation mode 2. Under operation mode 3, when the SVGs of wind farm 1 and wind farm 2 are put into operation at the same time, the current THD of the two wind farms decrease greatly. The current THD of wind farm 1 and wind farm 2 have been reduced from 3.37% and 4.89% to 2.14% and 2.28%, respectively.
According to the analysis of Figure 15, the value of
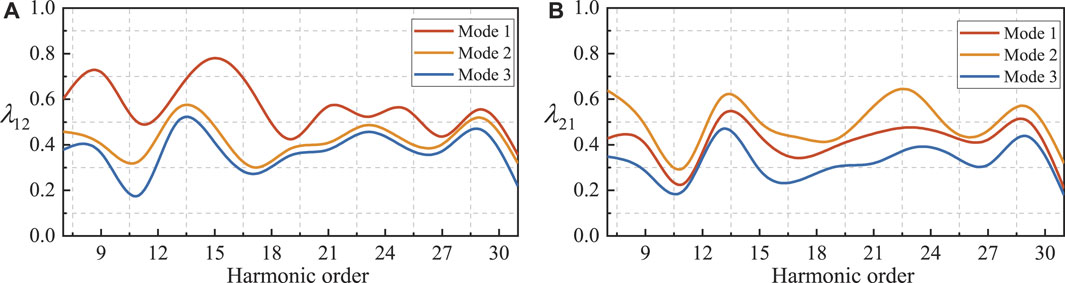
FIGURE 15. Impacts of SVG operating modes. (A) The value of
Conclusion
This paper analyzes the harmonic interaction between wind farms from the perspective of the primary and secondary emissions of harmonics. Through establishing the harmonic interaction model of multiple wind farms, a method for quantitative analysis of harmonic interaction is proposed, and the mechanism and quantitative analysis of harmonic interaction between wind farms are carried out. This method is utilized for quantitatively analyzing the influence of the wind farm self-impedance, contact impedance, and SVG on the harmonic interaction from the mechanism. Taking the actual wind farms as a research case, the effectiveness of the method is verified by time domain simulation. Finally, the following conclusions are drawn.
1) The harmonic current interaction factor of the primary emission and secondary emission between wind farms is closely related to the contact impedance. Specifically, the contact impedance rises with the increase of electrical distance between wind farms, but the harmonic interaction factor shows an opposite trend. Vice versa, the contact impedance decreases and the harmonic interaction factor increases when electrical distance between wind farms is reduced.
2) In case that the capacity of single wind turbine is identical, the harmonic impedance of the wind farm is changing with the variety in the number of grid-connected wind turbines. When the harmonic order is same, the harmonic impedance difference between wind farms is greater, the harmonic interaction factor is greater, and the interaction is stronger. When the harmonic impedance between wind farms is equal or similar, the harmonic interaction factor is smaller, and the interaction is smaller.
3) The input or exit of SVG is closely related to the change of harmonic interaction factor. The harmonics can be suppressed by the input of SVG, and the degree of harmonic interaction between wind farms can be also reduced.
The method proposed in this paper provides a reference for the harmonic control and power quality optimization of multiple wind farm grid-connected systems. However, certain impact caused by the interaction between multiple wind farms is conducted to the power quality and the stable operation of the power grid, which is a significant task to be improved in the future.
Data Availability Statement
The raw data supporting the conclusion of this article will be made available by the authors, without undue reservation.
Author Contributions
JS: methodology, software implementation, and writing. WC: resources and investigation. ZW: review and editing. XP and XS: supervision.
Funding
This work was supported by the National Natural Science Foundation of China (51767017), Basic Research and Innovation Group Project of Gansu (18JR3RA133), and Major Science and Technology Project of Gansu Province (19ZD2GA003).
Conflict of Interest
The authors declare that the research was conducted in the absence of any commercial or financial relationships that could be construed as a potential conflict of interest.
Publisher’s Note
All claims expressed in this article are solely those of the authors and do not necessarily represent those of their affiliated organizations or those of the publisher, the editors, and the reviewers. Any product that may be evaluated in this article, or claim that may be made by its manufacturer, is not guaranteed or endorsed by the publisher.
References
Arghandeh, R., Onen, A., Jung, J., and Broadwater, R. P. (2013). Harmonic Interactions of Multiple Distributed Energy Resources in Power Distribution Networks. Electric Power Syst. Res. 105 (10), 124–133. doi:10.1016/j.epsr.2013.07.018
Badrzadeh, B., Gupta, M., Singh, N., Petersson, A., Max, L., and Hogdahl, M. (2012). “Power System Harmonic Analysis in Wind Power Plants - Part I: Study Methodology and Techniques,” in 2012 IEEE Industry Applications Society Annual Meeting, Las Vegas, NV, USA, Oct 7-11, 2012, 1–11.
Bollen, M. H. J., and Ronnberg, S. K. (2016). “Primary and Secondary Harmonics Emission; Harmonic Interaction - a Set of Definitions,” in 17th International Conference on Harmonics and Quality of Power (ICHQP), Belo Horizonte, BrazilOct 16-19. 2016, 703–708.
Bollen, M., Larsson, A., and Schanen, J. L. (2011). “A Simple Model for Interaction between Equipment at a Frequency of Some Tens of kHz,” in 21st International Conference on Electricity Distribution, Frankfurt, Germany, June 6-9. 2011, 1–4.
Chen, J., Ma, X., Li, J., Li, Y., Wang, Z., Huang, N., et al. (2017). Analysis on Interaction of Two-Parallel APF. Power Syst. Tech. 41 (3), 956–961. doi:10.13335/j.1000-3673.pst.2016.1103
Gil-De-Castro, A., Ronnberg, S. K., and Bollen, M. H. J. (2014b). “A Study about Harmonic Interaction between Devices,” in 16th International Conference on Harmonics and Quality of Power (ICHQP), Bucharest, Romania, May 25-28. 2014, 728–732. doi:10.1109/ICHQP.2014.6842767
Gil-De-Castro, A., Ronnberg, S. K., and Bollen, M. H. J. (2014a),“Harmonic Interaction between an Electric Vehicle and Different Domestic Equipment,” in International Symposium on Electromagnetic Compatibility, Gothenburg, Sweden, Sept 1-4. 2014, 991–996.
Guo, C., Xu, X., and Zhang, C. (2020). Research on Harmonic Impedance Model and Harmonic Interaction of Multiple Converter Station System with AC Filters. Electric Power Automation Equipment 40 (10), 187–193. doi:10.16081/j.epae.202008036
Han, P., Wang, L., Dou, S., Wang, L., Bi, R., and Yang, X. (2020). Analysis and Verification of Harmonic Interaction between DDWTs Based on αβ Stationary Coordinate System. IET Generation, Transm. Distribution 14 (10), 1893–1901. doi:10.1049/iet-gtd.2019.0708
He, J., Li, Y. W., Bosnjak, D., and Harris, B. (2013). Investigation and Active Damping of Multiple Resonances in a Parallel-Inverter-Based Microgrid. IEEE Trans. Power Electron. 28 (1), 234–246. doi:10.1109/TPEL.2012.2195032
Joselin Herbert, G. M., Iniyan, S., and Amutha, D. (2014). A Review of Technical Issues on the Development of Wind Farms. Renew. Sust. Energ. Rev. 32, 619–641. doi:10.1016/J.RSER.2014.01.055
Kocewiak, Ł. H., Hjerrild, J., and Bak, C. L. (2013). Wind Turbine Converter Control Interaction with Complex Wind Farm Systems. Iet Renew. Power Generation 7 (4), 380–389. doi:10.1049/iet-rpg.2012.0209
Kong, F., Dong, C., Liu, X., and Zeng, H. (2014). Quantity versus Quality: Optimal Harvesting Wind Power for the Smart Grid. Proc. IEEE 102 (11), 1762–1776. doi:10.1109/JPROC.2014.2359448
Kunjumuhammed, L. P., Pal, B. C., Oates, C., and Dyke, K. J. (2017). The Adequacy of the Present Practice in Dynamic Aggregated Modeling of Wind Farm Systems. IEEE Trans. Sustain. Energ. 8 (1), 23–32. doi:10.1109/TSTE.2016.2563162
Li, Y., Han, M., Yang, Z., and Li, G. (2021). Coordinating Flexible Demand Response and Renewable Uncertainties for Scheduling of Community Integrated Energy Systems with an Electric Vehicle Charging Station: A Bi-level Approach. IEEE Trans. Sustain. Energ. 12 (4), 2321–2331. doi:10.1109/TSTE.2021.3090463
Li, Y., Li, K., Yang, Z., Yu, Y., Xu, R., and Yang, M. (2022). Stochastic Optimal Scheduling of Demand Response-Enabled Microgrids with Renewable Generations: An Analytical-Heuristic Approach. J. Clean. Prod. 330, 129840. doi:10.1016/j.jclepro.2021.129840
Liang, X. (2017). Emerging Power Quality Challenges Due to Integration of Renewable Energy Sources. IEEE Trans. Ind. Applicat. 53 (2), 855–866. doi:10.1109/TIA.2016.2626253
Ravindran, V., Nakhodchi, N., Ronnberg, S., and Bollen, M. H. J. (2021). Assessing Time-Varying Harmonic Interactions in a Wind Park. IEEE Access 9, 68151–68160. doi:10.1109/ACCESS.2021.3076879
Tan, P., Yang, H., and Ma, X. (2019). Assessment of Harmonic Emission Level Considering Influence of Harmonic Impedance of Wind Farm. Electric Power Automation Equipment 39 (04), 167–173. doi:10.16081/j.issn.1006-6047.2019.04.025
Tang, Z., Yang, H., and Yuan, L. (2016). Analysis on Interactive Influences Among Control Loops of Multi-Inverters Connected to Weak-Structured Power System. Power Syst. Tech. 40 (11), 3524–3531. doi:10.13335/j.1000-3673.pst.2016.11.036
Tentzerakis, S. T., and Papathanassiou, S. A. (2007). An Investigation of the Harmonic Emissions of Wind Turbines. IEEE Trans. Energ. Convers. 22 (1), 150–158. doi:10.1109/TEC.2006.889607
Xu, J., Qian, Q., Zhang, B., and Xie, S. (2019). Harmonics and Stability Analysis of Single-phase Grid-Connected Inverters in Distributed Power Generation Systems Considering Phase-Locked Loop Impact. IEEE Trans. Sustain. Energ. 10 (3), 1470–1480. doi:10.1109/TSTE.2019.2893679
Xu, Y., and Teng, X. (2020). Interaction of Sub-Synchronous Oscillation between Wind Turbine Clusters in Wind Farm. Electric Power Automation Equipment 40 (9), 156–162. doi:10.16081/j.epae.202008019
Yahyaie, F., and Lehn, P. W. (2016). Using Frequency Coupling Matrix Techniques for the Analysis of Harmonic Interactions. IEEE Trans. Power Deliv. 31 (1), 112–121. doi:10.1109/TPWRD.2015.2442573
Yang, G., Tai, N., and Zheng, X. (2016). Harmonic Interaction Analysis for Multi-Infeed HVDC System. Electric Power Automation Equipment 36 (1), 105–110. doi:10.16081/j.issn.1006-6047.2016.01.015
Yang, K., Bollen, M. H. J., Amaris, H., and Alvarez, C. (2016). Decompositions of Harmonic Propagation in Wind Power Plant. Electric Power Syst. Res. 141 (12), 84–90. doi:10.1016/j.epsr.2016.06.029
Yang, K., Bollen, M. H. J., Larsson, E. O. A., and Wahlberg, M. (2014). Measurements of Harmonic Emission versus Active Power from Wind Turbines. Electric Power Syst. Res. 108 (3), 304–314. doi:10.1016/j.epsr.2013.11.025
Yang, K., Bollen, M. H. J., and Wahlberg, M. (2011). “A Comparison Study of Harmonic Emission Measurements in Four Windparks,” in IEEE Power and Energy Society General Meeting, Detroit, MI, USA, July 24-28 2011, 1–7. doi:10.1109/PES.2011.6038926
Keywords: wind farm, primary emission, secondary emission, harmonic interaction, interaction factors
Citation: Shi J, Chen W, Wei Z, Pei X and Sun X (2022) Quantitative Analysis of the Interactive Influence for Harmonic Emission in Wind Farms. Front. Energy Res. 9:820963. doi: 10.3389/fenrg.2021.820963
Received: 23 November 2021; Accepted: 20 December 2021;
Published: 04 February 2022.
Edited by:
Yang Li, Northeast Electric Power University, ChinaReviewed by:
Jun Yin, North China University of Water Resources and Electric Power, ChinaChen Liang, Nanjing University of Information Science and Technology, China
Copyright © 2022 Shi, Chen, Wei, Pei and Sun. This is an open-access article distributed under the terms of the Creative Commons Attribution License (CC BY). The use, distribution or reproduction in other forums is permitted, provided the original author(s) and the copyright owner(s) are credited and that the original publication in this journal is cited, in accordance with accepted academic practice. No use, distribution or reproduction is permitted which does not comply with these terms.
*Correspondence: Wei Chen, 80658253@qq.com