The hydraulic fracturing design technology and application of geological-engineering integration for tight gas in jinqiu gas field
 Ji Zeng
 Wenzhe Li
 - Engineering Technology Research Institute, PetroChina Southwest Oil and Gas Field Company, Chengdu, China
Tight sandstone gas reservoir of Shaximiao formation in Jinqiu Gas field has the advantages of wide distribution and abundant resources. Due to its low porosity, low permeability and strong spatial heterogeneity, this reservoir puts forward high requirements for sweet spot identification, cluster design and hydraulic fracture morphology prediction. Since the conventional stimulation methods can not meet the requirement of economy, the geological-engineering integration model is established. This optimization model of multiple subjects could layout the relationship among engineering characteristics, hydraulic fracture shape and well productivity. Based on the simulation results, key controlling factors are identified and optimized. And the customized stimulation strategies are recommended for different reservoir quality and different channel sand. Through application of these methods, the average test well productivity in the target field increased from 50,500 cubic meter per day to 434,300 cubic meter per day, and it lay a solid foundation for the efficient development of tight gas in central Sichuan Basin.
1 Introduction
In recent years, with the complexity of oil and gas exploration objects, tight sandstone gas reservoirs have become an important replacement field. Jinqiu gas field in Sichuan Basin is rich in resources and widely distributed. It is an important new block for oil and gas exploitation in Sichuan and Chongqing. And significant breakthrough in technique has been made in exploration and development. The tight sandstone reservoir of Shaximiao Formation in this area generally shows low porosity, ultra-low permeability and strong heterogeneity. The river channel is narrow. There are 23 sand groups developed longitudinally (Figure 1). There are great differences in reservoir mechanical properties, in situ stress distribution characteristics and natural fracture development of different sand groups. At the initial stage of the study block, an excessive stimulation technology is mainly used to ensure the full utilization of the reservoir, however, the pertinence and economy of this stimulation technique are not high. To solve these problem in unconventional oil and gas resources development, a geological-engineering integration method is introduced (Rutqvist et al., 2016; Teran 2017). This method aims to improve the productivity of single well, and requires a comprehensive analysis of Geology and reservoir (Ayatollahy et al., 2013). It is a combination of geology and engineering, which breaks the disciplinary barrier and realizes interdisciplinary cooperation (Maity 2013). Through a series of modelling, an optimized reservoir stimulation could be made in a specific field. The concept has been preliminarily applied in Sulige tight gas reservoir, stress sensitive tight reservoir in the west of Kuqa, dolomite reservoir in Tarim Basin, conventional low permeability reservoir in JinQiu Oilfield and other regions or reservoirs (Rafiq 2015; Zhao et al., 2015; Yousefzadeh et al., 2019; Sgher, 2021), and achieved good results (Jon et al., 2010).
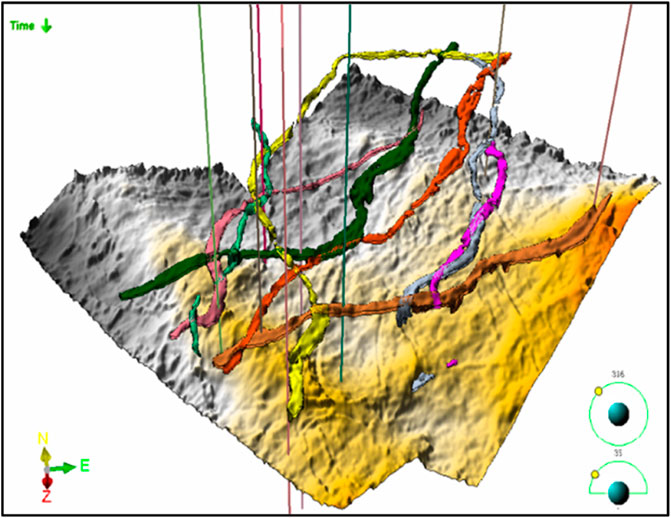
FIGURE 1. 3D characterization of Shaximiao formation channel in Jinqiu gas field.
This study summarizes the early stimulation filed tests in Jinqiu Gas field, then establishes geological model, fracture propagation model and productivity prediction model after hydraulic fracturing in Jinqiu Gas field. Through the coupling of these models, the integrated geological engineering reservoir stimulation design technology is realized in aiming gas field. This method effectively optimizes the fracturing parameters, realizes the differential stimulation technology, and supports the multi-stage stimulation and three-dimensional development of the river.
2 Geological characteristics and stimulation difficulties
Jinqiu gas field is located at the intersection of the middle paleo uplift and middle oblique gentle structural belt in Central Sichuan and the low gentle structural belt in the middle paleo depression in northern Sichuan. There are 23 sand groups developed in the tight gas of Shaximiao Formation in the study block. These sand groups have a burial depth of 1500–2200 m, a width of 400–900 m, a reservoir thickness of 10–25 m, an overburden permeability of 0.003–0.064mD, and a pressure coefficient of 0.3–1.2. It is highly heterogeneous, representing the characteristics of low porosity, ultra-low permeability and narrow channel.
In the early field tests, several rounds of technical research were carried out to form the multi fracture fracturing technology of multi clusters in the stage + variable viscosity slick water + high-intensity continuous sand injection. However, due to the influence of reservoir characteristics, tight gas has low porosity and permeability, and the influence range of single well, controlled reserve scale and cumulative production are limited. The main technical difficulties in improving the effect of regional implementation are reflected in two aspects.
1) The reservoir of Shaximiao formation is widely distributed, and the fault scale and natural fracture development degree vary greatly in different regions. Also, the lithologic boundary of channel sand body is complex, and the mechanical properties of sand and mudstone are quite different, therefore, it is difficult to carry out targeted stimulation. In the early practice, excessive transformation technology is adopted to ensure the stimulation effect. Because the permeability of tight sandstone reservoir is very low and the controlled reserves of single well are limited, the economic and efficient fracturing parameters need to be further optimized.
2) The brittleness index of the reservoir is low, the bedding of the reservoir is underdeveloped, and it is difficult to form a complex fracture network. In the early stage, the multi cluster process in the stage was mainly used to ensure the full utilization of the reservoir. However, due to the stress shadow effect, the small cluster spacing design led to the complexity of hydraulic fracture extension and the limited length of hydraulic fracture.
3 Geological-engineering integrated reservoir stimulation technology
In order to break through the difficulties in the stimulation of channel tight sandstone and improve the overall benefit, a geological-engineering integrated reservoir stimulation technology mode must be formed, which aims at benefit development and integrates multi-disciplinary and multi information. That is to say, it is necessary to carry out Fracturing and productivity simulation based on geological model in full combination with river channel distribution and reservoir physical properties, continuously optimize fracturing parameters and carry out targeted reservoir stimulation design guided by well productivity and expected rate of return.
3.1 Three-dimensional geological modeling
The three-dimensional geological model is an important foundation for fracturing design and numerical simulation, and a solid foundation for the research and application of geological engineering integration in this area. According to 3D seismic interpretation horizon, fault and well layered data, a regional 3D geological framework model is established, including fault model and layer model (Smart 2004).
The model controls the trend of attributes in seismic inversion (Maity 2013). The model is corrected with logging interpretation results. The three-dimensional geological modeling technology is used to establish the reservoir attribute model and the three-dimensional model of rock elasticity and strength attributes. Different from the three-dimensional image display of reservoir, the three-dimensional regional geological model can quantitatively represent the data volume of underground geological characteristics and the three-dimensional spatial distribution of reservoir parameters, which lays a foundation for subsequent research (Figure 2).
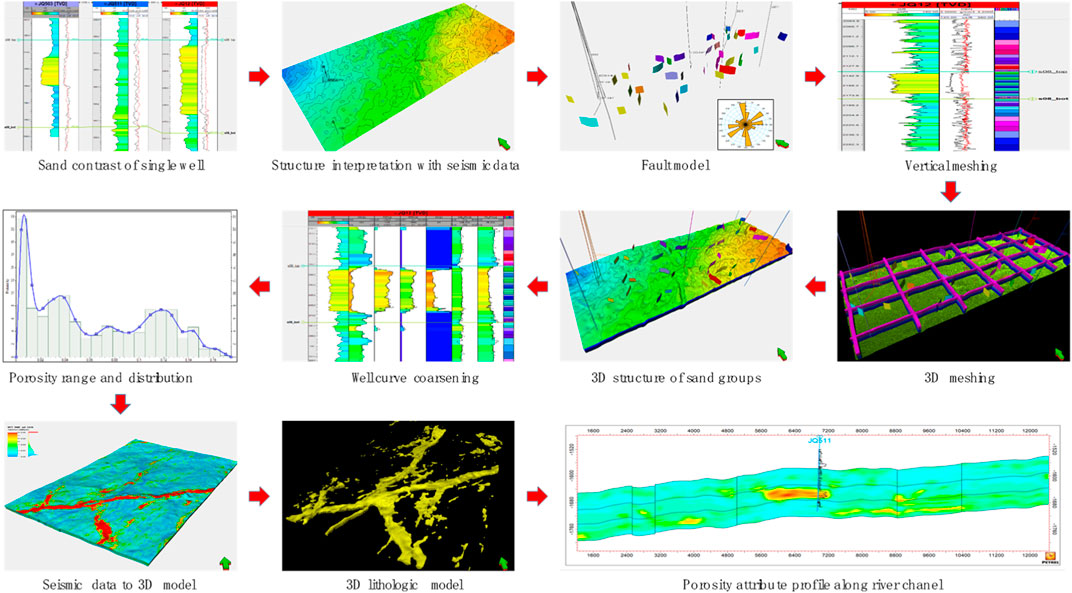
FIGURE 2. Technique flow.
3.2 Three-dimensional geomechanical modeling
The magnitude and direction of in situ stress affect the shape and trend of hydraulic fractures and are directly related to the effect of reservoir stimulation. In order to obtain the three-dimensional stress state of the reservoir, three-dimensional geomechanical modeling should be established firstly (Lark 2014). The core of modeling is to establish a three-dimensional geomechanical grid model based on the geological model. One-dimensional geomechanical model of single well and seismic inversion data are used to establish a static parameter model (Cao et al., 2001). Meanwhile, the model needs to consider the influence of the fault system on the stress field. And it is important to use the finite element simulator to calculate and simulate the current in situ stress field distribution.
3.2.1 Single well geomechanical modeling
One-dimensional geomechanical model of single well is established through processing logging data. Through sorting and analyzing the test results of single well core mechanics test, the transformation relationship of dynamic and static parameters is obtained, and the mechanical parameters of logging calculation are calibrated and checked (Figure 3). Single well rock mechanics modeling is mainly used to evaluate the rock mechanics properties and original field stress of single well, which provides an important data basis for three-dimensional geomechanics modeling.
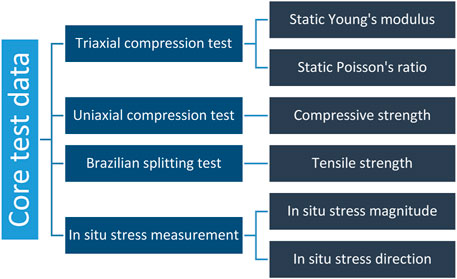
FIGURE 3. Core test and corresponding measured rock mechanical parameters.
3.2.2 Regional three-dimensional geomechanical modeling
On the basis of one-dimensional geomechanical modeling results of single well, a static parameter model is established by combining seismic inversion data (Yang et al., 2013). Considering the influence of the fault system on the stress field (Maerten et al., 2006), the regional three-dimensional geomechanical modeling work is carried out in the study area to evaluate the current in situ stress orientation, in situ stress field size and distribution law (Figure 4). At the same time, based on the three-dimensional in situ stress field, the limit stress state of the fault system is analyzed, and the fracture system in the limit stress state is selected to determine whether the fault surface will be activated under the action of the corresponding shear stress and normal stress.
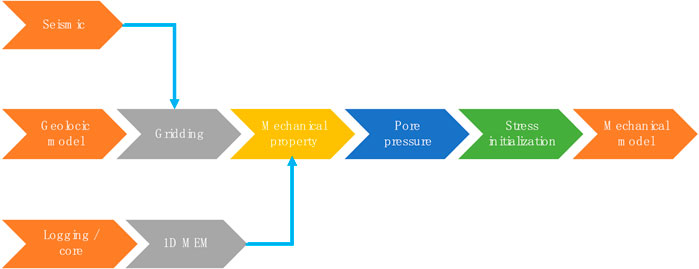
FIGURE 4. Regional 3D geomechanics modeling process.
3.3 Three-dimensional geomechanical modeling
The regional model grid can not meet the needs of subsection and cluster design and hydraulic fracture simulation. And the layered three-dimensional geological modeling method must be used, which is more accurate in describing the structure and reservoir characteristics near the well platform. Combining with the deployment platform location and well location, the regional three-dimensional geological model is modified with controlling the structural details and subtle changes of reservoir parameters in both vertical and horizontal direction (Figure 5). The platform model has higher resolution and can reflect the spatial changes of reservoir attributes more finely. It can effectively support fracturing numerical simulation optimization and productivity prediction.
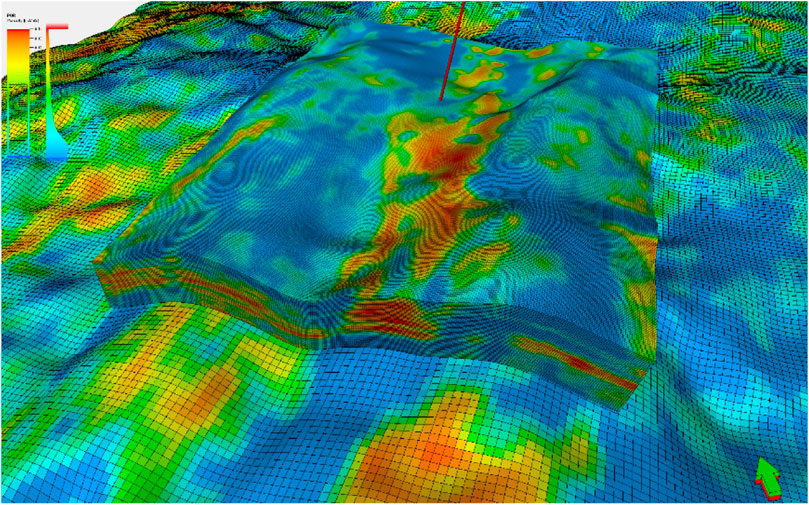
FIGURE 5. Comparison diagram of regional and platform models.
3.4 Three-dimensional model iteration update
Collecting new drilling data, including stratification, steering model and logging interpretation result data could help iterative updating of three-dimensional geological model and geomechanical model and deepen the understanding of structure, reservoir parameters and geomechanical characteristics (Wang et al., 2013; Han et al., 2019). And these updates lay a foundation for later fracturing design and optimization design (Figure 6).
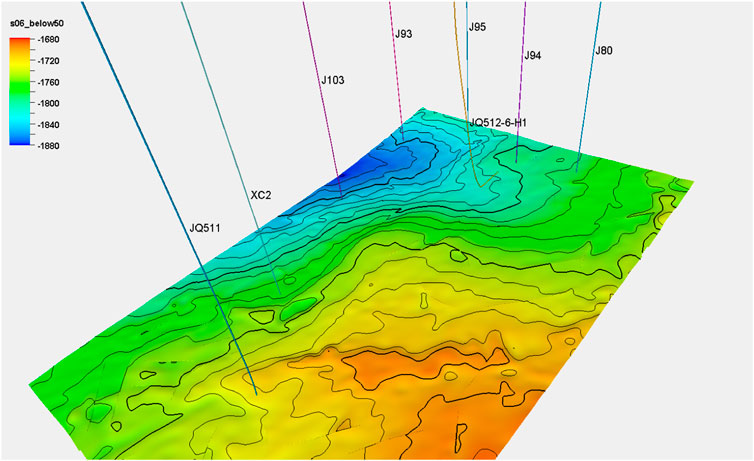
FIGURE 6. Correction of 3D structural plane by geological guidance comparison results.
3.5 The well productivity forecast model after hydraulic fracturing
The transport of natural gas in low-permeability reservoirs is complex (Friedel et al., 2006; Wang et al., 2017). The seepage of gas from the reservoir to the bottom hole is divided into two zones. One is the seepage in reservoir matrix. The other is the flow from the end of the fracture to bottom hole. Therefore, a new model of fracturing well capacity in tight gas reservoir considering the influence of multiple factors is established. The model is derived based on the following conditions.
① It is assumed that the reservoir is homogeneous and has equal thickness.
② The fracture is divided into n meshes, and the fracture height is equal to the thickness of the gas layer;
③ In the direction of fracture propagation, the fracture width and fracture permeability decrease gradually, and there is no pressure gradient in each unit;
④ The transport of natural gas is steady-state seepage flow, and single-phase isothermal seepage is considered.
The seepage model of the fracture is shown in Figure 7:
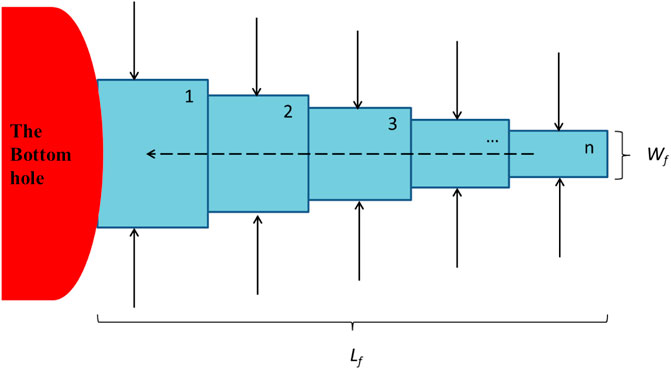
FIGURE 7. Simplified model of single-slit seepage flow.
3.5.1 Radial seepage at the end of the fracture
Under the influence of the starting pressure gradient, stress sensitivity and slippage effect, this paper establish the differential equation of seepage flow.
Set the well bottom hole at origin of coordinate system. Within the steady-state seepage field, the relationship between the radius of the cross-section circle and the pressure follows the equation below.
Pseudopressure function m(p) is introduced.
And the ultimate seepage function in this zone can be obtained.
3.5.2 Linear seepage on both sides of the fracture
For the linear flow on both sides of the fracture, a differential equation for seepage flow is established as Eq. 6.
Substitute pseudopressure function into Eq. 6.
3.5.3 Non-darcy seepage within hydraulic fracture
The permeability of hydraulic fractures is 50mD to 100mD, so the flow of gas in these fracture no longer meets the linear seepage of Darcy law (Shi et al., 2009; Pourafshary et al., 2015). Instead, the Fourier seepage differential equation should be more accurate in describing the seepage field.
The velocity of gas flow within hydraulic fracture vfi is calculated by Eq. 9.
Introducing pseudopressure function (Lim et al., 1992) into Eq. 9, the ultimate seepage function in this zone can be derived as Eq. 10.
3.5.4 Well productivity forecasting model
Define the number of fracture meshes as n, and name the mesh blocks from the bottom hole to the fracture front point from 1 to n:
The equation for the flow between the fracture grid and the matrix could be calculated by Eq. 12.
The model is solved by iterative method. And the outflow of the mesh block Q1 is the half-fracture yield.
3.6 Geological engineering integrated reservoir stimulation design
Previous fracturing design take induced stress (Taleghani et al., 2009; Dong et al., 2020) into consideration to recommend cluster spacing. And it pays attention to the optimization relationship between fracturing execution parameters and post-fracturing productivity (Qiu et al., 2013). Being different from previous fracturing design, geological engineering integrated reservoir stimulation design aims at maximizing benefit of gas reservoir.
By simulating the extension of hydraulic fractures in the three-dimensional fine geological model, the proppant transport model is established to simulate the proppant placement law under different construction parameters and pumping procedures, then the shape of propped fractures could be more accurate. Besides, by carrying out post fracturing productivity prediction and analysis (Ren et al., 2014), the optimal fracture properties at different river channel locations, including fracture configuration and fracture conductivity, are recommended. Combined with the multi fracture competitive extension model (Liu et al., 2019) and proppant transport model, the fracturing construction parameters and pumping procedures are optimized to achieve higher economy (Figure 8).
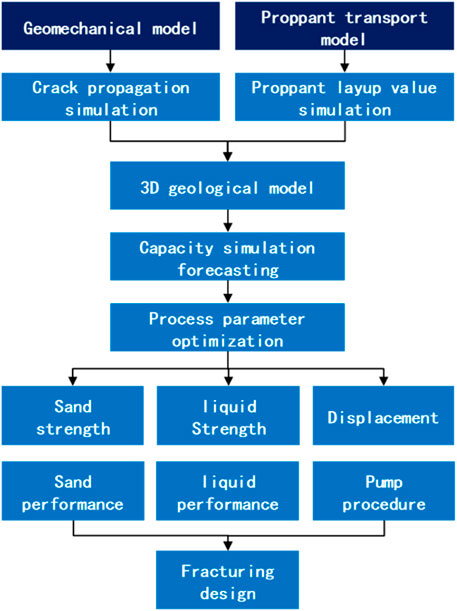
FIGURE 8. Fracturing design process.
4 Application of geological engineering integration
Taking JQ511 platform as an example, this paper analyzes the practice of geological engineering integration in platform wells in the study area. Well H1, Well H2, Well H3, and Well H4 are deployed on this platform. All these wells use geological engineering integration to optimize fracturing design. JQ511 platform is located at the intersection of two river courses. Affected by the river course trend, the included angle between the well trajectory of these three wells and the maximum horizontal principal stress of this platform is less than 60°. As a result, the control range of hydraulic fractures of these three wells should be limited. Using the integrated design idea of geological engineering, the reservoir is divided into three categories according to the reservoir quality, and customized design is carried out (Figure 9).
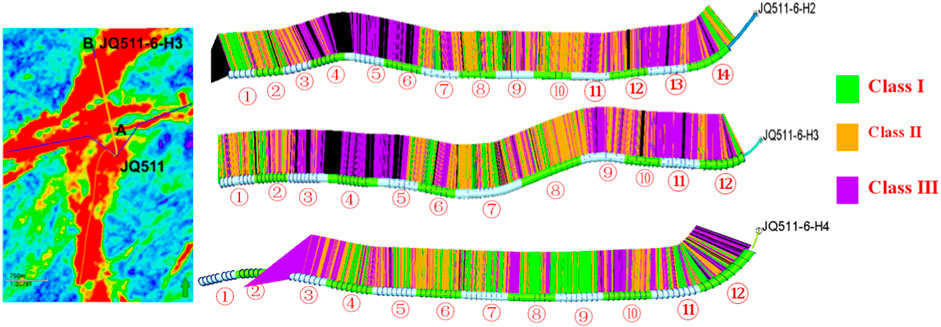
FIGURE 9. JQ511 platform geological model and reservoir quality classification of Well H2, Well H3 and Well H4.
4.1 Productivity sensitivity model after hydraulic fracturing
Based on the fine geological model of this platform and in combination with the reservoir classification standard of Shaximiao Formation in Jinqiu gas field shown in Table 1, the distribution range and physical property distribution interval of different types of reservoirs are extracted, and the post fracturing productivity sensitivity model is established (Figure 10).
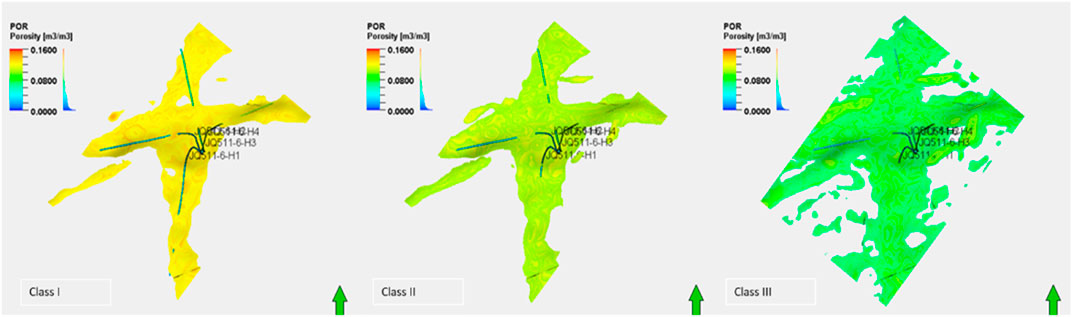
FIGURE 10. Distribution of different types of reservoirs in JQ511 platform model.
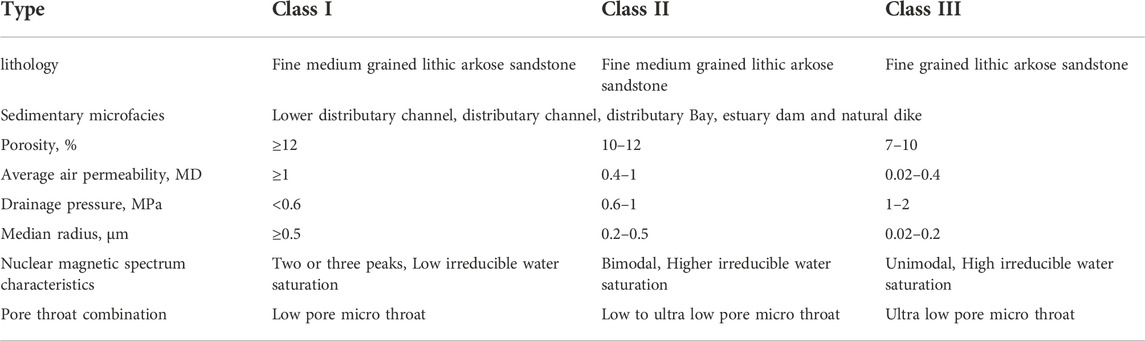
TABLE 1. Classification standard of Shaximiao Formation reservoir in Jinqiu gas field.
4.2 Well productivity sensitivity analysis after hydraulic fracturing
The single factor variable method is adopted to evaluate the influence law of engineering parameters such as cluster spacing, displacement and fracturing construction strength of different types of reservoirs under the guidance of stimulated productivity. This study figure out the main control engineering parameters of different types of reservoirs, and the optimization sequence of stimulation process and fracturing parameters. Affected by fluid filtration (Davletbaev, 2012) and inter fracture interference (Gorjian et al., 2021) during fracture propagation period, the fracture length of Class I reservoir is smaller than that of Class II and III reservoirs under the same fluid strength (Figure 11). The productivity and fluid strength of different reservoirs after fracturing climb up and then decline with the increase of fluid strength (Figure 12). Therefore, Class I reservoir of the platform considers to increase the liquid viscosity and reduce the liquid filtration. Class III reservoir selects the design range of liquid strength according to the inflection point principle to avoid over stimulation.
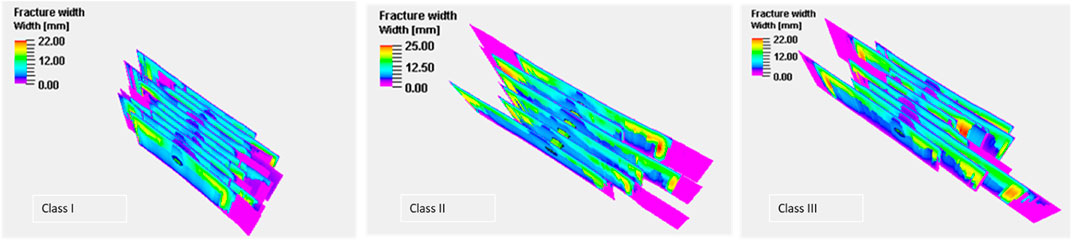
FIGURE 11. Simulated fracture length in various reservoirs of JQ511 platform at 14 m3/min displacement.
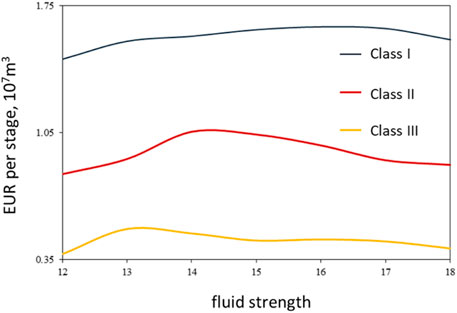
FIGURE 12. Simulated SRV in various reservoirs of JQ511 platform at 14 m3/min displacement.
According to the fracture propagation and productivity simulation results (Figures 13, 14), the main engineering factor in JQ511 platform fracturing design is cluster spacing. Affected by the angle between the borehole trajectory and the direction of in situ stress, enlarging the cluster spacing is helpful to reduce the interference between artificial fractures. At the same time, for Class I reservoir, it is considered to increase the liquid viscosity, reduce the liquid filtration and increase the artificial fracture length.
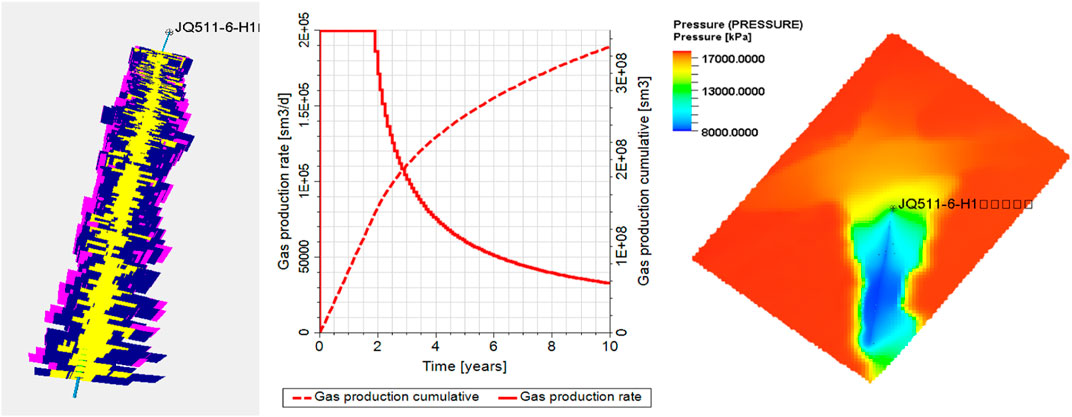
FIGURE 13. Optimization simulation results of Well H1.
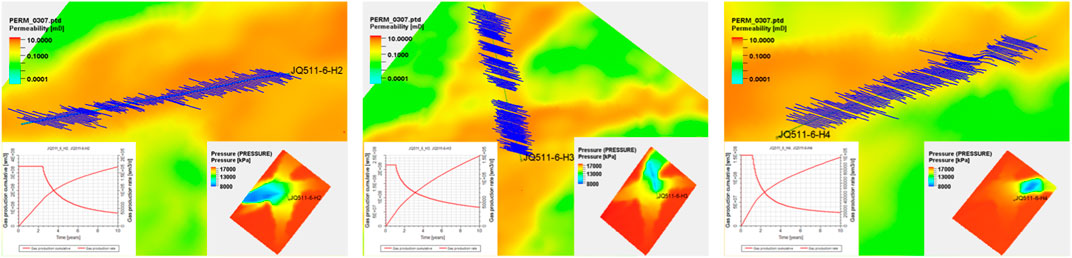
FIGURE 14. Simulation results of Well H2, Well H3, and Well H4 on JQ511 platform.
4.3 Platform fracturing design
Taking Well H1 as an example, according to the classification design results of reservoirs, the cluster spacing, fracturing fluid consumption, support amount and construction displacement are optimized (Table 2). Compare with original stimulation design, the amount of fracturing fluid used in Well H1 was reduced by 5.1%, proppant was reduced by 9.8%, the number of perforated clusters was reduced by 24.4%, and the average cluster spacing was increased by 40%.
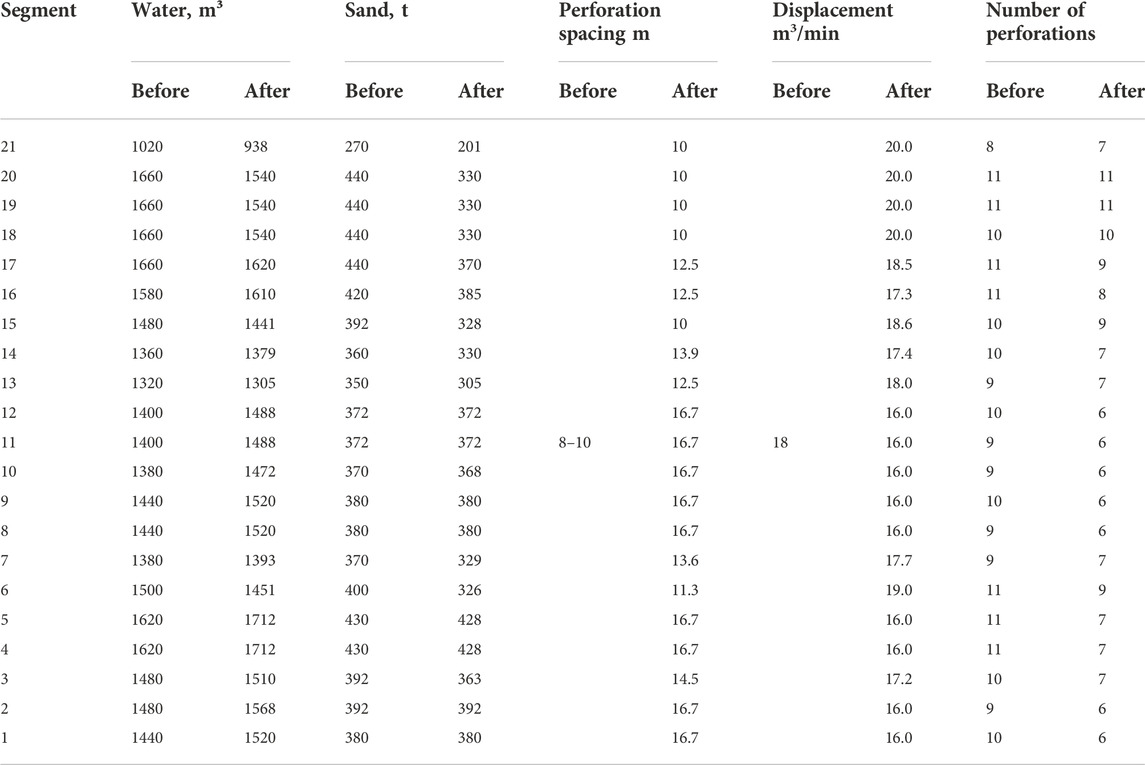
TABLE 2. Fracturing construction parameter optimization results.
Compared with previous design method, the optimized design method show advantages in the following aspects. The dynamic hydraulic length of Well H1 is increased by 23.8%. The propped fracture length increased by 22.6%. The effect of cluster spacing on SRV is not distinct. Use the same production system to forecast well productivity. The calculated stable production time of Well H1 with the optimized fracturing design could reach 1.9 years, which is 58.8% higher than that of the original fracturing design. Meanwhile, the 10-year end-of-term forecast cumulative gas production is 332 million cubic meters, showing an increase of 15.9% over before optimization.
According to the well productivity simulating model, the EUR of single gas well could be 156 million cubic meter to 210 million cubic meter.
5 Conclusion
1) With this geological engineering integrated simulation method of geology and engineering, the productivity prediction model of stimulated well in tight river sandstone gas reservoir is established. A more accurate fracture model is derived to describe fracture morphology and hydraulic fracture properties. Then, the horizontal well productivity prediction model is established in the unstructured meshes, which also take stress sensitivity influence into consideration.
2) The reservoirs in Jinqiu gas field are divided into three types according to their properties.
By means of integrated simulation, this paper defines the main engineering parameters of productivity in each type of reservoir, which includes cluster spacing, number of clusters in a single stage, fracturing strength, construction displacement, and proportion of pre-pad. And this set of parameters ultimately constitutes the optimal stimulation strategy. This horizontal well fracturing design process could be conductive to the field application of reservoir reconstruction in the future Maity et al., 2013.
Data availability statement
The raw data supporting the conclusions of this article will be made available by the authors, without undue reservation.
Author contributions
JZ contributed to the conception of the study WL performed the experiment HF contributed to the modeling XH performed the data analyses TW performed the simulation DZ helped perform the analysis SY helped perform the simulation.
Conflict of interest
JZ, WL, HF, XH, TW, DZ, SY, were empolyed by PetroChina Southwest Oil and Gas Field Company.
Publisher’s note
All claims expressed in this article are solely those of the authors and do not necessarily represent those of their affiliated organizations, or those of the publisher, the editors and the reviewers. Any product that may be evaluated in this article, or claim that may be made by its manufacturer, is not guaranteed or endorsed by the publisher.
References
Ayatollahy, T. T. (2013). Integrated workflow for characterizing and modeling fracture network in unconventional reservoirs using microseismic data. Atlanta, GA, USA: Scholars' Press.
Cao, H., Claverie, M., Cao, D., Endo, T., and Yamamoto, H. (2001). Integrated interpretation of well logs and surface seismic. J. De. Pediatr. 1.
Davletbaev, A. Y. (2012). Fluid filtration in a porous medium with wells with vertical hydraulic fracture of the formation. J. Eng. Phys. Thermophy. 85 (5), 997–1003. doi:10.1007/s10891-012-0739-1
Dong, K. X., Wang, S. L., and Li, J. B. (2020). Mechanism of fracture propagation turning induced by interfacial shear. Singapore: Springer.
Friedel, T., and Voigt, H. D. (2006). Investigation of non-Darcy flow in tight-gas reservoirs with fractured wells. J. Pet. Sci. Eng. 54 (3-4), 112–128. doi:10.1016/j.petrol.2006.07.002
Gorjian, M., Hendi, S., and Hawkes, C. D. (2021). An analytical framework for stress shadow analysis during hydraulic fracturing. Saskatchewan, Canada: Applied to the Bakken Formation.
Han, G. Q., Xiao-Ming, G. E., Huang, R., Yang, H., and Guo, C. E. (2019). Seismic data application in horizontal well design of m oilfield in orinoco heavy oil belt. Prog. Geophys. 34.
Jon, Z., and Eolon, Z. (2010). Estimating natural fracture producibility in tight gas sandstones: Coupling diagenesis with geomechanical modeling. Ahmedabad, Gujarat, India: The Leading Edge.
Lark, R. M., Mathers, S. J., Thorpe, S., Arkley, S., Morgan, D. J., and Lawrence, D. (2013). A statistical assessment of the uncertainty in a 3-d geological framework model. Proc. Geologists'. Assoc. 124 (6), 946–958. doi:10.1016/j.pgeola.2013.01.005
Lim, K. T., Enedy, K. L., Bloomfield, K. K., and Aziz, K. (1992). “Application of a matrix-fracture transfer pseudofunction in geothermal reservoir simulation,” in Office of scientific & technical information technical reports. Texas, USA: Unt digital library.
Liu, W., Liu, J., Hua, J., Wang, X., and Xiao, J. (2019). Friction types of hydraulic fracturing and measures for reducing friction. Petrochem. Ind. Technol. 10.
Maerten, L., Gillespie, P., and Daniel, J. M. (2006). Three-dimensional geomechanical modeling for constraint of subseismic fault simulation. Am. Assoc. Pet. Geol. Bull. 90 (9), 1337–1358. doi:10.1306/03130605148
Maity, D., Chen, Q., and Aminzadeh, F. (2013). “Integrated fracture characterization and associated error evaluation using geophysical data for unconventional reservoirs,” in Proceedings of the Pacific Section AAPG, SEG and SEPM Joint Technical Conference, CA, USA, April 2013.
Maity, D. (2013). “Integrated reservoir characterization for unconventional reservoirs using seismic, microseismic and well log data,”. Dissertations & Theses (Canada: Gradworks).
Pourafshary, P., Saboorian-Jooybari, L., and Hadi, F. (2015). Significance of non-Darcy flow effect in fractured tight reservoirs. J. Nat. gas Sci. Eng. 24, 132–143. doi:10.1016/j.jngse.2015.03.003
Qiu, X., Li, Z., and Liu, Y. (2013). Analysis of productivity equation and influence factors of horizontal wells in tight sand gas reservoir. J. Southwest Petroleum Univ. 15 (12), 2337–2350. Haidian, Beijing, and China.
Rafiq, A. (2015). Integrated interpretation of microseismic with surface seismic data in a tight gas reservoir. Central Alberta, Canada: Doctoral dissertation, University of Calgary.
Ren, J., Zhang, L., Ezekiel, J., Ren, S., and Meng, S. (2014). Reservoir characteristics and productivity analysis of tight sand gas in upper paleozoic ordos basin China. J. Nat. Gas. Sci. Eng. 19, 244–250. doi:10.1016/j.jngse.2014.05.014
Rutqvist, J., Jeanne, P., Dobson, P. F., Garcia, J., Hartline, C., Hutchings, L., et al. (2016). The northwest geysers egs demonstration project, California – part 2: Modeling and interpretation. Geothermics 63 (1), 120–138. doi:10.1016/j.geothermics.2015.08.002
Sgher, M. E., Aminian, K., and Ameri, S. (2021). “Evaluation of hydraulic fracturing treatment with microseismic data analysis in A marcellus shale horizontal well,” in Proceedings of the SPE Western Regional Meeting, April 2021.
Shi, Y., Yang, Z., and Huang, Y. (2009). Study on non-linear seepage flow model for low-permeability reservoir. Acta Pet. Sin. 30 (5), 731–734.
Smart, K. J., Ferrill, D. A., Sims, D. W., Franklin, N. M., Ofoegbu, G. I., and Morris, A. P. (2004). “Integrated structural analysis and geomechanical modeling: An aid to reservoir exploration and development,” in Proceedings of the 6th North America Rock Mechanics Symposium (NARMS), Houston, Texas, June 2004.
Taleghani, A. D. (2009). Analysis of hydraulic fracture propagation in fractured reservoirs : An improved model for the interaction between induced and natural fractures. Diss. Theses - Gradworks 5 (12), S58.
Teran, O. J. (2017). “Mapping unconventional reservoir stress conditions: An integrated workflow using geological, stimulation and microseismic data,” in Proceedings of the Unconventional Resources Technology Conference, Austin, Texas, USA, July 2017.
Wang, D. D., Zhou, Y. B., Zhong-Zhen, M. A., Liu, Y. M., and Lin, J. C. (2013). Application of horizontal wells in geological statistical inversion. Prog. Geophys. 28 (3), 1522–1530.
Wang, X., and Sheng, J. J. (2017). Effect of low-velocity non-Darcy flow on well production performance in shale and tight oil reservoirs. Fuel 190, 41–46. doi:10.1016/j.fuel.2016.11.040
Yang, R. Z., Zhao, Z. G., Peng, W. J., Gu, Y. B., Wang, Z. G., and Zhuang, X. Q. (2013). Integrated application of 3d seismic and microseismic data in the development of tight gas reservoirs. Appl. Geophys. 10, 157–169. doi:10.1007/s11770-013-0374-4
Yousefzadeh, A., Li, Q., Aguilera, R., and Virués., C. (2019). Integrated interpretation of microseismic and petroleum-engineering data for comparison of gas production in two interfering adjacent wellpads in the horn river basin, Canada. SPE Prod. operations 35 (2), 255–271. doi:10.2118/197048-pa
Keywords: tight sandstone gas, shaximiao formation, geological-engineering integration, hydraulic fracture, differentiation stimulation strategies
Citation: Zeng J, Li W, Fang H, Huang X, Wang T, Zhang D and Yuan S (2022) The hydraulic fracturing design technology and application of geological-engineering integration for tight gas in jinqiu gas field. Front. Energy Res. 10:1003660. doi: 10.3389/fenrg.2022.1003660
Received: 26 July 2022; Accepted: 31 October 2022;
Published: 22 November 2022.
Edited by:
Shuai Zhao, Southwest Petroleum University, Chengdu, ChinaReviewed by:
Yanchun Ling, University of North Carolina at Chapel Hill, United StatesBing Hou, China University of Petroleum, Beijing, China
Copyright © 2022 Zeng, Li, Fang, Huang, Wang, Zhang and Yuan. This is an open-access article distributed under the terms of the Creative Commons Attribution License (CC BY). The use, distribution or reproduction in other forums is permitted, provided the original author(s) and the copyright owner(s) are credited and that the original publication in this journal is cited, in accordance with accepted academic practice. No use, distribution or reproduction is permitted which does not comply with these terms.
*Correspondence: Ji Zeng, zj_516@outlook.com