Research on the uncertainty problem of SDG fault diagnosis based on information flow
 Jiahui Huang
 Jie Liu
 Xiaohua Yang
 Jiayu Ma1
 - 1School of Computer Science, University of South China, Hengyang, Hunan, China
- 2School of Electrical Engineering, University of South China, Hengyang, Hunan, China
Accurate and complete diagnosis of nuclear accidents is the primary link to nuclear emergencies. The signed directed graph (SDG), as a common method of fault diagnosis, has good completeness. However, if there are feedforward and negative feedback control loops, compensation response and reverse response will be generated in the process of fault occurrence and propagation, which makes the state of the compensation variable and reverse variable uncertain, thus destroying the compatibility of the fault propagation path, leading to incomplete SDG reverse reasoning. In order to solve this problem, this paper proposes a SDG fault diagnosis method based on information flow. This method first finds out all the directed edges with the compensation variable or inverse variable node as the endpoint. By comparing the goodness of fit between the information flow on these directed edges and their total information flow curves, the path that contained the directed edge represented by sub-information flow with the highest
1 Introduction
The signed directed graph (SDG) is a network diagram composed of directional branches between nodes, which has strong expression ability for large-scale complex systems (Liu, 2022). At the same time, as an initial response model, as long as completed and accurately sampled SDG model samples can be obtained, it can identify the fault source and show the fault propagation path clearly and completely. Unlike conventional quantitative-based or data-driven approaches, the signed directed graph (SDG) model uses a comprehensive graphical formalism for fault diagnosis, does not require a precise mathematical description or complete operational data, and can be developed from partial information of the state equations or the operator’s experience (Liu et al., 2019). Moreover, SDG fault diagnosis does not need to preset fault sets, does not rely on diagnosis examples and diagnosis experience, and can also diagnose multiple faults and explain the diagnosis conclusions, which has great advantages, Therefore, the SDG model is widely used in the fields of safety evaluation and fault diagnosis of industrial processes (Wu, 2018). However, in the industrial process, due to the existence of feedforward and negative feedback structures, the node state and fault propagation path of SDG will generate compensatory responses and inverse responses during the fault occurrence and propagation process (Liu, 2022), making the final response inconsistent with the initial response. Also, the state of the compensation variable and the inverse variable will also become uncertain, which will destroy the compatibility of the fault propagation path, resulting in the failure of fault diagnosis. However, the fault diagnosis of the SDG model can be more accurate only when these responses are fully considered. And data fusion can combine different studies to make comprehensive and accurate analysis decisions (Li et al., 2021). Eliminating the influence of compensation response and inverse response on fault diagnosis can be achieved by extending the SDG model into E-SDG or improving the fault diagnosis method through data fusion technology to incorporate the response (Liu, 2022).
Previously, we found that introducing the information flow method to SDG fault diagnosis can improve the efficiency of the fault location (Huang et al., 2022). Since the size of information flow can represent the causal strength, the causal influence of each causal pair with the researched variable as the effect variable can be obtained by comparing the goodness of fit of the total information flow curve and each sub-information flow curve. If the goodness of fit of the sub-information flow
The contributions of the work are as follows:
1) By introducing information flow technology, the qualitative SDG model is extended to the quantitative FR-SDG model. Because calculating information flow is simple and intermediate results do not need to be saved when SDG reverse or forward reasoning is conducted, so it has lower time and space complexity in quantitative calculation of causal influence. Also, the difficulty of modeling is reduced.
2) Aiming at the problem of the causal influence of causal pairs, a method to calculate the goodness of fit of curves based on information flow is proposed. This method has the advantage of real-time in the calculation of causal influence. It can observe the fitting results in real-time to obtain the directed edge with the largest causal strength, so as to achieve fault traceability. In the quantitative FR-SDG model, the fault source with the largest probability can be obtained through reverse reasoning according to the directed edge with the highest goodness of fit.
3) A quantitative FR-SDG model is proposed to solve the problem of the state of the uncertain nodes caused by compensation response or inverse response. This method first finds out all the directional edges with the compensation variable or inverse variable node as the endpoint. By comparing the goodness of fit between the information flow on these directional edges and their total information flow curve, the path P, where the directed edge represented by sub-information flow with the highest
2 Related work
In Ali et al. (2022), the traditional PCA–SDG algorithm is a single-scale fault detection and diagnosis (FDD) and cannot effectively solve the problem of multiple FDDs. Based on the wavelet multi-scale PCA–SDG monitoring technology that can easily distinguish deterministic and random features, the root cause is detected, diagnosed, and analyzed, and the fault propagation path is determined.
For the problem of low diagnostic deterministic and difficulty in obtaining wrong data, the Ma and Li (2017) combined the neighborhood rough set with SDG to improve the diagnostic efficiency without prior knowledge. The node state in the SDG model is described as a continuous fuzzy membership degree. It simplifies the diagnostic rules from the neighborhood rough set decision table established by the fuzzy signed directed graph model, and the diagnostic rule base can be updated with the help of the fuzzy compatible path derived from the signed directed graph. This method can effectively simplify the fault variables and improve the diagnosis efficiency.
In order to achieve deterministic fault location, Ma et al. (2021) proposed a fault diagnosis model of a primary loop system based on principal component analysis (PCA) and signed directed graph (SDG). The PCA–SDG model is established with the primary loop system as the diagnostic research object, the residuals of monitoring parameters are analyzed by PCA, and the occurrence of faults is judged, and then the SDG model is used for reverse reasoning to find potential fault types and achieve effective fault diagnosis.
In order to improve the authenticity and sensitivity of process monitoring and FDD, Guohua et al. (2021) first used three-level thresholds for process monitoring to ensure the deterministic ability of alarm signals and determined candidate faults according to SDG reverse reasoning of alarm parameters. According to the candidate faults, SDG forward inference is applied to obtain candidate parameters. The five-level threshold and qualitative trend analysis (QTA) were then combined to determine qualitative trends in candidate parameters to be used by FDD. Finally, combined with the qualitative trend of the alarm parameters and the candidate parameters, SDG forward inference is carried out to identify the real fault.
Yang and Yao (2020) aimed at the problem of fault diagnosis and traceability of the industrial production control system data network, based on the structural characteristics of the industrial production control system data network, established the SDG model of the system, and reduced the search space of fault location through hierarchical and domain modeling. On this basis, according to the observed semaphore extracted when the business alarm occurs, combined with longitudinal data and survival data, the node survival analysis is carried out. Second, combined with the analysis of fault characteristics in the data network of the industrial production system, the single-node fault determination method is used to determine whether each node equipment is faulty; finally, the root cause of the network fault is determined by combining the cause classification of the fault traceability database in the traceability diagnosis rule to realize the fault traceability.
Wang et al. (2019) proposed an improved signed directed graph (ISDG) fault diagnosis model and two algorithms to meet the requirements of multiple fault diagnosis. One algorithm can obtain multiple fault combinational logic, and another algorithm can obtain the optimal path for fault diagnosis. The logic and effects between nodes are included in the ISDG model. Using the ISDG model, complex logic can be displayed, multiple faults can be diagnosed, and the optimal sequence can be determined.
Smaili et al. (2017) proposed a new SDG-based framework for fault detection and isolation for the purpose of fault detection and isolation. The general model can systematically derive qualitative fault feature matrices from qualitative redundancy relations. Whenever an anomaly is not isolated, principal component analysis and reverse/forward propagation through the path on the SDG model are combined to improve fault handleability.
In order to solve the problem of cross-linking fault diagnosis in complex systems, Cong et al. (2020) proposed a fault diagnosis method based on an optimized SDG model. In this method, the system structure is layered, and the top–down layered structure is realized by using the control bridge. The layered SDG is used to describe the hierarchical structure of the system, so that fault information propagates unidirectionally according to the layer. The reverse search strategy based on the fault propagation matrix is adopted to judge the compatible paths, obtain the candidate fault source set, and use the availability to objectively evaluate the influence of multiple fault sources, so as to improve the efficiency of troubleshooting.
Tian et al. (2021) proposed a new identification method combining two-step cluster analysis and signed directed graph (TSCA-SDG) for the problem that abnormal working conditions are difficult to identify in industrial production. First, variables are efficiently selected and extracted through correlation analysis and R-type cluster analysis. Then, a two-step cluster analysis was performed on the selected variables to obtain clustering results. By establishing a signed directed graph (SDG) model, the causes of abnormal operating conditions and their mutual effects are deduced from the mechanism.
Ma et al. (2020) introduced the SDG model into the fault diagnosis of the secondary loop system, analyzed the influence relationship between key parameters and faults, established the SDG model of the secondary loop system, and used the Warshall algorithm for layering reliable fault diagnosis.
The aforementioned research references fully reflect the advantages of SDG in the field of fault diagnosis. On the basis of the good completeness of SDG, or from a quantitative perspective, various data fusion methods are introduced into the SDG model to improve the resolution of fault location; or the SDG model should be expanded or optimized to build a layered semi-quantitative SDG model to improve the efficiency of fault diagnosis. However, the existing technologies or methods cannot solve the problem of fault diagnosis uncertainty caused by the compensation response and inverse response structures in the SDG model. Therefore, the method of determining the node state of the compensation variable or the inverse variable in the SDG model based on the information flow proposed in this paper is very necessary for realizing the fault diagnosis of industrial processes with feedforward or negative feedback structures. It can make the blocked fault propagation path in the final response of the SDG meet the compatibility rule again, and then the next step of fault tracing can be carried out.
Hu et al. (2021), aiming at the problem that data incompleteness caused by equipment failure or network interruption seriously hinders the implementation of pipeline condition monitoring, a three network form of the generative adversary network (tnGAN) is proposed to deal with the leakage detection problem of incomplete sensor data, which realizes different incomplete data recovery situations, including individual loss and random loss. It can also be aggregated by judging the output and characteristics of the network, and the detection result of pipeline leakage is obtained.
In the study of Ma et al. (2019), aiming at the problem of power system situational awareness with massive measured data, a graph theory–based network partitioning algorithm is first proposed to achieve decentralized detection with deterministic response speed, highlighting the independence of different groups by using the power flow characteristics. A hierarchical event detection method is further proposed, which can judge the voltage change and locate the event location according to the spectral distribution change of the established multi-dimensional matrix, so as to obtain the accurate results of the evaluation of the system situation and the occurrence of weak events in the system.
Hu et al. ( 2021) and (Ma et al. (2019) mainly solved the problem of leakage detection of incomplete sensor data and the problem of situational awareness and evaluation of the power system from the perspective of data-driven and hierarchical detection. This fault detection method is very innovative and superior for fault diagnosis at the equipment level, and the method in this paper is based on fault diagnosis at the system level. Although it is different from the SDG fault diagnosis method used in this paper, it still has great significance of reference for this paper.
Maurya et al. (2005) established a unified control loop SDG model and proposed a steady-state fault diagnosis algorithm that combines the forward and reverse reasoning of steady-state systems. This method only uses the measurement variables and the flags of the directional arc and improves the diagnostic resolution by using stability information or redundant equations, which require further expansion when dealing with multiple failure scenarios due to the need for a detailed model to generate redundant equations, which are expensive to develop for large-scale processes. Moreover, the algorithm is only used for steady-state SDG diagnosis to solve the problem of incomplete reverse reasoning caused by the control loop and cannot adapt to the situation that some devices reach a stable state after the fault occurs, while other parts are still dynamically evolving, However, because the information flow is independent, even if the coupling of the system structure is very high, the method proposed in this paper is still suitable for the treatment of a variety of complex control loops and fault conditions.
Liang–Kleeman information flow technology is widely used in causal analysis. Without any prior knowledge, given two-time series, how much information is transmitted between the two time series in unit time, quantitatively representing the causal effect between the two (San, 2016). At present, information flow is mainly used in the cause-seeking stage, and many researchers use information flow causal analysis to predict the cause. Gong et al. (2019) used the causal analysis method based on the information flow theory to study the causal relationship between the AMO observed since 1880 and the North Atlantic sea surface heat flux and found that on a multi-decadal scale, from AMO to sea surface heat flux, the amount of information flow is much larger than the information flow in the opposite direction of the two, indicating that the AMO is the cause of the North Atlantic sea surface heat flux anomaly, and the ocean dominates the heat exchange between the sea and the atmosphere. Lu et al. (2019) used information flow theory to analyze precipitation due to the causal effect between the landslide and debris flow disasters, this method has a good improvement in the deterministic prediction of high landslide debris flow disasters.
Previously, we introduced the coefficient of variation (CV) to compare the magnitude of the information flow jump of the key causal pairs in each compatible path, so as to obtain the fault source with the highest probability of occurrence and verified that the information flow method can improve FDD on the SDG model (Huang et al., 2022). The resolution of fault location plays a significant role, and the preliminary application of information flow in the characterization of causal influence is explored, that is, description of causality. On this basis, this paper further studies the SDG deterministic diagnosis method based on information flow, and the uncertainty of fault diagnosis in the SDG model with compensation response or inverse response structure is mainly solved. This method first finds out all the directed edges with the compensation variable or inverse variable node as the endpoint. By comparing the goodness of fit between the information flow on these directed edges and their total information flow curves, the path that contained the directed edge represented by sub-information flow with the highest
3 Relevant theories
3.1 SDG model
The SDG is a network graph composed of nodes and directed connections between nodes. It is a qualitative model that uses nodes and connections between nodes to express complex causal relationships between variables in the system and can contain large-scale potential information in the system. In fact, the SDG model has a strict mathematical description.
Definition 1.1: SDG model
(1) The directed graph consists of four parts
(A) Node set
(B) Branch set
(C) Adjacency associator “
(2) Function
Definition 1.2: SDG model sample is the sample of the SDG model
Definition 1.3: Valid node SDG model
Definition 1.4: Consistent arc if
Definition 1.5: Consistent path A path composed of consistent branches is called a consistent path. In fault diagnosis, a fault can only propagate and evolve through a consistent path.
Definition 1.6: Initial response (InR: initial response): the initial response of a system variable refers to its initial non-zero response. The initial response of the system refers to the system response in which all system variables exhibit the initial response in the shortest time. It should be noted that the so-called non-zero response here is for the threshold.
Definition 1.7: Final response (FR: final response): the final response refers to the steady-state response of a dynamic system. The evolution of a dynamic system consists of three stages, namely, initial response, intermediate transient, and final response.
Definition 1.8: Compensatory response (CR: compensatory response): compensatory response refers to the phenomenon that the corresponding process variable exhibits zero steady state under the action of non-zero deviation of external variables, and the process variable is called the compensatory variable (CV: compensatory variable).
Definition 1.9: Inverse response (IR: inverse response): the inverse response refers to the phenomenon that the final response of the corresponding process variable is opposite to the initial response under the action of the non-zero deviation of the external variable. This process variable is called the inverse variable (IV: inverse variable).Under the action of the compensation response and inverse response, the state {+,0,-} of the nodes in the SDG model will change uncertainly, that is to say, when the fault occurs, it does not appear as 0→
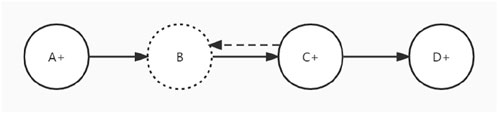
FIGURE 1. Basic structure of CR.
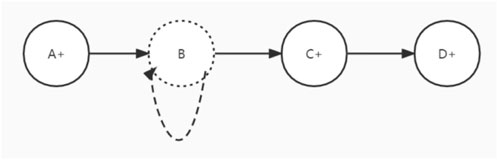
FIGURE 2. Basic structure of IR.
3.2 Coefficient of determination
Goodness of fit refers to how well the regression line fits the observed values. A statistic that measures goodness of fit is the coefficient of determination
where
3.3 Information flow
The information flow theory is a set of theories proposed by Liang Xiangsan (Yang and Yao, 2020) and others on the basis of information entropy to calculate and analyze the causal relationship from a quantitative point of view. The information that one entity passes to another entity is the information flow. According to the zero causality criterion (Guohua et al., 2021), behind a pair of causal relationships, there must be an information flow. The information flow method can quantitatively represent the causal relationship between the two time series X1 and X2 without any prior knowledge. However, the importance of information flow goes far beyond its implied causality, uncertainty propagation, predictability transfer, etc. It is widely used in neuroscience, finance, climate science, turbulence research, network dynamics, and dynamical systems, especially the synchronization field (Yang and Yao, 2020).
If the n-dimensional vector of random variables
where A=(
where
Since the information flow is a vector, the total information flow can be obtained by algebraically summing all the information flows related to the specified research variable (always the result variable) in the process. The total information flow can describe the research variables affected by different causal relationships. The information entropy change in the final state compared with the initial state before any causal relationship is not affected, and its calculation formula is defined as
If the information flow is graphed in a transient state, the total information flow curve is a regression curve, and each sub-information flow curve is an observation curve. The causal influence of a causal pair is where the variable is the effect variable. If the highest goodness of fit of the sum of information flow
In the field of fault diagnosis of the primary loop system of a nuclear reactor, the information flow under normal conditions is stable and weak. When a fault occurs, the information flow will jump and the value will become larger. The hopping multiple of the flow can even reach several thousand times. In the SDG model, if the information flow received by an abnormal node is mainly generated by the causal pair
3.4 Extended FR-SDG model
The SDG model is an initial response model. In the SDG model, if there are CV and IV, the initial response corresponds to the dynamic information that the CR and IR actions have not yet occurred, and the final response corresponds to the state information that the CR and IR actions have occurred. In the dynamic information of the initial response, the state and response time of each node give both the failure mode and the failure sequence. In the status information of the final response, the status of each node gives the failure mode, but it is likely that the failure path search cannot be performed. In the final response, the state of the CV or IV node is uncertain due to the action of CR and IR, thus cutting off the compatible path. In order to solve the uncertainty caused by CR and IR, an extended FR-SDG steady-state model is established based on the information flow data fusion method to describe the state information of the final response. The goodness of combination is combined with the initial response and the FR-SDG model to trace the fault to overcome the influence of CR and IR. The flowchart of FR-SDG model construction is shown in Figure 3.
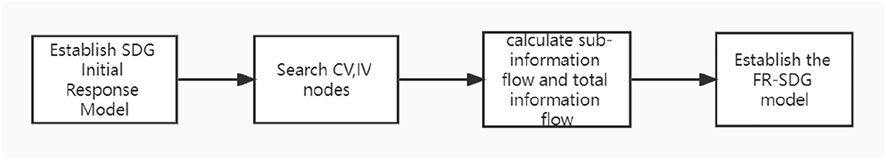
FIGURE 3. Flowchart of FR-SDG model construction.
3.4.1 Establishing the SDG initial response model
The fault diagnosis based on the FR-SDG model first requires the establishment of a SDG initial response model that more accurately reflects the system structure and function. Algorithm 1 is as follows:
Input: abnormal symptom node
A According to empirical knowledge, find out all the variables
B Calculate information flow
C According to the empirical knowledge, system structure, operation principle, and other information, check and modify the SDG fault model until it is qualified
Output: SDG initial response model
Algorithm 1. ⅩⅩⅩ.
Figure 4 shows an initial response model describing causal relationships between variables and faulty nodes (represented by boxes), where solid red nodes represent a node that values above the threshold, and solid blue nodes represent a node that values below the threshold. At this time, the information contained in the SDG model is dynamic and unstable. According to the SDG initial response model, the state of the node that is not affected by CR and IR can be intuitively seen, and the SDG initial response model is complete and can obtain all possible fault sources, but the resolution is low. It is necessary to establish a FR-SDG model for comprehensive detection to improve the efficiency of fault diagnosis.
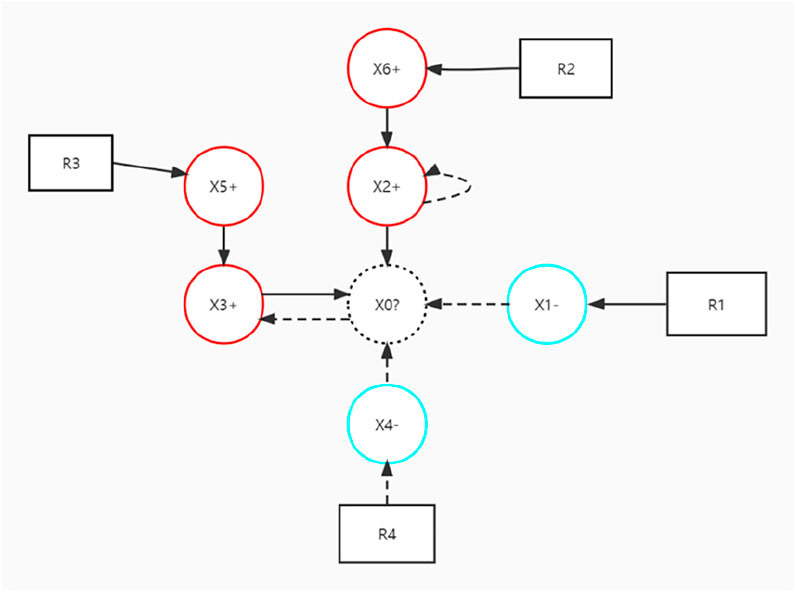
FIGURE 4. SDG initial response model.
3.4.2 Searching CV and IV nodes
Algorithm 2 for searching CV and IV nodes is as follows:
Input: SDG fault model
A According to the basic structures of CR and IR described in Figures 1, 2, find out the CR, IR, and their corresponding CV and IV.
B Analyze the state combinations of nodes and edges to obtain all compatible paths. Find CVs and IVs in the fault propagation path that have equivalent effects to CR and IR but do not have obvious structures.
C Summarize the CVs and IVs found in steps a and b to form set_cv{}, set_iv{}.
Output: set_cv{}, set_iv{}
Algorithm 2. ⅩⅩⅩ.
Figure 5 shows the SDG intermediate transient model after labeling CV and IV, where the red filled dotted line node represents the CV node, and the blue filled dotted line node represents the IV node. The state of the CV and IV nodes in the intermediate transient model is indeterminate, so the compatible path in the initial response is cut off.If the qualitative simulation method for determining the state of IV/CV nodes proposed in Oyeleye and Kramer (1988) is applied to the SDG intermediate transient model in Figure 5 to determine the state of
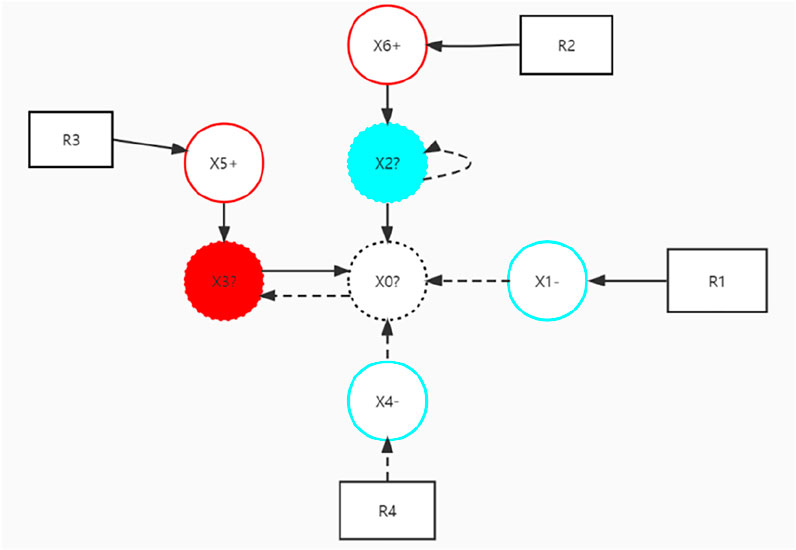
FIGURE 5. SDG intermediate transient model.
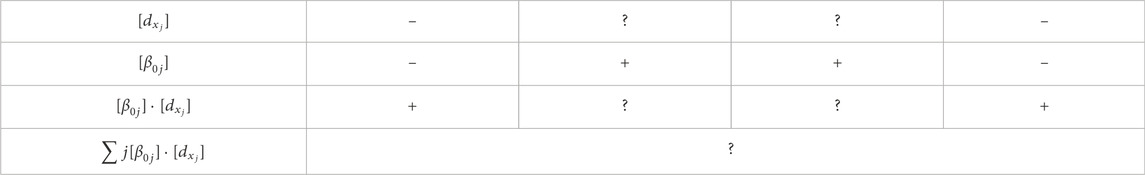
TABLE 1. Qualitative simulation of CV/IV.
3.4.3 Calculating sub-information flow and total information flow
Find all causal pairs related to each CV and IV node and calculate the sub-information flow and total information flow in turn. The specific Algorithm 3 is as follows:
Input: set_cv{}, set_iv{}
A Traverse the set_cv{} to find all nodes
B Calculate the information flow
C For each CV node, calculate the total information flow
D Repeat step a for the set_iv set, and steps b and c for the same operation, to obtain
Output:
Algorithm 3. ⅩⅩⅩ.
3.4.4 Establishing the FR-SDG model
We make
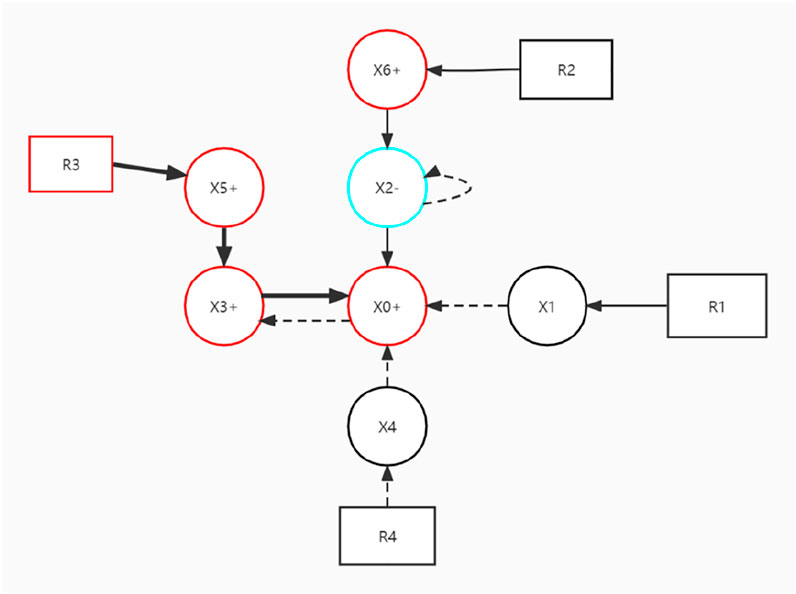
FIGURE 6. FR-SDG model.
The flowchart of each algorithm is shown as Figures 7–9.
FIGURE 7. Flowchart of Algorithm 1.
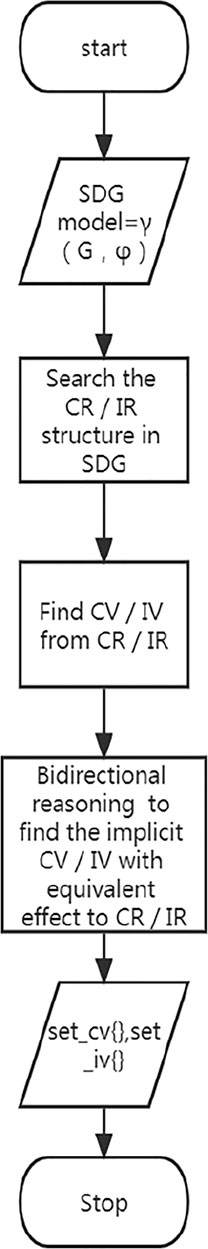
FIGURE 8. Flowchart of Algorithm 2.

FIGURE 9. Flowchart of Algorithm 3.
4 Experiment
In this paper, PCTran AP1000 is used as the experimental platform. PCTran is a simulation system of the primary loop power system of a nuclear reactor, which mainly includes five main units: nuclear reactor, voltage stabilizer, steam generator A and steam generator B, main pump, and 20 fault variables and 86 measurement variables.
There are many kinds of failures in the primary loop system of nuclear reactors, among which the loss-of-coolant accident (LOCA), namely, loss of water accident, refers to the failure of the boundary of the coolant system of the nuclear reactor or the rupture of the pipeline connected to the system, or the loss of water. An accident that creates a break results in a loss of coolant liquid leakage. Pipeline rupture, valve failure, and accidental opening may all cause coolant loss accidents, and the situation caused by different rupture sizes is also different, so the situation of the accident is very complicated, and the handling needs to be very careful as it cause great harm. Usually, according to the size of the break in the coolant loss accident, it is divided into large breaks and small breaks, and different break sizes will cause different effects and results; the main steam pipe rupture accident in the pressure vessel (main steam line break inside containment, MSLB-IN) refers to the accident in which the main pipeline of the steam circuit ruptures or breaks, causing a large amount of steam to be sprayed out. It is one of the most serious accidents caused by the increase in heat rejection in the pressurized water reactor system and belongs to the IV category (limit accident). So, it is particularly important for the deterministic diagnosis and emergency response of MSLB-IN and LOCA accidents. Table 2 provides the comparison table of abbreviations used in the following experiments.
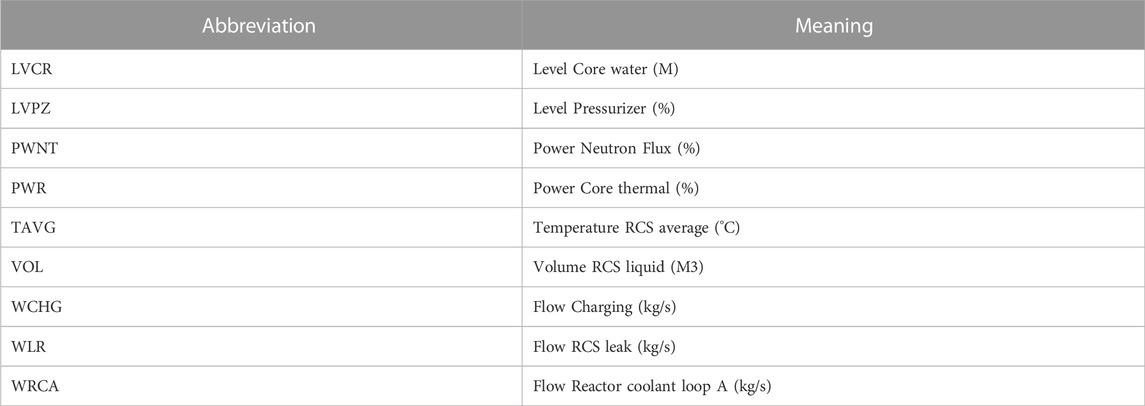
TABLE 2. Meaning of abbreviations.
4.1 IR structure
This experiment for the IR structure takes the water level control system of the regulator as the research object. First, according to the experience knowledge, system structure, operation principle, and other information, the SDG model of the water level control system of the regulator is constructed. There are two faulty nodes in the SDG initial response model of the water level of the regulator, corresponding to MSLB and LOCA, respectively, and there is a path
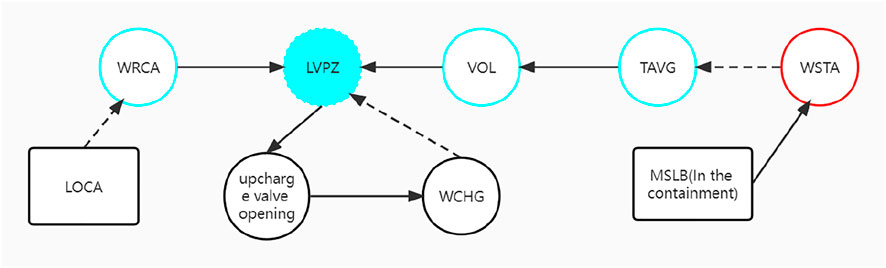
FIGURE 10. SDG model of the water level control system of the regulator.
In Figure 10, since the voltage regulator water level node forms a self-loop of the negative feedback, assuming that both the MSLB fault and LOCA fault occur, WSTA will increase due to the MSLB fault, TAVG will decrease, VOL will decrease, and LVPZ will decrease, and the LOCA fault will also cause WRCA descending and LVPZ descending, then the path
In this experiment, MSLB-IN with a breach size of 10% was introduced into PCTran, and the failure time was 200s. For the reverse response VOL (WRCA)→LVPZ--- > upcharge valve opening→WCHG→LVPZ, we calculate the information flow of the causal pairs VOL→LVPZ, WCHG→LVPZ, and WRCA→LVPZ, respectively, and the calculation results are shown in Figure 11.

FIGURE 11. Sub-information flow of MSLB-IN with 10% breach size in 200s.
As shown in Figure 8, (a), (b), and (c) had sharp jumps after 200s, indicating that the fault occurred in 200s. After 200s, the information flow of WCHG→LVPZ jumps between −0.2 and 0.6, and the information flow of WRCA→LVPZ jumps between −0.5 and 0.2, which is relatively weak; while the highest value of the information flow VOL→LVPZ is close to 200, and the lowest value has reached −500. Integrating the three sub-information flow curves into one graph, it is found that the information flow changes of WCHG→LVPZ and WRCA→LVPZ are very small for the information flow VOL→LVPZ, even close to a straight line. T (VOL→LVPZ), T (WCHG→LVPZ), and T (WRCA→LVPZ) calculate the algebraic sum to obtain the total information flow, which is shown in Figure 12 after graphing. We calculate the goodness of fit of each sub-information flow curve to the total information flow curve, and the results are recorded in Table 3. The curve with higher goodness of fit obtained by comparing the coefficient of determination
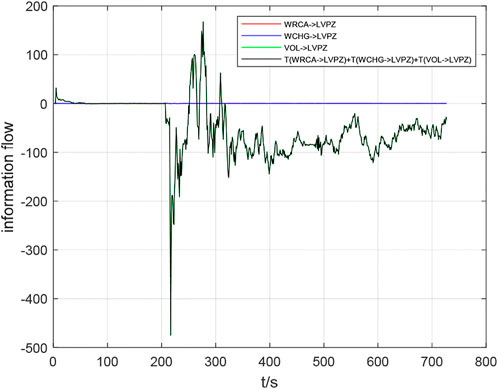
FIGURE 12. All information flow of MSLB-IN with 10% breach size in 200s.
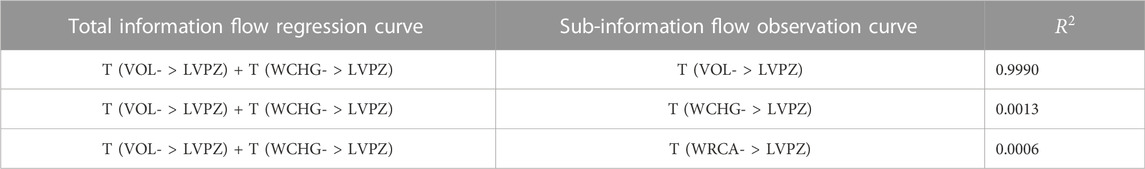
TABLE 3. Goodness of fit table of 200s of 10% MSLB-IN fault information flow.
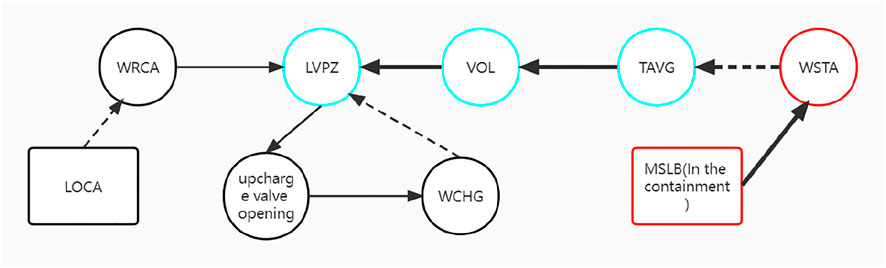
FIGURE 13. FR-SDG model of the regulator water level for MSLB failure.
4.2 CR structure
This experiment on the CR structure takes the reactor control system as the research object. First, the SDG initial response model of the reactor control system is constructed according to the experience knowledge, system structure, operation principle, and other information. There are two fault nodes in the SDG model of the reactor control system, corresponding to LOCA and control rod accidental insertion accident (inadvertent rod insertion), respectively, and there is a path
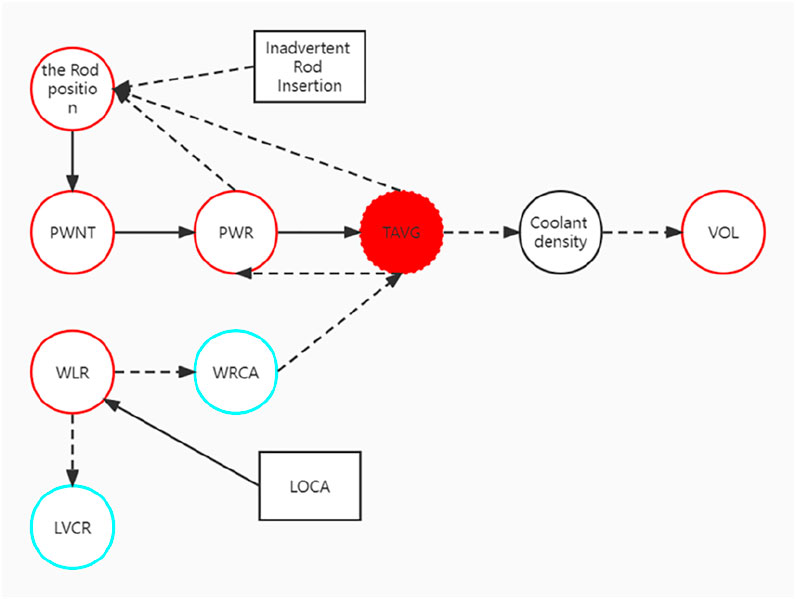
FIGURE 14. Reactor SDG intermediate transient model.
In Figure 14, when the LOCA accident occurs, WLR will increase, WRCA will decrease, and TAVG will increase, and then the path
In this experiment, a LOCA accident with a breach size of 5% was introduced into PCTran, and the failure time was also 200s. In order to determine the final state of the TAVG node, it is necessary to calculate the sub-information flow WRCA- > TAVG, PWR- > TAVG and their total information flow separately. Since the branch PWR - > TAVG is in the CR, it can not only transmit the information flow of fault 1): inadvertent rod insertion, but also the information flow of fault 2): LOCA. Therefore, it is also necessary to calculate the information flow of PWNT - > PWR to determine whether fault (1) occurs. For the compensation response WRCA--- > TAVG--- > PWR→TAVG, the sub-information flow WRCA- > TAVG, PWR- > TAVG, the total information flow T (PWR- > TAVG)+T (WRCA- > TAVG) and information flow PWNT- > PWR are calculated, and the results are graphically shown in Figure 15.
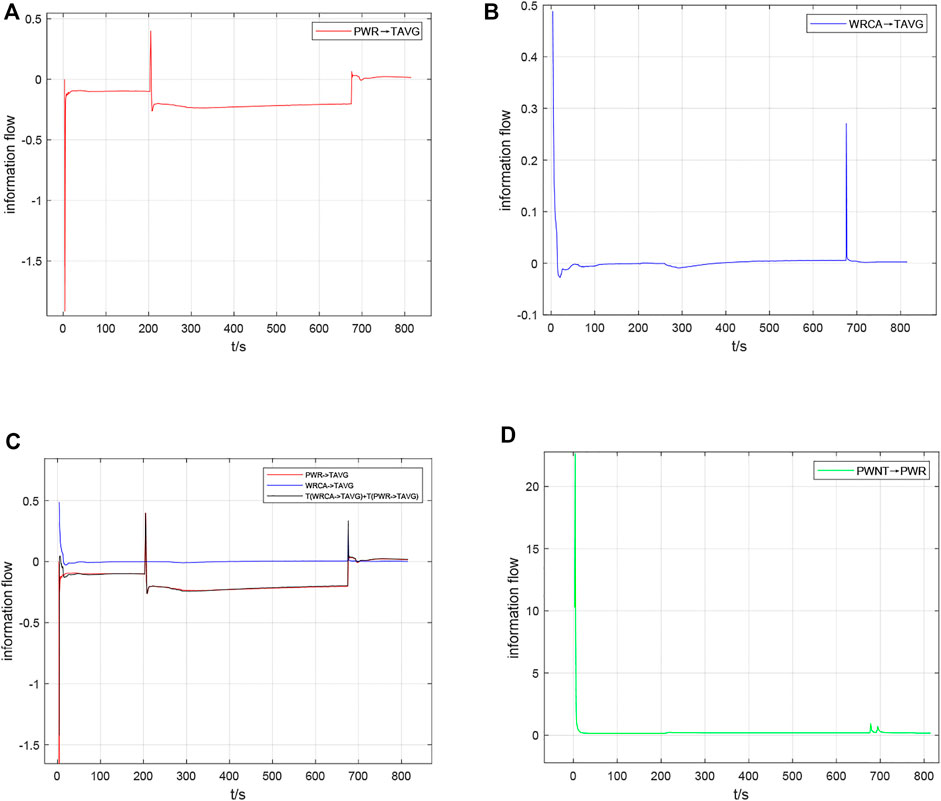
FIGURE 15. Information flow of LOCA with 5% breach size in 200s.
Observing Figure 15, it is found that the information flow PWR - > TAVG had a sharp jump in 200s and 676s, indicating that the fault occurred in 200s and 676s. Also, the jumping range of the two sub-information streams after the fault occurs is relatively close, and the sub-information stream that plays a major role cannot be obtained as clearly as in Experiment 4.1. By comparing the goodness of fit of each sub-information flow curve to the total information flow curve, the calculation results are recorded in Table 4. According to the table data, the sub-information flow PWR→TAVG has a higher goodness of fit with the total information flow curve. However, the information flow PWNT - > PWR did not change significantly in 200s, indicating that the fault occurred in 200s was LOCA, while the fault occurred in 676s was inadvertent road insertion caused by LOCA, that is, shutdown accident. Therefore, the fault propagation path
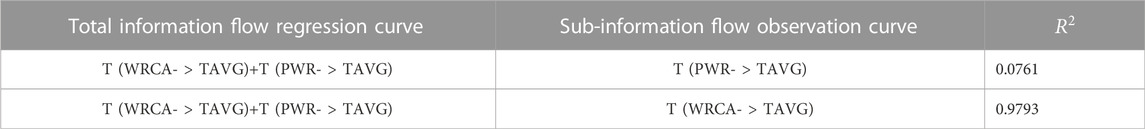
TABLE 4. Goodness of fit table of 200s of 5% LOCA fault information flow.

FIGURE 16. Reactor FR-SDG model for LOCA failure.
The experimental results show that the SDG fault deterministic diagnosis method based on information flow proposed in this paper can better solve the problem of uncertainty node state caused by IR or CR structure, and the extended FR-SDG model can not only determine the state of IV or CV nodes under final response, but also directly express the fault propagation path and fault source that cause the abnormality of symptom nodes CV or IV. This paper starts from two perspectives: 1) establishing an extended quantitative FR-SDG model to describe the final response; 2) introducing the information flow into the fault diagnosis response, eliminating the impact of CR and IR structures in the SDG model, and realizing the fault deterministic diagnosis and emergency response of the SDG model with CR or IR structures. This method also has certain limitations; when the system occurs in the case of multiple faults at the same time, there may be incomplete fault source positioning results; at present, this method is only suitable for a single fault diagnosis; more in-depth research can be carried out in the future based on information flow in the field of multi-fault diagnosis.
Data availability statement
The original contributions presented in the study are included in the article/Supplementary Materials, further inquiries can be directed to the corresponding author/s.
Author contributions
In this paper, a deterministic diagnosis method for SDG faults based on information flow is proposed. This method compares the goodness of fit between the sub-information flow of all causal pairs related to compensation variables or inverse variables and the total information flow curve and obtains sub-information flow curve that has the highest. The causal pair represented by the information flow is located in the compatible path, and the state of the compensation variable or inverse variable node and the fault traceability are determined according to the fault propagation path with the highest probability. At the same time, according to the diagnosis result, the SDG model is structurally extended as the FR-SDG model, which can intuitively describe the steady information for node state and the main fault propagation path. It realizes the fast and accurate fault diagnosis from the perspective of introducing data fusion method into response and extending SDG model.
Funding
This study was supported by the Open Fund of Science and Technology on Reactor System Design Technology Laboratory: SQ-KFKT-24-2021-006.
Conflict of interest
The authors declare that the research was conducted in the absence of any commercial or financial relationships that could be construed as a potential conflict of interest.
Publisher’s note
All claims expressed in this article are solely those of the authors and do not necessarily represent those of their affiliated organizations, or those of the publisher, the editors, and the reviewers. Any product that may be evaluated in this article, or claim that may be made by its manufacturer, is not guaranteed or endorsed by the publisher.
References
Ali, H., Maulud, A. S., Zabiri, H., Nawaz, M., Suleman, H., and Taqvi, S. A. A. (2022). Multiscale principal component analysis-signed directed graph based process monitoring and fault diagnosis[J]. ACS Omega 7 (11), 9496–9512. doi:10.1021/acsomega.1c06839
Cong, W., Cong, W., Yu, H., and Liu, J. (2020). System Fault diagnosis method based on OSDG model. J. Phys. Conf. Ser. 1575 (1), 012206. doi:10.1088/1742-6596/1575/1/012206
Gong, Z., Sun, C., Li, J., Juan, F., Xie, F., Yang, Y., et al. (2019). The application of causal analysis based on information flow theory in identifying the physical mechanism of Atlantic multi-decadal oscillations [J]. Atmos. Sci. 43 (05), 1081–1094.
Guohua, W., Diping, Y., Jiyao, Y., Yiqing, X., and Dongxu, J. (2021). A framework for monitoring and fault diagnosis in nuclear power plants based on signed directed graph methods. Front. Energy Res. 9, 641545. doi:10.3389/fenrg.2021.641545
Hu, X., Zhang, H., Ma, D., and Wang, R. (2021). A tnGAN-based leak detection method for pipeline network considering incomplete sensor data. IEEE Trans. Instrum. Meas. 70, 1–10. doi:10.1109/tim.2020.3045843
Huang, J., Liu, J., Liu, H., Yang, X., and Ma, J. (2022). “Research on nuclear power fault location method based on information flow SDG model,” in Proceedings of the Asian Electrical, Power and Computer Engineering Conference (EPCE 2022), Shanghai, China, April 22 - 24, 2022, 1–8. Computer Association, New York, NY, USA, Article.
Li, F., Cheng, P., and Jiang, J. (2021). Fault diagnosis method of rolling bearing based on data fusion [J]. Zhuzhou, China: Science and Technology Innovation, 2.3.
Liu, M. (2022). Research on fault diagnosis and application based on SDG model [D]. Beijing, China: Tsinghua University.
Liu, Y-K., Ai, X., Ayodeji, A., Wu, M-P., Peng, M-J., Xia, H., et al. (2019). Enhanced graph-based fault diagnostic system for nuclear power plants. Nucl. Sci. Tech. 30 (12), 174. doi:10.1007/s41365-019-0708-x
Lu, Y., Xie, T., Xu, H., and Liu, Z. (2019). Causal analysis of rainfall index and landslide and debris flow based on information flow theory [J]. J. Nat. Disasters 28 (04), 196–201.
Ma, D., Hu, X., Zhang, H., Sun, Q., and Xie, X. (2019). A hierarchical event detection method based on spectral theory of multidimensional matrix for power system. IEEE Trans. Syst. Man. Cybern. Syst. 51 (4), 2173–2186. doi:10.1109/tsmc.2019.2931316
Ma, J., Zhang, L., Peng, Q., and Hu, P. (2020). fault diagnosis of secondary loop system based on hierarchical symbolic directed graph [J]. Chin. J. Weapon. Equip. Eng 41 (08), 176–181.
Ma, J., Zhang, L., Yu, J., Peng, Q., and Hu, P. (2021). Research on fault diagnosis method of reactor primary loop system based on PCA and SDG [J]. 42 (03), 197–202. doi:10.13832/j.jnpe.2021.03.0197
Maurya, M. R., Rengaswamy, R., and Venkatasubramanian, V. (2005). A signed directed graph-based systematic framework for steady-state malfunction diagnosis inside control loops. Chem. Eng. Sci. 61 (6), 1790–1810. doi:10.1016/j.ces.2005.10.023
Ma, X., and Li, D. (2017). “A hybrid fault diagnosis method based on fuzzy signed directed graph and neighborhood rough set[C],” in Proceedings of 2017 IEEE 6th Data Driven Control and Learning Systems Conference (DDCLS'17), Chongqing, China, 26-27 May 2017, 270–275.
Oyeleye, O. O., and Kramer, M. A. (1988). Qualitative simulation of chemical process systems: Steady-state analysis. AIChE J. 34 (9), 1441–1454. doi:10.1002/aic.690340906
San, L. X. (2016). Information flow and causality as rigorous notionsab initio. Phys. Rev. E 94 (5), 052201–052228. doi:10.1103/physreve.94.052201
Smaili, R., El Harabi, R., and Abdelkrim, M. N. (2017). Design of fault monitoring framework for multi-energy systems using signed directed graph * *this work was supported by the ministry of the higher education and scientific research in Tunisia. IFAC-PapersOnLine 50 (1), 15734–15739. doi:10.1016/j.ifacol.2017.08.2304
Tian, W., Zhang, S., Cui, Z., Liu, Z., Wang, S., Zhao, Y., et al. (2021). a fault identification method in distillation process based on dynamic mechanism analysis and signed directed graph. Processes 9 (2), 229. doi:10.3390/pr9020229
Wang, X., Yu, Z., Niu, X., Lu, X., Yang, H., and Liu, Z. (2019). “Combination multiple faults diagnosis method applied to the aero-engine based on improved signed directed graph[C],” in Proceedings of 2019 4th International Conference on Measurement , Information and Control(ICMIC), Harbin, China, 23-25 August 2019, 2–11. doi:10.26914/c.cnkihy.2019.047679
Wu, M. (2018). Research on fault diagnosis of nuclear power plant based on GrC-SDG [D]. Harbin: Harbin Engineering University.
Keywords: SDG model, fault diagnosis, information flow, compensation response, inverse response
Citation: Huang J, Liu J, Yang X, Ma J and Liu H (2023) Research on the uncertainty problem of SDG fault diagnosis based on information flow. Front. Energy Res. 10:1013255. doi: 10.3389/fenrg.2022.1013255
Received: 06 August 2022; Accepted: 28 November 2022;
Published: 27 January 2023.
Edited by:
Hosam Saleh, Egyptian Atomic Energy Authority, EgyptCopyright © 2023 Huang, Liu, Yang, Ma and Liu. This is an open-access article distributed under the terms of the Creative Commons Attribution License (CC BY). The use, distribution or reproduction in other forums is permitted, provided the original author(s) and the copyright owner(s) are credited and that the original publication in this journal is cited, in accordance with accepted academic practice. No use, distribution or reproduction is permitted which does not comply with these terms.
*Correspondence: Jie Liu, jliuhn@foxmail.com; Xiaohua Yang, xiaohua1963@foxmail.com