Modeling and stability analysis of interaction between converters in AC-DC distribution systems
 Tao Chen
 Depin Feng
 - State Grid Shandong Electric Power Company Linyi Power Supply Company, Linyi, China
With the development and promotion of AC-DC distribution systems, the stability of multi-terminal systems has drawn much interest. This paper analyzes the instability phenomena in AC-DC distribution systems by considering the interactions between converters. The typical structure and control strategy of double-terminal AC-DC distribution systems under master-slave control is introduced. Then an AC-DC distribution system model is developed taking into account the interaction of the converter control system. The resonant spikes generated by the interaction between the converters are used as the reference object of the interaction to analyze the influence of the converter control parameters and the system electrical parameters on the system stability and interaction. Finally, a double-terminal AC/DC distribution system model is built using PLECS and RTBOX for simulation and semi-physical experimental verification.
1 Introduction
With the large-scale integration of photovoltaic, electric vehicles, LED lighting and other DC equipment, the traditional AC distribution system is facing a series of complex problems, such as diversification of power supply types and load demands, multi-level transformation links, etc. The power supply quality, reliability and efficiency are increasingly affected. The AC/DC hybrid distribution systems based on flexible DC technology can more flexibly integrate distributed generations and DC loads, reduce power conversion links and improve power supply efficiency (Li et al., 2019). In particular, the flexible DC technology can realize independent decoupling control of active and reactive power, which can effectively improve power supply quality and ensure power supply reliability. It is more suitable for the development of modern distribution systems (Zhang et al.,2017).
The flexible DC distribution system realizes interconnection with AC system and integration of distributed generations and loads mainly by power electronic devices. The AC-DC distribution systems may have impedance mismatch between different converter port impedances (Huang et al., 2020), between converter port impedances and line impedances (Tao et al., 2017; Wu et al., 2017), and between converter port impedances and grid impedances (Nian et al., 2020), i.e., The AC-DC distribution systems has stability problems on both DC sides and AC sides. Many analytical methods have been proposed to study the stability of grid-connected systems with multiple VSCs, including small signal analysis based on state space, frequency domain analysis based on impedance model and single-input-single-output (SISO) transfer function-based analysis.
The small signal analysis method based on state space can obtain the main variables affecting the stability of grid-connected systems by calculating the characteristic roots and participation factors of the state space. But with the increase of VSC, the system order increases, resulting in the difficulty of modeling. The literature (Qiu et al., 2022) used eigenvalue analysis to derive the quantitative evaluation index of the participation factor, and analyzed the relationship between oscillation modes and state variables in the wind farm with a MMC-HVDC transmission system. The correlation between each oscillation mode, wind farm, and participation factor of the MMC system are studied, which laid the foundation for the development of broadband oscillation suppression strategy. In (Wu et al., 2018), a current in-loop transfer function considering the effects of grid impedance and PLL was developed, and the destabilization mechanism of the system when the PLL and current in-loop bandwidths were close to each other under a weak grid was analyzed. The literature (Yuan et al., 2016) analyzed the effect of control parameters as well as main circuit parameters on stability based on state space eigenvalues. The literature (Deng and Fang, 2022) derived a detailed state space model of GFMCs and performed a sensitivity analysis to reveal the instability mechanism, by proposing a dominant compensator to improve the system inertia and frequency regulation. In the literature (Zhao et al., 2022), an active voltage regulation control strategy was proposed for large-scale renewable energy grid-connected power systems using a small-signal model, and sag control characteristics were proposed to improve the system’s ability to consume distributed generations. The literature (Xie et al., 2022) proposed a unified modeling scheme (UMS) for MMC systems in a synchronous rotation (dq) reference frame, which used a small-signal modeling approach and could obtain a nonlinear state-space model of the overall MMC system by configuring and connecting the inputs and outputs of the state-space models of each subsystem. It could avoid the direct derivation of the matrix elements of the whole system.
The impedance analysis method can be considered as a frequency domain small signal analysis method, and the system is equated to a positive and negative sequence impedance or dq domain impedance-based model through the port input and output information of the VSC grid-connected system, and the Nyquist criterion is used to determine the system stability. However, for multi-VSC systems, multiple input and multiple output Nyquist criterion is required to analyze the system stability, which loses the advantage of analyzing stability based on single input and single output Nyquist criterion (Yin et al., 2021). In the literature (Feng et al., 2022), a full-order small-signal impedance model of the CTPS-based DAB converter is derived, and the influence of DAB converter circuit parameters on system stability is fully revealed by Bode plots and Nyquist plots, and then an optimization criterion for DAB circuit parameters is proposed. The literature (Liu et al., 2020) analyzed the DC oscillation problem of a double-terminal flexible system using the impedance method. The literature (Xue et al., 2020) analyzed the degree of influence of each parameter on the DC port impedance under different control modes. The literature (Li et al., 2022) used small signal analysis and impedance method to analyze the influence of PLL and voltage loop controller on the stability of the system in grid-connected inverter, and proposed a voltage feedforward PLL interference compensation method and an adaptive bandwidth frequency low-pass filter (LPF) to improve the system stability.
In addition, literature (Wu et al., 2019) proposed the stability analysis method of grid-connected VSC based on SISO open-loop transfer function, both of which embed the q-axis dynamics into the d-axis dynamics. Due to the large number of variables in the VSC system, the SISO models obtained by such methods are more complicated and not suitable for stability mechanism analysis. In the literature (Zhang et al.,2018; Zhang et al., 2019; Wang et al., 2020), a SISO model was established by decoupling the d-axis control and q-axis control into a unit negative feedback model containing the same control structure, which can intuitively explain the mechanism of the influence of each control link of the VSC on stability while simplifying the stability modeling and analysis process.
In general, the current research has studied the stability of AC-DC microgrids and low-voltage AC-DC systems from several aspects, mainly focusing on sag control and AC-side stability, using analysis methods based on small-signal analysis and impedance model of frequency domain analysis. However, for AC-DC distribution systems under master-slave control, the interaction dynamics, key parameters, destabilization mechanisms and effects on DC voltage stability between converters and DC systems still lack clear explanations. In this paper, through an in-depth analysis of the influence of each control parameter and electrical parameter on the interaction and stability in AC-DC distribution systems under master-slave control, the main contributions are summarized as follows.
(1)A model considering the interaction between converter control systems is developed by decomposing the control block diagram of the main converter under master-slave control into a DC voltage control part and a DC feedback part. On the premise of ensuring the applicability of the Nyqusit criterion of single input and single output system, the impedance analysis method is used for the DC side analysis, which reduces the difficulty of system modeling and facilitates the extension of the analysis of system stability under different conditions.
(2) The stability assessment is performed by the established system transfer function, and the differences between the original model transfer function and the interaction model transfer function are compared. The resonant spikes generated by the interaction between converters are used as reference objects to analyze the interactions existing in the AC-DC distribution system. And the effects of each control parameter and electrical parameter on the spike amplitude, resonant frequency and system stability are obtained.
(3) A simulation model of a double-terminal AC-DC distribution system under master-slave control is established in PLECS, and hardware-in-the-loop experiments are conducted by RT Box, which proves the validity of theoretical analysis and simplified analysis. It also has important reference significance for engineering practice.
The structure of the paper is as follows: Section 2 presents the typical structure, control strategy and overall transfer function of the AC-DC distribution system. The system model for counting and inter-converter interactions is developed in Section 3. Section 4 analyzes the effects of different system parameters and electrical parameters on the interaction and system stability based on the proposed interaction model. The corresponding experimental validation is given in Section 5. Conclusions are drawn in the last section.
2 AC-DC distribution system model
2.1 Topology of AC-DC power distribution system
In an AC-DC distribution network, different areas of the AC system can be interconnected by a DC network. This structure can realize the multi-terminal interconnection of AC feeders from different substations, and can be further extended to systems of higher voltage levels. In terms of network topology, the current AC-DC distribution system is mainly powered by double-terminal power supply and multi-terminal power supply. In this paper, a two-terminal power supply system (Jiang et al., 2021) is used as the object of analysis. Figure 1A gives a two-terminal topology of an AC-DC distribution system, in which two AC systems are interconnected through VSC1 and VSC2, and each AC system is set as an ideal three-relative symmetric system.
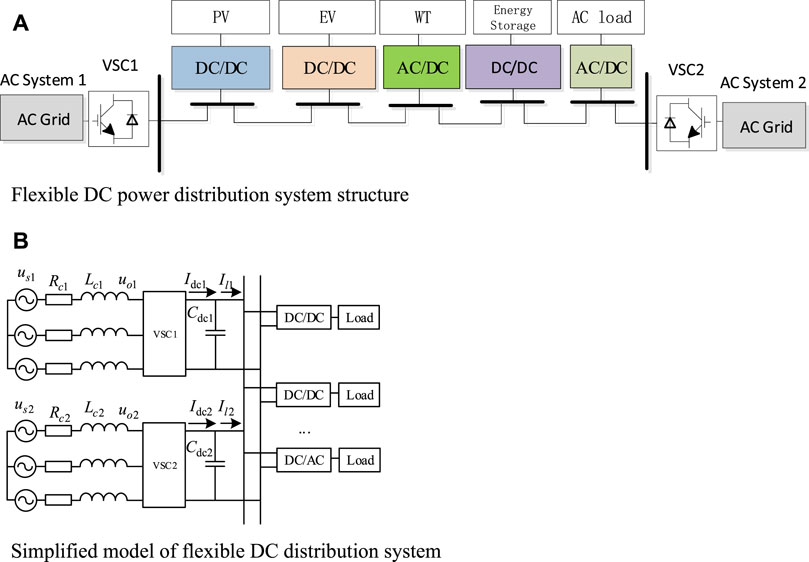
FIGURE 1. Flexible DC power distribution system structure. (A) Flexible DC power distribution system structure. (B) Simplified model of flexible DC distribution system.
The operation control mode of the AC-DC distribution system can be divided into peer-to-peer control and master-slave control, and the master-slave control mode is adopted in this paper. VSC1 is selected as the master station and adopts the constant DC voltage control strategy to ensure the DC grid voltage stability. The slave station VSC2 adopts the constant active power control strategy. The load side uses the converter to realize the bidirectional flow of energy and voltage transformation. The power loss of each power electronic converter is neglected, and the equivalent circuit structure of the double-terminal AC-DC distribution system is shown in Figure 1B.
2.2 Control mode of AC-DC distribution system
The control block diagrams of VSC1 constant DC voltage control and VSC2 constant power control are shown in Figures 2, 3, respectively, and their control strategies can be seen as consisting of two parts: internal control system and DC feedback. Under normal circumstances, the load of AC-DC distribution system has constant power characteristics unlike the commonly used AC constant impedance load. For VSC2, which uses constant active power control from the converter station, it also has constant power load characteristics and is generally regarded as a constant power load. Therefore, the rest of the constant power control ports except the master station are generally equated as constant power loads, which are considered as series-parallel combinations of multiple components, as shown in the simplified three-phase equivalent model in Figure 4 (Peng et al., 2021).
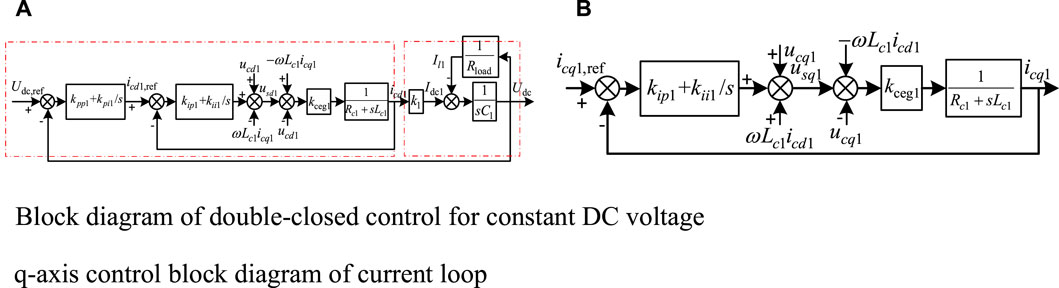
FIGURE 2. Block diagram of VSC1 control strategy. (A) Block diagram of double-closed control for constant DC voltage. (B) q-axis control block diagram of current loop.
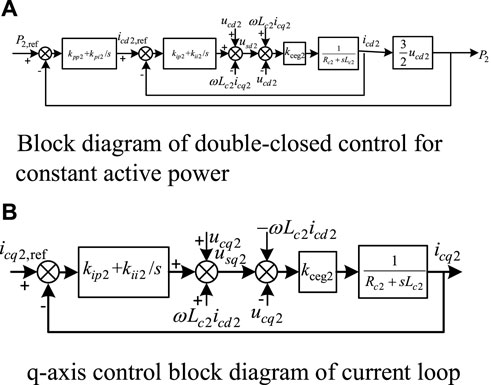
FIGURE 3. Block diagram of VSC2 control strategy. (A) Block diagram of double-closed control for constant active power. (B) q-axis control block diagram of current loop.
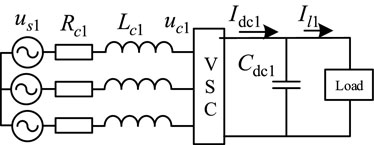
FIGURE 4. Simplified model of AC-DC distribution system.
In this paper, the main converter station control system is used as the framework to establish the SISO transfer function model of a double-terminal AC-DC distribution system, and only a single input and single output Nyqusit criterion is required to analyze the stability of the grid-connected system. In order to simplify the calculation and facilitate the extension, the impedance analysis method is used for the DC side, which effectively reduces the difficulty of system modeling. Based on the proposed SISO model, the effects of parameter changes on system interactions are analyzed by transfer function Bode plots, zero-pole distributions and Nyqusit curve variations.
2.3 Transfer function of AC-DC distribution system
For the model in Figure 4, the dynamic characteristics of the AC side voltage and current of the converter can be obtained according to KVL as shown in Eq. 1.
Where: us1 is VSC1 equivalent three-phase supply voltage; Rc1 is VSC1 AC side equivalent resistance; Lc1 is VSC1 AC side equivalent inductance; uc1 is VSC1 AC side voltage.
Since all three phases are time-varying AC quantities in the stationary coordinate system, which are difficult to control, the Park transform of Eq. 1 is used to obtain the dynamic characteristics of the voltage and current on the AC side of the converter in the dq coordinate system, as shown in Eq. 2 and Eq. 3.
The form of Eq. 2 and Eq. 3 in the s-domain is:
Where usd1 and usq1 are the dq-axis components of the VSC1 AC supply; uc1d and uc1q are the dq-axis components of the AC-side voltage of VSC1; icd1 and icq1 are the dq-axis components of the VSC1 AC-side current; ω is the AC supply fundamental angular frequency; and s is the Laplace operator.
In order to eliminate the coupling between variables, a feedforward decoupling control strategy is used for the current inner loop (Wu et al., 2020), which yields the voltage outer loop control equation:
Current inner-loop control equation:
Where: icd1, ref and icq1, ref are the dq-axis reference currents on the AC side; Udc and Udc, ref are the actual DC voltage and DC voltage reference values, respectively; Kvp1 and Kvi1 are the proportional and integral coefficients of the DC voltage outer-loop PI regulator, respectively; Kip1 and Kii1 are the proportional and integral coefficients of the AC current inner-loop PI regulator, respectively.
The fully decoupled inner-loop control equations are obtained by combining Eqs 2–5.
Combining Eqs. 6, 9 and 10 and according to the circuit structure of Figure 1B, the dual-loop control block diagram can be obtained as shown in Figure 2, where: Rload is equivalent DC load; Il1 is VSC1 equivalent DC load current; Cdc1 is VSC1 DC side filter capacitor; Idc1 is VSC1 output DC current; Kceg1 is the equivalent gain of the converter; K1 is the proportionality factor (Yao et al., 2020).
The main station control block diagram can be seen as composed of two parts, which are the VSC1 control strategy part and the DC system feedback part, so the joint Eqs 3–6, then the d-axis open-loop transfer function of VSC1 can be obtained as:
Where Gdc is the equivalent transfer function for the DC system. When the slave converter station with constant power control is considered as a constant power load, Gdc can be expressed by Eq. 8.
3 System model considering interaction
The above modeling approach treats the slave converter station with constant power control as a constant power load and brings it into the system equation as part of the DC load, without considering the effect of the slave control system on the control margin and system stability of the master station. This can lead to power oscillations between the master and slave stations in some specific cases, which in turn can lead to DC bus voltage oscillations and system instability.
Therefore, in order to consider the influence of the slave control system on the master control capability and system stability, this paper improves on the original model, models the DC system more finely, introduces the slave control system into the master transfer function, establishes the AC-DC distribution system model (hereinafter referred to as the interaction model) that counts and converters control system interaction, and further analyzes the influence of the slave control system and line parameters on the stability margin and system stability of the master control system.
3.1 Topology of AC-DC power distribution system
On the basis of the original DC voltage double closed-loop control block diagram of the main converter station, the influence of the slave control system on the master control system is considered in re-establishing the equivalent transfer function of the DC system, as shown in Figure 5.
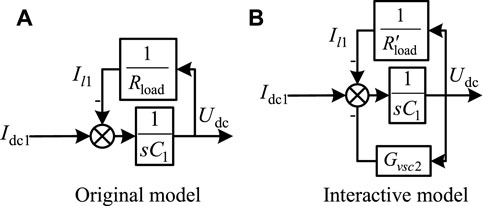
FIGURE 5. DC equivalent section. (A) Original model. (B) Interactive model.
For the slave station with constant power control, the same has.
Where: us2 is the equivalent three-phase supply voltage on the AC side of VSC2; Rc2 is the equivalent resistance on the AC side of VSC2; LC2 is the equivalent inductance on the AC side of VSC2; uc2 is the inlet voltage on the AC side of VSC2.
A Park transformation of Eq. 9 has.
According to the control block diagram of the slave converter station with constant power control shown in Figure 4, it is obtained that:
Where: icd2, ref and icq2, ref are the dq-axis reference currents on the AC side; P2 and P2, ref are the actual active power and active power reference values, respectively; Kvp2 and Kvi2 are the proportional and integral coefficients of the active power outer-loop PI regulator, respectively; Kip2 and Kii2 are the proportional and integral coefficients of the AC current inner-loop PI regulator, respectively.
Coupling Eqs. 10–13, the d-axis transfer function of VSC2 can be obtained as
Therefore, when the system interaction is considered, the DC feedback part of the transfer function changes from Figures 6A,B, i.e., the transfer function of the DC system is changed from the original two parts of DC capacitance and equivalent load to three parts consisting of DC capacitance, equivalent load and VSC2 equivalent transfer function. Therefore, the DC system transfer function of the control system from the station is considered as
The overall transfer function of VSC1 considering system interactions is
Comparing Eqs. 7, 16, the main difference is the change in the equivalent transfer function of the DC part. Due to the introduction of the VSC2 control part, the order of the system increases and the complexity is higher. Subsequently, the influence of the interaction on the system is analyzed by comparing the impedance characteristics of Eqs. 7, 16, and the influence of each control and electrical parameter on the interaction and system stability based on Eq. 16.
3.2 Analysis of interaction
The classical control theory is used for stability analysis on Eqs. 7, 16. By comparing the impedance characteristics in Figure 6A, there is a resonant spike in the VSC DC port impedance in the middle frequency band range when the influence of the slave control system is considered. The amplitude of the VSC DC port impedance increases in the resonant band, and the phase at the resonance point has a 180° jump, and when the phase angle difference >180°, the system will not satisfy the impedance ratio stability criterion and become unstable. And the same is reflected in Figure 6B and Figure 6C, where the zero pole distribution and Nyquist curve of the system change considerably under the influence of the interaction, and the interaction model has a right half-plane pole whose Nyquist curve encloses the (-1,0) point, which means that the system is in an unstable state.
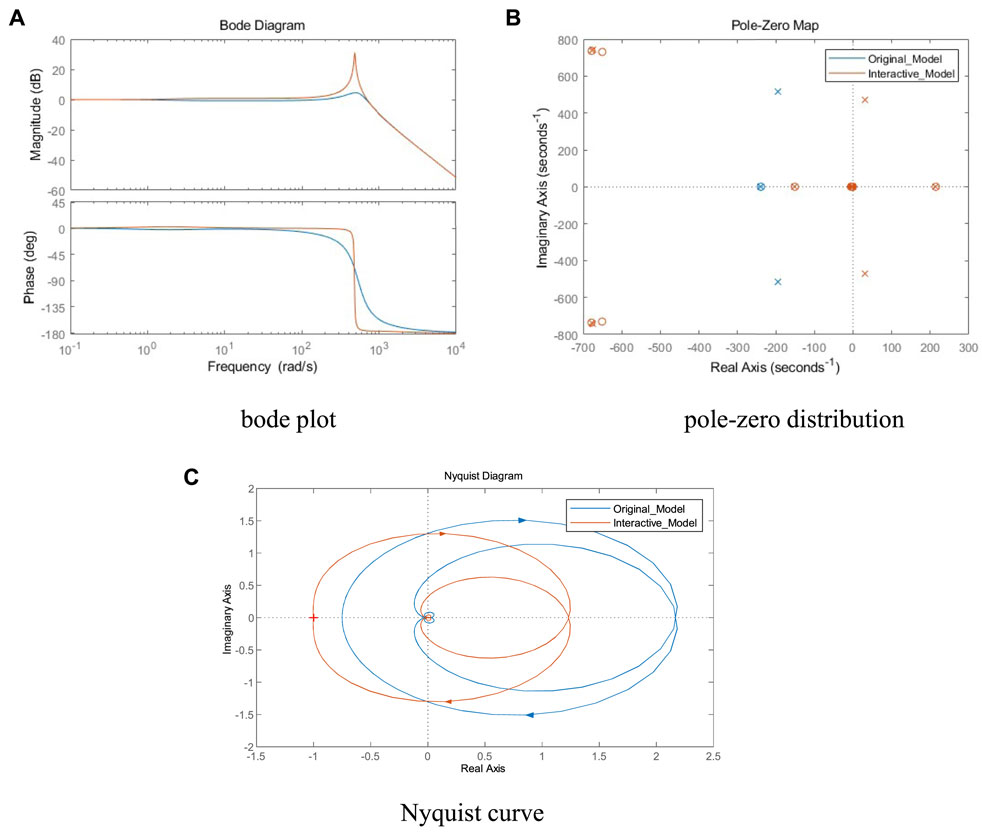
FIGURE 6. Comparison of original model and interactive model. (A) bode plot. (B) pole-zero distribution. (C) Nyquist curve.
This is caused by the interaction between the impedance characteristics of VSC2 and the DC network, and between the master converter stations, after it is connected to the DC network. Even when the DC bus voltage is constant, this interaction behavior still weakens the DC network damping and the increase of the transmitted power from the slave station may result in a phase margin of 0° or less than 0°. That is, the resonant peaks of the VSC DC port impedance in the mid-frequency range and the negative damping characteristics of the CPL wide band are the main reasons for the reduced stability of the DC side of the AC-DC distribution system. Therefore, the influence law of control parameters and system parameters on the VSC DC port impedance characteristics needs to be studied to lay the foundation for the subsequent stability analysis of the AC-DC distribution system.
Combining Eq. 15 and Eq. 16, it can be seen that the VSC1 dc impedance depends on three parts: the dc bus capacitance Cdc, the VSC1 output conduction and the VSC2 output conduction. According to the analysis of the RLC equivalent circuit principle, the resonant peak in the VSC1 dc port impedance is generated by the impedance interaction between Cdc and the converter output conductance (VSC1, VSC2) in the corresponding frequency band. Therefore, the resonant frequency corresponding to this resonant peak will be affected by the change of the dc-side capacitor Cdc and the slave VSC2 parameters, in addition to the control parameters of VSC1 itself.
4 Stability analysis
Based on the above AC-DC distribution system interaction model, the effects of parameters such as rated power, control parameters, AC-side line impedance and DC capacitance of each converter station on system interaction strength and system stability are analyzed in detail below.
In order to avoid the influence of improperly selected control parameters on the system stability analysis, the control parameters of each converter station are first designed according to the control bandwidth and stability margin. Typically, the bandwidth of the current inner loop is 1/10 to 1/5 of the switching frequency, and the bandwidth of the voltage outer loop is 1/10 to 1/5 of the current inner loop bandwidth. Specific control parameter design values are shown in Table 1. The effect of a single parameter change on the system interaction strength and system stability is discussed during the subsequent stability analysis, and the rest of the parameters are the same as those in the table, so they are not repeated.
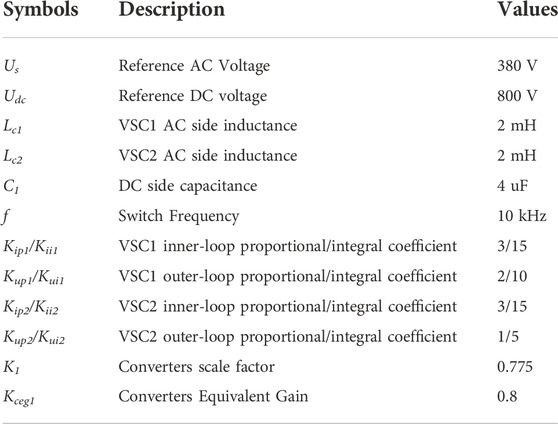
TABLE 1. Basic parameters of AC/DC power distribution system.
4.1 Influence of the rated power of the system
4.1.1 Reference power P1 of converter VSC1
It can be seen from Figures 7A–C, as the reference power P1 of VSC1 gradually increases, the spike amplitude gradually increases, the system pole gradually shifts to the right, and the intersection point of Nyquist curve and negative real axis gradually moves away from the imaginary axis. When P1 ≥ 0.5, the Nyquist curve contains the point (-1, 0), the system pole enters the right half-plane, and the system is destabilized.
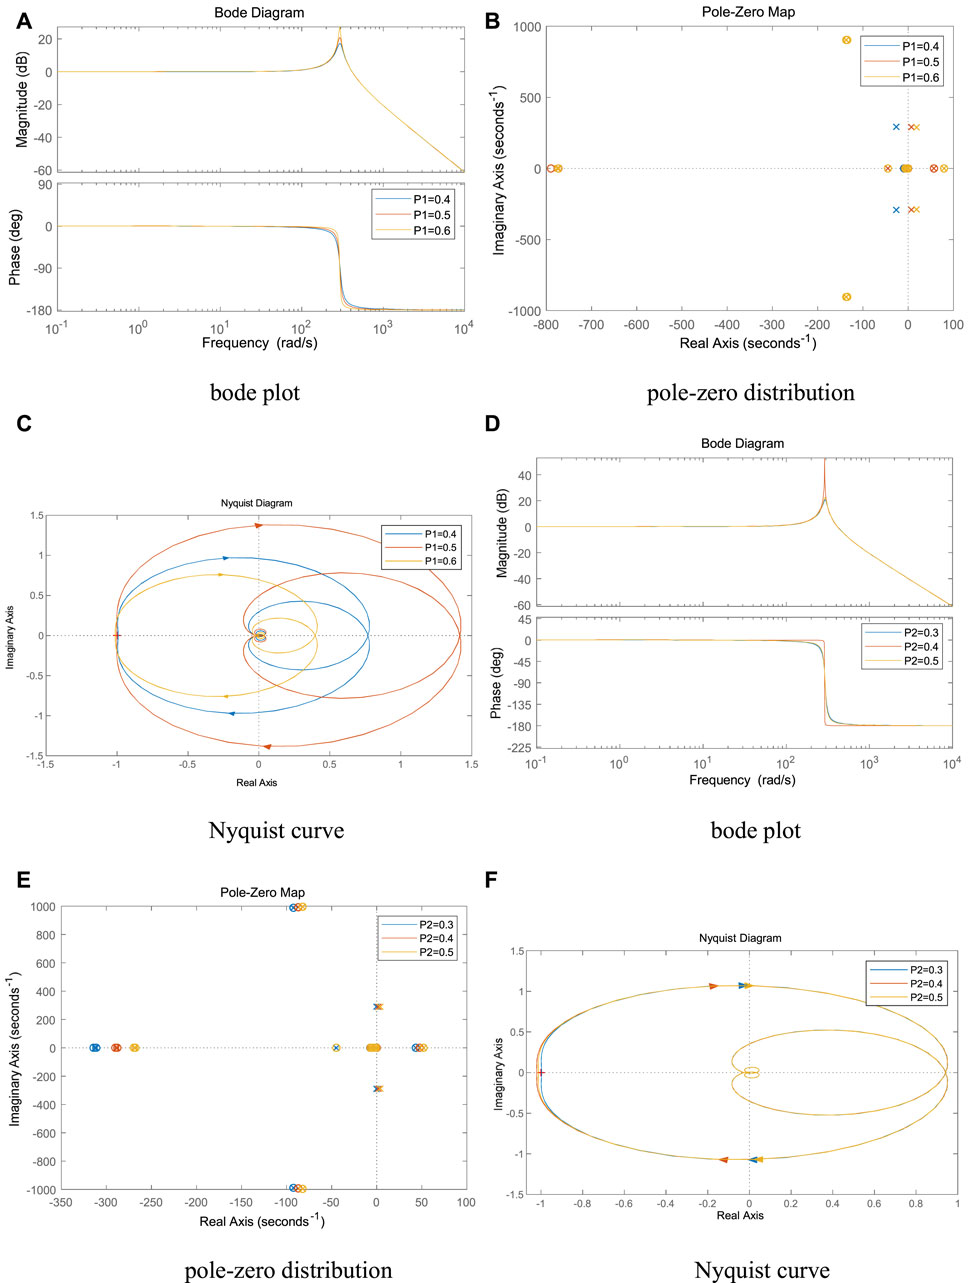
FIGURE 7. Effect of reference power variation of VSC on system stability. (A) bode plot, (B) pole-zero distribution, (C) Nyquist curve , (D) bode plot, (E) pole-zero distribution and (F) Nyquist curve.
4.1.2 Reference power P2 of converter VSC2
It can be seen from Figures 7D–F, as the reference power P2 of VSC2 gradually increases, the spike amplitude gradually increases, the system pole gradually shifts to the right, and the intersection of the Nyquist curve and the negative real axis gradually moves away from the imaginary axis. When P2 ≥ 0.4, the Nyquist curve contains the (-1, 0) point, the system pole enters the right half-plane, and the system is destabilized.
4.2 Influence of VSC1 control parameters
4.2.1 The outer loop control parameters of VSC1
It can be seen from Figures 8A–C, as the outer loop control parameter Kup1 of VSC1 gradually increases, the spike amplitude gradually increases, the spike frequency keeps increasing, the system pole slowly shifts to the right, and the Nyquist curve does not change much. When Kup1 was varied within the appropriate parameter interval, the system did not appear to be unstable.
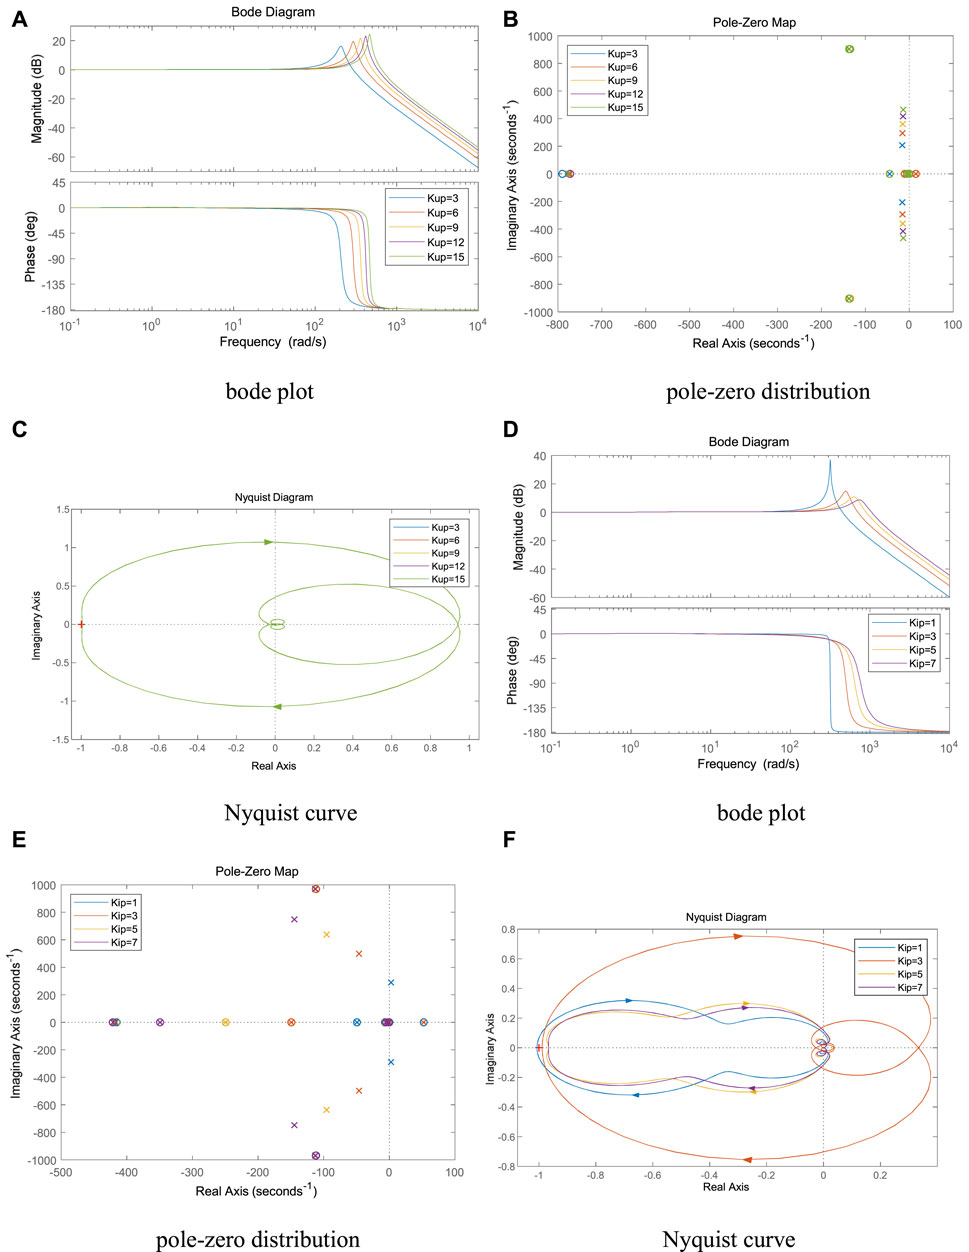
FIGURE 8. Effect of the control parameters of VSC1 on system stability. (A) bode plot, (B) pole-zero distribution, (C) Nyquist curve, (D) bode plot, (E) pole-zero distribution and (F) Nyquist curve.
4.2.2 The internal loop control parameters of VSC1
It can be seen from Figures 8D–F, as the inner loop control parameter Kip1 of VSC1 gradually increases, the spike amplitude gradually decreases, the spike frequency keeps increasing, the system pole gradually shifts to the right, the intersection point of Nyquist curve and negative real axis gradually approaches the imaginary axis, and the system stability improves. When Kip1≤1, the Nyquist curve contains (-1, 0) points and the system is destabilized.
4.3 Influence of VSC2 control parameter
4.3.1 The outer loop control parameters of VSC2
It can be seen from Figures 9A–D, as the outer loop control parameter Kup2 of VSC2 gradually increases, the spike amplitude gradually increases, the spike frequency remains basically unchanged, the system pole gradually shifts to the right, and the intersection of the Nyquist curve and the negative real axis gradually moves away from the imaginary axis. When Kup2≥3, the Nyquist curve contains the (-1, 0) point, the system pole enters the right half-plane, and the system is destabilized.
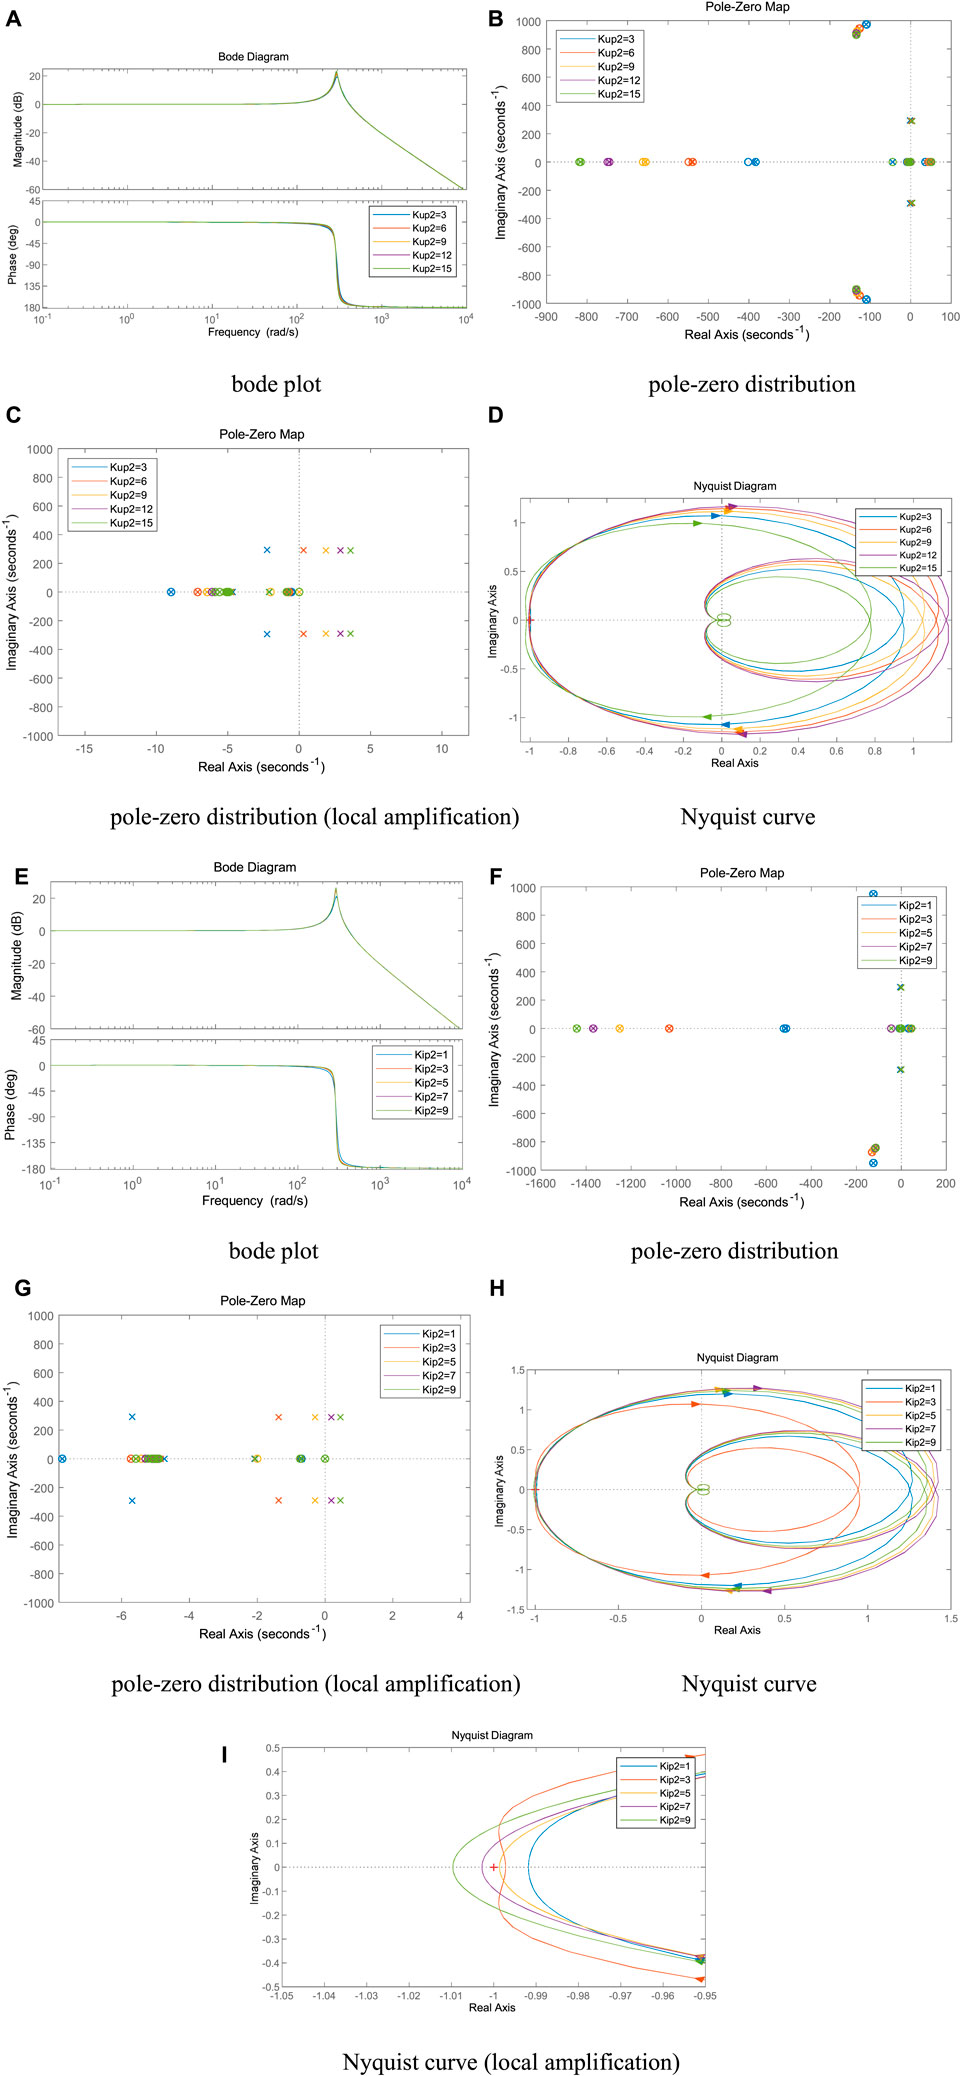
FIGURE 9. (Continued). Effect of the control parameters of VSC2 on system stability. (A) bode plot, (B) pole-zero distribution, (C) pole-zero distribution (local amplification), (D) Nyquist curve, (E) bode plot, (F) pole-zero distribution, (G) pole-zero distribution (local amplification), (H) Nyquist curve, (I) Nyquist curve (local amplification).
4.3.2 Internal loop control parameters of VSC2
It can be seen from Figures 9E–I, as the inner loop control parameter Kip2 of VSC2 gradually increases, the spike amplitude gradually increases, the spike frequency basically remains the same, the system pole gradually shifts to the right, and the intersection point of Nyquist curve and negative real axis gradually moves away from the imaginary axis. When Kip2≥5, the Nyquist curve contains the (-1, 0) point, the system pole enters the right half-plane, and the system is destabilized.
4.4 Influence of line parameters
4.4.1 AC side inductance of VSC1
It can be seen from Figures 10A–D, as the AC side line inductance Lc1 of VSC1 gradually increases, the spike amplitude and spike frequency gradually decrease, the system pole gradually shifts to the right, and the intersection of the Nyquist curve and the negative real axis gradually moves away from the imaginary axis. When Lc1≥9 mH, the Nyquist curve contains the (-1, 0) point, the system pole enters the right half-plane, and the system is destabilized.
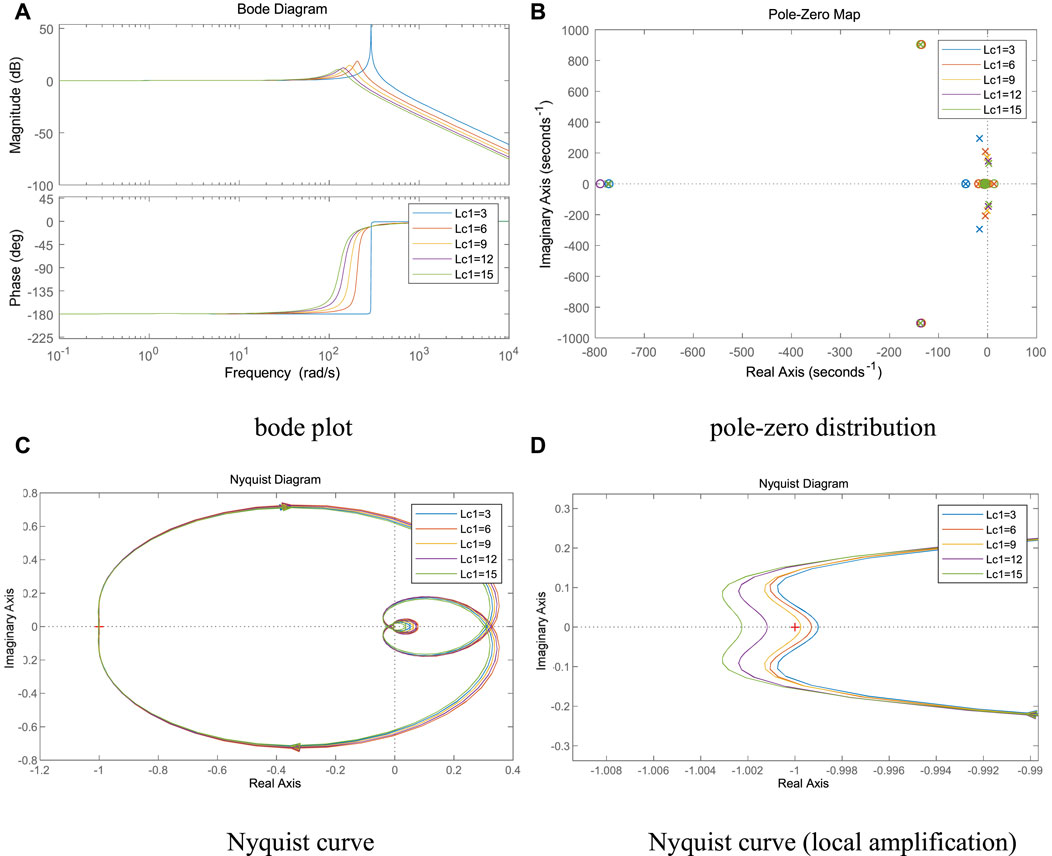
FIGURE 10. Effect of AC side inductance of VSC1 on system stability. (A) bode plot (B) pole-zero distribution, (C) Nyquist curve, (D) Nyquist curve (local amplification).
4.4.2 AC side inductance of VSC2
It can be seen from Figures 11A–E, as the AC side line inductance Lc2 of VSC2 gradually increases, the spike amplitude gradually decreases, the spike frequency does not change significantly, the system pole gradually shifts to the right, and the intersection of the Nyquist curve and the negative real axis gradually moves away from the imaginary axis. When Lc2≥9 mH, the Nyquist curve contains (-1, 0) points, the system pole enters the right half-plane, and the system is destabilized.
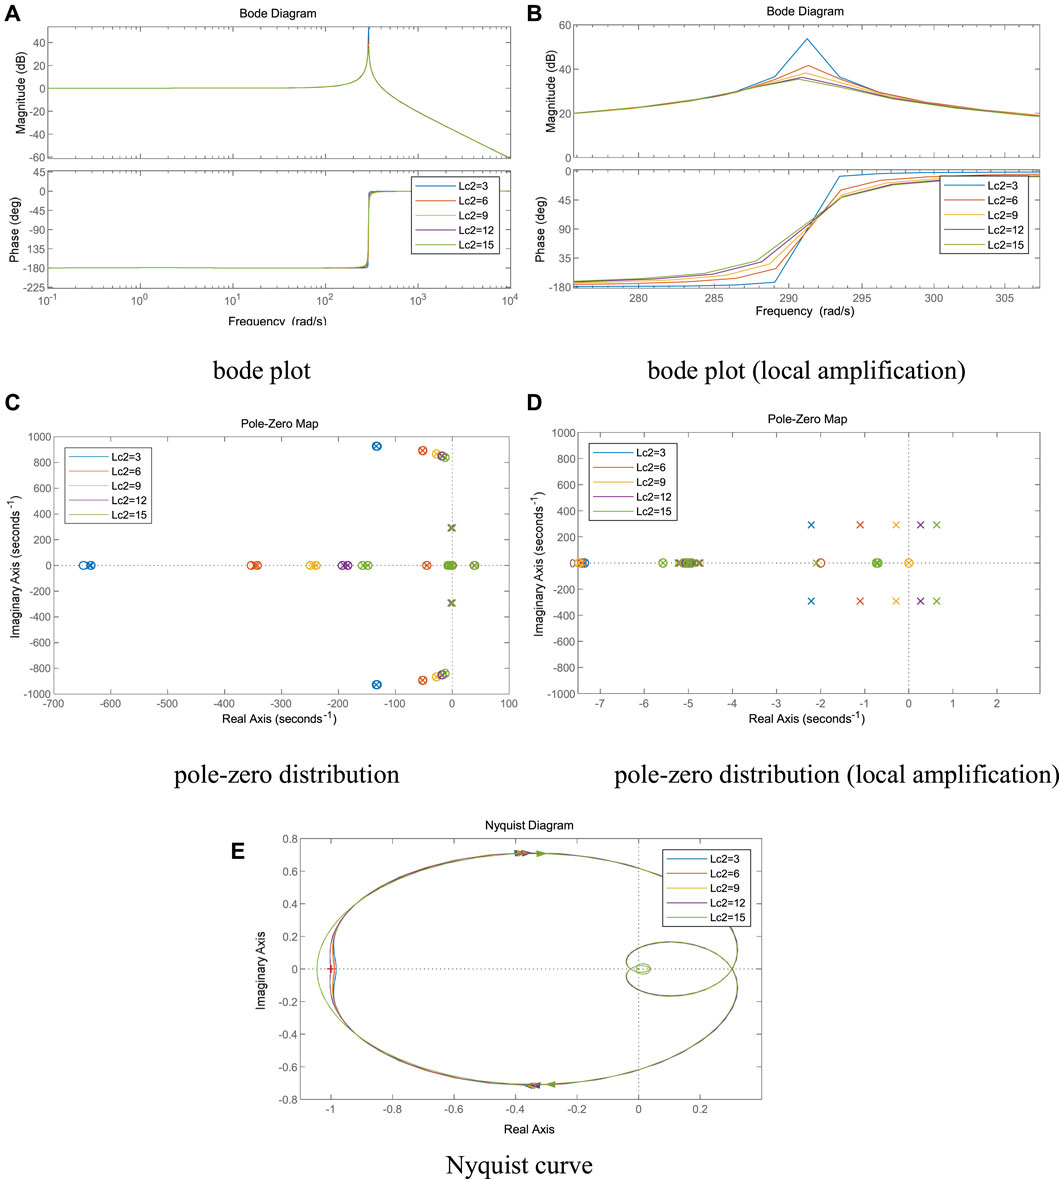
FIGURE 11. Effect of AC side inductance of VSC2 on system stability. (A) bode plot, (B) bode plot (local amplification), (C) pole-zero distribution, (D) pole-zero distribution (local amplification), (E) Nyquist curve.
4.4.3 Effect of DC-side capacitance
It can be seen from Figures 12A–D, as the dc capacitance Cdc gradually increases, the spike amplitude and spike frequency gradually decrease, the system pole gradually shifts to the left, and the intersection of the Nyquist curve and the negative real axis gradually approaches the imaginary axis. When Cdc≤2 mF, the Nyquist curve contains the (-1, 0) point, the system pole enters the right half-plane, and the system is destabilized.
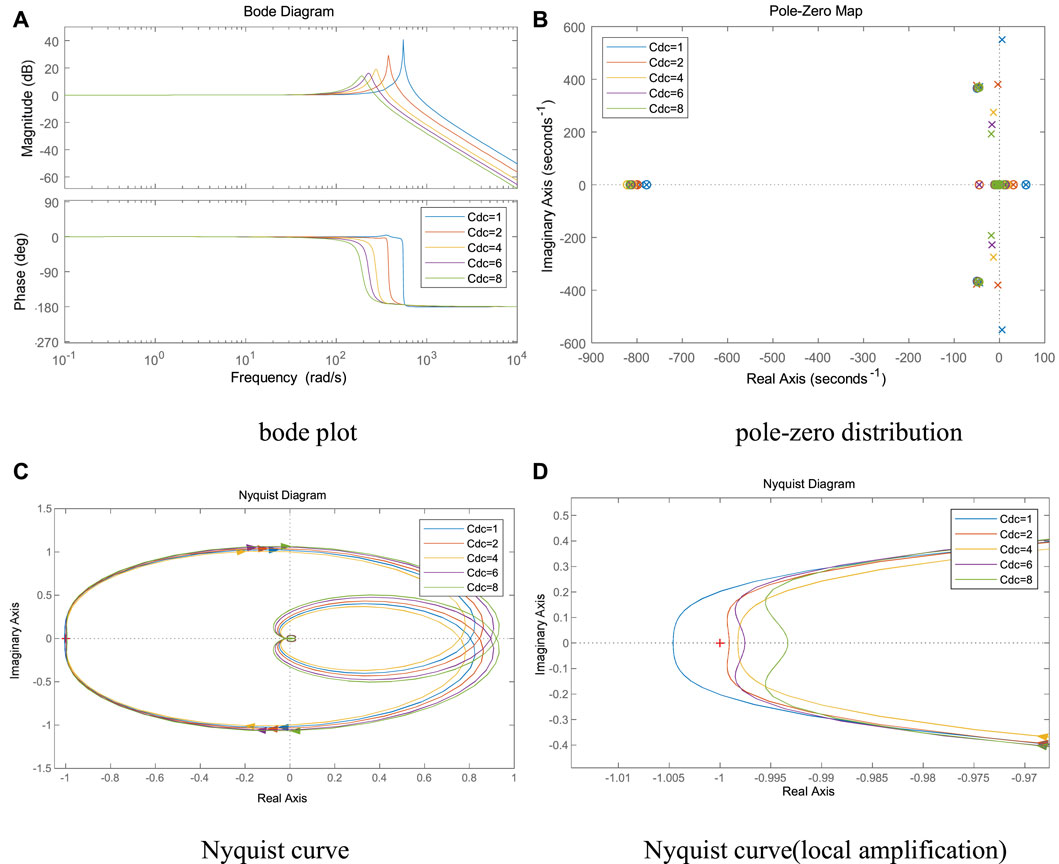
FIGURE 12. Effect of DC-side capacitance on system stability., (A) bode plot, (B) pole-zero distribution, (C) Nyquist curve (D) Nyquist curve(local amplification).
5 Simulation verification and hardware-in-the-loop experiment
Since the DC voltage is one of the important indicators to measure the power balance and stability of the DC distribution system, the DC side bus voltage is selected as the observed quantity in the subsequent simulation to determine the system stability. 100% increase of DC load at 15s and end of simulation at 30s.
In order to verify the correctness and effectiveness of the proposed control strategy, a controller-level hardware-in-the-loop test platform is built as shown in Figure 13. The platform consists of an RT-LAB real-time simulation experiment bench, a DSP control board, a host computer and an oscilloscope. The controller adopts TI’s TM320F28069 main control chip, and the RTBOX has 16 analog input and output ports and 32 digital input and output ports, which fully meet the requirements of this experiment. The output voltage and frequency waveforms are output through the analog output channels of the RTBOX and displayed on the oscilloscope.
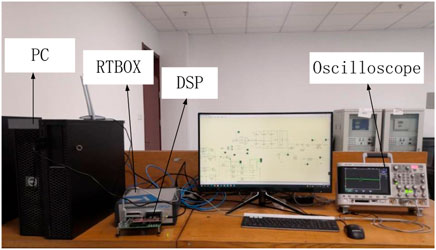
FIGURE 13. Hardware-in-the-loop experiment platform.
First, the original single -terminal model and the interactive model will be compared. The system power of the simulated model is 0.2 for the single -terminal model, 0.5 for the interactive model, and 0.3 for the reference power of VSC2. The load increases by 0.5 at 15 s. The DC voltage variation and the output power of each converter for the single -terminal model and the interactive model are given in Figures 14, 15, respectively, and are tested in hardware-in-the-loop experiments. From the figures, it can be obtained that the interactive model experienced power oscillations in VSC1 during power recovery when the output power of VSC1 increased by the same value, which further led to load power and VSC2 output power oscillations and system collapse. This result verifies the previous theoretical analysis that for the same control parameters and circuit parameters, the system will be in an unstable state after some specific perturbation when considering the influence of the control system from the converter on the system, which is not captured by the original single -terminal equivalent model.
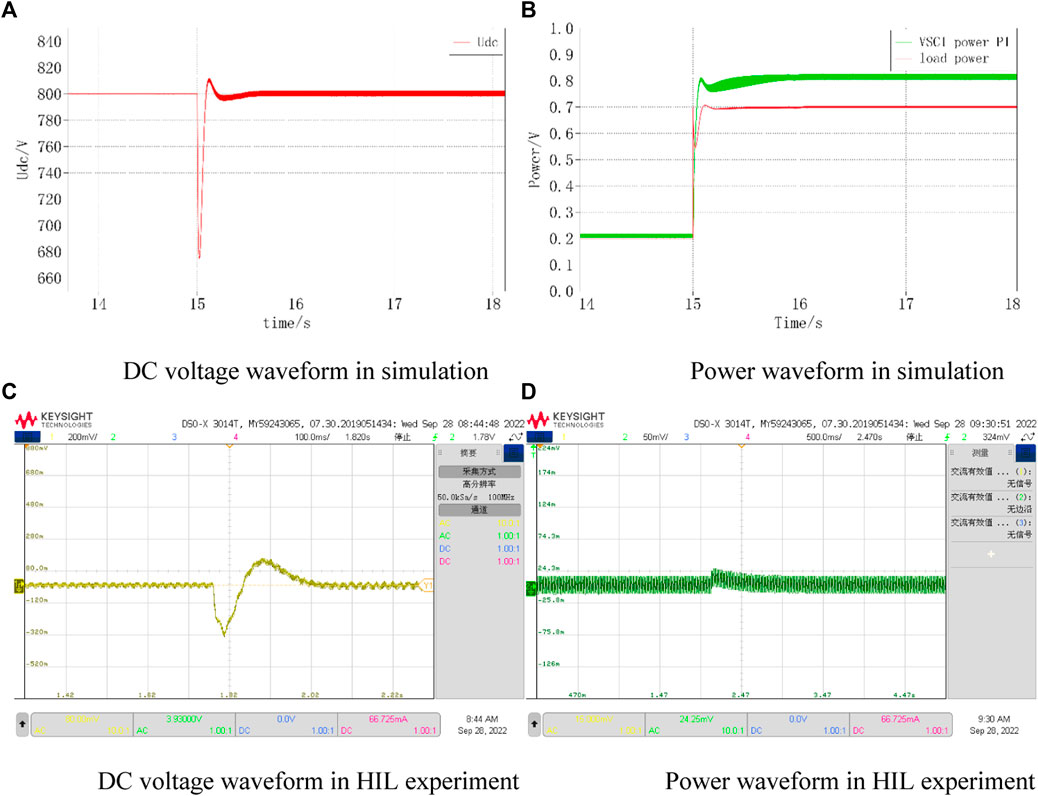
FIGURE 14. Single-terminal model simulation and HIL experimental waveforms. (A) DC voltage waveform in simulation (B) Power waveform in simulation, (C) DC voltage waveform in HIL experiment (D) Power waveform in HIL experiment.
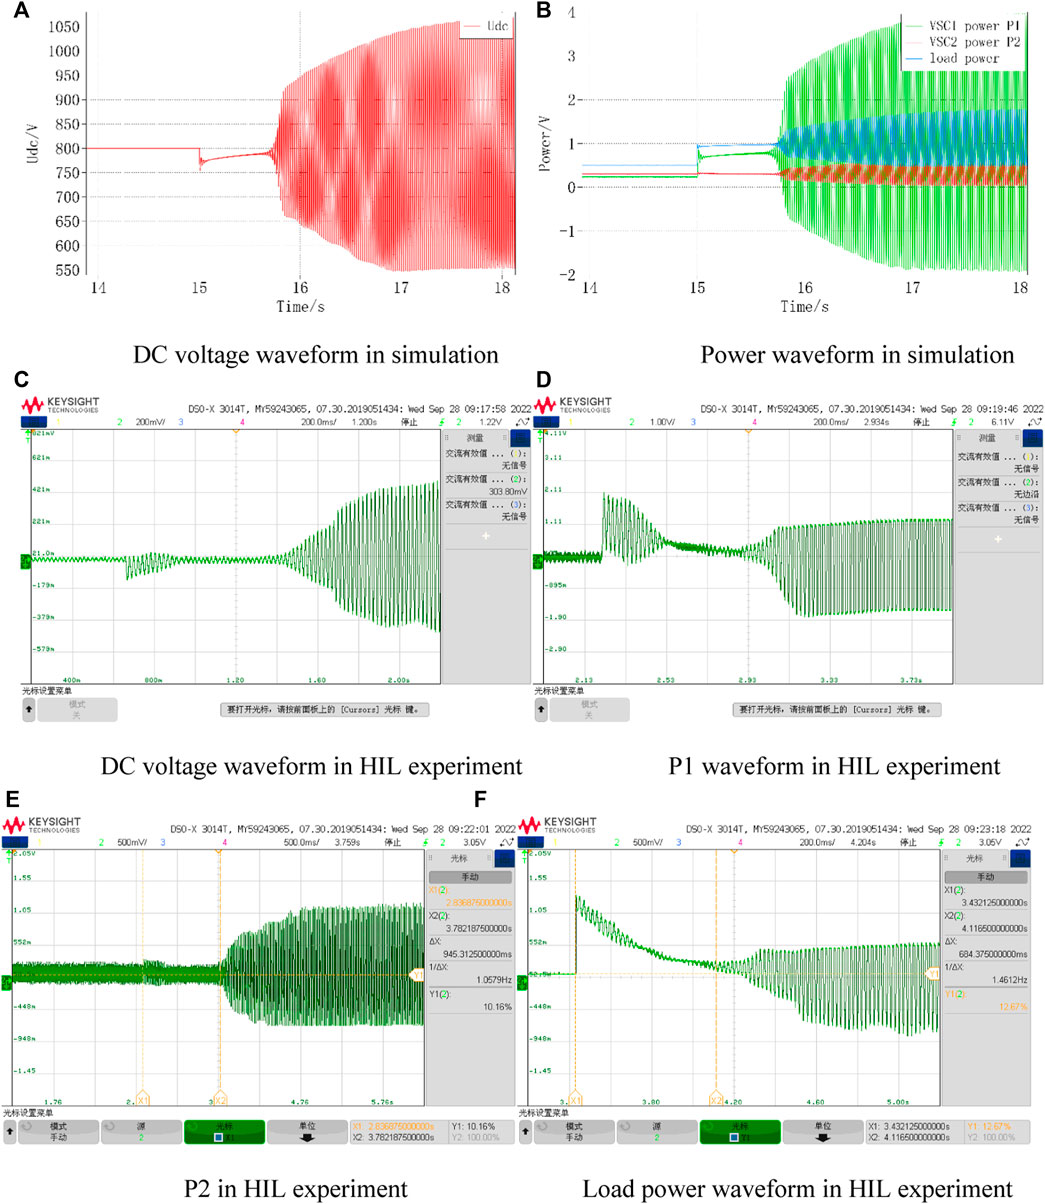
FIGURE 15. Interactive model simulation and HIL experimental waveforms. (A) DC voltage waveform in simulation, (B) Power waveform in simulation, (C) DC voltage waveform in HIL experiment, (D) P1 waveform in HIL experiment, (E) P2 in HIL experiment, (F) Load power waveform in HIL experiment
5.1 Reference power of converter station
5.1.1 Changing the reference power P1 of VSC1
The DC bus voltage waveforms for VSC1 reference power of 0.4 MW and 0.5 MW, respectively, are shown in Figure 16. It can be seen that when P1 is 0.4, the DC bus voltage returns to the stable state smoothly; while when P1 is 0.5, the DC bus voltage oscillates and diverges under the same disturbance, and the system is unstable.
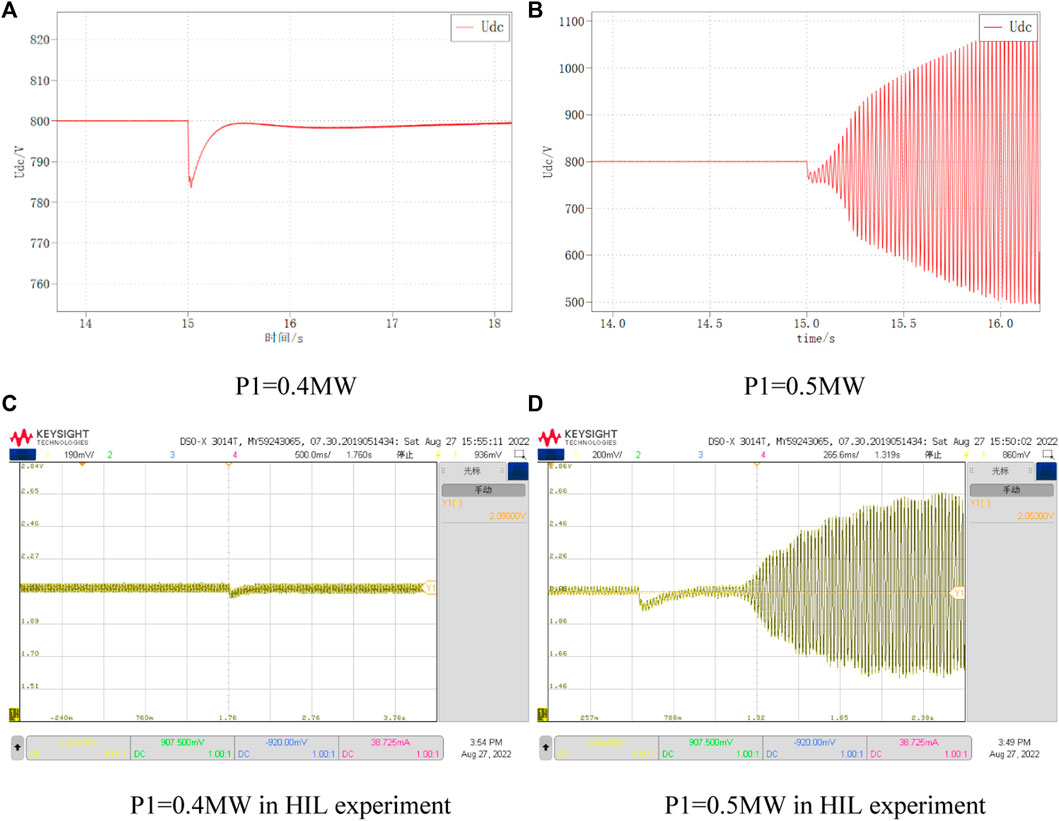
FIGURE 16. DC voltage variation at different P1. (A) P1=0.4 MW, (B) P1=0.5 MW, (C) P1=0.4 MW in HIL experiment, (D) P1=0.5 MW in HIL experiment.
5.1.2 Changing the reference power P2 of VSC2
The DC bus voltage waveforms for VSC1 reference power of 0.3 MW and 0.5 MW, respectively, are shown in Figure 17. It can be seen that when P2 is 0.3, the DC bus voltage returns to the stable state smoothly; while when P2 is 0.5, the DC bus voltage oscillates and diverges under the same disturbance, and the system is unstable.
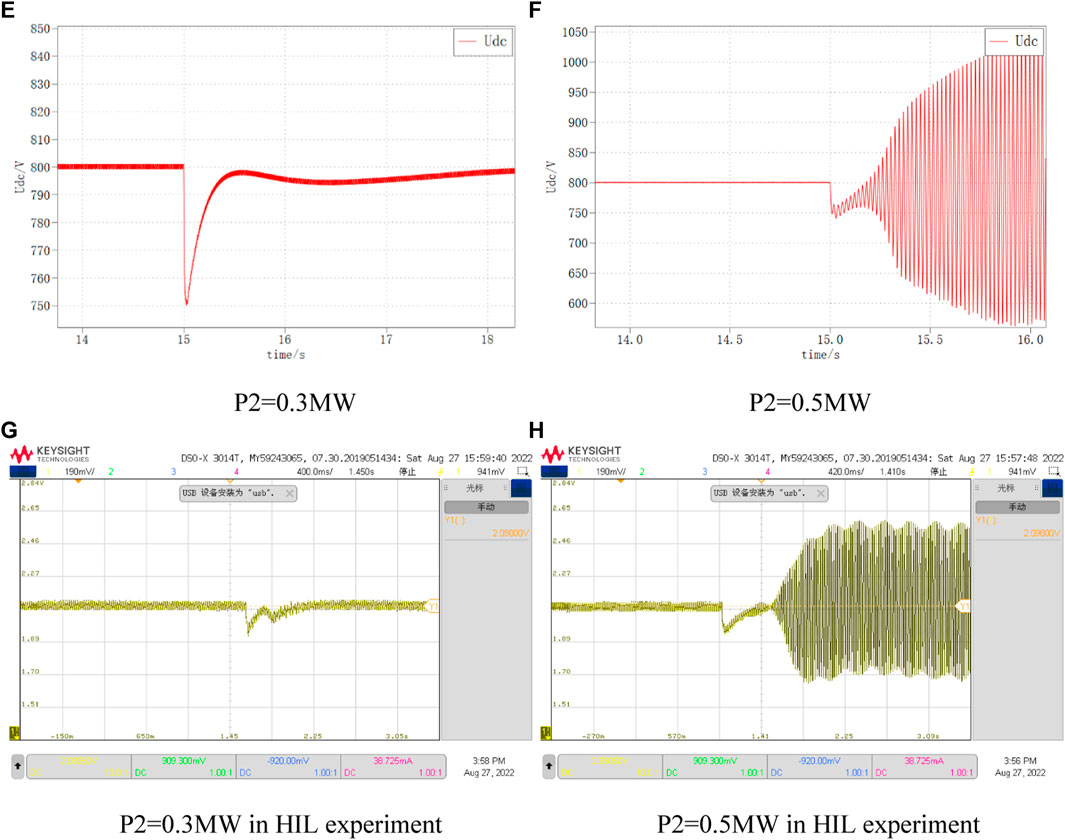
FIGURE 17. DC voltage variation at different P2. (E) P2=0.3 MW, (F) P2=0.5 MW, (G) P2=0.3 MW in HIL experiment, (H) P2=0.5 MW in HIL experiment
5.2 Reference power of converter station
5.2.1 Changing the inner loop parameters of VSC1
The DC bus voltage waveforms for VSC1 the inner loop parameters of 2 and 0.5, respectively, are shown in Figure 18. It can be seen that when Kip1 is 2, the DC bus voltage returns to the stable state smoothly; while when Kip1 is 0.5, the DC bus voltage oscillates and diverges under the same disturbance, and the system is unstable.
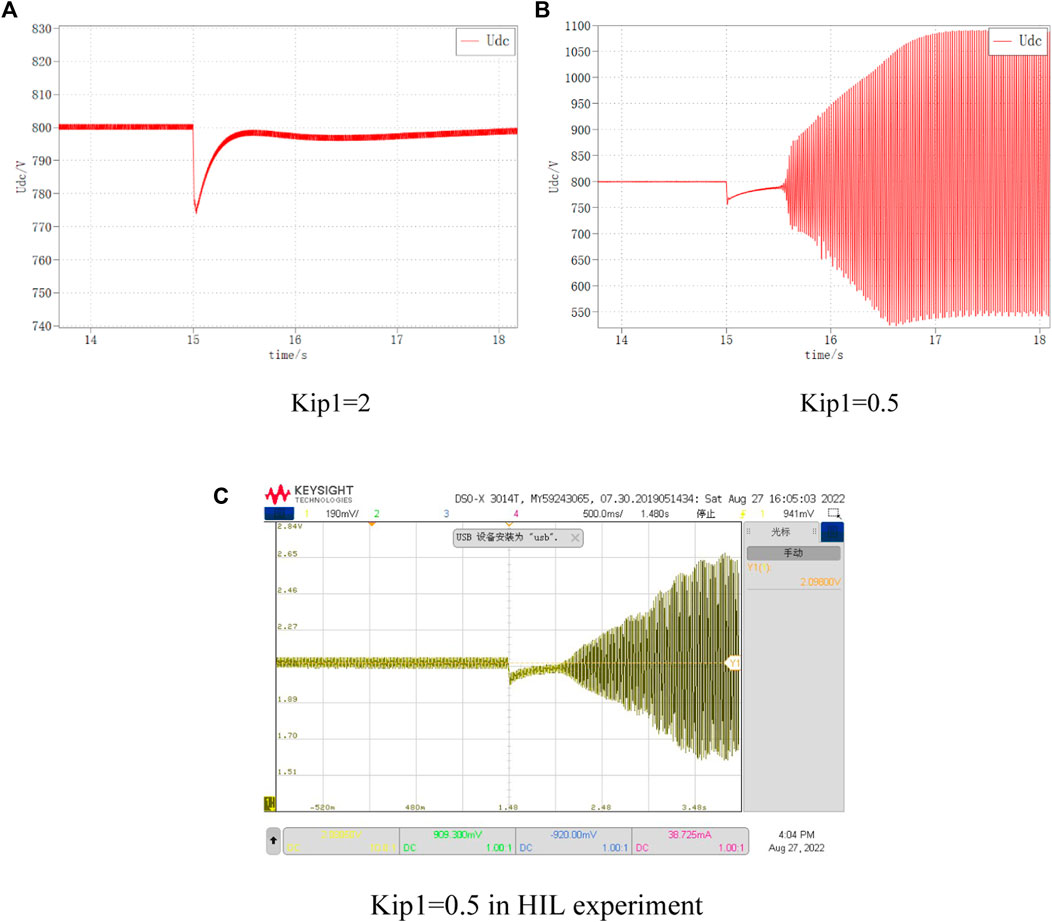
FIGURE 18. DC voltage variation at different Kip1. (A) Kip1=2, (B) Kip1=0.5, (C) Kip1=0.5 in HIL experiment
5.2.2 Changing the outer loop parameters of VSC1
The DC bus voltage waveforms for VSC1 the inner loop parameters of 3 and 30, respectively, are shown in Figure 19. It can be seen that when Kup1 is 3, the DC bus voltage returns to the stable state smoothly; while when Kup1 is 30, the selection of Kup1 is out of the normal range at this time, the DC bus voltage oscillates and diverges under the same disturbance, and the system is unstable.
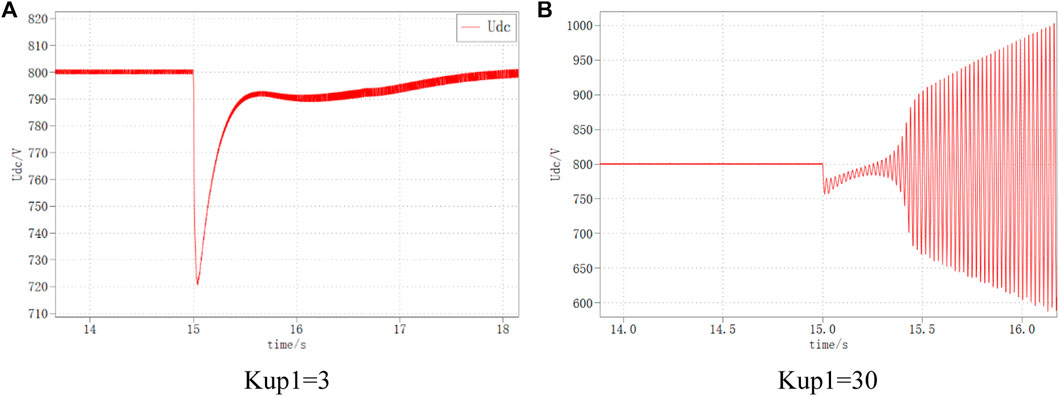
FIGURE 19. DC voltage variation at different Kup1. (A) Kup1=3. (B) Kup1=30
5.3 VSC2 control parameters
5.3.1 Changing the inner loop parameters of VSC2
The DC bus voltage waveforms for VSC1 the inner loop parameters of 4 and 7, respectively, are shown in Figure 20. It can be seen that when Kip2 is 4, the DC bus voltage returns to the stable state smoothly; while when Kip2 is 7, the DC bus voltage oscillates and diverges under the same disturbance, and the system is unstable.
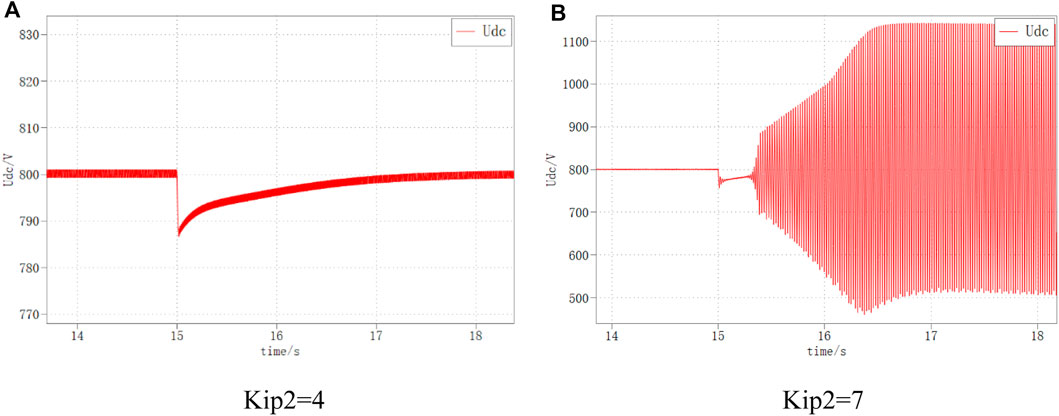
FIGURE 20. DC voltage variation at different Kip2. (A) Kip2=4. (B) Kip2=7
5.3.2 Changing the outer loop parameters of VSC2
The DC bus voltage waveforms for VSC1 the inner loop parameters of 3 and 5, respectively, are shown in Figure 21. It can be seen that when Kup2 is 3, the DC bus voltage returns to the stable state smoothly; while when Kup2 is 5, the DC bus voltage oscillates and diverges under the same disturbance, and the system is unstable.
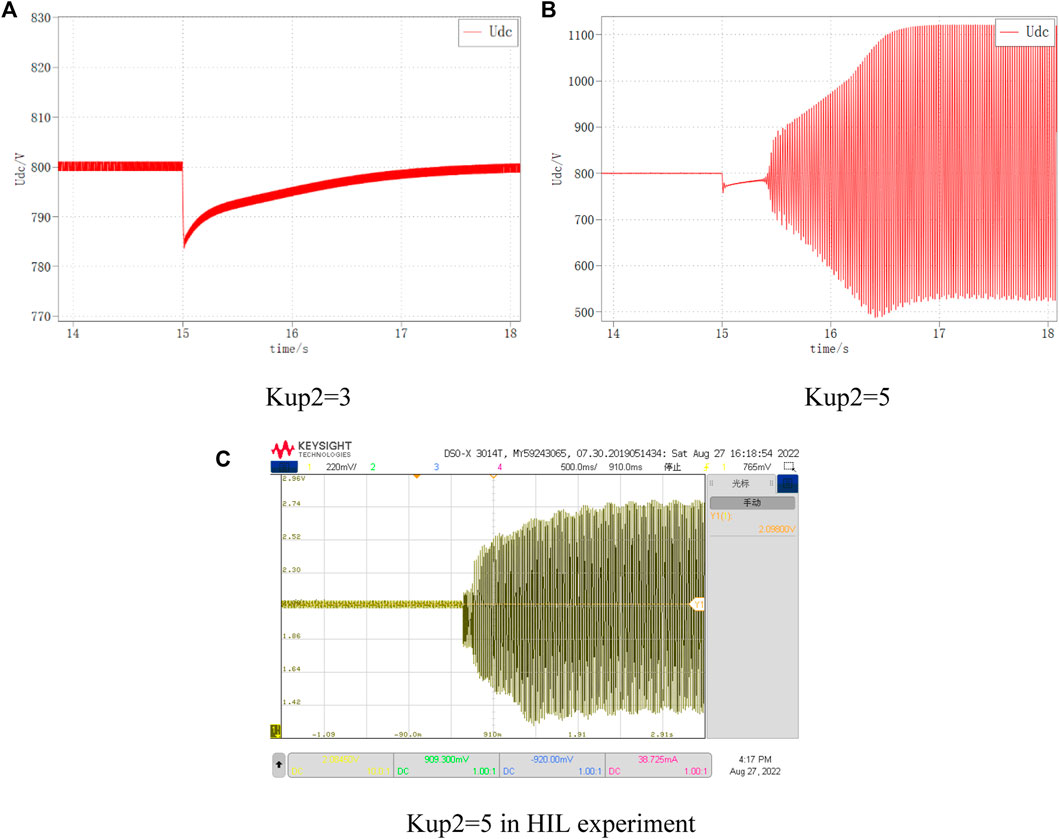
FIGURE 21. DC voltage variation at different Kup2. (A) Kup2=3. (B) Kup2=5. (C) Kup2=5 in HIL experiment.
5.4 Line parameters
5.4.1 Changing AC side inductance of VSC1
The DC bus voltage waveforms for VSC1 AC side inductance of 2 mH and 10 mH, respectively, are shown in Figure 22. It can be seen that when Lc1 is 2 mH, the DC bus voltage returns to the stable state smoothly; while when Lc1 is 10 mH, the DC bus voltage oscillates and diverges under the same disturbance, and the system is unstable.
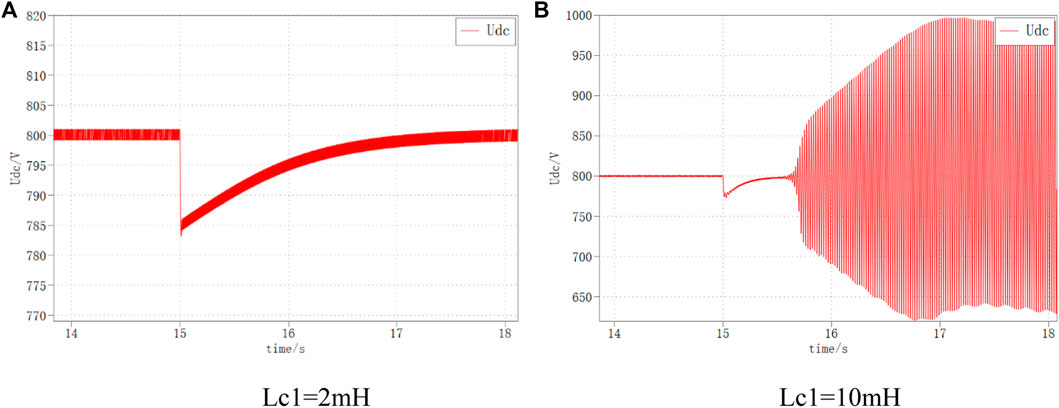
FIGURE 22. DC voltage variation at different Lc1. (A) Lc1=2 mH. (B) Lc1=10 mH.
5.4.2 Changing AC side inductance of VSC2
The DC bus voltage waveforms for VSC2 the AC side inductance of 2.5 mH and 10 mH, respectively, are shown in Figure 23. It can be seen that when Lc2 is 2.5 mH, the DC bus voltage returns to the stable state smoothly; while when Lc2 is 10 mH, the DC bus voltage oscillates and diverges under the same disturbance, and the system is unstable.
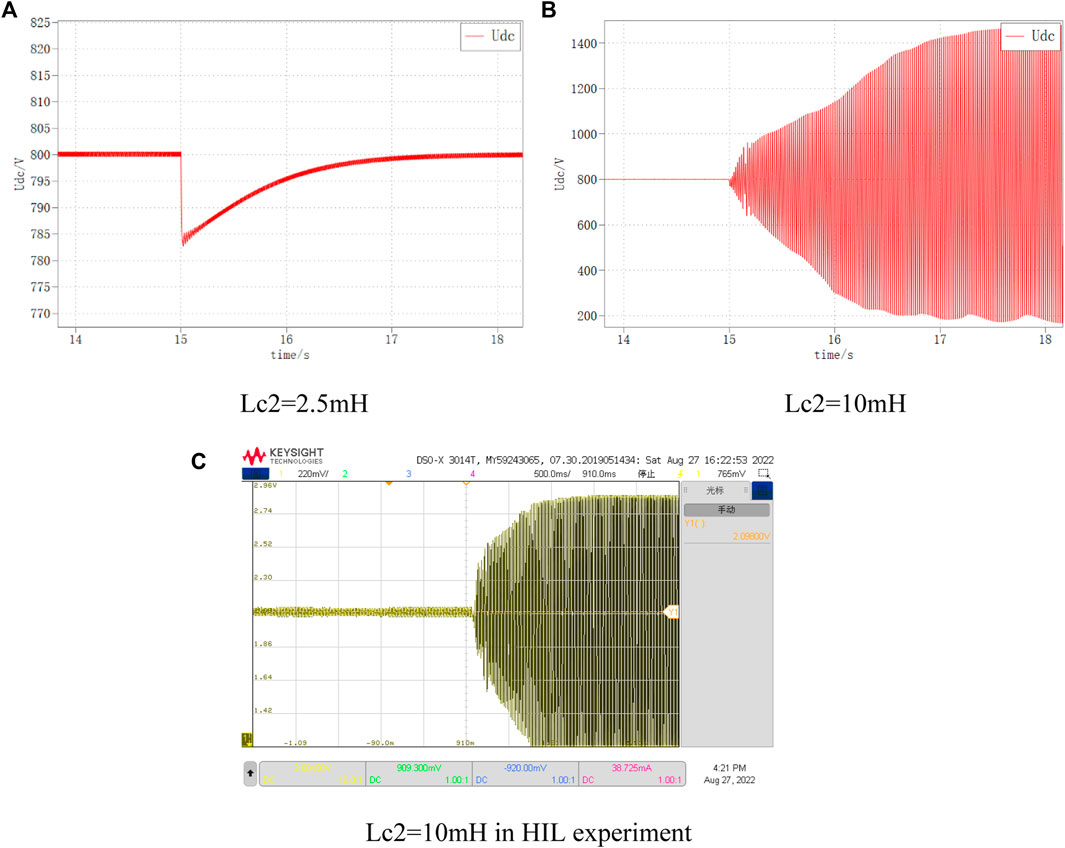
FIGURE 23. DC voltage variation at different Lc2. (A) Lc2=2.5 mH, (B) Lc2=10 mH, (C) Lc2=10 mH in HIL experiment.
5.4.3 Changing DC-side capacitance
The DC bus voltage waveforms for DC-side capacitance of 4 mF and 1mF, respectively, are shown in Figure 24. It can be seen that when Cdc is 4mF, the DC bus voltage returns to the stable state smoothly; while when Cdc is 1mF, the DC bus voltage oscillates and diverges under the same disturbance, and the system is unstable.
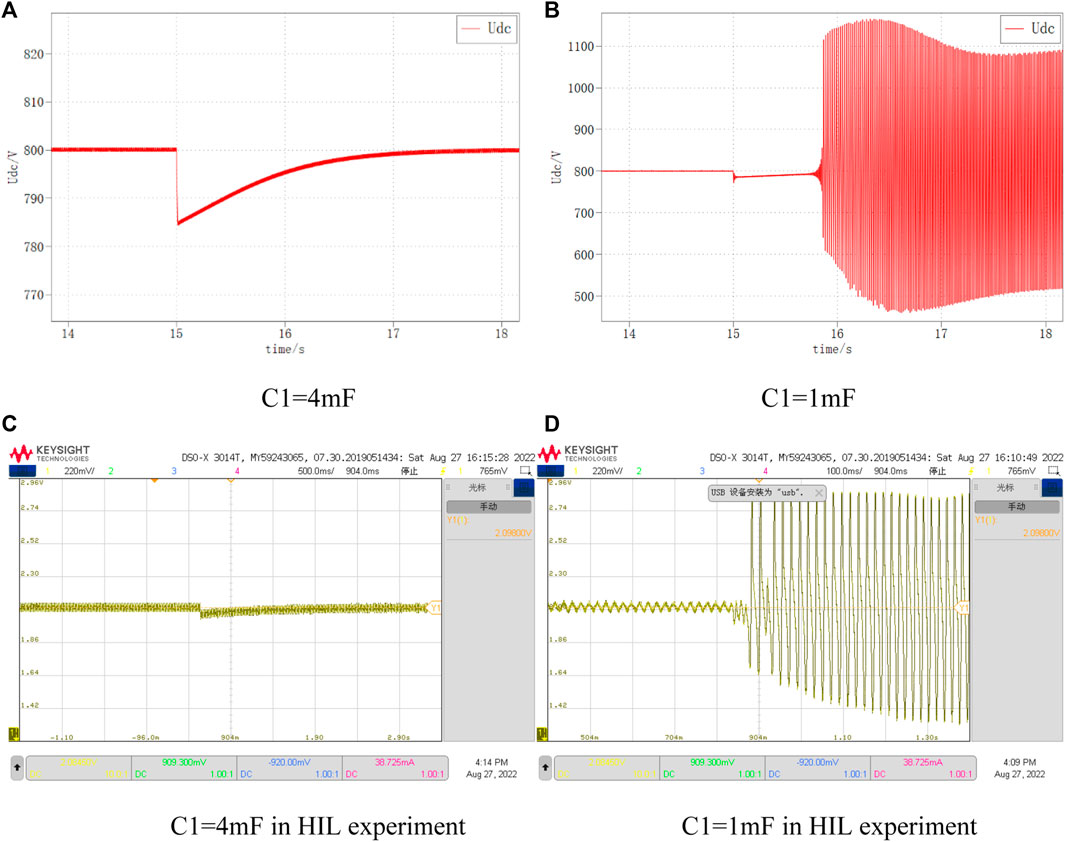
FIGURE 24. DC voltage variation at different C1. (A) C1=4 mF, (B) C1=1 mF, (C) C1=4 mF in HIL experiment, (D) C1=1 mF in HIL experiment
6 Conclusion
This paper establishes an AC-DC distribution system model that takes into account the interaction of each converter control system, compares the system frequency response curves of the interaction model and the original model, takes the resonance spikes generated by the interaction between converters as the reference object, and further analyzes the influence of converter control parameters and system electrical parameters on system stability and interaction. The main conclusions are as follows.
(1) The interaction between each converter and the CPL characteristics make the system impedance characteristics have a resonance spike, the amplitude of VSC DC port impedance increases in the resonance frequency band, and the phase at the resonance point has a 180° jump, which reduces the system damping and stability and easily induces system instability.
(2) The resonant spike amplitude generated by the system interaction and CPL characteristics is positively correlated with the rated power of each converter station, the outer loop control parameters of each converter station, the inner loop control of the main converter station, and negatively correlated with the inner loop control parameters of the slave converter station, the AC side inductance and DC side capacitance of each converter station.
(3) The resonant spike frequency generated by system interaction and CPL characteristics is positively correlated with the control parameters of the main converter station, negatively correlated with the AC-side inductance and DC-side capacitance of the main converter station, and has little relationship with the rated power of the converter station, the control parameters of the slave converter station and the AC-side inductance of the slave converter station.
In this paper, a transfer function model of a double-ended AC-DC distribution system is developed to analyze the effects of parameter changes on system interactions, using the main converter station control system as a reference. Since the impedance modeling approach is adopted for the DC side, the DC side is equated to a feedback link in the control block diagram of the main converter station, which greatly simplifies the calculation process while ensuring that the input single-output Nyqusit criterion is still applicable and avoiding the problems of increasing system complexity with the introduction of converter stations, distributed generation and loads. In the future, the model will be optimized to analyze the impact of different distributed generation, different types of loads, and different DC-side topologies on the system stability.
The above analysis only qualitatively analyzes the parameters and draws relevant conclusions, but fails to quantitatively analyze the parameters; the model used in this paper does not consider the influence of the DC line on the system stability; it fails to optimize the control for the interaction of the system, which needs to be further explored in the subsequent work.
Data availability statement
The original contributions presented in the study are included in the article/supplementary material, further inquiries can be directed to the corresponding author.
Author contributions
TC: Responsible for resources, software, formal analysis, program compilation and writing original draft. DF: Responsible for methodology, project administration and funding acquisition. XW: Responsible for writing review and editing. BX: Responsible for visualization and supervision. CL: Responsible for investigation and resources. BX: Responsible for obtaining the experimental data.
Funding
The authors declare that this study received funding from Science and Technology Project of “Research on dynamic interaction characteristics and power optimization control technology of AC/DC distribution systems with high proportion of distributed generation” (SGSDLY00DKJS2200405), Linyi power supply company of Shandong electric power company, State Grid. The funder had the following involvement in the study:Provided data support and HIL experimental design.
Conflict of interest
Authors TC, DF, XW, CL, and BX were employed by the company State Grid Shandong Electric Power Company Linyi Power Supply Company.
The authors declare that this study received funding from Shandong electric power company, State Grid. The funder had the following involvement in the study: Provided data support and HIL experimental design.
Publisher’s note
All claims expressed in this article are solely those of the authors and do not necessarily represent those of their affiliated organizations, or those of the publisher, the editors and the reviewers. Any product that may be evaluated in this article, or claim that may be made by its manufacturer, is not guaranteed or endorsed by the publisher.
References
Deng, H., and Fang, J. (2022). State-space modeling, stability analysis, and controller design of grid-forming converters with distributed virtual inertia. Front. Energy Res. 08 (26). doi:10.3389/fenrg.2022.833387
Feng, F., Fang, J., Manandhar, U., Gooi, H., and Wang, L. (2022). Impedance modeling and stability-oriented parameter optimization of isolated dual active bridge-based two-stage AC-DC-DC converter. Front. Energy Res. 30 (06). doi:10.3389/fenrg.2022.874467
Huang, X., Liu, Y., Chen, Y., He, Z. X., Wu, W., Ning, Q., et al. (2020). Impedance-based modeling, stability analysis and virtual damping approach in DC grid. Power Syst. Prot. Control 48 (7), 108–117. doi:10.19783/j.cnki.pspc.190533
Jiang, S., Peng, K., Xu, B., Zhang, X., and Liu, Y. (2021). Current situation and prospect of demonstration projects of DC distribution system. Electr. Power Autom. Equip. 41 (05), 219–231. doi:10.16081/j.epae.202105039
Li, C., Liu, X., Wang, R., Zhang, Y., and Zhang, L. (2022). An improved dual-loop feedforward control method for the enhancing stability of grid-connected PV and energy storage system under weak grids. Front. Energy Res. 22 (06). doi:10.3389/fenrg.2022.939376
Li, X., Guo, L., Huang, D., Zhao, Y., and Wang, C. (2019). Research review on operation and control of DC distribution networks. High. Volt. Eng. 45 (10), 3039–3049. doi:10.13336/j.1003-6520.hve.20190924002
Liu, K., Li, Y., Liao, X., Zhu, S., and Huai, Q. (2020). Virtual resistor control strategy for improving stability of VSC-hvdc operating in bidirectional power flow mode. High. Volt. Eng. 46 (5), 1665–1675. doi:10.13336/j.1003-6520.hve.20200515021
Nian, H., Yang, J., Chen, L., Xu, Y., Hu, B., and Li, M. (2020). DC impedance modeling and stability analysis of AC/DC hybrid power supply system. High. Volt. Eng. 46 (10), 3477–3490. doi:10.13336/j.1003-6520.hve.20200634
Peng, K., Wang, L., Li, X., Liu, F., Zhang, H., and Jia, S. (2021). Analysis and control of high-frequency oscillation for DC distribution system with droop control. Automation Electr. Power Syst. 45 (17), 43–50. doi:10.7500/AEPS20210329005
Qiu, P., Song, J., Chen, Q., Zhou, W., Xiong, B., and Tang, A. (2022). Research on oscillation characteristics of wind farm sending system based on participation factor. Front. Energy Res. 09 (08). doi:10.3389/fenrg.2022.997782
Tao, X., Xiang, J., and Wei, W. (2017). “Impedance modeling and analysis of AC-DC modular cascade system,” in 2017 29th Chinese Control and Decision Conference, Chongqing, China, 28-30 May 2017 (Chongqing: CCDC), 2316–2321. doi:10.1109/CCDC.2017.7978901
Wang, Y., Zhao, C., and Guo, C. (2020). Transfer function model and low-frequency stability analysis for PMSG-based wind farm interconnected with flexible-HVDC system. Proc. CSEE 40 (05), 1485–1498. doi:10.13334/j.0258-8013.pcsee.190657
Wu, G., Wangzhou, X., Zhao, B., Liang, J., Li, Y., et al. (2019). Analytical analysis on the active power control stability of the weak grids-connected VSC. Proc. CSEE 39 (21), 6163–2633. doi:10.13334/j.0258-8013.pcsee.190232
Wu, G., Zhou, X., Wang, S., Liang, J., Wang, T., Li, Y., et al. (2018). Nalytical research on the mechanism of the interaction between PLL and inner current loop when VSC-HVDC connected to weak grid. Proc. CSEE 38 (9), 2622–2633. doi:10.13334/j.0258-8013.pcsee.172502
Wu, W., Luo, A., Chen, Y., Dong, Y., Zhou, L., and Zhou, X. (2017). “DC impedance modeling, stability analysis and active stabilization of the VSC-HVDC system,” in IECON 2017 - 43rd Annual Conference of the, Beijing, China, 29 October 2017 - 01 November 2017 (IEEE Industrial Electronics Society), 4891–4896. doi:10.1109/IECON.2017.8216844
Wu, W., Xie, Z., Chen, Y., Liu, J., Guo, J., Xu, Y., et al. (2020). Analysis and suppression of high-frequency oscillation between converter-based source and loads in an island power system. Int. J. Electr. Power & Energy Syst. 117, 105616.10–105616.13. doi:10.1016/j.ijepes.2019.105616
Xie, X., Wu, Z., Hu, Q., Quan, X., Dou, X., and Cao, X. (2022). A unified modeling scheme of modular multilevel converter for hybrid AC/DC power grids. Front. Energy Res. 08 (13). doi:10.3389/fenrg.2022.844713
Xue, D., Liu, J., Liu, Z., Tu, Y., and Liu, T. (2020). Modeling and analysis of DC terminal impedance of voltage source converters with different control modes. IEEE Trans. Power Electron. 35 (6), 5883–5896. doi:10.1109/TPEL.2019.2953118
Yao, G., Peng, K., Li, H., Wei, Z., and Li, X. (2020). Reduced-order model and mechanism analysis of high-frequency oscillation in flexible DC distribution system. Automation Electr. Power Syst. 44 (20), 29–36. doi:10.7500/AEPS20200412002
Yin, R., Sun, Y., Wang, S., Zhao, B., Wu, G., Yang, P., et al. (2021). The modeling and stability analysis of dual-infeed VSC based on the single-input and single-output transfer function model. Proc. CSEE 41 (19), 6724–6739. doi:10.13334/j.0258-8013.pcsee.201359
Yuan, B., Yuan, Y., Xu, J., Zhao, C., Huang, Y., Zhao, X., et al. (2016). Small signal stability analysis of dual infeed VSCs connected to weak AC system and design of virtual impedance control strategy. J. North China Electr. Power Univ. 43 (06), 38–46. doi:10.3969/j.ISSN.1007-2691.2016.06.07
Zhang, H., Harnefors, L., Wang, X., Hasler, J. P., and Nee, H. P. (2019). SISO transfer functions for stability analysis of grid-connected voltage-source converters. IEEE Trans. Industry Appl. 55 (3), 2931–3941. doi:10.23919/IPEC.2018.8507452
Zhang, H., Harnefors, L., Wang, X., Hong, G., and Hasler, J. P. (2018). Stability analysis of grid-connected voltage-source converters using SISO modeling. IEEE Trans. Power Electron. 34 (8), 8104–8117. doi:10.1109/TPEL.2018.2878930
Zhang, X., Pei, W., Deng, W., Yu, T., Fan, S., and Huang, R. (2017). Stability analysis of AC/DC hybrid distribution system with constant power loads. Proc. CSEE 37 (19), 5572–5582+5834. doi:10.13334/j.0258-8013.pcsee.161579
Keywords: DC power distribution system, interaction, system stability, hardware-in-the-loop experiment, master-slave control
Citation: Chen T, Feng D, Wu X, Lu C and Xu B (2023) Modeling and stability analysis of interaction between converters in AC-DC distribution systems. Front. Energy Res. 10:1035193. doi: 10.3389/fenrg.2022.1035193
Received: 02 September 2022; Accepted: 21 October 2022;
Published: 02 February 2023.
Edited by:
Youbo Liu, Sichuan University, ChinaReviewed by:
Liansong Xiong, Xi’an Jiaotong University, ChinaRui Wang, Northeastern University, China
Copyright © 2023 Chen, Feng, Wu, Lu and Xu. This is an open-access article distributed under the terms of the Creative Commons Attribution License (CC BY). The use, distribution or reproduction in other forums is permitted, provided the original author(s) and the copyright owner(s) are credited and that the original publication in this journal is cited, in accordance with accepted academic practice. No use, distribution or reproduction is permitted which does not comply with these terms.
*Correspondence: Tao Chen, gwxmtgy2022@163.com