Heterogeneous response of the stock market to CO2 emissions in China
 Wenhui Li
 Tianzi Liu1
 - 1Hunan University of Humanities, Science and Technology, Loudi Hunan, China
- 2School of Business and Economics, Universiti Putra Malaysia, Serdang, Malaysia
CO2 emissions have been a great challenge in China, especially in recent years. Meanwhile, the CO2 emissions allowance price cannot accurately reflect the CO2 emissions information in China because of the limited efficiency in China’s carbon market. Accordingly, this study constructs a CO2 emissions index and provides an empirical investigation of the heterogeneous response of stock markets to CO2 emissions. With a quantile regression approach, we document that the effect of CO2 emissions on stock returns is significant in 2021, while it is insignificant in 2019 and 2020. In addition, its influence is more significant at the upper and lower quantiles than at the median quantile. Our findings indicate that investors and the government should pay more attention to carbon risk in the future and under extreme market conditions.
1 Introduction
CO2 emissions are a great challenge for China, the largest carbon emitter in the world. The government has adopted tightening carbon emissions policies for energy firms to cut CO2 emissions, such as a continuous decline in the benchmark of CO2 emissions starting in 2021, which is significantly lower than in 2020 and 2019. The CO2 emissions allowance decreased significantly. Energy firms must reduce carbon emissions or pay for excess carbon emissions. Meanwhile, the global CO2 emission allowance price has risen sharply, and the price of the European Union carbon allowance (EUA) increased from 33.7 euros to 88.9 euros per ton at the end of 2021. In addition, investor attention to CO2 emissions is increasing, indicating that the effect of CO2 emissions on stock returns in 2021 is more significant than before.
The effect of CO2 emissions on stock returns is based on the CO2 emissions allowance price in China (Wen et al., 2020; Zhao et al., 2022; Pan et al., 2022; Bolton and Kacperczyk, 2021; Dutta et al., 2018), but the efficiency of China’s carbon market is limited (Fang and Cao, 2021; Wen et al., 2022; Zhang et al., 2020). This indicates that the price of Chinese carbon emission allowances (CEA) cannot accurately reflect CO2 emissions information, and the response of stock returns to CO2 emissions is inaccurate. Furthermore, we need to obtain more CO2 emissions components from other measurements. Rohleder et al. (2022) and Oestreich and Tsiakas (2015) investigate the effects of carbon emissions on the stock market based on CO2 emissions. In addition, Chen et al. (2022) and Guastella et al. (2022) report that CO2 emissions attention is the driver of stock returns, which means that attention to CO2 emissions cannot be neglected. This indicates that we should extract more CO2 emissions components from CO2 emissions allowance price, CO2 emissions, and CO2 emissions attention.
Accordingly, this paper contracts a CO2 emissions index to investigate the heterogeneous response of the stock market to carbon emissions from 2019 to 2021 in China. The panel quantile regression approach was employed in this paper, providing more complete results and demonstrating the possible heterogeneity. The research is carried out in the following steps. First, we used principal component analysis to construct a CO2 emissions index based on the CO2 emissions, CO2 emissions allowance price, and investor attention to CO2 emissions. Second, we make an empirical analysis to examine the heterogeneous response of the stock returns to CO2 emissions.
The contributions of our work are as follows. First, our empirical results show that the effect of CO2 emissions on stock returns is significant in 2021 and insignificant in 2019 and 2020. Zhu et al. (2018) and Daskalakis et al. (2009) report that the influence of CO2 emissions on stock returns is different at the different phases of volatility behavior in the EUA market. However, little research has paid attention to the heterogeneous response of the stock market to CO2 emissions in China in different years.
Second, using the principal component analysis method to construct a CO2 emissions index based on CO2 emissions, CO2 emissions allowance price, and investor attention to CO2 emissions accurately reflects CO2 emissions information in China. All the empirical results help the government and investors to understand the variation of carbon risk in recent years. The government and investors should pay more attention to CO2 emissions in the future and in extreme stock market conditions.
The remainder of the paper is organized as follows. Section 2 is a review of the literature. Section 3 introduces the construction of the CO2 emissions index. Section 4 is empirical results. Section 5 is the conclusions.
2 Literature review
The paper reviews the previous literature on the effect of CO2 emissions on stock returns from three main aspects. The first focuses on the relationship between CO2 emissions and CO2 emissions allowance. The CO2 emissions and CO2 emissions allowance prices interact with each other. On the one hand, CO2 emissions significantly impact the variation of the CO2 emissions allowance prices. Benz and Trück (2009) show that the skewness, excess kurtosis and different phases of volatility behavior of CO2 emissions allowance returns come from fluctuations in demand for CO2 emissions. On the other hand, the variation of CO2 emissions allowance price also significantly impacts CO2 emissions. Forbes and Zampelli (2019) report that increases in the carbon allowance price significantly reduce carbon emissions. Meanwhile, Li et al. (2022) believe that a significant impact occurs if the CO2 emissions allowance price exceeds 300 RMB/TCO2. From the above literature, we can conclude that the CO2 emissions and the price of CO2 emissions allowance are highly correlated, but they reflect the CO2 emissions information differently.
The second aspect focuses on the response of the stock returns and carbon emissions. The relationships among CO2 emissions allowance price, stock returns, and volatility are complicated. First, there are no consensus opinions about the response of stock returns to carbon emissions. Da et al. (2016) believe that EU ETS has a statistically significant positive long-run impact on the aggregated power-sector-stock market return decreasing the firm’s profitability. However, Tian et al. (2016) show that the positive relationship between EUA returns and returns of electricity companies is different for carbon-intensive companies. It is favorable for less carbon-intensive producers and negative for high carbon-intensive producers. Moreover, Xu et al. (2022) report that the relationship between the return of carbon-intensive industries and the carbon allowance is uncertain. The return is positive in Shenzhen and Shanghai pilots and negative in Beijing, Guangdong, and Hubei pilots. Second, the volatility spillover between carbon emissions allowance price and stock returns is also uncertain. Alkathery and Chaudhuri (2021) report significant volatility spillover effects and co-movement between carbon emission allowance prices and energy stock markets in the three GCC. Zhu et al. (2018) and Daskalakis et al. (2009) believe that the influence of CO2 emissions on stock returns is different at the different phases of volatility behavior in the EUA market. However, less attention is to the heterogeneous response of stock returns to CO2 emissions in different years in China.
The third aspect is that investor attention is a driver of the variation of financial markets. Fang et al. (2014) adopt the Baidu index as the proxy for individual investor attention to stocks and find that investor attention improves the stock return in the short term. Ben-Rephae and Israelsen (2017) report that institutional attention responds more quickly to significant news events, leads to retail attention, and facilitates permanent price adjustment. Moreover, their relationship affects other variables, such as the uncertainty avoidance index of national culture (Shear et al., 2020; Ren et al., 2022). In addition, more and more research demonstrates that investor attention to climate risk significantly impacts financial market variation. Liu et al. (2021) find that investor attention to air pollution reduces the prices of the polluting stocks, for the investors receive more attention on trading days with air pollution. Ding et al. (2022) find that investor attention to climate change has significant causal effects on the spillovers among carbon, fossil energy, and clean energy markets. Moreover, the effect of investor attention on green assets becomes more significant. Pham and Huynh (2020) and Pham and Cepni (2022) find that investor attention to the green bond significantly impacts the green bond’s return and volatility, and the relationship becomes more significant. Chen et al. (2022) report that climate attention is becoming more important for state-owned and high-carbon-emission firms. All the above empirical results indicate that investor attention has a significant role in the return on the stock market and green assets, but less attention is given to the linkages between investor attention on CO2 emissions and the stock market in China.
In general, the literature on the heterogeneous response of stock returns to CO2 emissions in different years is relatively scarce in China. The challenge of a decreasing benchmark of corporate carbon emissions in 2021, rapidly rising investor attention to CO2 emissions in China and the soaring price of EUA suggests that the response of stock returns to CO2 emissions will become more significant. How will China’s CO2 emissions affect the stock returns in different years? It has been 4 years since carbon neutrality was launched in China, and an empirical study on the heterogeneous response of stock returns to CO2 emissions in different years is needed.
3 Construction of the CO2 emissions-index
3.1 Data and calculations
The research on the effect of CO2 emissions on the stock market is mainly based on CO2 emissions and CO2 emissions allowance prices. Meanwhile, investor attention to climate risk also significantly impacts asset price fluctuations (Pham and Cepni, 2022; Ding et al., 2022), which indicates that investor attention to carbon risks cannot be neglected. In addition, investor attention to carbon emission is closely related to CO2 emissions and CO2 emissions allowance prices. Accordingly, a CO2 emissions index based on the CO2 emissions, the carbon emission allowance price, and investor attention to CO2 emissions is considered.
The sample period covers from 1 January 2019 to 31 December 2021 with 1,096 observations. The CO2 emissions in China are obtained from: https://www.carbonmonitor.org.cn/. The price of the CO2 emissions allowance consists of the price of EUAs and carbon emission allowances in the Hubei carbon market (HBEAs). For that, the efficiency in China’s carbon market is limited, and EUA pricing efficiency performance is better (Fang and Cao, 2021; Wen et al., 2022). The data are obtained from the Wind database. In addition, investor attention to CO2 emissions is obtained from the Baidu search index based on web crawler technology, and the search keywords include “CO2 emissions” and “low carbon policy.”
Each CO2 emissions variable includes a carbon emissions component and other idiosyncratic components. One issue in forming an index is determining the effective information of the variable. Variables that exhibit strong relationships may reflect a given shift in carbon emissions better than others. Hence, the study uses principal component analysis to construct the CO2 emissions index based on the above four variables, where each index component has first calculated the log return. According to the empirical results, the first principal component explains 54.547% of the sample variance; it indicates that it captures much of the standard variation and reflects most carbon emission information. The coefficients of each variable are as follows:
Here, CI is the carbon emission index,
3.2 Effectiveness of the CO2 emissions-index in describing the trend
Next, we will examine whether the CO2 emissions index effectively describes the fluctuation trend of carbon emissions. The analysis is based on the China Low Carbon Index price and the actual conditions of carbon emissions. The China Low Carbon Index is highly correlated with CO2 emissions (Zhu et al., 2022). This index is proposed by the Beijing Environment Exchange and clean technology investment fund Vantage Point Partner. It is the first low-carbon stock index and includes all the low-carbon firms in China. Let us suppose that the stock market in China is a semi-strong efficient market. If so, the China Low Carbon Index price reflects the information on CO2 emissions. Figure 1 shows the tendency of the China Low Carbon Index and the CO2 emissions index.
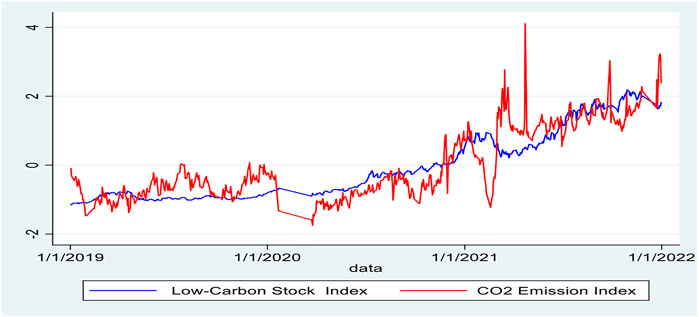
FIGURE 1. The fluctuation trend of the CO2 emissions index and the Low Carbon Index. Note: The blue line shows the Low Carbon Index, and the red one shows the CO2 emissions index.
It is easy to find that the CO2 emissions index is low and stable in 2019 and 2020 and increases sharply in 2021. The China Low Carbon Index variation shows similar fluctuation trends. Since 2021, it has grown rapidly, and before that, it remains stable. This indicates that the China Low Carbon Index variation accurately reflects the fluctuations in CO2 emissions, and the CO2 emissions index effectively shows the trend of carbon emissions.
The CO2 emissions index trend also reflects actual conditions of carbon emissions. The CO2 emissions, the CO2 emissions allowance prices, and investor attention to CO2 emissions in China maintain slow growth in 2019 and 2020 and peak in 2021. Moreover, a challenging benchmark for energy firms cutting CO2 emissions begins in 2021, and the benchmark target is significantly lower than in 2020 and 2019. It indicates that CO2 emissions will become more valuable to the enterprise in 2021 than 2019 and 2020. Both indicate that the CO2 emissions index effectively and accurately describes the carbon emissions trend.
4 Empirical results
4.1 Quantile regression model
Quantile regression (QR) was introduced by Koenker and Bassett (1978) and developed by Koenker and Hallock (2001). QR does not require an economic variables sequence to conform to a normal distribution. QR determines the model for the selected quantiles in the conditional distribution of the dependent variable (Carreras and Coenders, 2020; Palma et al., 2020; Sirin and Yilmaz, 2020; Xu and Lin, 2020). In this study, seven quantiles are selected
where α is the quantile point,
4.2 Descriptive statistics
Table 1 reports descriptive statistics for 154 low-carbon stocks in China from 1 January 2019 to 31 December 2021. The skewness and kurtosis of all variables are presented to explain using the QR approach. The kurtosis coefficient of the return is greater than 3, and the skewness is negative for the dependent variable stock returns, indicating that the stock returns’ unconditional distribution is asymmetric.
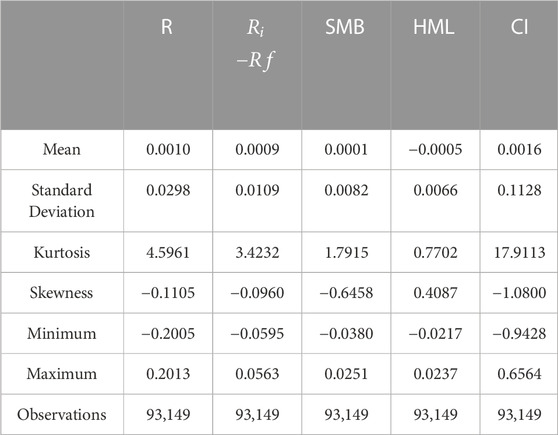
TABLE 1. Descriptive statistics.
4.2 Heterogeneous response of stock returns to the CO2 emissions index based on low-carbon stocks
The CO2 emissions index maintains slow growth in 2019 and 2020 and increases significantly in 2021. This means that with the increase in the CO2 emissions index, the effect of the CO2 emissions on stock returns is also more significant. Meanwhile, the empirical research indicates that the influence of CO2 emissions on stock returns changes at the different phases of volatility in the EUA market (Zhu et al., 2018; Daskalakis et al., 2009; Ren., 2022). Therefore, we will investigate the response of the low-carbon stocks return to carbon emissions. Figures 2–4 show Eq. 1 slope coefficients for the different CO2 emissions index–low-carbon stock return pairs in 2019, 2020, and 2021. Table 2 shows more details about them.
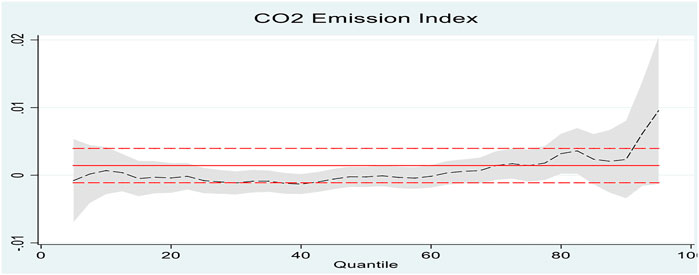
FIGURE 2. Quantile regression results for the CO2 emissions index–low-carbon stock prices in 2019. Note: The solid red line represents the OLS coefficient; the two red dashed lines depict the conventional 95% confidence intervals for the OLS coefficient. The shaded gray area plots a 95% pointwise confidence band for the quantile regression estimates.
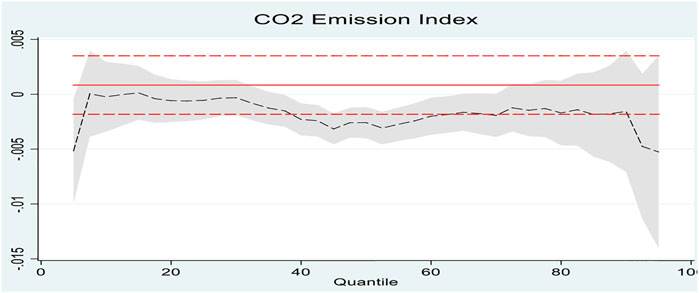
FIGURE 3. Quantile regression results for the CO2 emissions index–low-carbon stock prices in 2020. Note: The solid red line represents the OLS coefficient; the two red dashed lines depict the conventional 95% confidence intervals for the OLS coefficient. The shaded gray area plots a 95% pointwise confidence band for the quantile regression estimates.
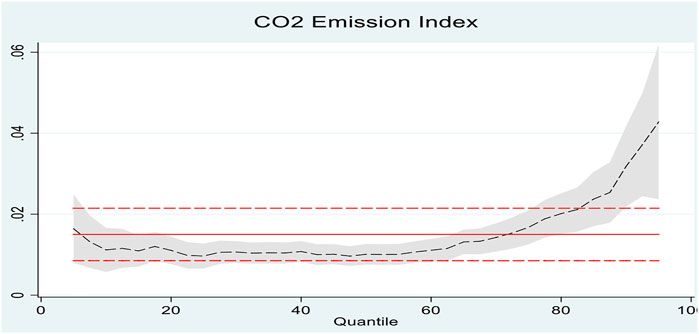
FIGURE 4. Quantile regression results for the CO2 emissions index–low-carbon stock returns in 2021. Note: The solid red line represents the OLS coefficient; the two red dashed lines depict the conventional 95% confidence intervals for the OLS coefficient. The shaded gray area plots a 95% pointwise confidence band for the quantile regression estimates.
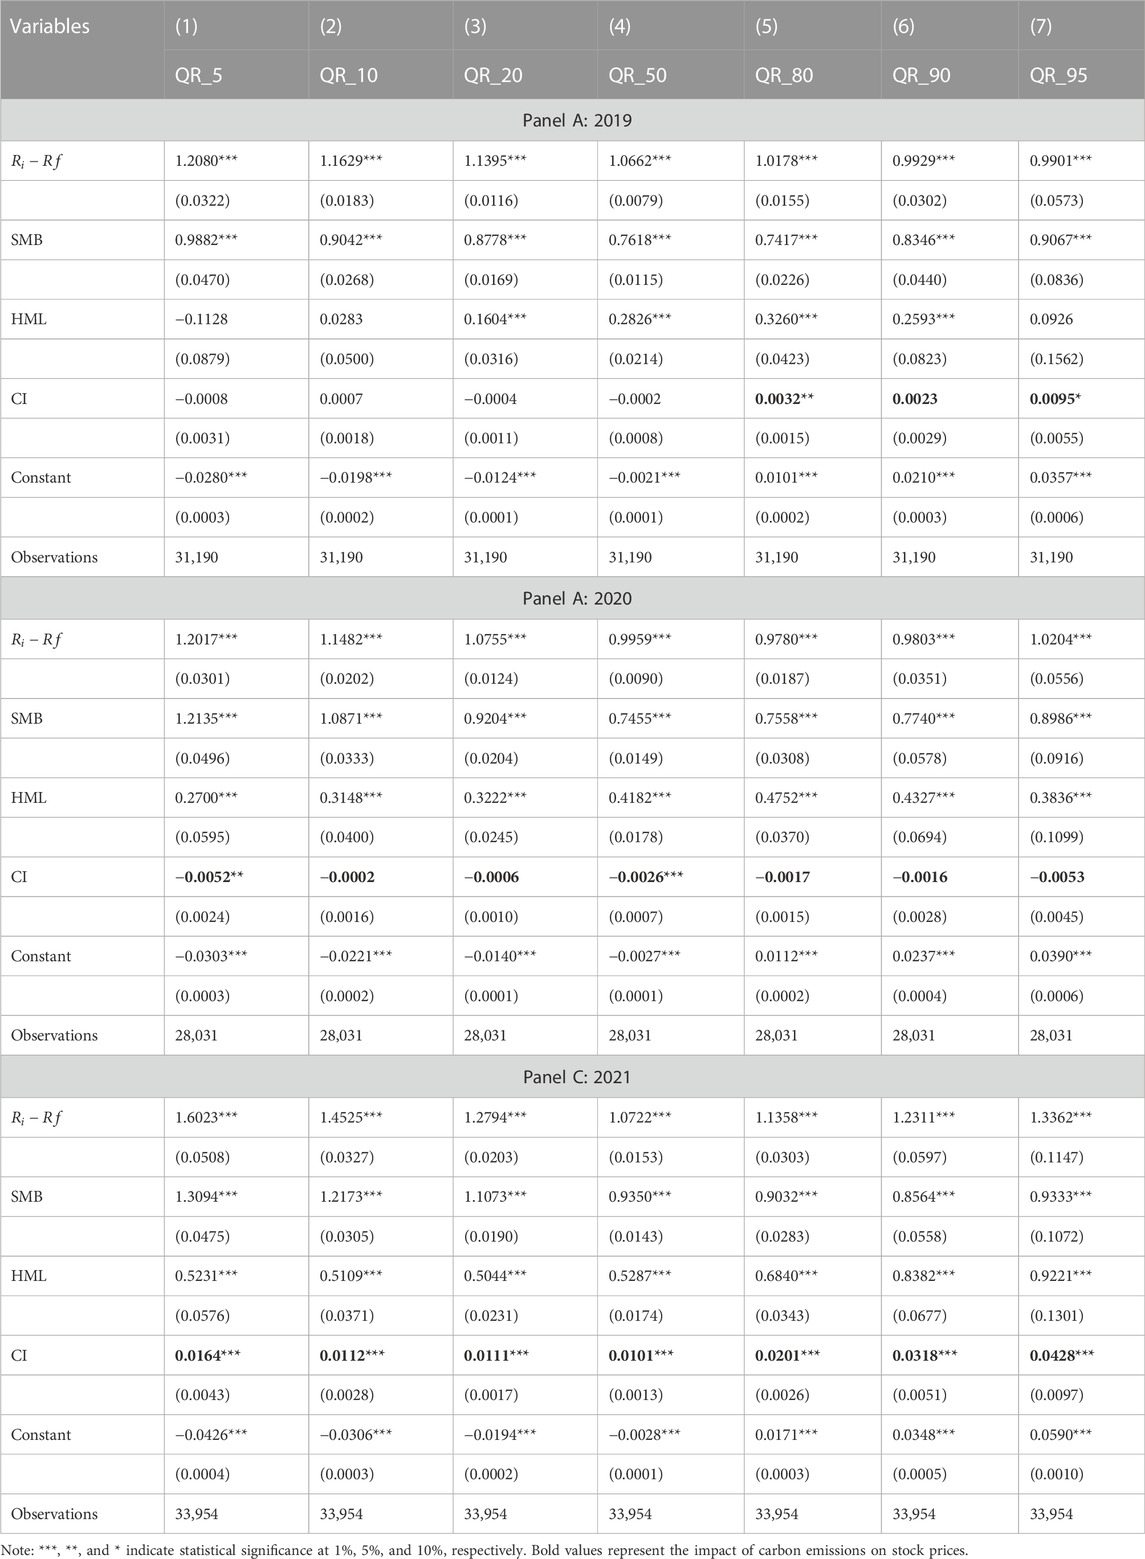
TABLE 2. Effect of the CO2 emissions index on the return of low-carbon stocks.
It is easy to find that a heterogeneous response of low-carbon stock returns to the CO2 emissions index exists in different years. Figures 2, 3, and panels A and B of Table 2 show that the impact of the CO2 emissions index on the low-carbon stock returns is insignificant in 2019 and 2020. In comparison, Figure 4 and panel C of Table 2 show that the effect of the CO2 emissions index on the low-carbon stock returns is positive and significant in 2021. Meanwhile, the effect of the CO2 emissions index on the low-carbon stock returns is more significant at the upper and lower quantiles than at the median quantiles. Moreover, the influence is more significant at the high percentiles than at the lower percentiles. The coefficient of CI is 0.015 at the 5% quantile, and it increased to 0.0428 at the 95% quantile.
4.3 Heterogeneous response of stock returns to the CO2 emissions based on dummy variable
A dummy variable
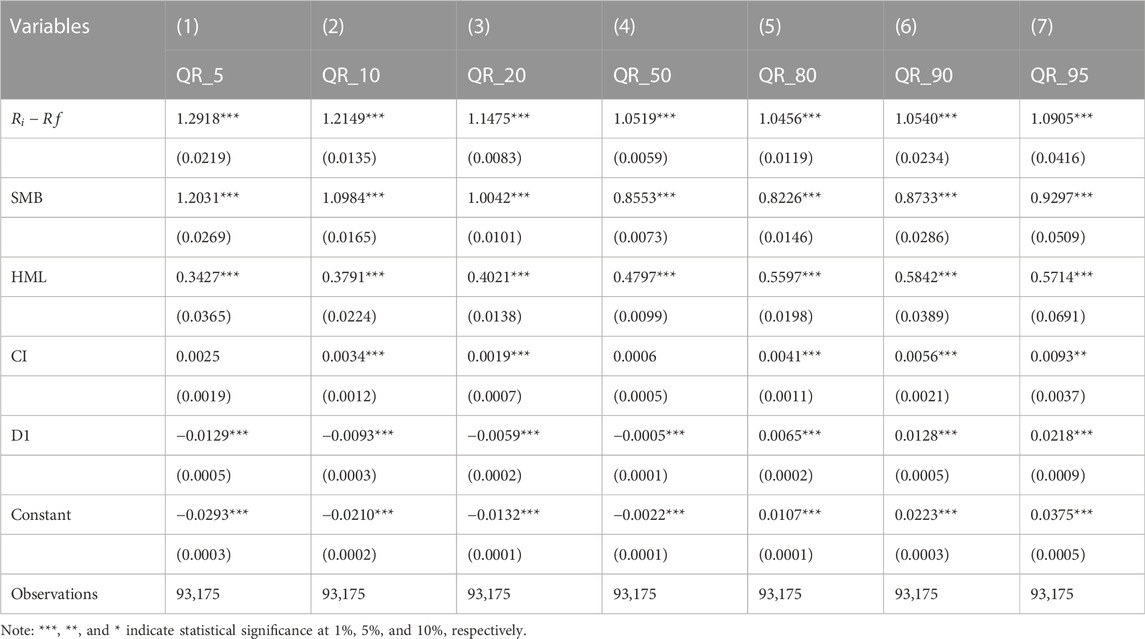
TABLE 3. Impact of the year 2021 on the return of low-carbon stocks.
We find that the coefficient of
4.5 Heterogeneous response of stock returns to the CO2 emissions index based on energy stocks
The energy industry is the largest source of carbon emissions in China, and the energy sector return is highly correlated with CO2 emissions in China (Dutta et al., 2018; Wen et al., 2020; Kangyin Dong et al., 2021; Chen et al., 2022). Next, we will investigate the heterogeneous response of the CO2 emissions index on energy stocks return in different years. The energy stock return is the log return obtained from the CSMAR database. Figures 5–7 and Table 4 show the results.
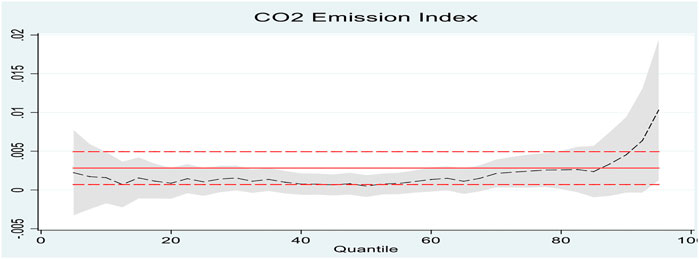
FIGURE 5. Quantile regression results for CO2 emissions index–energy stock return in 2019. Note: The solid red line represents the OLS coefficient; the two red dashed lines depict the conventional 95% confidence intervals for the OLS coefficient. The shaded gray area plots a 95% pointwise confidence band for the quantile regression estimates.
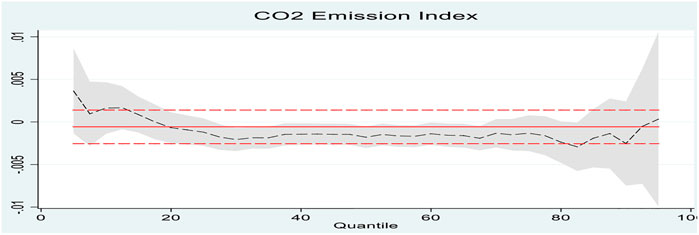
FIGURE 6. Quantile regression results for the CO2 emissions index–energy stock returns in 2020. Note: The solid red line represents the OLS coefficient; the two red dashed lines depict the conventional 95% confidence intervals for the OLS coefficient. The shaded gray area plots a 95% pointwise confidence band for the quantile regression estimates.
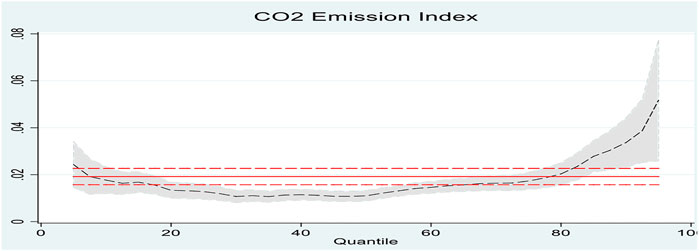
FIGURE 7. Quantile regression results for the CO2 emissions index–energy stock returns in 2021. Note: The solid red line represents the OLS coefficient; the two red dashed lines depict the conventional 95% confidence intervals for the OLS coefficient. The shaded gray area plots a 95% pointwise confidence band for the quantile regression estimates.
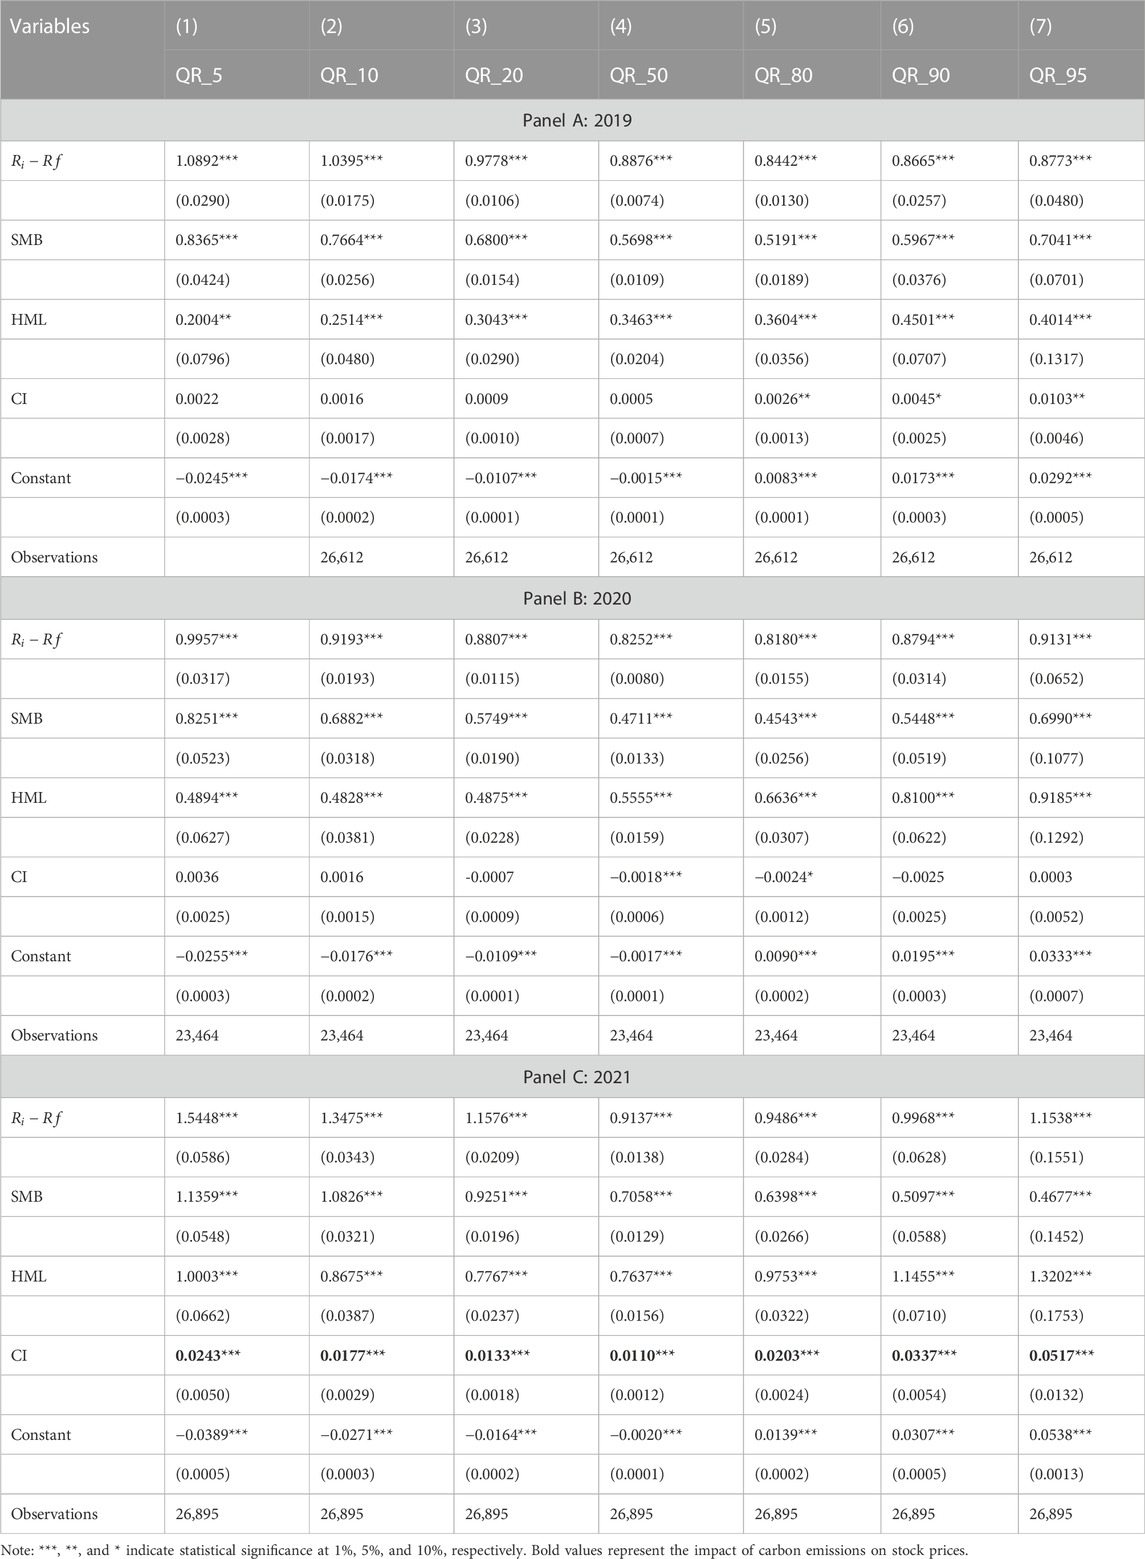
TABLE 4. Effect of the CO2 emissions index on the return of the energy stocks.
The empirical results demonstrate that the effect of the CO2 emissions index on energy stock returns is heterogeneous. Figure 5 and Panel A of Table 4 show that the influence was significant and positive at the high quantiles in 2019. Figure 6 and Panel B of Table 4 show that the result was insignificant in 2020. Figure 7 and Panel C of Table 4 demonstrate that the results were significant and positive in 2021. Meanwhile, the impact of the CO2 emissions index on the energy stock returns is more significant in the upper and lower quantiles than in the median quantiles. Moreover, its impact is more significant in the high quantiles than in the low quantiles, similar to the results of 4.3. Therefore, we can infer that the heterogeneous response of low-carbon stock returns to the CO2 emissions index exists in different years and quantiles.
4.6 Heterogeneous response of stock returns to CO2 emissions and the price of CEA
The construction of the CO2 emissions index is based on CO2 emissions and the price of CEA. Most empirical research uses these data to investigate the effect of CO2 emissions on stock returns. Next, we will retest the heterogeneous response of stock returns to the CO2 emissions based on CO2 emissions and CEA price. Tables 5–8 report the results.
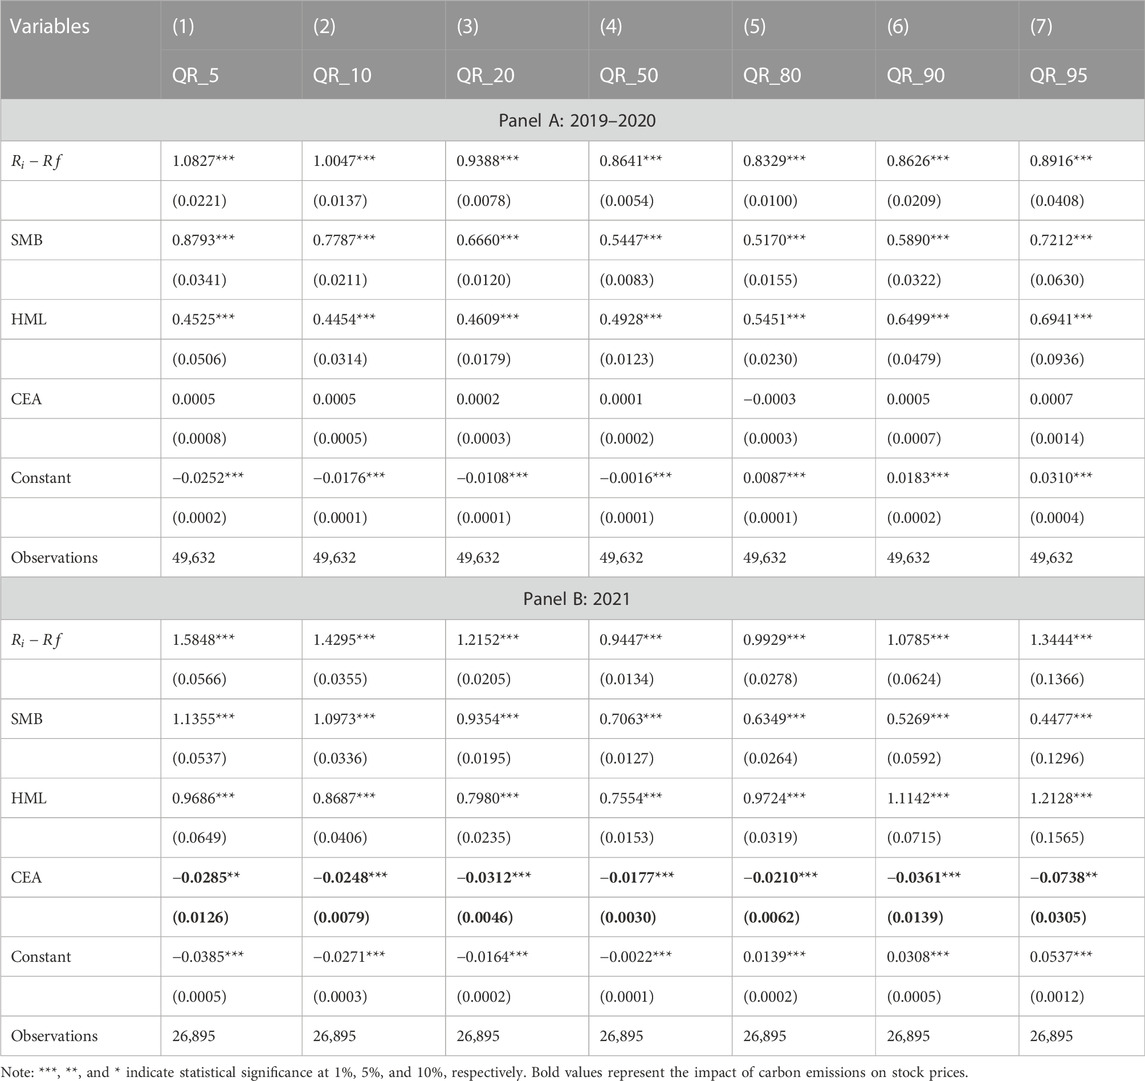
TABLE 5. Effect of CEA price on the energy stock return.
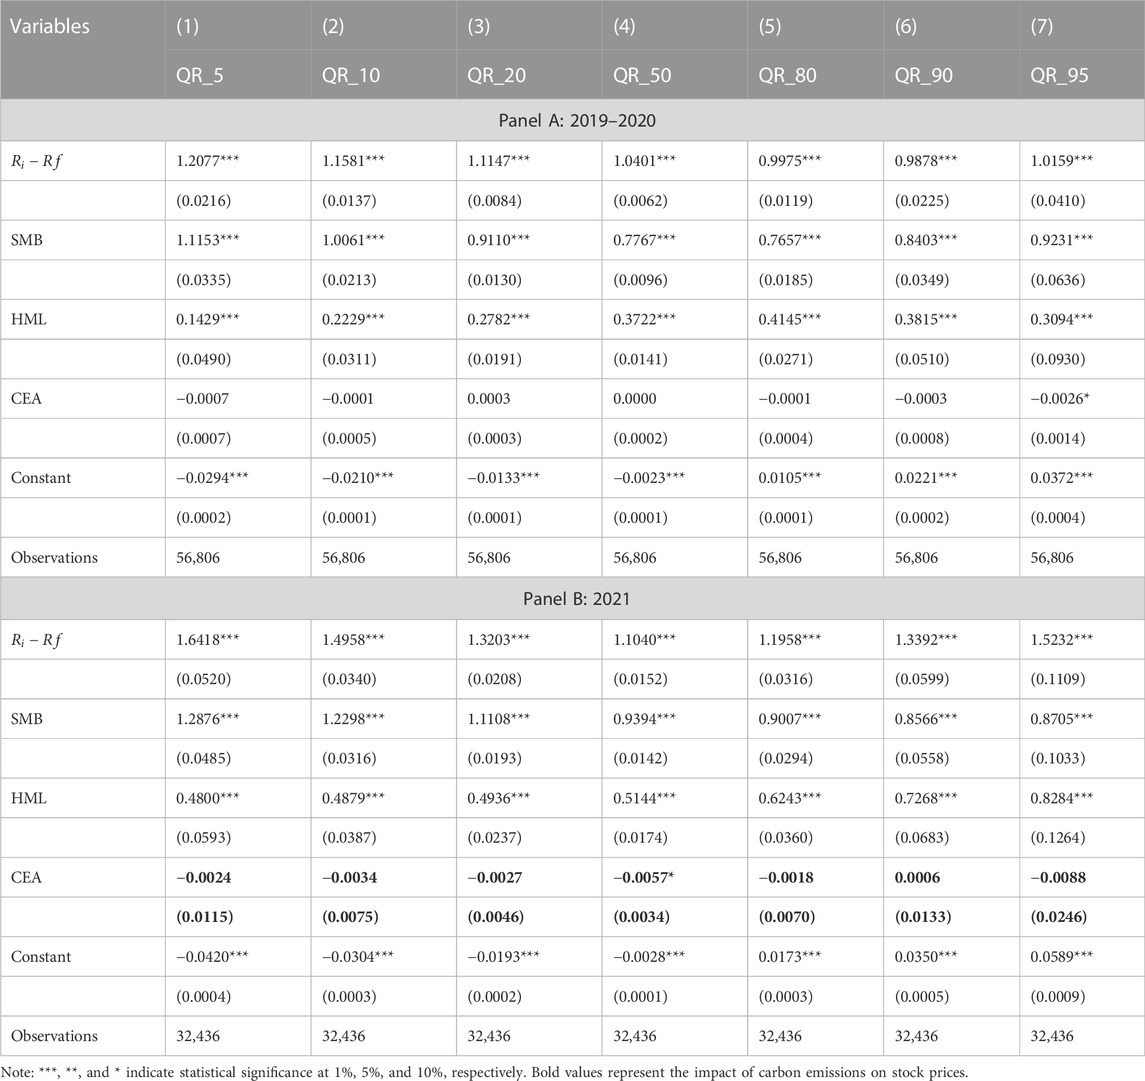
TABLE 6. Effect of CEA price on low-carbon stocks return.
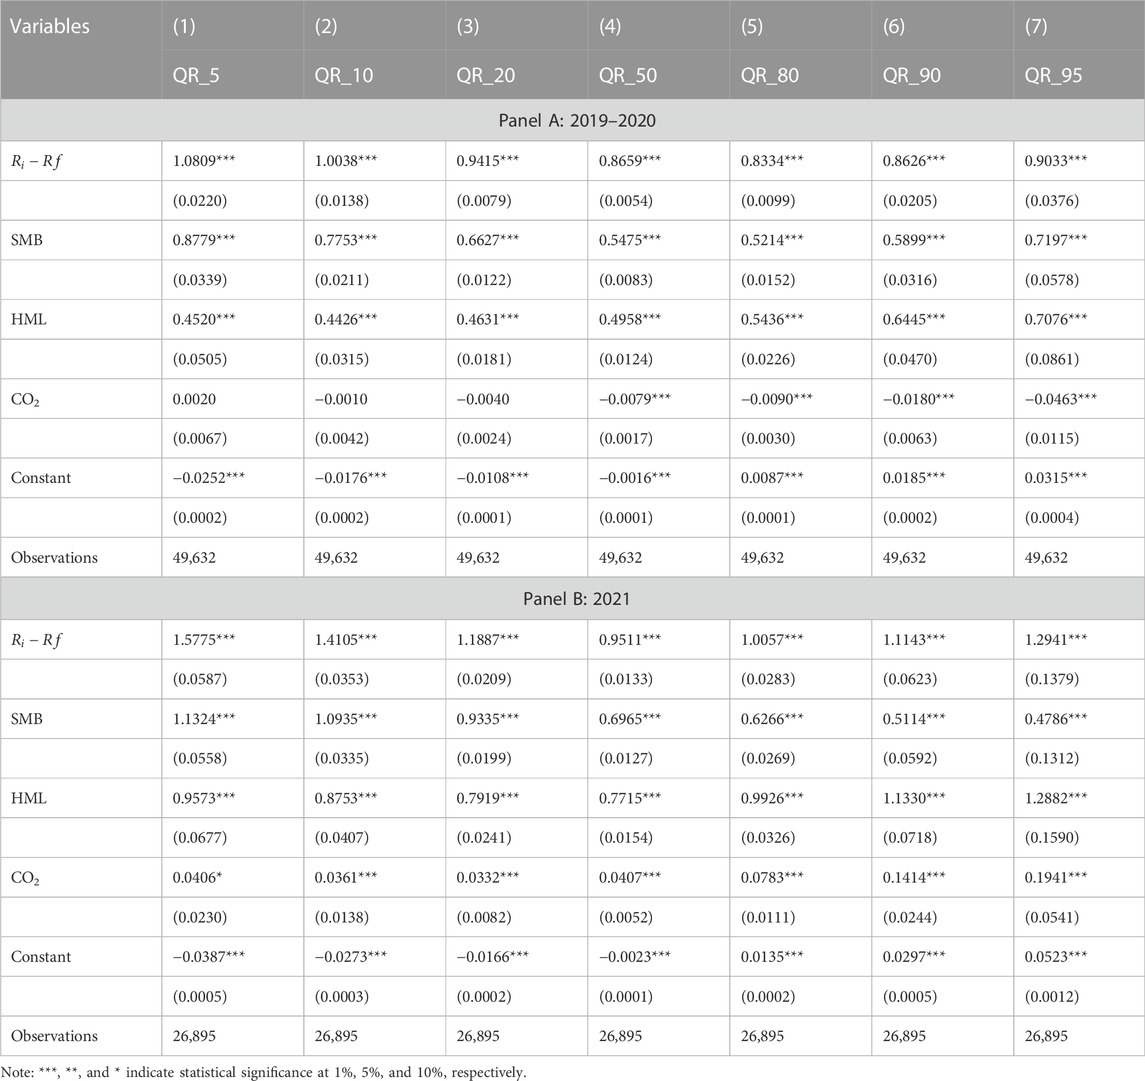
TABLE 7. Effect of the CO2 emissions index on the energy stock return.
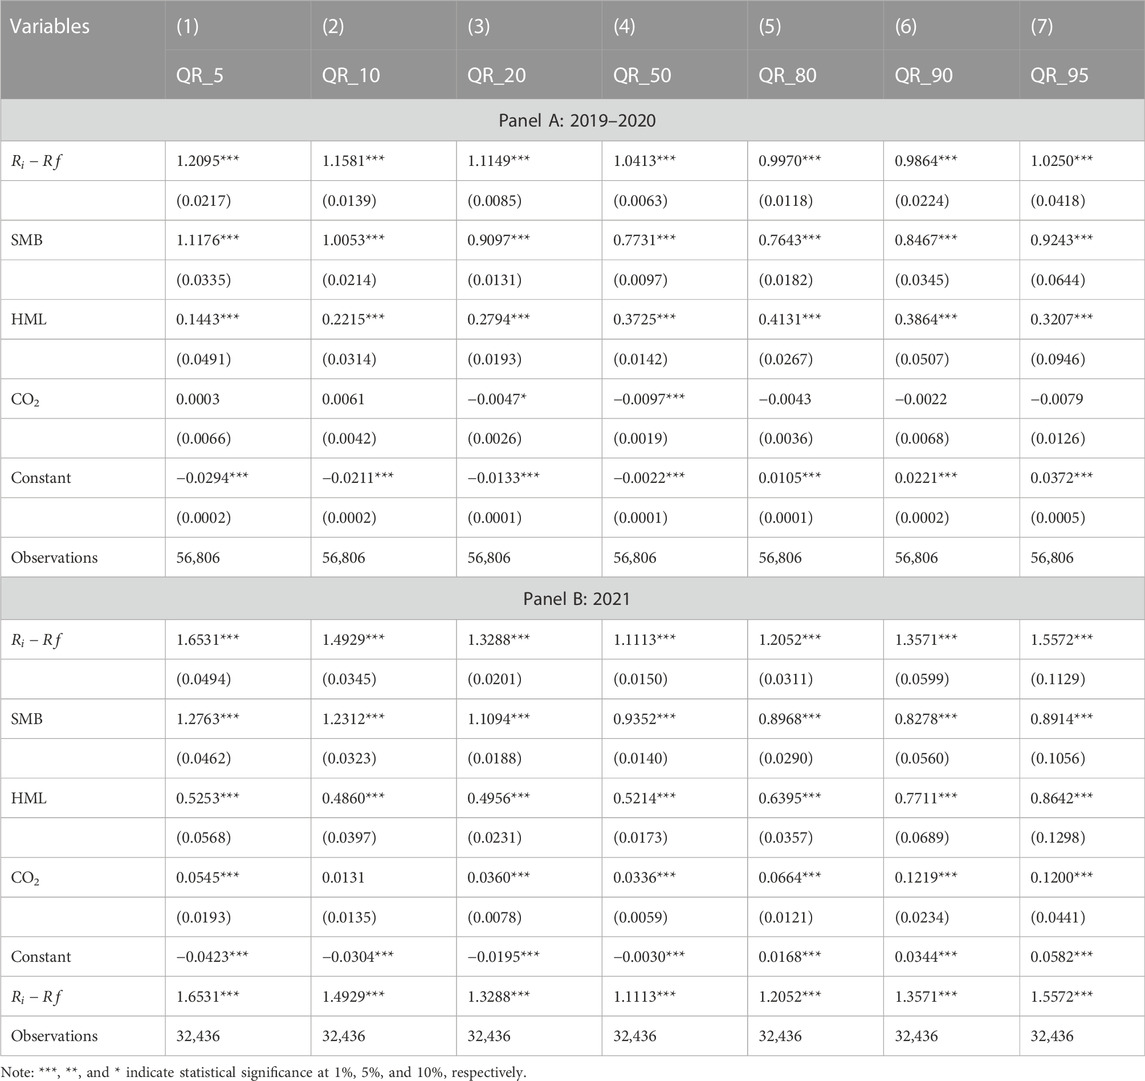
TABLE 8. Effect of the CO2 emissions index on the low-carbon stocks return.
All empirical results support that the response of stock returns to CO2 emissions is heterogeneous. Table 5 reports that the effect of the CEA price on the return of the energy stocks is heterogeneous. On the one hand, it was negative and significant in 2021 but not in 2019, 2020. The influence is more significant at high and low quantiles than in the median quantiles, and its impact is more significant at the high quantiles than at the low quantiles. However, Table 6 shows that the effect of CEA price on the return of the low-carbon stocks is insignificant in different years and at different quantiles. Tables 7, 8 demonstrate that the effect of CO2 emissions on the return of the energy stocks and low-carbon stocks is heterogeneous. Its influence is positive and significant in 2021, while not in 2019 and 2020. In addition, the impact at high and low quantiles is also more significant than at the median quantiles.
5 Conclusion
This paper constructs a CO2 emissions index and uses a QR approach to investigate the heterogeneous response of the stock returns to CO2 emissions based on daily data from 2019 to 2021. Our results suggest that heterogeneous effects do exist. The CO2 emissions index maintains low growth in 2019 and 2020 and surges in 2021. Meanwhile, the effect of CO2 emission on stock returns is significant and positive in 2021, while it is insignificant in 2019 and 2020. This may be related to the rapidly rising carbon emission index. In addition, the response is more significant at the lower and upper quantiles than at the median quantiles, and its influence is more remarkable in upper quantiles than in lower quantiles. This implies that the carbon risk is positively priced in 2021, especially in extreme market conditions.
Based on the above empirical results, we derive two policy implications. First, the effect of CO2 emissions on stock returns is significant in 2021 while insignificant in 2019 and 2020, and the low-carbon and energy stocks have similar results. Thus, all firms should be committed to cutting carbon emissions against the carbon risk. Meanwhile, the government and investors should pay more attention to CO2 emissions in the future. The carbon emissions allowance becomes an especially valuable resource for power companies. Second, as market circumstances change, the effect of CO2 emissions on stock returns becomes more significant at the upper and lower quantiles. Thus, investors must adopt different investment strategies depending on the market circumstances.
Data availability statement
The original contributions presented in the study are included in the article/Supplementary Material; further inquiries can be directed to the corresponding author.
Author contributions
MW: analysis of the data, TL: writing part of the paper, WL: writing and revising the paper.
Funding
This paper was supported by the Hunan Applied Characteristic Discipline and Foundation of Hu‘nan Educational Committee, 22B0846, 20C1039.
Conflict of interest
The authors declare that the research was conducted in the absence of any commercial or financial relationships that could be construed as a potential conflict of interest.
Publisher’s note
All claims expressed in this article are solely those of the authors and do not necessarily represent those of their affiliated organizations or those of the publisher, the editors, and the reviewers. Any product that may be evaluated in this article, or claim that may be made by its manufacturer, is not guaranteed or endorsed by the publisher.
Supplementary material
The Supplementary Material for this article can be found online at: https://www.frontiersin.org/articles/10.3389/fenrg.2022.1074262/full#supplementary-material
References
Alkathery, M. A., and Chaudhuri, K. (2021). Co-movement between oil price, CO2 emission, renewable energy and energy equities: Evidence from GCC countries. J. Environ. Manag. 297, 113350. doi:10.1016/j.jenvman.2021.113350
Ben-Rephael, A., Da, Z., and Israelsen, R. D. (2017). It depends on where you search: Institutional and underreaction to news. Rev. Financial Stud. 30 (9), 3009–3047.
Benz, E., and Trück, S. (2009). Modeling the price dynamics of CO2 emission allowances. Energy Econ. 31 (1), 4–15.
Bolton, P., and Kacperczyk, M. (2021). Do investors care about carbon risk? J. Financial Econ. 142 (2), 517–549.
Carreras Simó, M., and Coenders, G. (20212021). The relationship between asset and capital structure: A compositional approach with panel vector autoregressive models. Quantitative Finance Econ. 5 (4), 571–590., núm.
Chen, X., Chen, X., Xu, L., and Wen, F. (2022a). Attention to climate change and downside risk: Evidence from China. Risk Anal. doi:10.1111/risa.13975
Chen, Y. F., Wang, C. W., Miao, J. F., and Zhou, T. J. (2022b). Identifying risk transmission in carbon market with energy, commodity and financial markets: Evidence from time-frequency and extreme risk spillovers. Front. Energy Res., 12.
Da Silva, P. P., Moreno, B., and Figueiredo, N. C. (2016). Firm-specific impacts of CO2 prices on the stock market value of the Spanish power industry. Energy Policy 94, 492–501.
Daskalakis, G., Psychoyios, D., and Markellos, R. N. (2009). Modeling CO2 emission allowance prices and derivatives: Evidence from the European trading scheme. J. Bank. Finance 33 (7), 1230–1241.
Ding, Q., Huang, J., and Zhang, H. (2022). Time-frequency spillovers among carbon, fossil energy, and clean energy markets: The effects of attention to climate change. Int. Rev. Financial Analysis, 102222. doi:10.1016/j.irfa.2022.102222
Dong, Kangyin, Ren, Xiaohang, and Zhao, Jun (2021). How does low-carbon energy transition alleviate energy poverty in China? A nonparametric panel causality analysis. Energy Econ. 103, 105620. doi:10.1016/j.eneco.2021.105620
Dutta, A., Bouri, E., and Noor, M. H. (2018). Return and volatility linkages between CO2 emission and clean energy stock prices. Energy 164, 803–810.
Fang, S., and Cao, G. (2021). Modeling extreme risks for carbon emission allowances—evidence from European and Chinese carbon markets. J. Clean. Prod. 316, 128023. doi:10.1016/j.jclepro.2021.128023
Fang, X., Jiang, Y., and Qian, Z. (2014). The effects of individual investors' attention on stock returns: Evidence from the ChiNext market. Emerg. Mark. Finance Trade 50 (sup3), 158–168.
Feindt, S., Kornek, U., Labeaga, J. M., Sterner, T., and Ward, H. (2021). Understanding regressivity: Challenges and opportunities of European carbon pricing. Energy Econ. 103, 105550. doi:10.1016/j.eneco.2021.105550
Forbes, K. F., and Zampelli, E. M. (2019). Wind energy, the price of carbon allowances, and CO2 emissions: Evidence from Ireland. Energy Policy 133, 110871. doi:10.1016/j.enpol.2019.07.007
Guastella, G., Mazzarano, M., Pareglio, S., and Xepapadeas, A. (2022). Climate reputation risk and abnormal returns in the stock markets: A focus on large emitters. Int. Rev. Financial Analysis 84, 102365. doi:10.1016/j.irfa.2022.102365
Li, M., Gao, H., Abdulla, A., Shan, R., and Gao, S. (2022). Combined effects of carbon pricing and power market reform on CO2 emissions reduction in China's electricity sector. Energy 257, 124739. doi:10.1016/j.energy.2022.124739
Liu, F., Kang, Y., Guo, K., and Sun, X. (2021). The relationship between air pollution, investor attention, and stock prices: Evidence from new Energy and polluting sectors. Energy Policy 156, 112430. doi:10.1016/j.enpol.2021.112430
Oestreich, A. M., and Tsiakas, I. (2015). Carbon emissions and stock returns: Evidence from the EU emissions trading scheme. J. Bank. Finance 58, 294–308.
Palma, M., Tavakoli, S., Brettschneider, J., and Nichols, T. E., and Alzheimer's Disease Neuroimaging Initiative (2020). Quantifying uncertainty in brain-predicted age using scalar-on-image quantile regression. Neuroimage 219, 116938. doi:10.1016/j.neuroimage.2020.116938
Pan, C., Sun, T., Mirza, N., and Huang, Y. (2022). The pricing of low emission transitions: Evidence from stock returns of natural resource firms in the GCC. Resour. Policy 79, 102986. doi:10.1016/j.resourpol.2022.102986
Pham, L., and Cepni, O. (2022). Extreme directional spillovers between investor attention and green bond markets. Int. Rev. Econ. Finance 80, 186–210.
Pham, L., and Huynh, T. L. D. (2020). How does investor attention influence the green bond market? Finance Res. Lett. 35, 101533. doi:10.1016/j.frl.2020.101533
Ren, Xiaohang, Li, Yiying, Qi, Yinshu, and Duan, Kun (2022b). Asymmetric effects of decomposed oil-price shocks on the EU carbon market dynamics. Energy 254 (B), 2022. doi:10.1016/j.energy.2022.124172
Ren, X., Zhang, X., Yan, C., and Gozgor, G. (2022a). Climate policy uncertainty and firm-level total factor productivity: Evidence from China. Energy Econ. 113, 106209. doi:10.1016/j.eneco.2022.106209
Rohleder, M., Wilkens, M., and Zink, J. (2022). The effects of mutual fund decarbonization on stock prices and carbon emissions. J. Bank. Finance 134, 106352.
Shear, F., Ashraf, B. N., and Sadaqat, M. (2020). Are investors' attention and uncertainty aversion the risk factors for stock markets? International evidence from the COVID-19 crisis. Risks 9 (1), 2. doi:10.3390/risks9010002
Sirin, S. M., and Yilmaz, B. N. (2020). Variable renewable energy technologies in the Turkish electricity market: Quantile regression analysis of the merit-order effect. Energy Policy 144, 111660. doi:10.1016/j.enpol.2020.111660
Tian, Y., Akimov, A., Roca, E., and Wong, V. (2016). Does the carbon market help or hurt the stock price of electricity companies? Further evidence from the European context. J. Clean. Prod. 112, 1619–1626.
Wen, F., Shui, A., Cheng, Y., and Gong, X. (2022a). Monetary policy uncertainty and stock returns in G7 and brics countries: A quantile-on-quantile approach. Int. Rev. Econ. Finance 78, 457–482.
Wen, F., Wu, N., and Gong, X. (2020a). China's carbon emissions trading and stock returns. Energy Econ. 86, 104627. doi:10.1016/j.eneco.2019.104627
Wen, F., Zhao, H., Zhao, L., and Yin, H. (2022b). What drive carbon price dynamics in China? Int. Rev. Financial Analysis 79, 101999. doi:10.1016/j.irfa.2021.101999
Wen, F., Zhao, L., He, S., and Yang, G. (2020b). Asymmetric relationship between carbon emission trading market and stock market: Evidences from China. Energy Econ. 91, 104850.
Xu, B., and Lin, B. (2020). Investigating drivers of CO2 emission in China's heavy industry: A quantile regression analysis. Energy 206, 118159. doi:10.1016/j.energy.2020.118159
Xu, L., Wu, C., Qin, Q., and Lin, X. (2022106071). Spillover effects and nonlinear correlations between carbon emissions and stock markets: An empirical analysis of China's carbon-intensive industries. Energy Econ. doi:10.1016/j.eneco.2022.106071
Zhang, N., and Choi, Y. (2013). A comparative study of dynamic changes in CO2 emission performance of fossil fuel power plants in China and Korea. Energy Policy 62, 324–332.
Zhang, W., Li, J., Li, G., and Guo, S. (2020). Emission reduction effect and carbon market efficiency of carbon emissions trading policy in China. Energy 196, 117117. doi:10.1016/j.energy.2020.117117
Zhao, L., Liu, W., Zhou, M., and Wen, F. (2022). Extreme event shocks and dynamic volatility interactions: The stock, commodity, and carbon markets in China. Finance Res. Lett. 47, 102645.
Zhu, H., Tang, Y., Peng, C., and Yu, K. (2018). The heterogeneous response of the stock market to emission allowance price: Evidence from quantile regression. Carbon Manag. 9 (3), 277–289.
Keywords: CO2 emissions, quantile regression approach, stocks returns, the carbon emissions trading scheme, heterogenous response
Citation: Li W, Liu T and Wei M (2023) Heterogeneous response of the stock market to CO2 emissions in China. Front. Energy Res. 10:1074262. doi: 10.3389/fenrg.2022.1074262
Received: 19 October 2022; Accepted: 30 November 2022;
Published: 24 January 2023.
Edited by:
Xiaohang Ren, Central South University, ChinaReviewed by:
Yan Zheng, Central South University, ChinaFeng Min, Zhejiang University of Finance and Economics, China
Copyright © 2023 Li, Liu and Wei. This is an open-access article distributed under the terms of the Creative Commons Attribution License (CC BY). The use, distribution or reproduction in other forums is permitted, provided the original author(s) and the copyright owner(s) are credited and that the original publication in this journal is cited, in accordance with accepted academic practice. No use, distribution or reproduction is permitted which does not comply with these terms.
*Correspondence: Wenhui Li, 271039891@qq.com