Cold plate performance enhancement based on parametric modeling of multiple structures
 Kai Zhao1,2
  Xiaoxia Sun
- 1China North Vehicle Research Institute Department of Propulsion Systems Technology, Beijing, China
- 2State Key Laboratory of Intelligent Control and Decision Making for Complex Systems, Beijing Institute of Technology, Beijing, China
Power electronic equipment to miniaturization, high integration direction while facing the problem of high heat flow density and uneven temperature distribution. The large temperature fluctuations and uneven temperature distribution in the operation of power electronic equipment will lead to thermal stress, and excessive thermal stress or uneven distribution will cause fatigue failure of the packaging material, resulting in reduced reliability, module failure, and reduced life of power electronic equipment. In this paper, we propose two kinds of liquid-cooled flow channel non-linear reinforced heat transfer homogeneous liquid-cooled plate, which is theoretically derived to achieve the design requirement of uniform temperature on the heating side wall surface. The thermal design of the cold plate is carried out using ANSYS Workbench, and the indicators of various structures of the cold plate are analyzed and compared in terms of their ability to dissipate heat and maintain temperature uniformity. Based on the original runner structure, the heat dissipation performance of the rod structure and fin structure was evaluated, and the form of the internal heat dissipation structure of the runner was determined. The results show that the integrated liquid cooling plate temperature uniformity and flow resistance of both factors, the fin column heat sink is significantly better than the cylindrical fin column heat sink in the case of the same thermal resistance, the fin column heat sink flow resistance is significantly lower than the cylindrical fin column heat sink.
1 Introduction
With the development of the manufacturing industry (Sun et al., 2020), electronic chip industry (June and Sikka, 2002) and aerospace field (Zhu et al., 2016), the heat dissipation capability (Wei et al., 2013) of various heat dissipation technologies is becoming more and more demanding. At the meantime, thermal failures of electronic devices pose serious problems. For example, the current power of electronic modules can reach 200 W cm-2, resulting in a rapid rise in temperature within a few milliseconds. When operating at 55°C, a lithium-ion battery (Sony 18,650) will lose 70% of its initial capacity after 500 cycles, and for every 13°C increase in temperature, the life span is cut in half (Bo et al., 2019). Currently, the common cooling technology mainly includes air cooling (Shen et al., 2017) (natural cooling and forced air cooling), liquid cooling (Vuckovic and Depret, 2016) and heat pipe cooling (Shu et al., 2017). Compared with air-cooled cooling, liquid-cooled cooling has higher cooling efficiency (Suginishi et al., 2017). Compared with the heat pipe and other gas-liquid phase change circulation system (Suginishi et al., 2017), the liquid cooling circulation system is more stable (He et al., 2019). Therefore, liquid cooling plate heat sinks are widely used in high heat flow density cooling systems, where the shape of the heat sink is an important factor in determining the performance of the liquid cooling plate (Saeid et al., 2018). The heat generated per unit surface area of electronic components has increased dramatically, which makes the thermal design of components a serious challenge. Excessive temperatures seriously jeopardize the performance of electronic equipment systems (Bahiraei and Heshmatian, 2018). How to efficiently and reasonably control the temperature rise of components within a limited space is currently the most important aspect of the entire system design of electronic devices. Traditional thermal runner design is usually based on empirical size optimization design (Chen et al., 2013). With the rapid development of computer computing power in recent years, fluid optimization techniques with high design freedom and flexibility have gradually become the main design segment in the field of fluid heat transfer and dissipation.
A cold plate is a single-fluid heat exchanger that can quickly carry away the heat generated by components and has high operational reliability and stability. Therefore, in the thermal design of medium and high power electronic devices, a large number of researchers use cold plate as a stable and efficient heat transfer medium for heat dissipation technology research. Karng et al., (2007). Used cold plates to dissipate heat for robotic chips and showed that most polycarbonate cold plates showed considerable thermal performance and were lighter in weight compared to conventional copper cold plates. (Qian et al., (2016) used microchannels for thermal management of lithium-ion battery packs with significantly improved temperature uniformity. Chen et al., (2022) performed a multi-objective optimized design of Cell-to-Chassis battery module based on a bi-directional liquid heating system to make the power cell suitable for fast charging and cold environment applications, with effective enhancement of both thermal management efficiency and volumetric energy density.
Thermal simulation technology is a key technology in the design of thermal structures of electronic devices (Zheng et al., 2022). Thermal simulation of electronic devices is the use of mathematical means for product analysis, enabling researchers to identify thermal defects in products at the design stage and thus improve their design until they obtain efficient and appropriate methods to control the temperature rise of components to ensure the proper operation of electronic devices in their operating environment.
Recently, increasing the structure design inside the cold plate to improve the heat dissipation ability of the heating surface has been tried by researchers Vilarrubí et al., (2018) to improve the temperature uniformity of the cooling device, a miniature pin-fin heat sink with variable density is proposed. Experimental and numerical results show that the bias structure with variable pin-fin density can reduce the cooling pressure drop while achieving a lower thermal resistance coefficient and reducing the temperature distribution inhomogeneity on the surface of the heat sink. Rubio-Jimenez et al. (2013) proposed a new liquid-cooled heat sink structure and obtained the best thermal performance of flat fins and the lowest pressure drop of square fins through simulation analysis. The design of variable fin density can make the temperature distribution of the heat sink more uniform. The design of variable fin density can make the temperature distribution of the heat sink more uniform. Feng et al. (2020) investigated the gradient distribution of needle fins and found that the gradient distribution of needle fins is more effective in reducing the maximum temperature difference compared to a uniform array of needle fins distribution. A range of fin diameters and porosities for the best overall performance was obtained through experiments and simulations. Soodphakdee et al. (2001) compared the heat transfer performance of plate fins and pin fins with elliptical fin heat sinks. The results show that the circular geometry has better heat transfer performance than the similar sharp-edged fins, and at lower pressure drop and pumping power. Elliptical fins have the best heat transfer performance at low pressure drop and pumping power. Wong and Ang (2017) research shows that the taper of the channels contributes to improved thermal performance. At a taper of 52, the thermal performance of a double channel radiator is 8% higher than that of a straight channel radiator, but the required extraction power increases with the increase in the contraction ratio of the channel height.
In order to improve the heat transfer performance of liquid-cooled heat sinks and reduce the maximum temperature of the heating surface, different researchers have made different designs for the structure of the heat sink, however, whether the temperature distribution of the power electronics is uniform or not has an important impact on the reliability and safety of the whole system. The uneven temperature distribution is mainly manifested as an increase in the temperature of the coolant along the flow path, which is due to the reduced heat transfer capability of the coolant in the second half of the flow path and the constant heat flow density this leads to the surface of the heat source side along the flow. The temperature of the surface on the heat source side along the flow direction is constantly increasing.
In this paper, the thermal design of the cold plate is carried out using ANSYS Workbench, and the indicators of various configurations of the cold plate are analyzed and compared to compare their ability in terms of heat dissipation and maintaining temperature uniformity. Based on the original runner structure, the heat dissipation capability of the bar and fin structures is evaluated and the form of the internal heat dissipation structure of the runner is confirmed.
2 Modeling and simulation
Figure 1 shows the models used in this study, which are normal cold plate, cold plate with sticks and cold plate with fins. They vary the hydraulic radius of the inlet and the inlet flow rate by means of parametric modeling. The coolant flows from the channel inlet and then enters the main cooling area through the corner. This is also where the structure of these three types of cold plates differs. Above the main heat dissipation area is a heating surface with an area of 1,200 mm2, which is given a heat flow q of 100,000 W/m. The material of the cold plate is copper. The arrangement of the internal structure of the cold plate with sticks and the cold plate with fins is shown in the figure. The detailed parameters of each part of the cold plate are shown in Table 1.
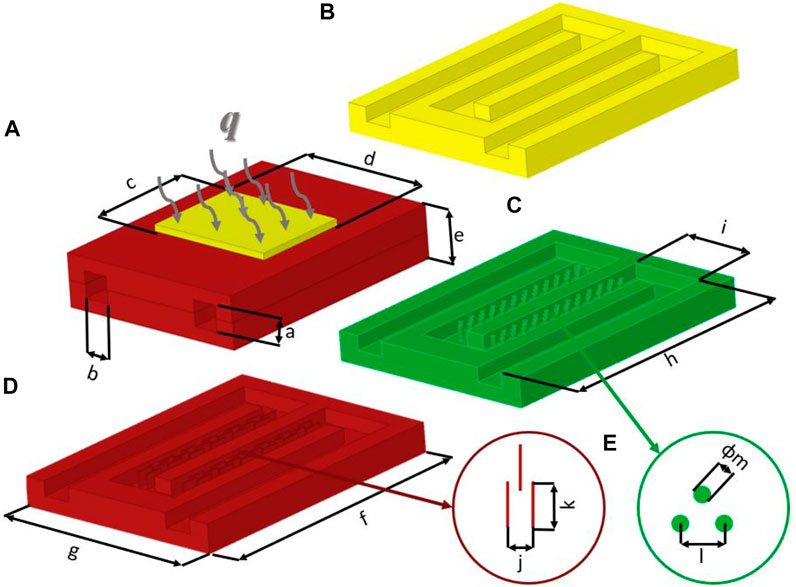
FIGURE 1. (A) Cold plate size parameter diagram (B) Normal cold plate structure (C) Cold plate structure with sticks (D) Cold plate structure with fins (E) Fin size parameter.
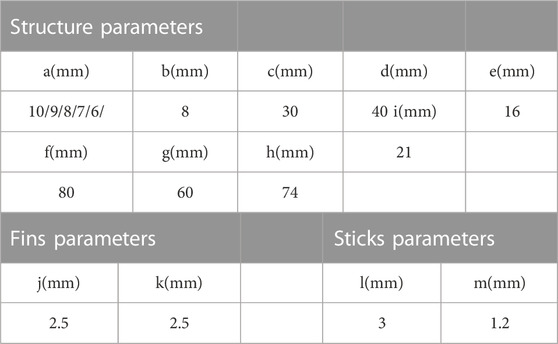
TABLE 1. Parameters of cold plate.
Some assumptions and simplifications were made for this heat sink: there are three main ways of heat dissipation in liquid-cooled heat sinks, heat conduction, heat convection and heat radiation (Biot, 1956). Ignore thermal radiation because the radiative heat dissipation accounts for a relatively small amount; under defined flow conditions, the forced convective heat transfer of liquid cooling is two orders of magnitude of the natural convective heat transfer of air, so the natural convective heat transfer of air can be ignored in the calculation process, and the outer edge of the radiator is considered adiabatic (Bao et al., 2021); the flow distribution at the inlet is stable and uniform; the cooling medium is an incompressible viscous fluid, and the physical parameters do not vary with temperature. Ignore the effect of gravity on the cooling medium and local pressure loss.
In this study, parametric modeling using ANSYS Fluent 2021R1 (Southpointe. 2021), whose solution engine uses an implicitly coupled multigrid technique to solve the equations. The initial iteration of the CFD simulation is performed on a fine grid, followed by a coarser grid created virtually. Finally, the fine mesh is used again to obtain accurate results. To ensure that the final results converge, the corresponding residual ranges should be set (Sharma et al., 2020). When the corresponding monitored values show periodic fluctuations or constant values, or the residual values of each variable are less than the defined ranges, the computational results are considered to converge. In order to ensure the accuracy of the calculation results, the convergence condition in this paper is that the residuals of the energy equation and the residuals of the continuity equation should be less than 10−6, and the others should be less than 10−4. In addition to observing the changes of each residual, each monitoring point should be monitored. The variation of the inlet and outlet pressure is also observed. Eventually, convergence is judged if the residuals are lower than the set criteria or the monitoring values remain unchanged. To simplify the calculations, some assumptions were made (Yu et al., 2019). The flow is considered to be stable, laminar (Reynolds number: 200–700), and incompressible. Gravitational effects and radiation-induced heat transfer are neglected. The steady-state governing equations, mass, momentum and energy conservation equations in the basin are given as follows:
Mass equation:
Where
Momentum equation
where
Energy equation
Where
The heat dissipation performance of the different internal structures of the cold plate will be evaluated by the combination of the outlet temperature
The uniformity of cooling of the cold plate is measured using the ∆T indicator:
where
Before the numerical simulation begins, the cold plate needs to be meshed. The ultimate goal of finite element analysis is to restore the mathematical behavior characteristics of an actual engineering system. That is, the analysis must be an accurate mathematical model for a physical prototype. In a broad sense, the model includes all the nodes, cells, material properties, geometric characteristics, initial conditions, boundary conditions, etc. And other features used to represent this physical system (Yang et al., 2014). In a narrow sense, model generation refers only to the generation process of representing the spatial body region with nodes and cells and the actual system connections, i.e., mesh dissection. The process of building a finite element model, both in a broad and narrow sense, involves mesh discretization. Statistics have been made, in the three stages of numerical analysis, pre-processing accounts for about 40%–60% of the total time, numerical seeking accounts for about 5%–20%, and computational results after about 30%. The traditional method to carry out the discrete work of the analysis object. It is bound to take a lot of time and is also error-prone when the model is complex. Pre-processing work is more tedious, but very important. It is the basis for a correct finite element analysis. Therefore, it is very important for numerical analysis workers to carry out better discretization meshing of analysis objects.
Figure 2 shows the details of the meshing of the cold plate. In the cold plate with two different fin structures in this study, the thinnest part of the fin structure is = .3 mm and the width at the entrance = 8 mm. Therefore, in the indicated meshing stage, the minimum size of the surface mesh is defined = 7.8*10–2 mm so that it has more than 2 meshes at the gap. Define the maximum size of the surface grid = 1 mm so that its grid size at the entrance is less than 10% of the entrance width. And set its inlet as mass inlet and outlet as pressure outlet so that it is simulated numerically in the most suitable form for convergence. Figures 2C,D shows the cross-sectional and detail views of the body mesh division of the cold plate. This study is carried out for the flow and heat transfer characteristics of the cold plate. The complex structure of the basin in the fin region, it is appropriate to use pollyhedra mesh to delineate the fin region within the flow channel of the cold plate.
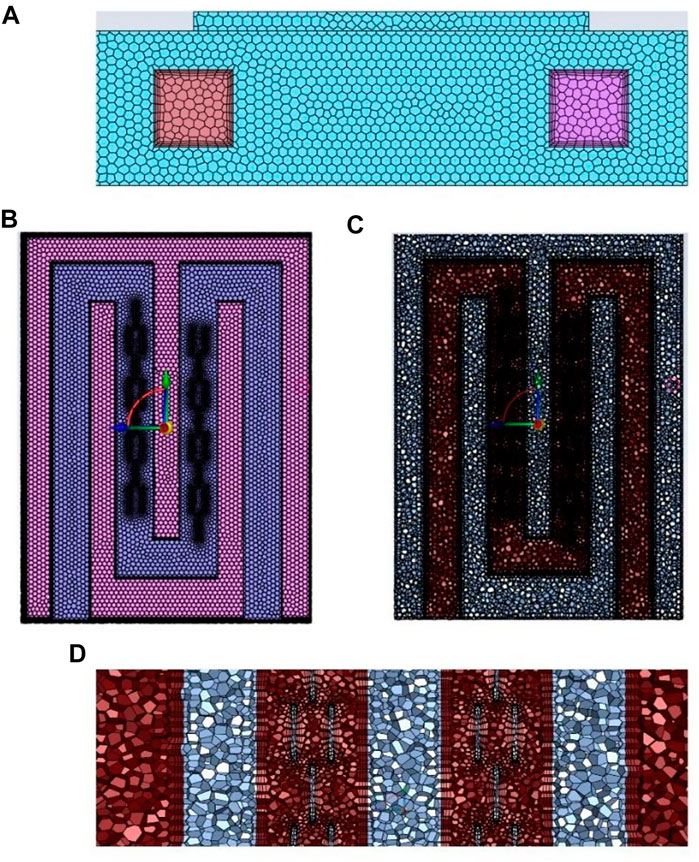
FIGURE 2. Meshing details (A) Inlet and outlet (B) surface grids (C) body grids (D) section details.
For the numerical simulation of the problem, the grid is usually verified to be irrelevant, and when the numerical calculation results obtained by further encryption of the grid with sufficient accuracy do not affect the calculation results, it is called grid irrelevance verification. The quality of the grid plays a key role in the accuracy of the numerical calculation results and the final results (Papadopoulos et al., 1999). If the grid is too coarse, the error of the calculation results will be very large, so it is very important to determine the quantity and accuracy of the grid.
Figure 3 shows the grid-independent analysis concerning the cold plate with bars. In order to determine the grid size and number of liquid-cooled plate independence, six grid sizes of different sizes are divided in this paper. The grid numbers of liquid-cooled radiator model are about 150,000, 220,000, 240,000, 380,000, 490,000, and 590,000, respectively. Numerical simulations are performed on the liquid-cooled plate with bars under the conditions of inlet velocity of .15 m/s and inlet height of 6 mm to obtain the trend of outlet temperature with the change of grid number. As the number of grids changes the temperature can change accordingly, when the number of grids increases from 150,000 to 220,000, the outlet temperature of the liquid-cooled plate decreases. When the grid number increases from 240,000 to 380,000, the temperature rises, and when the grid number increases to 380,000, the outlet temperature decreases, and when the grid continues to increase, the change of thermal resistance gradually tends to level off, and the temperature of 490,000 grid increases by .33% compared to 380,000, and the thermal resistance of 590,000 grid decreases by .36% compared to 490,000, and the outlet temperature deviation is less than 1%. Therefore, when the number of grids is around 380,000 is applicable to the liquid-cooled plate studied in this paper. From the analysis of Figure 5, it can be seen that the temperature change is very small as the number of grids increases, so for the liquid-cooled plate studied in this paper, the effect on the temperature is negligible after the number of grids reaches 380,000. Therefore, considering the computation time and cost as well as the temperature variation, the grid number is chosen to be 380,000. In the subsequent improvement, since the overall dimensions are not changed, only at the fins, the grid division method is the same, and this grid-independent verification is also applicable to other models.
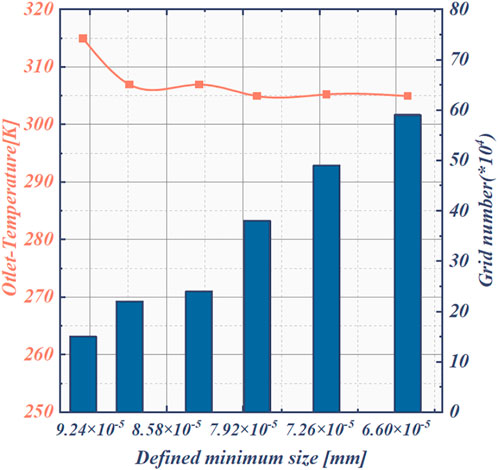
FIGURE 3. Grid irrelevance verification.
3 Result analysis
Figure 4 shows the temperature clouds, pressure clouds and velocity traces of the fluid in the flow channel at the inlet flow rate of .15 m/s for different structures of the cold plate, which consists of parallel flow channels with fluid inlet on the left and fluid outlet on the right, and the overall flow channel is in multiple U shapes.
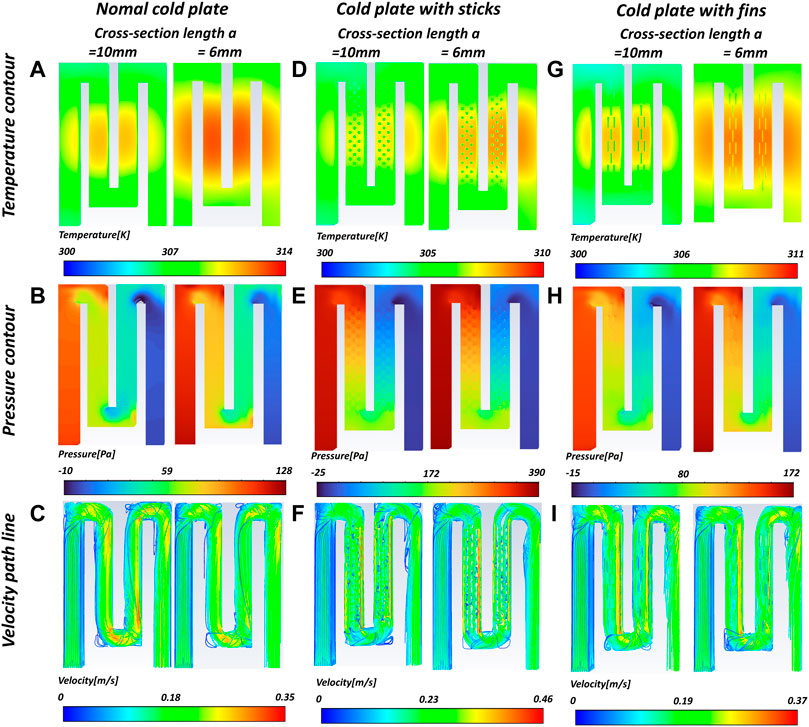
FIGURE 4. (A) (D) (G) temperature clouds (B) (E) (H) pressure clouds (C) (F) (I) velocity traces for different resultant cold plates.
From Figure 4C, F, I, we can see that in the inlet straight section, the fluid enters the interior of the cold plate at a higher flow rate, the fluid flow rate remains constant and large, and after entering the interior of the cold plate and entering the first U-shaped bend, the flow direction changes due to the inertia of the fluid and the blocking effect of the channel walls, triggering the separation of the boundary layer, which makes the fluid at the main heat dissipation area does not follow the wall flow channel shape diffusion, the flow velocity increases. After entering the main heat dissipation region, different structures of the heat dissipation mainstream region show different flow field results.
In the normal cold plate, the fluid shows a velocity maximum at the corner. The pressure cloud also shows a trend from front to back, gradually decreasing. The temperature of the heating surface is more even. In the cold plate with bars, the velocity is gradually averaged after a certain distance. The pressure at the fluid inlet is higher and higher than the pressure on both sides of the inlet near the wall, while the velocity at the corner position is relatively small, so that the fluid forms a vortex zone.
Compared with the ordinary cold plate, after the cold plate with bar, the fluid distribution in the flow channel is more uniform. Fluid into the disturbed column area, due to the disturbance of the disturbed column effect, resulting in the disturbed column area convective heat transfer coefficient increases. As the density of the circular fin column gradually increases along the flow direction, the flow channel resistance fluid gradually increases. The increased resistance has a homogeneous effect on the fluid in the flow channel. It can be seen from the temperature cloud diagram that the temperature of the heating surface shows a non-uniform phenomenon. This is due to the large flow resistance brought by the column, which leads to insufficient fluid momentum in the back section of the channel to keep the heat uniform.
In the cold plate with fins, the fluid flow in the flow channel is not uniformly distributed, and when the fluid enters the finned flow channel area, the flow rate is higher in the middle area of the finned flow channel due to the proximity of the inlet section in the middle, and the flow rate is relatively low in the area on both sides due to the low flow rate. At the bend, it can be seen that the flow rate suddenly becomes larger because the fluid converges at the bottom of the radiator to form a convergence, which increases the flow rate and reduces the cross-sectional area, so the flow rate increases. After that, due to the inertia of the fluid, the flow rate on the left side is lower, while the flow rate on the right side is higher, and the flow rate remains basically constant. The cold plate with fins increases the contact area between the fluid and the solid, which enhances the overall mixing of the fluid and effectively strengthens the heat transfer. As mentioned before, due to the heat, the temperature of the coolant along the course is always gradually increasing, and as the fluid continues to absorb heat along the course, the fluid temperature gradually increases, and the maximum temperature of the heating surface gradually increases. In general, the heating surface temperature distribution of the finned type is more uniform. As the coolant flow increases, the average and maximum temperatures of the heating surface gradually decrease.
Figure 5 shows the effect of different internal structures of the channels on the temperature and flow of the cold plate. The temperature and flow fields are compared by intercepting the temperature and flow fields under the 3 structures in the middle part. The inlet flow velocity is uniformly set to .15 m/s, the inlet height is uniformly set to 8 mm, and the upper and lower boundaries of the velocity and temperature fields are set to the same scale for comparison. Figure 5A shows the temperature distribution and flow field of the finless structure. Figure 5B shows the temperature distribution and flow field of the structure with a bar. Figure 5C shows the temperature distribution and flow field of the fin structure. It can be seen that in the flow field of the finless structure, the flow lines are uniformly distributed and are not disturbed by the internal structure. However, the overall temperature of the finless cold plate is maintained at a higher level compared with the latter two structures. It shows that the cold plate without fin structure has a weak capacity for heat transfer. Figure 5B shows that in the flow channel of the gang structure, the flow traces are greatly influenced by the internal structure, and the traces go around the sides of the bars while showing a wavy pattern between the bars. The maximum of velocity appears on both sides of the channel. It can be seen that the flow channel with rods greatly affects the flow of coolant. The flow resistance in the flow channel is increased. And the velocity of flow between the rods arranged in front and back along the flow direction is small, losing most of the heat transfer. As can be seen in Figure 5C, the temperature of the cold plate is maintained at the same level as the rod structure. In contrast, the fin structure has little change in the flow direction, and most of the velocity flow lines can move against the fins, but compared with the finless structure. In the flow channel with the fin structure, the fins play a role in enhancing heat transfer and separating the flow. It can be seen that the flow lines with high velocities appear on one side of the flow channel, because the fluid passes through a U-bend before entering the fin structure. Due to inertia, a gradient of velocity appears along the direction perpendicular to the flow direction. And as it passes through the fin area, the fins prevent the coolant from remixing, giving a larger flow velocity on one side of the flow channel.
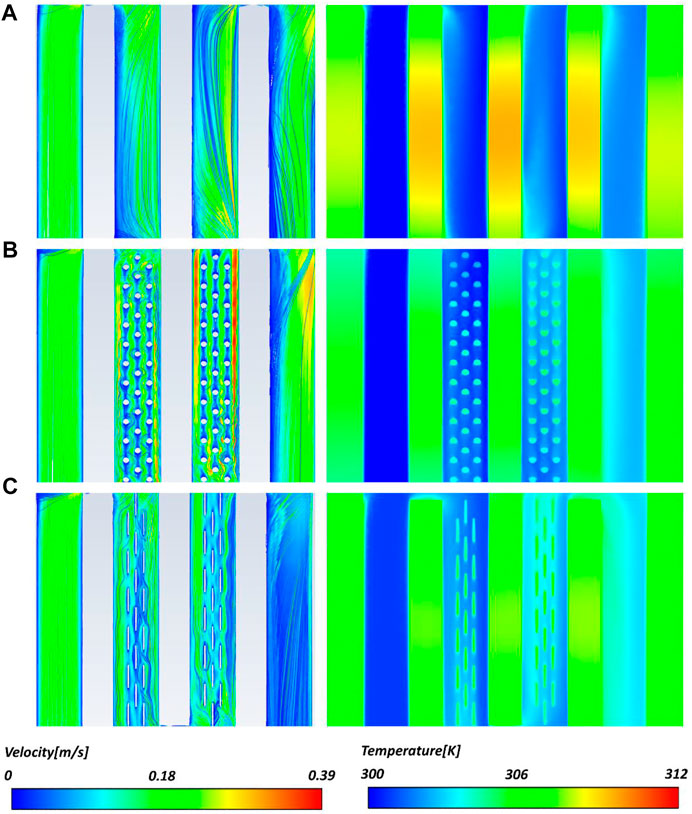
FIGURE 5. Comparison of velocity traces and temperature contours of different central fins at the same scale (A) without fins (B) bar fins (C) plate fins.
Figure 6 shows the comparison of the field phase coordination angles for different fin forms. The field synergy principle proposed by over. Guo et al. (2005) shows that the convective heat transfer efficiency depends not only on the velocity and temperature fields, but also on the overall synergy of the velocity and temperature gradient fields. The field synergy principle provides theoretical guidance for enhanced heat transfer and can well explain the mechanism of enhanced heat transfer, which has been widely applied in many other enhanced heat transfer processes. The average field synergy angle calculated by the local vector product derived from the local synergy angle θ (ranging from 0°–180°) will mainly reflect the degree of field synergy of flow heat transfer on the wall surface.
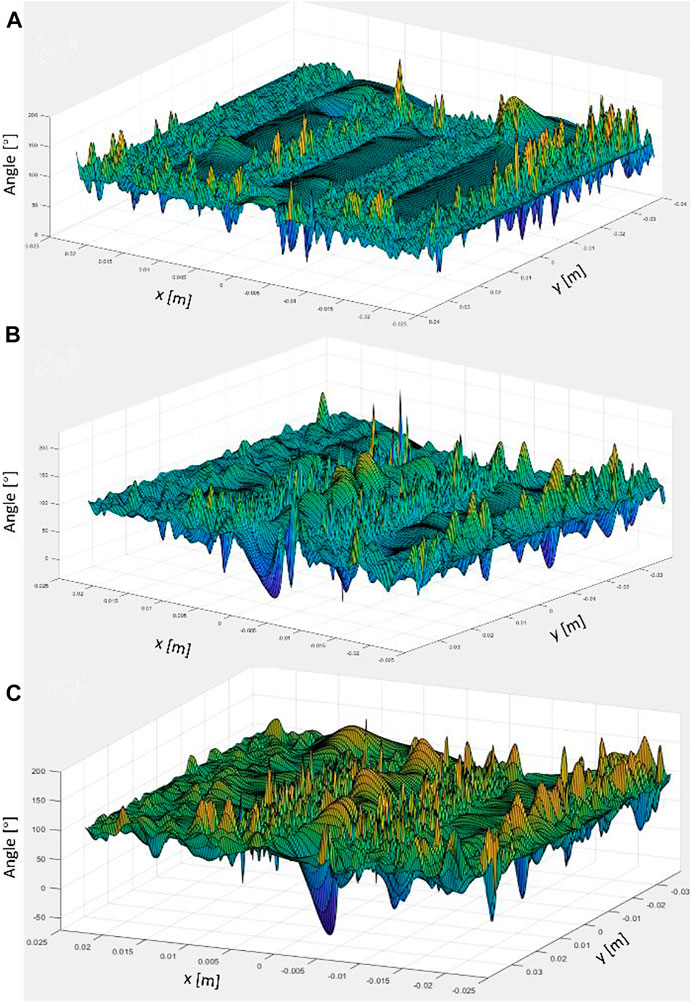
FIGURE 6. Comparison of field phase coordination angles with different fin forms.
The field synergy can be evaluated mainly by the following equation, by the angle between the velocity vector and the temperature gradient vector
where
Different fin structure parameters will largely affect the overall performance of the heat sink, from the point of view of field synergy is that the fin parameters affect the synergy angle of the flow field velocity vector with its temperature gradient, thus affecting its convective heat transfer performance. Figure 6A shows the field synergy angle diagram for the finless runner. It can be seen that the field synergy angle of the cold plate without fin structure is basically maintained near 90°C in the central heat dissipation zone. At the entrance of the runner, its heat transfer capacity is also better because of the fast flow rate. Later, due to the flow loss, the synergy angle gradually converges to 90°C, and at the corners of the flow channel, the field synergy angle also fluctuates, indicating that the heat transfer capacity of the cold plate is stronger in these areas. Comparing Figures 6A, B, it can be seen that in the flow channel with an internal structure, the synergy angle fluctuates more in the center of the cold plate, forming multiple “peaks”. The flow channel with the bar structure has a larger resistance to flow than the flow channel with the fin structure. Therefore, in the second half of the flow channel, the synergy angle of the cold plate field with a bar structure approaches 90° faster than that of the fin structure flow channel.
Figure 7 are the heating surface temperature graph, pressure drop graph, outlet temperature graph and temperature difference graph for different structures of the cold plate, respectively. From Figure 7A, it can be seen that the ordinary cold plate has the worst heat dissipation effect. The cold plate with bar has the lowest temperature
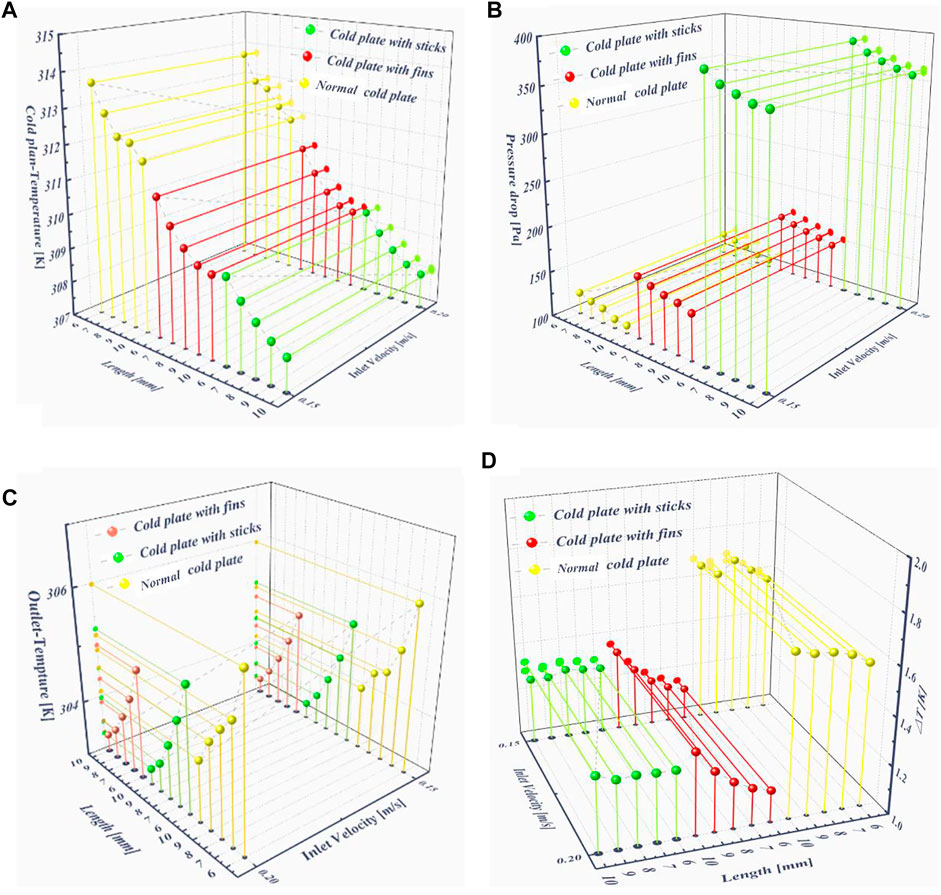
FIGURE 7. (A)Heating surface temperature (B) Pressure drop (C) Outlet temperature (D) Temperature homogeneity.
Figure 8 shows the sensitivity analysis for cold plates of different structures. The geometrical variation parameters of the cold plate are internal structural parameters, inlet flow rate and hydrodynamic radius. In order to investigate which operating parameter has the greatest effect on the reactor performance, a sensitivity analysis of the structural parameters is required to obtain the order of their effect on the reaction performance. The sensitivity analysis is divided into 3 main groups, corresponding to the 3 output parameters. Sensitivity analysis uses the Pearson correlation coefficient (Schober et al., 2018), which measures a linear correlation. If the coefficient is 0, it can only say that there is no linear correlation between x and y, not that there is no correlation. The larger the absolute value of the correlation coefficient, the stronger the correlation: the closer the correlation coefficient is to 1 or −1, the stronger the correlation, and the closer the correlation coefficient is to 0, the weaker the correlation. Pearson looks at two series as two variables and calculates whether the two variables are linearly correlated. The Pearson formula is as follows:
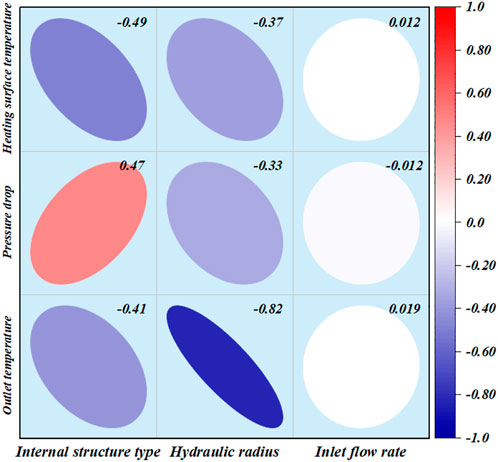
FIGURE 8. Sensitivity analysis.
The numerator is the formula for the covariance, which calculates the correlation between the two variables; greater than 0 is a positive correlation, less is a negative correlation, and equal is not correlated. Dividing by the denominator is equivalent to normalizing to between (−1,1).
From Figure 8, we can observe that the internal structure is negatively correlated with the temperature of the heating surface, indicating that the addition of the internal structure promotes the heat dissipation of the cold plate, and the location, shape and contact area with the coolant of the internal structure of the cold plate have an effect on the heat dissipation efficiency of the cold plate. At the same time, the internal structure and the pressure drop in the flow channel are positively correlated, indicating that the flow resistance of the flow channel increases with the addition of internal structure. The correlation coefficients between the hydraulic radius of the inlet and the three output parameters show that they are negatively correlated with each other. It shows that the increase of the hydraulic radius is conducive to the cooling of the heating surface and the reduction of the flow resistance. It can also be seen that the hydraulic radius has the greatest impact on the outlet temperature, because the increase in the inlet hydraulic radius will directly increase the mass flow of coolant in the cold plate screen. The increase in mass flow rate, on the other hand, reduces the heat absorbed per unit volume of coolant in the case of a constant heat flow emitted by the heating surface in a unit time. From the correlation analysis of the inlet flow rate, it can be seen that the change of the inlet flow rate has a small effect on the overall cooling efficiency of the cold plate, due to the small range of variation of the inlet velocity, compared to the other parameters, in this simulation, the change of the inlet flow rate is disproportionate compared to the effect brought about by the change of other structural parameters.
In the result of cooling plate heat dissipation, the cold plate with fins brings a better heat dissipation capacity than the normal cold plate while maintaining a small pressure drop. The temperature uniformity of the cold plate with fins is kept at a high level compared to the cold plate with bars, and therefore the fin structure should be the main consideration in the design of the cold plate.
4 Conclusion
In this paper, the performance of various structural cold plates at different flow rates is simulated and calculated, comparing the heat dissipation performance of common cold plates, cold plates with bars, and cold plates with fins, and explaining the reasons for these performance differences, laying the foundation for the performance analysis of non-linear heat transfer enhanced homogeneous liquid cold plates.
The simulation results reveal the performance differences of each structure cold plate, and the temperature uniformity parameters are used to quantitatively analyze the uniformity of temperature distribution on the heating surface under different flow conditions. The results show that the ordinary cold plate and cold plate with bar exhibit inhomogeneous distribution of flow and temperature fields under this simulation condition. In addition, the cold plate with bar has the problem of excessive flow resistance. As the radius of coolant inlet increases, the maximum temperature of the cold plate decreases, the thermal resistance increases and the flow resistance decreases. By comparing the indexes of the cold plate of the three structures, the cold plate with fins has a lower maximum temperature in the heat generating region than the ordinary cold plate while maintaining a smaller pressure drop. Moreover, the uniformity of temperature is ensured, therefore, the fin shape should be considered as the primary form of heat generation area application in the process of designing the cold plate.
The directions that can still be continued to be explored in future work are as follows.
1) This paper is an attempt to add a heat transfer structure to the cold plate. The simulation verifies the ability of the cold plate with fins in terms of heat dissipation capacity and maintaining temperature uniformity. In future work, we can try to change the angle of the fins to improve the uniformity of the flow in the cold plate channel.
2) Based on this paper, the search for multiple configurations of channel interiors to enhance the cooling capacity of the cold plate can be continued. For example, we can try the effect of triangular structure on the flow heat transfer characteristics of the cold plate, and explore the effect of multiple configurations of internal placement on the heat dissipation capacity based on parametric modeling, and find the optimal combination of fin pin angle design.
3) Based on this paper, more evaluation indexes can be used to measure the cooling efficiency of the cold plate, such as Nusselt number, vortex volume, thermal resistance and other indexes. Make the evaluation results of the heat dissipation ability more convincing.
Data availability statement
The original contributions presented in the study are included in the article/supplementary material, further inquiries can be directed to the corresponding author.
Author contributions
KZ, Conceptualization, methodology, simulation, writing—draft preparation; XS, Validation, methodology, simulation; YX, Validation, simulation, supervision; QL, Analysis, simulation; LS, Analysis, supervision; ML, writing.
Conflict of interest
The authors declare that the research was conducted in the absence of any commercial or financial relationships that could be construed as a potential conflict of interest.
Publisher’s note
All claims expressed in this article are solely those of the authors and do not necessarily represent those of their affiliated organizations, or those of the publisher, the editors and the reviewers. Any product that may be evaluated in this article, or claim that may be made by its manufacturer, is not guaranteed or endorsed by the publisher.
References
Bahiraei, M., and Heshmatian, S. (2018). Electronics cooling with nanofluids: A critical review. Energy Convers. Manag. 172, 438–456. doi:10.1016/j.enconman.2018.07.047
Bao, K. L., Zhuang, Y., Gao, X., Xu, Y. Y., Wu, X. L., and Han, X. H. (2021). Transient numerical model on the design optimization of the adiabatic section length for the pulsating heat pipe. Appl. Sciences-Basel 11, 9432. doi:10.3390/app11209432
Biot, M. A. (1956). Thermoelasticity and irreversible thermodynamics. J. Appl. Phys. 27, 240–253. doi:10.1063/1.1722351
Bo, Z., Ying, C., Zhu, H., Wei, X., Yang, H., Yan, J., et al. (2019). Bifunctional sandwich structure of vertically-oriented graphenes and boron nitride nanosheets for thermal management of LEDs and Li-ion battery. Appl. Therm. Eng. 150, 1016–1027. doi:10.1016/j.applthermaleng.2019.01.068
Chen, Q., Liang, X. G., and Guo, Z. Y. (2013). Entransy theory for the optimization of heat transfer - a review and update. Int. J. Heat Mass Transf. 63, 65–81. doi:10.1016/j.ijheatmasstransfer.2013.03.019
Chen, S. Q., Zhang, G. X., Wu, C. J., Huang, W. S., Xu, C. S., Jin, C. Y., et al. (2022). Multi-objective optimization design for a double-direction liquid heating system-based Cell-to-Chassis battery module. Int. J. Heat Mass Transf. 183, 122184. doi:10.1016/j.ijheatmasstransfer.2021.122184
Feng, S., Yan, Y., Li, H., He, Z., and Zhang, L. (2020). Temperature uniformity enhancement and flow characteristics of embedded gradient distribution micro pin fin arrays using dielectric coolant for direct intra-chip cooling. Int. J. Heat Mass Transf. 156, 119675. doi:10.1016/j.ijheatmasstransfer.2020.119675
Guo, Z. Y., Tao, W. Q., and Shah, R. K. (2005). The field synergy (coordination) principle and its applications in enhancing single phase convective heat transfer. Int. J. Heat Mass Transf. 48, 1797–1807. doi:10.1016/j.ijheatmasstransfer.2004.11.007
He, Y. L., Liu, Q., Li, Q., and Tao, W. Q. (2019). Lattice Boltzmann methods for single-phase and solid-liquid phase-change heat transfer in porous media: A review. Int. J. Heat Mass Transf. 129, 160–197. doi:10.1016/j.ijheatmasstransfer.2018.08.135
June, M. S., and Sikka, K. K. (2002). “Using cap-integral standoffs to reduce chip hot-spot temperatures in electronic packages,” in 8th Intersociety Conference on Thermal and Thermomechanical Phenomena in Electronic Systems (San Diego, Ca, 173–178.
Karng, S. W., Lee, S. W., Hwang, K., and Kim, S. Y. (2007). “Asme, Performance measurement of liquid-cooled cold plates for humanoid robot cooling,” in ASME InterPACK Conference (Vancouver, CANADA, 767–772.
Papadopoulos, P., Venkatapathy, E., Prabhu, D., Loomis, M. P., and Olynick, D. (1999). Current grid-generation strategies and future requirements in hypersonic vehicle design, analysis and testing. Appl. Math. Model. 23, 705–735. doi:10.1016/s0307-904x(99)00007-4
Qian, Z., Li, Y. M., and Rao, Z. H. (2016). Thermal performance of lithium-ion battery thermal management system by using mini-channel cooling. Energy Convers. Manag. 126, 622–631. doi:10.1016/j.enconman.2016.08.063
Rubio-Jimenez, C. A., Kandlikar, S. G., and Hernandez-Guerrero, A. (2013). Performance of online and offset micro pin-fin heat sinks with variable fin density. IEEE Trans. Components, Packag. Manuf. Technol. 3, 86–93. doi:10.1109/tcpmt.2012.2225143
Saeid, N. H., Hasan, N., and Ali, M. (2018). Effect of the metallic foam heat sink shape on the mixed convection jet impingement cooling of A horizontal surface. J. Porous Media 21, 295–309. doi:10.1615/jpormedia.v21.i4.10
Schober, P., Boer, C., and Schwarte, L. A. (2018). Correlation coefficients: Appropriate use and interpretation. Anesth. Analgesia 126, 1763–1768. doi:10.1213/ane.0000000000002864
Sharma, P., Chandra, L., Ghoshdastidar, P. S., and Shekhar, R. (2020). A novel approach for modelling fluid flow and heat transfer in an Open Volumetric Air Receiver using ANSYS-FLUENT. Sol. Energy 204, 246–255. doi:10.1016/j.solener.2020.04.031
Shen, Y. S., Zhou, Y. Y., Zhu, T., and Duan, G. B. (2017). Thermotechnical performance of an air-cooled tuyere with air cooling channels in series. Heat Mass Transf. 53, 81–98. doi:10.1007/s00231-016-1801-x
Shu, S. L., Hou, G. Y., Wang, L. J., Tian, S. C., Vassiliev, L. L., and Tong, C. Z. (2017). Heat dissipation in high-power semiconductor lasers with heat pipe cooling system. J. Mech. Sci. Technol. 31, 2607–2612. doi:10.1007/s12206-017-0502-9
Soodphakdee, D., Behnia, M., and Copeland, D. (2001). A comparison of fin geometries for heat sinks in laminar forced convection: Parts I and II. Int. J. Microcircuits Electron. Packag. 24, 68–76.
Suginishi, S., Kojima, N., Sato, N., Noe, T., Nishikawa, K., and Uragami, T. (2017). “Fluid cold heat device,” (Ryonetsu Kogyo KK: Tamamura Delica Co. Ltd.).Nippon delica foods kyodo kumiai.
Sun, Y., Li, L., Shi, H., and Chong, D. Z. (2020). The transformation and upgrade of China's manufacturing industry in Industry 4.0 era. Syst. Res. Behav. Sci. 37, 734–740. doi:10.1002/sres.2714
Vilarrubí, M., Riera, S., Ibañez, M., Omri, M., Laguna, G., Fréchette, L., et al. (2018). Experimental and numerical study of micro-pin-fin heat sinks with variable density for increased temperature uniformity. Int. J. Therm. Sci. 132, 424–434. doi:10.1016/j.ijthermalsci.2018.06.019
Vuckovic, M., and Depret, N. (2016). “Ieee, impacts of local cooling technologies on air cooled data center server performance: Test data analysis of heatsink, direct liquid cooling and passive 2-phase enhanced air cooling based on loop heat pipe,” in 32nd Semiconductor Thermal Measurement and Management Symposium(SEMI-THERM) (San Jose, CA, 71–80.
Wei, P., Zhu, L., Zhang, J., Wang, X. F., Zhao, X. Q., Zhou, M. G., et al. (2013). “Ieee, an evaluation of heat dissipation capability of slow-wave structure by micro fiber bragg grating sensor array,” in 14th IEEE International Vacuum Electronics Conference (IVEC) (Paris, FRANCE.
Wong, K.-C., and Ang, M.-L. (2017). Thermal hydraulic performance of a double-layer microchannel heat sink with channel contraction. Int. Commun. Heat Mass Transf. 81, 269–275. doi:10.1016/j.icheatmasstransfer.2016.09.013
Yang, J., Xie, Z., Ji, Z., and Meng, H. (2014). Real-time heat transfer model based on variable non-uniform grid for dynamic control of continuous casting billets. ISIJ Int. 54, 328–335. doi:10.2355/isijinternational.54.328
Yu, Y., Luo, X., Zhang, H., and Zhang, Q. (2019). Dynamic optimization method of secondary cooling water quantity in continuous casting based on three-dimensional transient nonlinear convective heat transfer equation. Appl. Therm. Eng. 160, 113988. doi:10.1016/j.applthermaleng.2019.113988
Zheng, X., Yang, R., Wang, Q., Yan, Y., Zhang, Y., Fu, J., et al. (2022). Comparison of GRNN and RF algorithms for predicting heat transfer coefficient in heat exchange channels with bulges. Appl. Therm. Eng. 217, 119263. doi:10.1016/j.applthermaleng.2022.119263
Keywords: cold plate, flow resistance, heat transfer, computational fluid dynamics, optimization
Citation: Zhao K, Sun X, Xia Y, Li Q, Shen L and Lin M (2023) Cold plate performance enhancement based on parametric modeling of multiple structures. Front. Energy Res. 10:1087682. doi: 10.3389/fenrg.2022.1087682
Received: 02 November 2022; Accepted: 15 December 2022;
Published: 20 February 2023.
Edited by:
Jinlong Liu, Zhejiang University, ChinaReviewed by:
Shuai Wang, University of New South Wales, AustraliaHuachao Yang, Zhejiang University, China
Junqing Zhu, ExxonMobil Research and Engineering, United States
Copyright © 2023 Zhao, Sun, Xia, Li, Shen and Lin. This is an open-access article distributed under the terms of the Creative Commons Attribution License (CC BY). The use, distribution or reproduction in other forums is permitted, provided the original author(s) and the copyright owner(s) are credited and that the original publication in this journal is cited, in accordance with accepted academic practice. No use, distribution or reproduction is permitted which does not comply with these terms.
*Correspondence: Xiaoxia Sun, xiaoxia_sun1983@163.com