Negative Emission Power Plants: Thermodynamic Modeling and Evaluation of a Biomass-Based Integrated Gasification Solid Oxide Fuel Cell/Gas Turbine System for Power, Heat, and Biochar Co-Production—Part 1
 N. Jaiganesh
 Po-Chih Kuo
 Theo Woudstra
 R. Ajith Kumar
 P. V. Aravind
- 1Department of Mechanical Engineering, Amrita Vishwa Vidyapeetham, Amritapuri Campus, Kollam, India
- 2Water Engineering, CiTG, Delft University of Technology, Delft, Netherlands
- 3Institute of Industrial Science, University of Tokyo, Meguro-ku, Japan
- 4Energy and Sustainability Research Institute Groningen, Faculty of Science and Engineering, University of Groningen, Groningen, Netherlands
This article is the first of a two-part series presenting the thermodynamic evaluation and techno-economics of developing negative-emission power plants. The aim of this research is to evaluate the potential of biochar co-production in negative-emission power plants based on biomass-fed integrated gasification solid oxide fuel cell systems with carbon capture and storage (BIGFC/CCS) units. The influence of two gasification agents, namely, air and steam-oxygen, on the proposed system is investigated. In Part I, we present the thermodynamic models. A sensitivity analysis is carried out to investigate the system response to stepwise increase in biochar co-production (up to 10% by weight). Providing a secondary oxy-combustor in the steam-oxygen gasification case has been shown to be a solution to meet the heat requirements of the allothermal gasification process. A comprehensive exergy analysis indicated significant efficiency improvement for the steam-oxygen gasification case. The results show that the biomass steam-oxygen gasification yields the higher electrical exergy efficiency (48.3%) and combined heat and power (CHP) exergy efficiency (54.6%) for the similar rates of biochar co-production. The specific power output per unit of CO2 stored is 2.65 MW/(kg/s) and 3.58 MW/(kg/s) for the air and steam-oxygen gasification cases, respectively, when the biochar is co-produced at 10% by weight for the given biomass flow of 20 kg/s. Moreover, the total CO2 stored due to the proposed system is calculated as 133.9 t/h, and it is estimated to remove 1.17 Mt of CO2 from the atmosphere annually (when the biochar-based carbon storage is also considered). The models are used for the techno-economic analysis presented in Part II of the series.
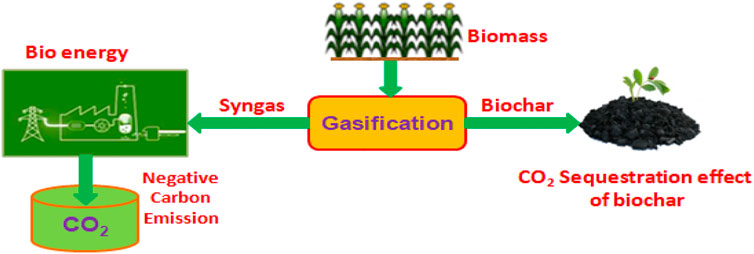
GRAPHICAL ABSTRACT
Highlights
1) The thermodynamic model of a BIGFC/CCS system including an Oxy-CCS unit is developed.
2) The influence of air and steam-oxygen as gasification agents on the proposed system is investigated.
3) The effect of step-wise biochar co-production on the performance of the system is evaluated.
4) It is shown that the steam-oxygen gasification system could provide negative carbon emission while producing power with high efficiencies.
5) The impact of co-produced biochar on negative carbon emissions for the long term is discussed.
1 Introduction
1.1 Background and Motivation
Long-term potential actions are needed for sustainable development to find the solution to present-day environmental problems. One of the most effective and efficient solutions in this context is found to be renewable energy resources (Dincer, 2000). The importance of renewable energy power production relies on the fact that it can harness nature without destroying it.
Negative emission technology (NET) is identified as the most promising strategy to keep the global warming limits committed to by the Paris Agreement (United Nations Framework Convention on Climate Change, 2016). Bioenergy with carbon capture and storage (BECCS) with sustainable biomass energy conversion systems is one of the NETs which could be applied on a large scale to achieve negative CO2 emissions (Hilaire et al., 2019). In this technology, the release of CO2 to the atmosphere is avoided by sequestering and storing it in geological reservoirs. Smith (Smith, 2016) reported the potential of the biochar in improving the soil properties and the use of sequestrated soil carbon with respect to the other NETs and suggested including them with integrated assessment models (IAMs). Proll et al. (Pröll and Zerobin, 2019) investigated the effect of various carbon capture methods in biomass-based combined heat and power generation systems. They reported that BECCS and biochar could be an efficient NET which offers both an efficient energy-based performance and carbon sequestration.
1.2 Literature Review
Sanchez et al. (Sanchez and Kammen, 2016) compared the role of different thermochemical pathways in providing carbon-negative energy for biomass and coal. They found that the power production through integrated gasification combined cycle (IGCC) with CCS was a viable option to implement BECCS in the future. Rhodes et al. (Rhodes and Keith, 2005) surveyed the various methods of integrating biomass technologies with CCS and presented a simple engineering economic IGCC model to demonstrate its significance in attaining negative emissions as a cost-effective solution.
Klein et al. (2011) investigated the influence of CO2 capture (CC) on the biomass-based IGCC power plants and indicated the possibility of developing efficient CO2-negative power plants. Stanger et al. (2015) reported that the oxy-fuel combustion is one of the best methods of capturing the emitted CO2 from the power plants in which the fuel is combusted with nearly pure oxygen instead of air. This method is proved to be economical for capturing CO2 instead of conventional means of chemical absorption (IEA Greenhouse Gas R&D Programme, 2005/0920).
Kanniche et al. (Kunze and Spliethoff, 2012) summarized the technical and economic estimates on carbon capture methods and recommended that the oxy-fuel combustion type of carbon capture method is suited for pulverized coal power plants. Kanniche et al. (2010) applied the various carbon capture technologies such as pre-combustion, post-combustion, and oxy-fuel combustion in an advanced IGCC plant and showed that all of the methods have contributed an effective rate of carbon capture, up to 99%.
In the previous works, it is also reported that the use of CO2 capture units in IGCC power plants could reduce their performance in terms of net electrical efficiency (Kanniche et al., 2010; Kunze and Spliethoff, 2012). Woudstra et al. (2006) showed that the usage of fuel cells in combined heat and power generation systems contributes to reducing their exergy losses.
Jin et al. (2009) analyzed the effect of integrating the SOFC with the biomass-based IGCC power plants and showed that the addition of SOFC in the system offered the potential to achieve higher electrical efficiencies than that of the system without SOFC. Park et al. (Park et al., 2011a; Park et al., 2011b) concluded that oxy-fuel combustion CO2 capture provided a better performance than the pre-combustion method in SOFC-integrated IGCC plants.
Aditya et al. (ThallamThattai et al., 2016) developed an off-design model for 70% percentage biomass co-gasification from the steady-state coal-based IGCC validated model (Promes et al., 2015) of 253 MWe Willem-Alexander Centrale (WAC), Buggenum, in the Netherlands. They demonstrated that the current IGCC power plants could be designed to operate with a high percentage of biomass in the fuel mix with lesser modifications on the plant.
Aditya et al. (Thallam Thattai et al., 2017) further carried out the research by retrofitting the high-temperature SOFCs in the biomass co-gasification IGCC models (ThallamThattai et al., 2016) to investigate the performance of large-scale integrated gasification fuel cell cycle (IGFC) power plants. In addition, the partial and full oxy-fuel combustion method of carbon capturing units was adapted to study the feasibility of developing CO2-negative power plants. They reported that the redesigned IGFC-CC system had the potential to provide CO2-negative emission for the net exergy efficiency of 44%.
The generation of pure oxygen is a major challenge in oxy-fuel combustion even if it is an effective method to capture CO2. The potential of ion transport membrane (ITM) technology in oxygen generation and syngas production is reported elsewhere (Dyer et al., 2000; Chen et al., 2004). The previous investigation on the use of the ITM technique in the IGCC power plant has proven it to be an efficient and economical option for generating oxygen when compared with the currently used cryogenic air separation unit (ASU) (Jaeger, 2008).
The present situation in the world requires a resource-efficient approach in the usage of renewable energy as it has to address the other global threats such as climate change, declining agricultural production, scarcity of water, and fertilizer shortage. Laird (Laird, 2008) identified the option of producing biochar with the bio energy as one such approach to improve the quality of water and soil.
Woolf et al. (2016) showed that BEBCS (bioenergy-biochar system) might provide earlier implementation of carbon dioxide removal (CDR) at economical carbon prices even though BECCS offers twice the carbon capture and bioenergy on a unit biomass basis.
Hansen et al. (2015) assessed the physical and chemical characteristics of the gasification biochar materials which are used to enhance the quality of the soil and explored the potential of gasification systems to co-produce biochar with bio energy. LydiaFryda and Rianne Visser (FrydaL, 2018) concluded that the stability of biochar is found to be higher when it is produced from a gasification process than from a pyrolysis process.
Zhiyi Yao et al. (Yao et al., 2018) developed a biomass-based gasification model which is designed to produce both syngas and biochar. It is reported that at an optimum equivalence ratio (φ) of 0.25, the model could give its optimized energy efficiency and economic viability.
The previous investigations (Meyer et al., 2011; Yao et al., 2018) found that the quality of biochar was identified to be at its optimum level when the biochar co-production rate from the biomass gasification system was about10% by weight. Despite the potential use of biochar as a soil amendment, only few research works have examined the possibility of combined bio syngas and biochar co-production in biomass gasification systems (Shackley et al., 2012a; Shackley et al., 2012b; Ahrenfeldt et al., 2013). The previous investigations on IGFC/GT systems with biomass co-gasification (Promes et al., 2015; Thallam Thattai et al., 2017) have not included the production of biochar as a co-product in their studies.
Thus, the literature review clearly shows the knowledge gap existing between the role of biochar in negative emission technology (NET) as a part of BECCS and the possibility of biochar co-production in the biomass-based IGFC/GT power plants. In particular, to the best of the authors’ knowledge, the effect of biochar co-production on the energy-based performance and negative emission potential of the BIGFC/CCS systems has not been reported.
1.3 Contributions and Structure of the Research
This article presents a novel process scheme for co-producing biochar in a large-scale BIGFC/CCS system. The specific objective of the present research work is to develop thermodynamic models of negative-emission power plants based on BIGFC technology. These models are to be eventually used to carry out detailed exergy economic analysis (part of this series) in order to evaluate the techno-economic viability of such systems and if it is possible to come up with suggestions for economically viable process designs and operation strategies. Focus has been given to implementing a BECCS concept that could provide negative CO2 emissions while producing power with high efficiencies. The role of co-produced biochar addition to soil in order to enhance the negative carbon emission of the proposed system is an additional feature included with BECCS.
Thermodynamic models of the proposed system are based on the small-scale integrated biomass gasifier, SOFC, and gas turbine system developed by Aravind et al. (2009) and the redesigned large-scale IGFC configuration developed by Aditya et al. (Thallam Thattai et al., 2017). The thermodynamic model developed in the present work is tested with the two gasification agents—air and steam-oxygen—to find out its influence over its performance. Moreover, the oxy-combustion CO2 capture unit is coupled with the ion transport membrane (ITM) to minimize the direct CO2 emissions to explore the feasibility of achieving negative carbon emissions.
The detailed exergy analysis is carried out on the proposed system to investigate the effect of biochar yield on the system exergy efficiencies and negative CO2 emissions. In this study, chemical exergy of the biochar stream is considered along with thermo-mechanical exergy of the bio energy system, to offer a more comprehensive detail on energy and exergy resource allocation in the system (Cohce et al., 2011; Ohijeagbon et al., 2013).
The system thermodynamic study on biochar co-production in the BIGFC/CCS system is expected to contribute to the worldwide information available on biochar evaluation so far, as reported by the International Biochar Initiative and the European Biochar Certificate (IBI and EBC) (EBC, 2012; Initiative, 2012) so that complete data regarding the safety and quality of the biochar are obtained.
The remaining article is organized as follows: in Section 2, the system configuration/process scheme of the BIGFC/CCS system is described for the air and steam-oxygen gasification cases with their subsystems. Then the modeling approach and governing equations for the developed model are discussed in Section 3. The simulation results of the exergy and carbon deposition analysis of the BIGFC/CCS system for the air and steam-oxygen gasification cases are presented and discussed in Section 4. Finally, the research outcomes of the findings are reported in the last section. Supplementary Appendix SA depicts ternary-phase CHO diagrams for the air and the steam-oxygen gasification cases at various SOFC operating temperatures. Supplementary Appendix SB gives results of the steam-oxygen gasification case at various isentropic efficiencies of the gas turbine unit of the BIGFC/CCS system.
2 Process System Description
2.1 System Configuration—Air Gasification Case
2.1.1 Biomass Gasification and Gas Cleaning
The thermodynamic process scheme of the BIGFC/CCS system for the air gasification case is shown in Figure 1. The biomass gasifier is designed to operate at a gasification pressure of 25 bar since the fixed bed gasifier can typically operate in a pressure range of 25–30 atmospheres (Gray et al., 2016). This higher gasifier pressure is useful in utilizing the ion transport membrane (ITM) technology which would operate at a pressure range of 7–35 bar for generating oxygen (Park et al., 2011b). The ITM is a ceramic membrane which selectively separates oxygen from the high-pressure stream due to the partial pressure gradient for oxygen across the membrane. The biomass is assumed to be fed in to the system with a fixed flow of 20 kg/s. Table 1 shows the biomass feed stock composition (dry) used in the present system. The air composition (mol%) used in the study comprises 77.29% N2, 20.75% O2, 1.01% H2O, 0.03% CO2, and 0.92% argon.
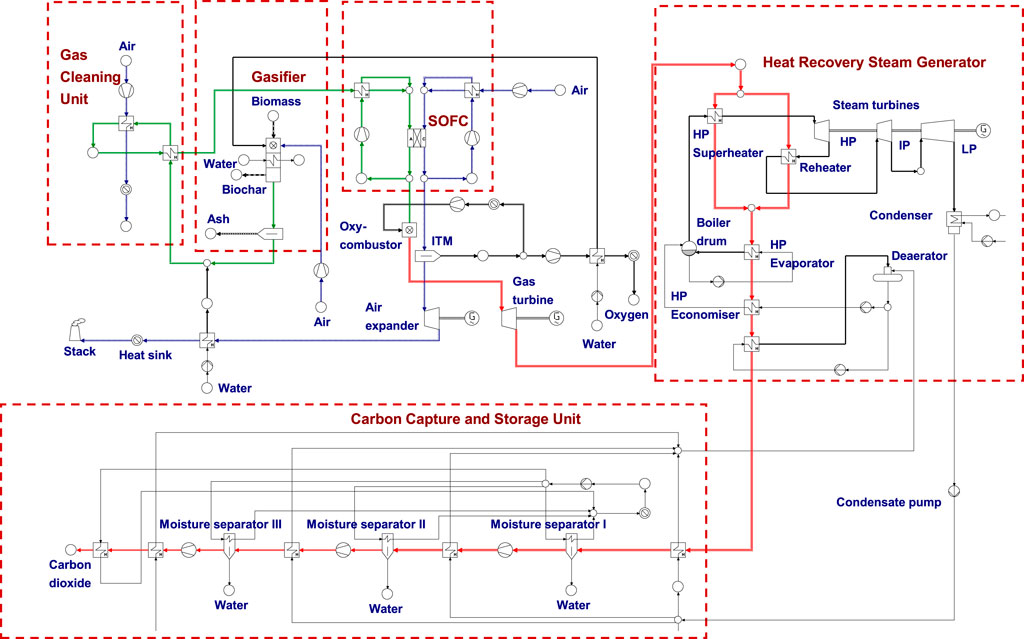
FIGURE 1. Process scheme of the BIGFC/CCS system for the air gasification case—green streams represent syngas flow, red streams represent flue gas, and blue streams represent air flow. (For interpretation of the references to color in this Fig. legend, the reader is referred to the web version of this article).
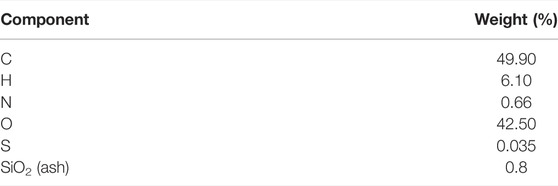
TABLE 1. Biomass feedstock composition (dry) used.
A separator is additionally attached with the gasifier to receive biochar, which was considered as an unconverted carbon in the previous works (Aravind et al., 2009; Thallam Thattai et al., 2017). There is no significant quantity of tar produced in the system, as the gasifier is provided with a catalytic reforming section before its outlet with an assumption of attaining a gas composition closer to that of equilibrium conditions. The bio syngas from the gasifier exit is added with 8.67% of preheated steam (of the bio syngas flow by mass) to avoid the risk of carbon deposition. Then it is allowed to pass through a set of two heat exchangers where its temperature is reduced to 600oC for HCl and H2S cleaning. With the help of a sodium carbonate–based reactor and zinc titanate–based reactor, HCl and H2S cleaning is carried out (Aravind et al., 2009).
The bio syngas composition is assumed to remain unchanged when passing through the gas cleaning unit while the contaminants are removed. But the effect of pressure drop is considered in the gas cleaning unit.
2.1.2 SOFC—Gas Turbine System
Table 2 shows the important design and geometric parameters of the SOFC model which are selected based on the standard performance.
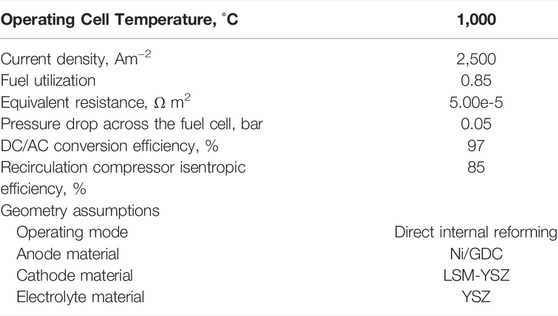
TABLE 2. Important operating parameters of the SOFC model.
The cleaned bio syngas is directly supplied to the anode of the SOFC. The cathode inlet air temperature should not be significantly lower than the operating temperature of the SOFC to maintain its reliability.
Assuming the syngas internal reforming within the stack of the SOFC, its performance is enhanced by allowing portions of the anode and cathode exit streams to recirculate in their respective sides (Khaleel et al., 2003). The remaining part of the anode and cathode exit streams is directed to the oxy-fuel combustor and ITM, respectively. In this system, the anode and cathode exhaust streams (of the SOFC) are unmixed to make the process inherently CO2 capture–friendly, as reported by Adams and Barton (Adams and Barton, 2010). Table 3 shows the values for important parameters used in the system calculations.
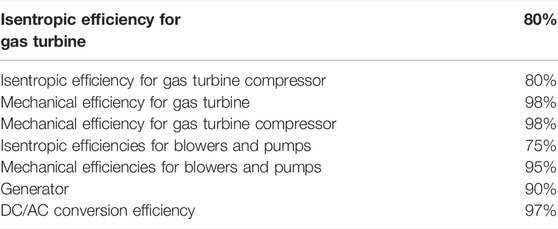
TABLE 3. Important operating parameters assumed for the gas turbine unit.
2.1.3 Oxy-Fuel Combustion System for CO2 Capture
The fuel gas from the anode outlet and separated oxygen from a cathode outlet air stream using the ITM are fed into the oxy-fuel combustor. The oxy-fuel combustor is modeled with an air-fuel equivalence ratio (φ) of 1.1. Combustion products from this combustor are expanded in a gas turbine (GT) to produce power output. Since the gas turbine exit gas temperature is sufficiently high (about 900°C), a heat recovery steam generator system (HRSG) is designed to recover a certain amount of heat from the exhaust gas.
As the separated oxygen at the ITM exit is closer to the ambient pressure, its pressure is increased to the combustor pressure using a compressor. In order to reduce the work required to compress the oxygen stream, a heat sink is placed before the compressor that absorbs heat from the hot oxygen stream at 1,000°C such that the exit temperature is reduced to 200°C. Table 4 shows the important design parameters used in the oxy-fuel combustion CO2 capture model.
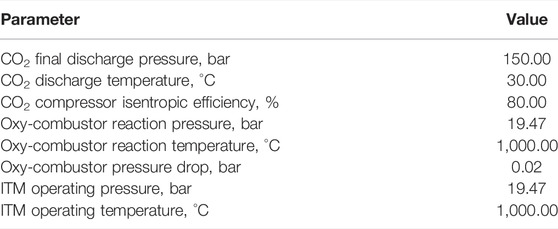
TABLE 4. Important design parameters for the oxy-combustion CO2 capture unit.
2.1.4 Air Expander and Heat Recovery System
The oxygen-depleted air stream from the outlet of the ITM is fed into the air expander, where it is expanded to produce the power output. A heat sink is provided to recover the waste heat carried by the hot flue gas before it is exhausted to the atmosphere through the stack. The recovered heat in the sink might be utilized for the other process heating applications such as food processing.
2.1.5 Heat Recovery Steam Generator System
The HRSG is used to generate the steam required for operating the bottoming steam cycle. In this system, a total of five heat exchanging regions can be distinguished; two super heaters, in which one is designed at high pressure and the other one is designed as a reheater at an intermediate pressure, which have been simulated to operate in parallel; one high pressure evaporator; a high pressure economizer; and a condensate preheater. The temperature of the flue gas at the exit of the HRSG is kept above 100 °C so that its condensation could be prevented (ThallamThattai et al., 2016).
2.1.6 Carbon Capture and Storage Unit
The flue gas from the HRSG is designed to enter the CCS unit in which a 3-stage compression process with intercooling is utilized to compress the CO2 stream up to 150 bar. At each stage, compressor exit gas is intercooled to 30°C as it could reduce the power requirements in the compression process.
In the CCS unit, the gaseous mixture is fed into the moisture separator, where a certain amount of the water vapour is condensed and separated in a sink. Then the gas mixture is taken for subsequent stages of compression, intercooling, and moisture separation processes. Finally, the pure CO2 captured in this process is stored at a pressure of 150 bar and at a temperature of 30°C in a supercritical liquid state.
2.2 System Configuration – Steam-Oxygen Gasification Case
Figure 2 shows the process scheme for the steam-oxygen gasification case of the BIGFC/CCS system. The steam-oxygen gasification is chosen in the system since the absence of nitrogen in steam may reduce exergy destruction in the gasifier (Shackley et al., 2012b).
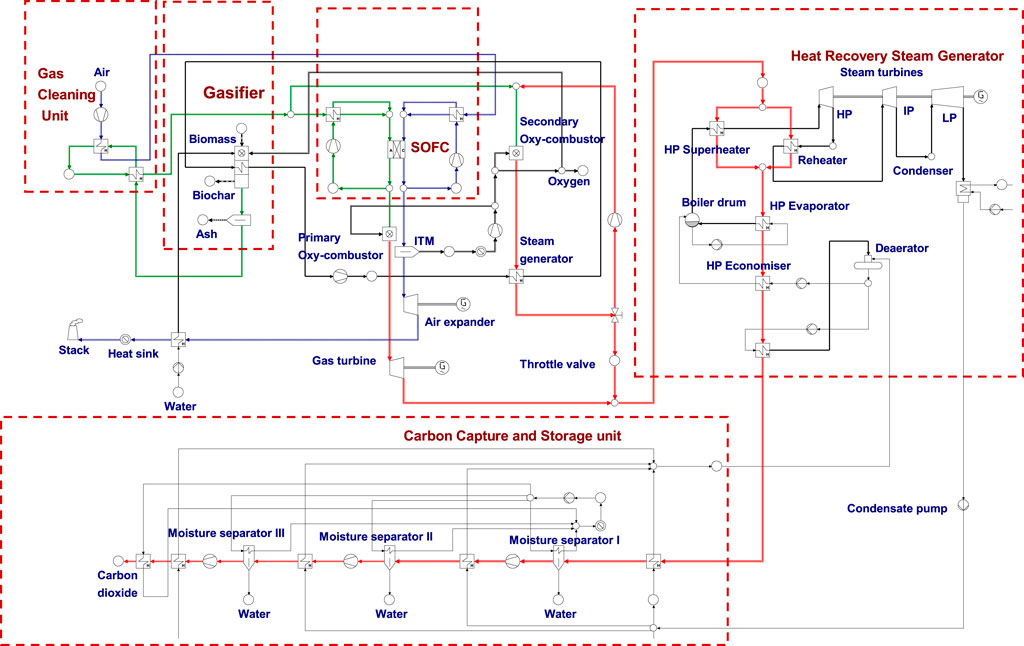
FIGURE 2. Process scheme of the BIGFC/CCS system for the steam-oxygen gasification case—green streams represent syngas flow, red streams represent flue gas, and blue streams represent air flow. (For interpretation of the references to color in this Fig. legend, the reader is referred to the web version of this article).
In this gasification case, the steam addition with the syngas from the gasifier exit is not required since the use of steam-oxygen as a gasification agent reduced the carbon deposition risks. However, this assumption is not applicable for the lower temperatures as it increases the risk of coking. Since the steam gasification is an allothermal process, it requires external heat to drive endothermic reaction in the gasifiers. A secondary oxy-fuel combustor is provided to meet this kind of heating requirement.
2.2.1 Secondary Oxy-Fuel Combustion System for Steam Generation
A part of the cleaned biosyngas is fed into the secondary oxy-fuel combustor as shown in Figure 2. It is allowed to mix with the recirculated portion of the flue gas from the secondary oxy-fuel combustor with a recirculating ratio of 0.75. The maximum operating temperature in the combustor (in the range of 1,500–1700°C) is limited by means of recirculating the flue gas. The syngas in the secondary oxy-combustor reacts with oxygen separated from the ITM. The hot flue gas from the secondary oxy-combustor is fed in to the heat exchanger where the heat of the gases is used to generate steam which is designed to circulate through the gasifier. The steam from the gasifier is again recirculated after passing through the heat exchanger where it recovers the heat of the oxygen-depleted air stream from the air expander.
The hot flue gas from the secondary oxy-combustor is throttled to the exit pressure of the gas turbine before it is mixed with the gas from the gas turbine. Then the gaseous mixture is passed through the HRSG and the CCS unit to recover heat and to capture CO2 as discussed in the air gasification case.
3 Modeling Approach and Governing Equations
Thermodynamic evaluations of the two gasification cases of the BIGFC/CCS system in this study are carried out with the help of modeling software known as Cycle-Tempo, developed at TU Delft (van der SteltT Woudstra and Colonna, 2018). The mass and energy balances of all the devices used in the process scheme are assessed. A system matrix developed based on this approach is solved to obtain the thermodynamic results of the given process scheme.
Cycle-Tempo uses the Gibbs energy minimization procedure to compute the compositions of gas at the exit of the gasifier, oxy-combustor, and SOFC internal reforming. The amount of cooling required to keep a fixed outlet temperature at the exit of the SOFC determines the mass flow of air at the cathode inlet (Asimptote, 2014).
For the present calculations, cell resistance is taken as
Here,
The current flow calculated in this manner is used to find the oxygen flow from the cathode to the anode
• Reversible voltage (
• Current density
• Molar concentration
The fuel cell voltage is equal to the reversible voltage when it is assumed that there are no losses during the electrochemical processes in a cross-section x of the SOFC. The reversible voltage or Nernst voltage of the SOFC, if the gases are supposed to behave ideally, is given as follows:
where
where
where
The relationship among the current flow, utilization factor, and the reversible voltage of the SOFC is given by Eq. 5.
where I is the total current, A is the cell area, and
The mass balance relations of the SOFC are shown in Eqs 6, 7 as follows:
The air flow rate at the cathode inlet is denoted by
where
The specific enthalpy of the gaseous stream at the outlet
where
Similarly, the specific enthalpy of the gas at the outlet of the compressor is calculated using Eq. 10 in order to determine the power required to drive the compressor.
The equations for calculating the power consumption for the CCS unit are obtained from the study by Park et al. (2011a) as shown in Eqs 11–13.
where
where
4 Results and Discussion
The bio syngas composition obtained (without biochar co-production) from the model calculation of the air gasification case and steam-oxygen gasification case are given in Table 5. It is clear that the type of gasification agent significantly affects the syngas composition and the lower heating value of syngas. The bio syngas formed through the steam-oxygen gasification case has higher LHV as shown in Table 5 because its molar concentrations of H2, CO, and CH4 are higher than those of the air gasification case (Santhanam et al., 2016).

TABLE 5. Biosyngas composition (mol%) from the model calculations of air and steam-oxygen gasification cases.
The performance of the BIGFC/CCS system using air and steam-oxygen as gasification agents is assessed by the results obtained through the Cycle-Tempo model calculations as shown in Table 6. The thermal energy input to both the gasification cases is kept constant (320 MWth) so that it would be convenient to draw a comparison of various design/operating parameters between them.
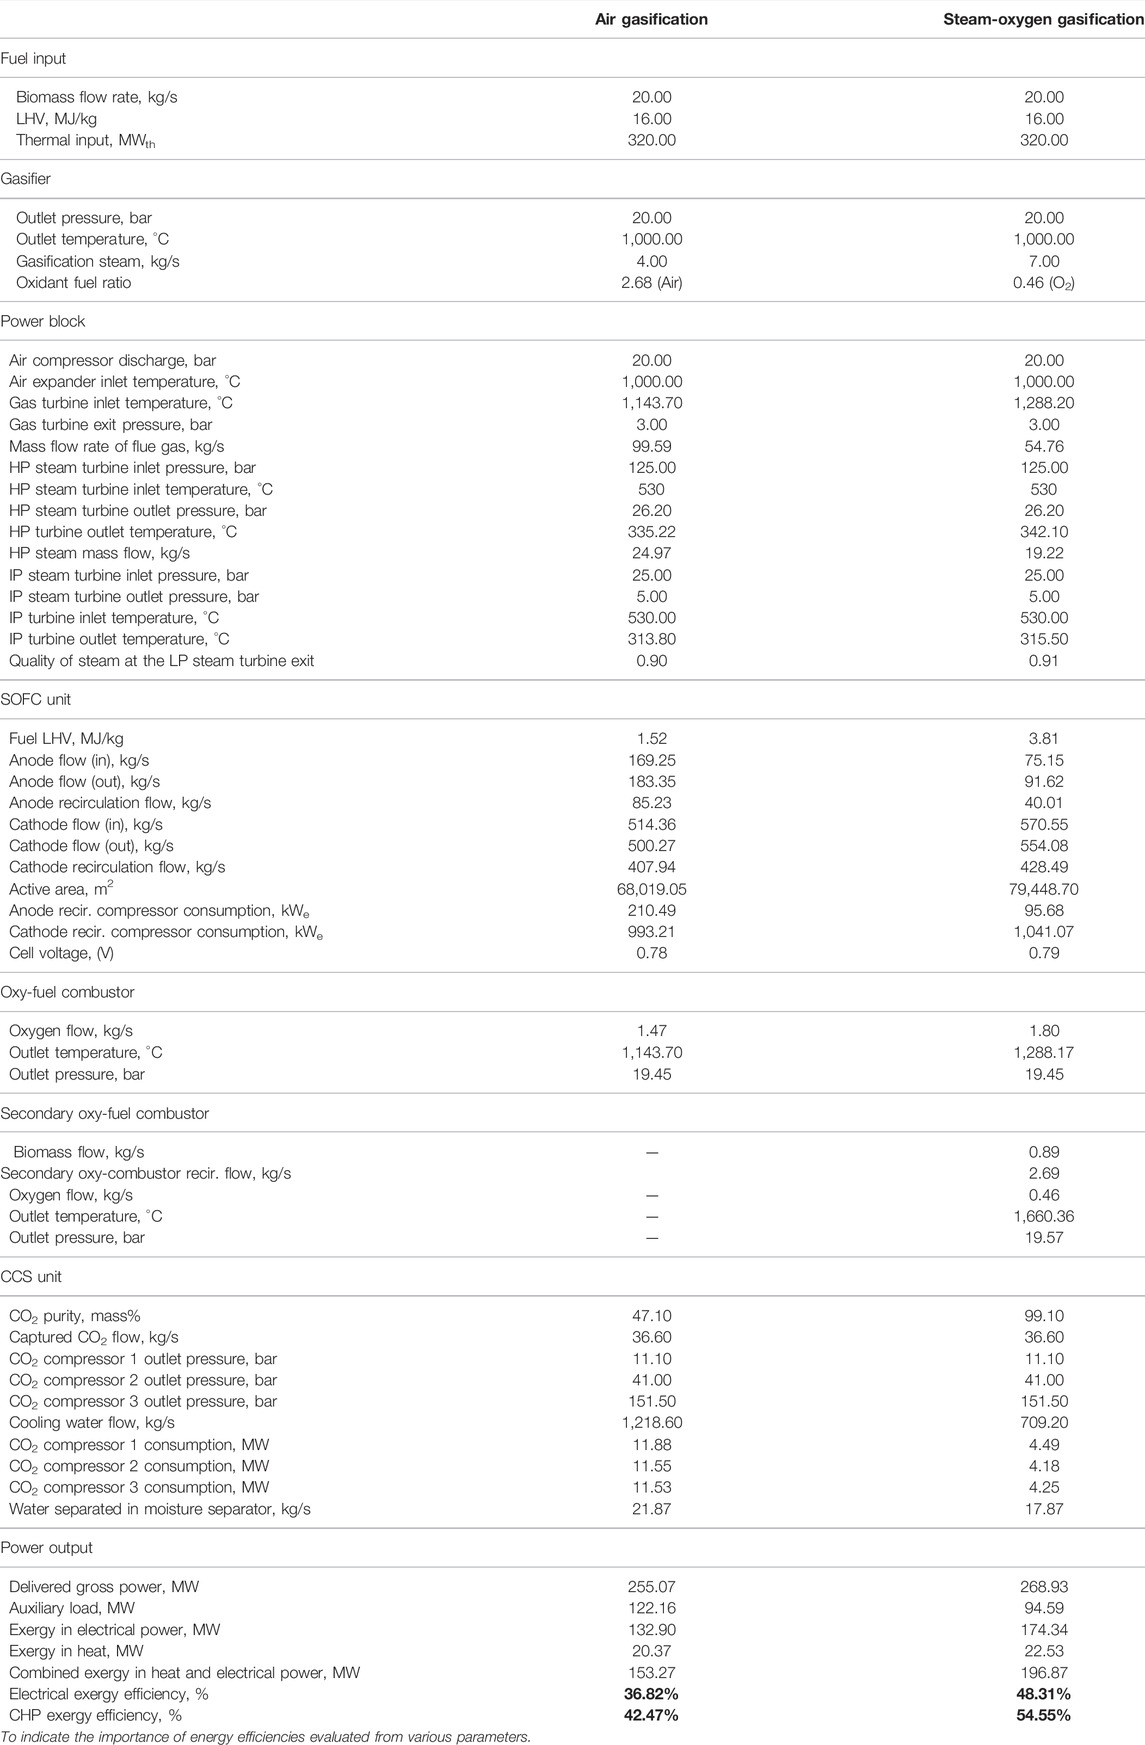
TABLE 6. Model results of the air gasification case—a comparison with the steam-oxygen gasification case.
In the steam-oxygen gasification case, the air flow to the SOFC is increased to 570.6 kg/s (compared to 514.4 kg/s in the air gasification case) due to the higher cooling requirements of the SOFC. In the air gasification case, the SOFC unit develops an electrical power output of 127.9 MWe, which accounts for about 83.4% of the electrical power output of the power plant. In the steam-oxygen gasification case, the SOFC develops an electrical power output of 154 MWe, which accounts for about 78.2% of the electrical power output of the power plant. The notable differences could be seen between the air and steam-oxygen gasification cases with respect to the power output of the gas turbine, air expander, and bottoming steam cycle. The GT produces a power output of about 26.4 MWe for the steam-oxygen gasification case; a 42.2% decrease compared to the air gasification case (45.7 MWe), also related to the lower mass-flow of flue-gas. But the air expander (AE) produces a power output of 59.7 MWe for the steam-oxygen gasification case; a 35.4% increase compared to the air gasification case (44.1 MWe) due to the increase in the mass flow rate of air for the steam-oxygen gasification case to 109.4 kg/s from 81.9 kg/s for the air gasification case.
The bottoming steam cycle produces 28.7 MWe for the steam-oxygen gasification case; a 23.3% reduction compared to the air gasification case (37.4 MWe). The steam produced in the HRSG for the steam-oxygen gasification case is around 19.22 kg/s, which is lower than that of the air gasification case, which corresponds to 24.97 kg/s. This is because of the reduced mass flow rate of flue gas to the HRSG (54.8 kg/s) due to the absence of nitrogen in the syngas in the steam-oxygen gasification case.
The auxiliary load in the air gasification case (122.2 MW) is about 29% higher than that in the steam-oxygen gasification case (94.6 MW) mainly due to the higher power consumption in the three-stage CO2 compression in the CCS unit. It is due to the negligible amount of nitrogen in the flue gas entering the CCS unit, which reduces its compression work and heat recovery for the steam-oxygen gasification case (Li and Yan, 2007). Due to the absence of nitrogen in the bio syngas, the CCS unit has the higher purity of CO2 captured (99.1% by mass) in it compared to the air gasification case (47.1% by mass) as shown in Table 6.
The power consumption for the anode recirculation fan in the steam-oxygen gasification case is much lower than that in the air gasification case due to the lower gas flow rates. But, the power consumption for the cathode recirculation fan in the steam-gasification case is much higher than that in the air gasification case due to the higher gas flow rates.
An exergy efficiency of about 43% is obtained with the air gasification case while the exergy efficiency is about 55% with the steam-oxygen gasification case. The reduced auxiliary power consumption in the steam-oxygen gasification case compared to the air gasification case led to an increase in its exergy efficiency.
The anode outlet gas/fuel gas composition from the SOFC unit for the air and the steam-oxygen gasification case is shown in Table 7. As seen from Table 7, the LHV of the anode exit gas is significantly low for both the air gasification case and the steam-oxygen gasification case (primary oxy-combustor). The oxy-fuel combustor is assumed to be able to burn the low-LHV fuel, since the gases enter the combustor at higher temperatures. The subsequent power production to the SOFC in the GT, the AE, and the bottoming steam cycle is decreased notably because of the reduced thermal input to the oxy-fuel combustor.
TABLE 7. Anode outlet gas/fuel gas composition (mol%), inlet to oxy-fuel combustor.
In case of the steam-oxygen gasification (secondary oxy-combustor), the LHV of the gaseous mixture entering the secondary oxy-combustor is reduced (from 7.56 MJ/kg corresponding to the LHV of cleaned bio syngas to 1.89 MJ/kg) since the syngas is mixed with a recirculated portion of the flue gas in order to maintain the temperature within the allowable range.
4.1 Carbon Deposition Analysis
The bio syngas and CO lead to the formation of solid carbon deposits on Ni-based anodes when they decompose in SOFCs. The carbon deposition/coking in the SOFC decreases the active area of the SOFC, which increases the polarization resistance that affects the electrochemical performance of the anode (Thallam Thattai et al., 2017). Hence, avoiding the risk of carbon deposition in the anode inlet/outlet pipes is a major challenge while syngas is flowing through the SOFCs (Kuhn and Kesler, 2014; Kuhn and Kesler, 2015).
Since Ni-GDC is the assumed anode material in the present study as shown in Table 2, it is necessary to perform the carbon deposition analysis to indicate any risk associated with it. The inlet and outlet pipes of the anode are selected to perform carbon deposition analysis as shown in Table 8.
TABLE 8. Operating conditions of the SOFC to assess the risk of carbon deposition.
Theoretical boundary limits for carbon deposition are represented in the C-H-O ternary phase diagram under thermo-chemical equilibrium conditions (Chen et al., 2011). The C-H-O ternary phase diagram is drawn using the software Factsage (Bale et al., 2018) for the air and steam-oxygen gasification cases as shown in Figure 3, based on the equilibrium calculations performed for the chosen operating conditions of the SOFC as shown in Table 8.
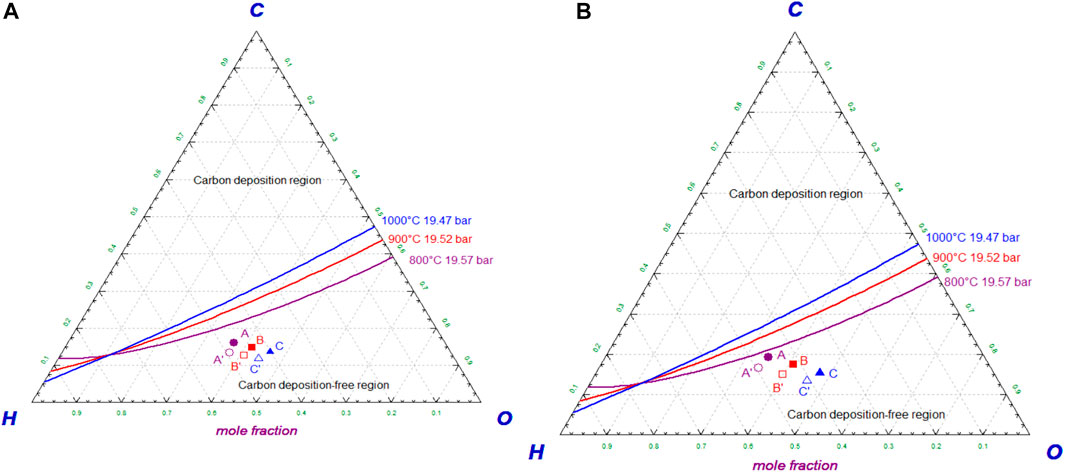
FIGURE 3. (A) C-H-O ternary phase diagram showing equilibrium curves and operating conditions of the SOFC for the air gasification case. (B) C-H-O ternary phase diagram showing equilibrium curves and operating conditions of the SOFC for the steam-oxygen gasification case.
Figures 3A,B show the C-H-O ternary phase diagrams for the air gasification case and steam-oxygen gasification case, respectively. The operating conditions A, B, and C as shown in Table 8 are represented by three equilibrium curves in violet, red, and blue color, respectively, on the diagram. Since all the operating points are well below the corresponding equilibrium curves as seen from Figures 3A,B, the operating conditions of the SOFC are said to be theoretically safe for both the air and the steam-oxygen gasification cases, respectively.
In the actual operating conditions of the SOFC, the carbon deposition risk is also assessed based on reaction/surface conditions in pipes, residence time, etc. It is reported that process engineers at the Willem-Alexander Centrale (WAC) power plant in the Netherlands have not observed any potential risk of coking in the upstream pipes of the syngas preheaters and SOFC (Thallam Thattai et al., 2017). Thus, these pipes in the system of both the gasification cases are assumed to be free from the risk of carbon deposition. However, a test with the system should ensure this assumption.
A, B, and C points correspond to the air gasification case without biochar co-production.
A′, B′, and C′ points correspond to the air gasification case with biochar co-production of 10% by weight.
A, B, and C points correspond to the steam-oxygen gasification case without biochar co-production.
A′, B′, and C′ points correspond to the steam-oxygen gasification case with biochar co-production of 10% by weight.
4.2 Exergy Analysis
The thermodynamic evaluation of the BIGFC/CCS system for both the air and the steam-oxygen gasification cases is carried out by identifying the exergy losses of the various devices used in it (Moran and Shapiro, 2006). The exergy losses are calculated for all the process streams/devices in the system by considering their various modes of exergy transfer with the environment like heat, work, and matter (Woudstra, 2012).
It is to be noted that the losses of irreversible thermodynamic processes (entropy generation) within the system boundaries of the system represent the exergy destruction of the system (Tsatsaronis, 2007). The inlet exergy of the biomass flow is calculated using a method described by Baehr using Cycle-Tempo (Baehr, 1966).
The different relations are used to find the electrical exergy efficiency and the combined heat and power exergy efficiency for both the air and steam-oxygen gasification cases of the BIGFC/CCS system. They are given as follows:
where
In this study, exergy efficiency relations in Eqs 14, 15 are based on its actual exergy input by excluding the chemical exergy of the biochar co-produced in the BIGFC/CCS system. This work focuses only on the use of co-produced biochar as a soil amendment to enhance the negative carbon emission potential of the system. However, the exergy efficiency relations Eqs 16, 17 could be used alternatively, by considering the co-produced biochar as a useful product of the system.
4.2.1 Air Gasification Case
Exergy loss in the system is divided into the following subsystems: 1) biomass gasifier, 2) gas cleaning unit, 3) SOFC unit, 4) GT unit, 5) oxy-fuel combustor, 6) stack, 7) HRSG, 8) steam turbine, and 9) CCS unit. The exergy flow diagram for the air gasification case is shown in Figure 4A.
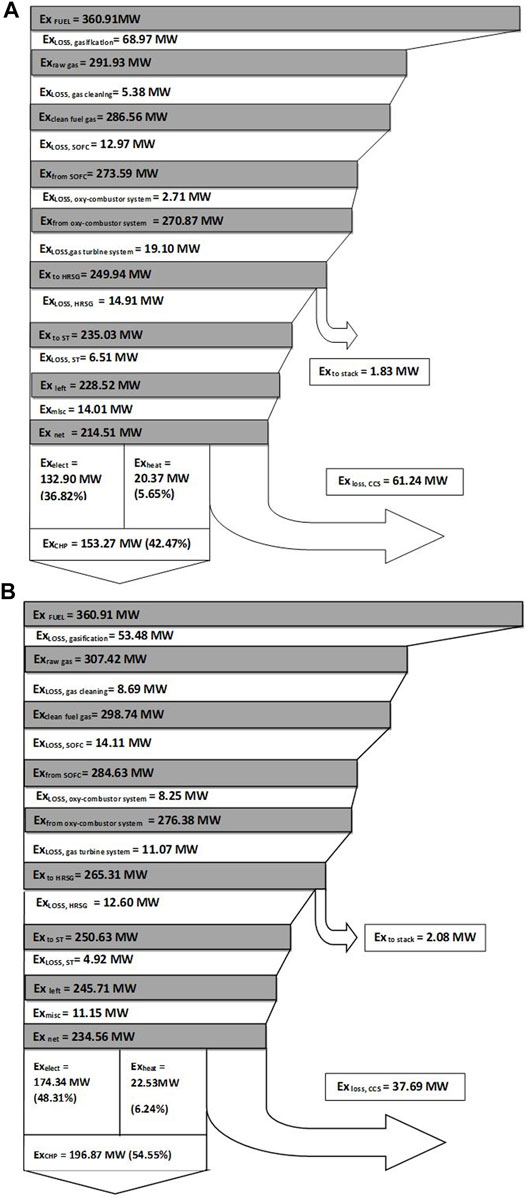
FIGURE 4. (A) Exergy flow diagram for the air gasification case. (B) Exergy flow diagram for the steam-oxygen gasification case.
It is calculated that 36.8% of the inlet exergy (360.91 MW) will leave the system as electricity and 5.7% as exergy with heat, and 17% will leave as exergy in the compressed carbon dioxide.
The major exergy loss in the system is due to the gasification process, which accounts for 19% of the inlet exergy. The production of hot gaseous fuel from the cold biomass feedstock and a part of the unconverted carbon results in large exergy loss in the gasifier unit (Prins and Ptasinski, 2005; Liu et al., 2011).The exergy loss/destruction in the gasification process is obtained by subtracting the exergy value of bio syngas from the inlet exergy values of biomass, steam, and air.
The exergy loss in the gas cleaning unit is determined by adding the exergy losses of the bio syngas stream and the cooling fluid used. The exergy loss of the gas cleaning unit is relatively low (about 1.5%) due to the lower content of impurities in the bio syngas. The SOFC system accounts for 3.6% of the total exergy losses. The exergy loss of the gas turbine unit which includes the GT, AE, air compressors, and water pump accounts for 5.3% of the inlet exergy.
For the oxy-fuel combustor, the exergy loss is defined as the difference in total exergy of the supplied unburned gas (from the fuel cell) and oxygen at the inlets and the exergy value of the flue-gas at the exit of the combustor. Exergy destruction (0.8%) in the combustor occurs because, even though the temperature of the combustor is quite high, this is a location where fuel is oxidized. The HRSG exergy loss accounts to 4.1%, which includes a set of heat exchangers such as an economizer, an evaporator, and superheaters used to generate steam.
Steam turbines in the bottoming steam cycle attached with the HRSG accounts for 1.8% of the exergy losses. The miscellaneous losses of the system are around 3.9% of the exergy losses. The CCS unit contributes about 17% to the total exergy added to the system. It has two principal reasons for the high exergy losses (Park et al., 2011a), which are as follows:
1) It uses a combination of heat exchangers which are used to intercool the gas mixture and to cool it at the end of the process.
2) The CO2 is captured at a high pressure of 150 bar in the CCS unit. This high pressure is required to create enough storage capacity for the captured CO2 in the geologic reservoir.
The exergy needed to sequester the CO2 is treated as exergy destruction despite the fact that it could be used for EOR (Enhanced Oil Recovery) (Siefert and Litster, 2013). Exergy loss in the exhaust stack (air) is insignificant (<0.5%) in the system.
4.2.3 Steam-Oxygen Gasification Case
The exergy flow diagram for the steam-oxygen gasification case is shown in Figure 4B. It is calculated that 48.3% of the inlet exergy (360.91 MW) will leave the system as electricity and 6.2% as exergy with heat, and 10.4% will leave as exergy in the compressed carbon dioxide.
The exergy loss in the CCS unit decreases to 10.4% for the steam-oxygen gasification (from 17% in the case of air gasification) due to the absence of nitrogen dilution in the flue gas, which reduces the compression work and associated exergy losses (Liu et al., 2011). Moreover, the exergy loss in the gasifier decreases to 14.8% for the steam-oxygen gasification from 19.1% in the case of air gasification. It is due to the allothermal gasification in the steam-oxygen case which reduces the irreversibility losses associated with heat generation in the gasifier in the case of air gasification (Colpan et al., 2010).
The exergy loss in the oxy-fuel combustor unit increases to 2.3% for the steam-oxygen gasification from 0.8% in the case of air gasification. The higher exergy loss is due to the secondary oxy-combustor which is provided to meet the additional heating requirements in the gasifier. From the exergy analysis of both air and steam-oxygen gasification cases it can be seen that the steam-oxygen gasification case provides a reasonably better performance in terms of electrical exergy efficiency and CHP exergy efficiency.
4.3 Sensitivity Analysis
4.3.1 Effect of Biochar Co-Production on the Performance of the System
The biochar co-production in the biomass gasifier is designed within the range of 10% by weight since the quality of biochar is found to be optimum up to this limit (Meyer et al., 2011; Yao et al., 2018). This is simulated by separating the carbon element (C) by mass with respect to the incoming biomass flow in the gasifier. Table 9 shows the exergy efficiency analysis in each gasification case with respect to the biochar co-production.
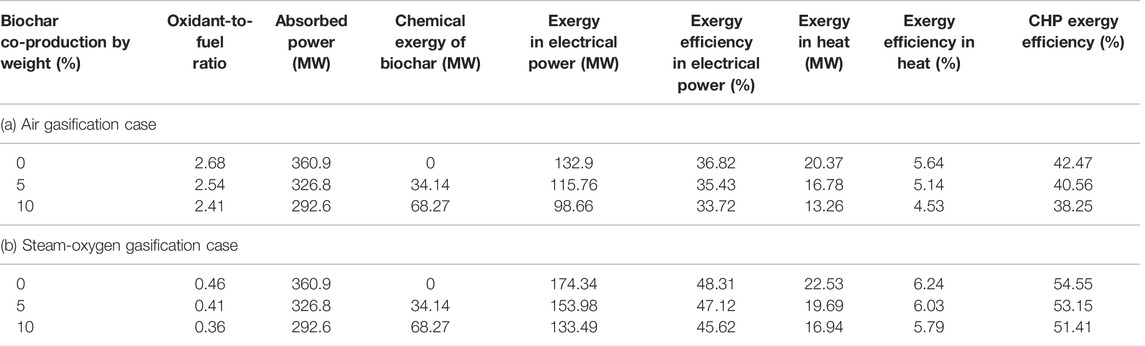
TABLE 9. Exergy analysis in each gasification case with respect to the biochar co-production.
Since the biochar is separated out from the gasifier, it reduces the oxidant requirement to provide the heat for the endothermic reaction in the gasification process. The concentration of incombustible gas such as CO2 in the bio syngas is higher when excess oxidant is fed in to the gasifier (Biomass, 2010). Hence, the oxidant-to-fuel ratio (based on the incoming biomass) is reduced for the gasifier as shown in Table 9. This, in turn, helps to maintain the fixed outlet temperature and quality of the bio syngas (related to its LHV) when the biochar is co-produced in the system.
When the biochar co-production increases from 0 to 10% by weight, the oxidant-to-fuel ratio of the gasifier is reduced from 2.68 to 2.41 in the air gasification case and from 0.46 to 0.36 in the steam-oxygen gasification case, respectively.
The results indicate a general trend. The exergy efficiency components of power and heat are observed to decrease when the biochar co-production increases. The chemical exergy of the biochar is excluded from the inlet exergy of the biomass to determine the exergy efficiencies of the system as defined by Eqs 14, 15. The CHP exergy efficiency of the system decreases from 42.5% to 38.3% for the air gasification case and 54.6%–51.4% for the steam-oxygen gasification case (when the biochar co-production in the biomass gasifier increases from 0 to 10% by weight), respectively. However, the exergy efficiencies of the system would be higher with respect to biochar co-production when the biochar is considered as a useful product of the system as defined by Eqs 16, 17.
Table 10 gives an overview of energy (first law) and exergy (second law) analyses for the steam-oxygen gasification case in comparison with the air gasification case with respect to biochar co-production of 10% by weight from the gasifier.
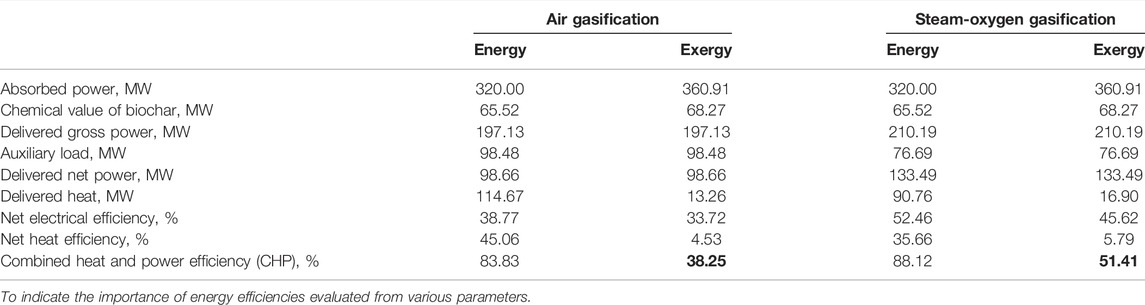
TABLE 10. Energy and exergy analyses for biochar co-production of 10% by weight: comparison between the steam-oxygen gasification and the air gasification.
For the 10% biochar co-production case, an exergy efficiency of about 38% and of around 51% is obtained with the air gasification case and with the steam-oxygen gasification case, respectively, as shown in Table 10. The exergy flow diagram for the air gasification case with 10% (by weight) biochar co-produced in the BIGFC/CCS system is shown in Figure 5A. The electrical and CHP exergy efficiencies of the system are estimated to be 33.72% and 38.25%, respectively, using Eqs 14, 15, respectively, as shown in Figure 5A. It is also estimated that 18.92% and 14.9% of the inlet exergy (360.91 MW) will leave the system as chemical exergy of biochar and as compressed carbon dioxide, respectively.
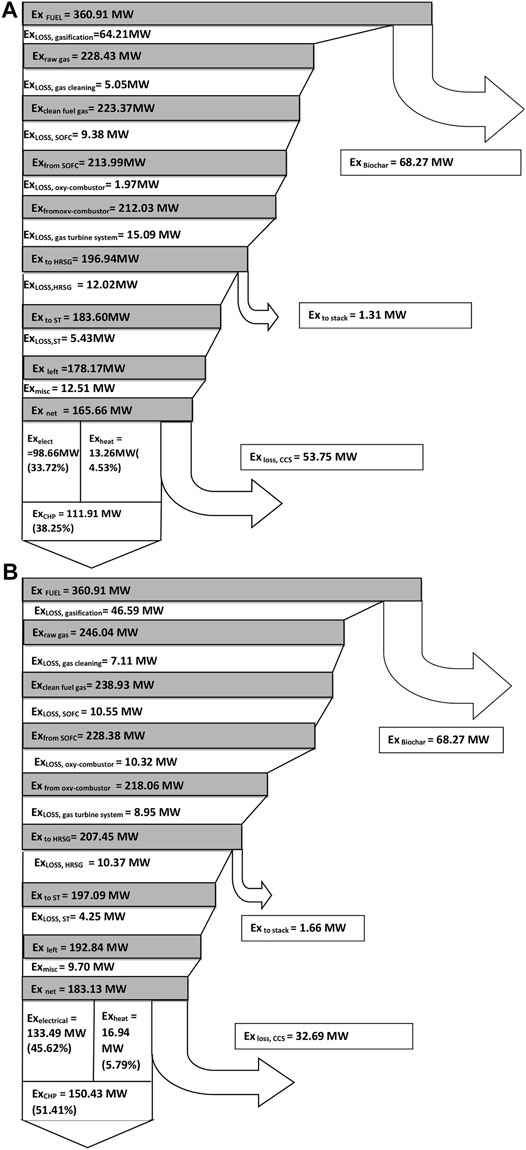
FIGURE 5. (A) Exergy flow diagram for the air gasification case with 10% biochar co-production. (B) Exergy flow diagram for the steam-oxygen gasification case with 10% biochar co-production.
The exergy flow diagram for the steam-oxygen gasification case if 10% (by weight) biochar is co-produced in the BIGFC/CCS system is shown in Figure 5B. In this case, the electrical and CHP exergy efficiencies are estimated as 45.62% and 51.41%, respectively, using Eqs 14, 15, respectively, as shown in Figure 5B. It is also estimated that 18.92% and 9.1% of the inlet exergy (360.91 MW) will leave the system as chemical exergy of biochar and as the compressed carbon dioxide, respectively.
The CHP exergy efficiency decreases by about 4% for the air gasification case and about 3% for the steam-oxygen gasification case when the biochar co-production increases from 0 to 10% by mass, respectively. It is due to the higher exergy loss in the CCS unit of the air gasification case compared to the steam-oxygen gasification case while the biochar is co-produced.
4.3.2 Effect of Biochar Co-Production on the Major Exergy Losses
The sub systems such as the gasifier, CCS unit, and oxy-combustor are identified as the major contributors to the exergy loss of the BIGFC/CCS system. Figures 6A–C show the variation of these major exergy losses (with respect to the inlet exergy of the system that corresponds to 360.91 MW) for the stepwise biochar co-production (up to 10% by mass) in the air gasification case and the steam-oxygen gasification case, respectively.
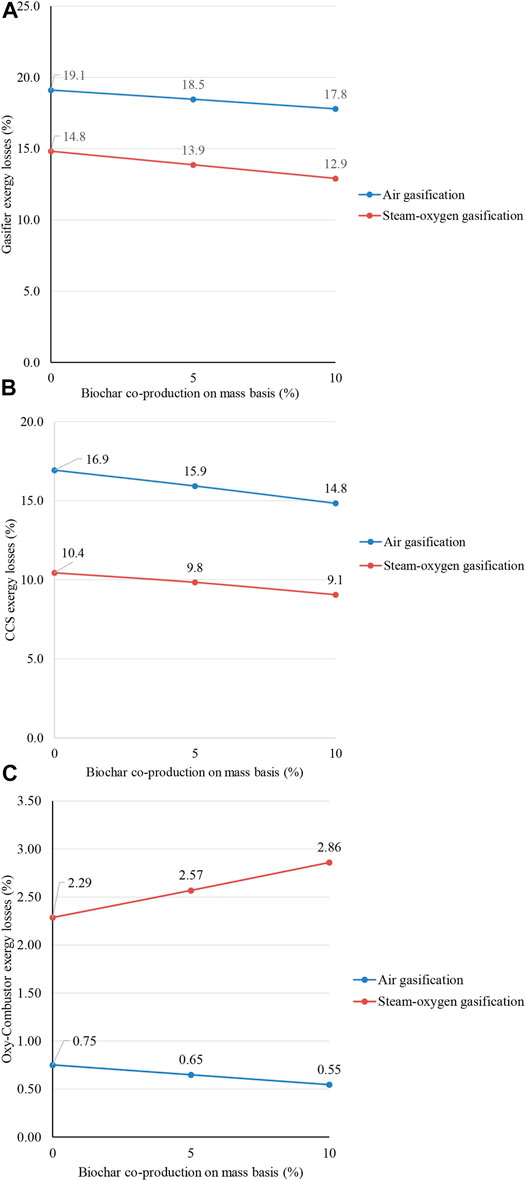
FIGURE 6. (A) Effect of biochar co-production on the gasifier exergy loss. (B) Effect of biochar co-production on the CCS exergy loss. (C) Effect of biochar co-production on oxy-fuel combustor exergy loss.
As the biochar co-production reduces the gasification reactions in the gasifier as well as the syngas output from the gasifier, the exergy loss in the gasifier and CCS unit are subsequently reduced as shown in Figures 6A,B, respectively. The oxy-fuel combustor system in the steam-oxygen gasification case causes an increase in exergy loss with respect to biochar co-production as shown in Figure 6C, due to the higher heat production in the secondary oxy-fuel combustor, in order to balance the heat requirements of the gasifier.
4.3.3 Effect of Biochar Co-Production for the Given Electrical Power Output
Table 11 shows the effect of biochar co-production on the exergy efficiency for the given electrical power output in each gasification case.
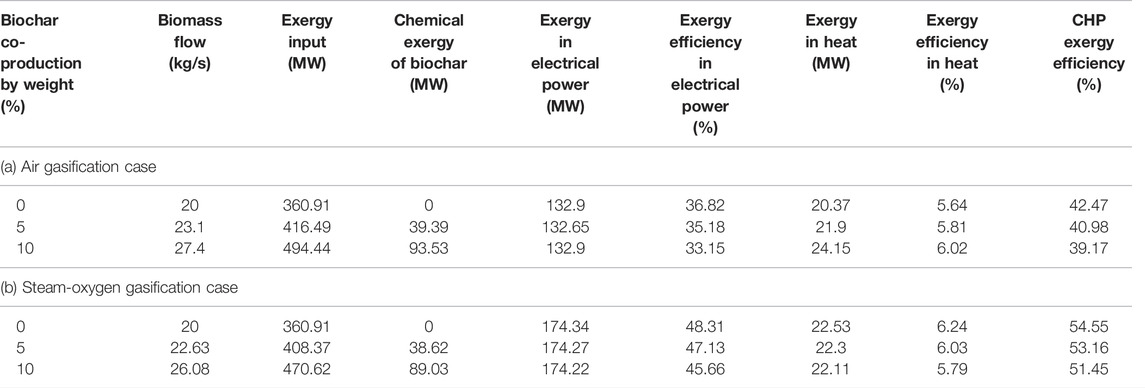
TABLE 11. Effect of biochar co-production for the given electrical power output in each gasification case.
It is clear from Table 11 that the exergy efficiency components remain unchanged for the given electrical power output that corresponds to the base cases (132.9 and 174.3 MW for the air gasification base case and the steam-oxygen gasification base case, respectively). The isentropic efficiencies of turbines and compressors are the only parameters depending on the size of the system. Since the change in biomass flow in the system concerns a smaller part of the power, the size of the system has a limited effect on the system efficiency.
4.3.4 Effect of Various SOFC Operating Temperatures on CHP Exergy Efficiency
The performance of the BIGFC/CCS system is further studied by examining the impact of SOFC operating temperatures on the CHP exergy efficiency.Figures 7A,B show the effect of biochar co-production on the CHP exergy efficiency for the air gasification and the steam-oxygen gasification cases for three different operating temperatures of the SOFC (i.e., 800, 900, and 1,000°C), respectively. The figure shows that the performance of the system decreases by lowering the operating temperature of the SOFC. The reduction in SOFC operating temperature leads to the reduction in inlet temperature for the downstream section of the SOFC such as the oxy-combustor, gas turbine, and HRSG and, subsequently, to the CCS.
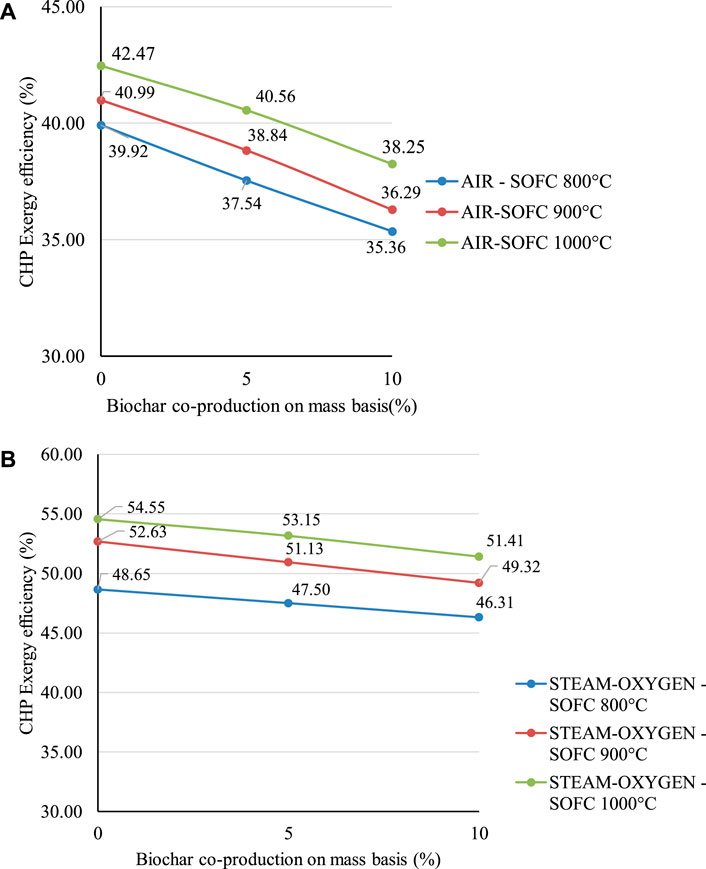
FIGURE 7. (A) Effect of different operating temperatures of the SOFC on CHP exergy efficiency for the air gasification case. (B) Effect of different operating temperatures of the SOFC on CHP exergy efficiency for the steam-oxygen gasification case.
The reduced inlet temperature at the oxy-fuel combustor leads to a lower equivalent temperature of heat production in the oxy-combustor which results in higher exergy destruction in it. The reduced inlet temperature of the gas turbine, for the given isentropic efficiency and pressure ratio, leads to a higher entropy-increase during expansion and results in more exergy destruction in the gas turbine. The reduced temperature at the outlet of the heat exchanger in the GCU for the lower operating temperature of the SOFC leads to lower exergy losses in this subsystem, since less heat is transferred. The higher exergy losses in the oxy-combustor system of the steam-oxygen gasification case (corresponds to the 800°C operating temperature of the SOFC) reduce the CHP exergy efficiency significantly lower than the other operating temperatures (900 and 1,000°C) as shown in Figure 7B.
Carbon deposition analysis is also performed for lower SOFC operating temperatures (800 and 900°C) for both the gasification cases using Factsage (Bale et al., 2018). The detailed C-H-O ternary phase diagrams are presented in Supplementary Appendix SA, B for the air gasification and the steam-oxygen gasification cases, respectively. From the thermodynamic point of view, for the equilibrium-situation, condition A at an SOFC operating temperature of 800°C in the steam-oxygen gasification case might cause carbon deposition as shown in Supplementary Figure SB2 of Supplementary Appendix B.
The risk of carbon deposition in this case could be reduced by mixing the bio syngas with the steam (Kuhn and Kesler, 2015). But the steam should then be extracted from the system, and this would lead to a reduction in the net electrical efficiency (Thallam Thattai et al., 2017). Aditya et al. (Thallam Thattai et al., 2017) also concluded that carbon deposition did not take place in practice, probably because equilibrium is not achieved. However, an experimental investigation on the system is required to ensure this assumption.
The performance of the steam-oxygen gasification system (having a higher exergy efficiency than the air gasification system) is further studied, to investigate the effect of the isentropic efficiencies of gas turbines and compressors, in Supplementary Appendix SC.
4.4 Negative Carbon Emissions
Since the biomass absorbs CO2 from the atmosphere during its growth and emits it into the atmosphere when it is used as a fuel, the biomass is assumed to be a CO2-neutral fuel (Promes et al., 2015; Thallam Thattai et al., 2017). Hence, the use of biomass in the power plant provides an opportunity to develop a CO2-neutral/negative system (Klein et al., 2011). The introduction of a CCS unit to the BIGFC/CCS system would realize the concept of BECCS (bio energy carbon capture and storage) and a carbon-negative power producing system.
Figure 8 depicts the main CO2 flows among atmospheric, power plant, and geological reservoirs, adapted from the study by Smith et al. (2016). The main CO2 flow in a typical coal-based power plant (Cormos, 2012) is shown in Figure 8A which illustrates that the coal taken out from the geological reservoir is combusted in the power plant to produce electricity and the resulting CO2 is emitted into the atmosphere.
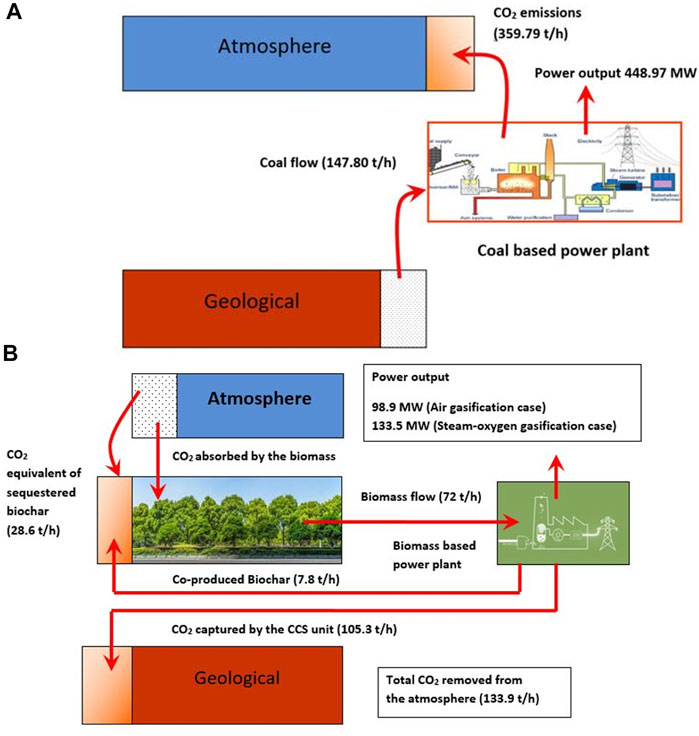
FIGURE 8. (A) Main CO2 flows in a typical coal-based power plant. (B) Main CO2 flows in the BECCS including biochar addition to soil for the 10% biochar co-production in the given biomass feed.
As shown in Figure 8B, the biomass receives CO2 from the atmosphere as it grows; but with the use of biomass as a fuel for the power plant, this carbon is again released as CO2. If the CO2 produced by the system is captured in the CCS unit, it is transported to a storage site where it is stored in a reservoir permanently. This kind of storage helps to remove CO2 from the atmosphere. Hence, the system as a whole can be considered carbon-negative. This also requires replanting energy-crops as part of the system. It is possible to mix the co-produced biochar (10% by weight) with the soils, to improve the properties of the latter and to avoid the formation of CO2 that should be captured and stored.
The CO2 stored in the CCS unit and the CO2 equivalent of sequestered biochar is found to be 105.3 t/h and 28.55 t/h, respectively, as shown in Figure 8B. Thus, the proposed system in this study is estimated to remove 133.9 t/h of CO2 from the atmosphere totally. It is interesting to note that the power output of the system is different (for the air and steam-oxygen gasification cases, 98.9 and 133.5 MW, respectively), for the given biomass input and the negative CO2 emissions achieved. The specific power output per unit of CO2 stored is 2.65 and 3.58 MW/(kg/s) for the air and steam-oxygen gasification cases, respectively. The higher power output with the steam-oxygen gasification case is due to the lower exergy losses than those in the air gasification case as discussed in section 4.3 in Exergy analysis.
As seen from Table 6, the steam-oxygen gasification case has far better CO2 purity (99.10% by mass) in the CCS unit than the air gasification case (47.1% by mass), which is favorable for the sequestration process (Prabowo et al., 2015). Thus, the steam-oxygen gasification case in the BIGFC/CCS system is identified as the potential one to offer effective negative carbon emissions compared to the air gasification case.
5 Conclusion
The thermodynamic evaluation on the effect of stepwise biochar co-production in the BIGFC/CCS system is presented in terms of its energy-based performance and negative emission potential. The main conclusions of the study are listed below:
1) It is far easier to achieve negative carbon emissions using steam-oxygen gasification in the BIGFC/CCS system due to the absence of nitrogen dilution, when compared to the air gasification case.
2) For the same bio-char co-production, the steam-oxygen gasification case leads to higher power production.
3) The thermodynamic models developed herein offer a platform to perform techno-economic analysis for further evaluation. (Subsequent techno-economic analysis is presented in Part II.)
4) The steam-oxygen gasification case yields a higher CHP exergy efficiency of 54.6% for the base case (without co-producing biochar) and 51% when it co-produces biochar from the feedstock that corresponds to 10% by weight.
5) The specific power output per unit of CO2 stored is 3.58 MW/(kg/s) with the higher level of CO2 purity (99.1% by mass) at the CCS unit for the steam-oxygen gasification case and it corresponds to 10% biochar co-production for the given biomass flow.
These results show that the co-production of biochar in the BIGFC/CCS system using steam-oxygen as a gasification agent offers an effective solution to apply the BECCS concept and negative carbon emissions. In addition, the research outcomes of this article are utilized for further techno-economic analysis in Part II of the study to find the most profitable cases of biochar co-production in the negative-emission power plants.
Data Availability Statement
The original contributions presented in the study are included in the article/Supplementary Material; further inquiries can be directed to the corresponding author.
Author Contributions
Credit authorship contribution statement NJ: methodology, software, formal analysis, investigation, data curation, and writing—original draft. P-CK: software, investigation, and writing—review and editing. TW: software, validation, investigation, and data curation. RA: supervision and writing—review and editing. PA: conceptualization, supervision, and writing—review and editing.
Conflict of Interest
The authors declare that the research was conducted in the absence of any commercial or financial relationships that could be construed as a potential conflict of interest.
Publisher’s Note
All claims expressed in this article are solely those of the authors and do not necessarily represent those of their affiliated organizations, or those of the publisher, the editors, and the reviewers. Any product that may be evaluated in this article, or claim that may be made by its manufacturer, is not guaranteed or endorsed by the publisher.
Acknowledgments
First author, NJ, wishes to thank and acknowledge Dr. Manavalla Sreekanth, Faculty of School of Mechanical Engineering, VIT, India, for his support and fruitful discussions while the author was learning to use the software Cycle-Tempo. The authors would like to thank Chaitanya Joglekar-Research RUG from the University of Groningen for his extensive support in reviewing the manuscript.
Supplementary Material
The Supplementary Material for this article can be found online at: https://www.frontiersin.org/articles/10.3389/fenrg.2022.803756/full#supplementary-material
References
Adams, T. A., and Barton, P. I. (2010). High-efficiency Power Production from Coal with Carbon Capture. AIChE J. 56 (12), 3120–3136. doi:10.1002/aic.12230
Ahrenfeldt, J., Thomsen, T. P., Henriksen, U., and Clausen, L. R. (2013). Biomass Gasification Cogeneration - A Review of State of the Art Technology and Near Future Perspectives. Appl. Therm. Eng. 50, 1407–1417. doi:10.1016/j.applthermaleng.2011.12.040
Aravind, P. V., Woudstra, T., Woudstra, N., and Spliethoff, H. (2009). Thermodynamic Evaluation of Small-Scale Systems with Biomass Gasifiers, Solid Oxide Fuel Cells with Ni/GDC Anodes and Gas Turbines. J. Power Sources 190, 461–475. doi:10.1016/j.jpowsour.2009.01.017
Baehr, H. D. (1966). Verbrennungsprozesse. Second edition. Berlin/Heidelberg: Springer, 321–359. doi:10.1007/978-3-642-53398-3_8Verbrennungsprozesse
Bale, C. W., Chartrand, P., and Degterov, S. A. (2018). Factsage 6.4. Available at: http://www.factsage.com/.
Biomass, B. P. (2010). Gasification and Pyrolysis Practical Design and Theory. Elsevier: Academic press, 117–166.
Chen, C. M., Bennett, D. L., Carolan, M. F., Poster, E. P., Schinski, W. L., and Taylor, D. M. (2004). “ITM Syngas Ceramic Membrane Technology for Synthesis Gas Production,” in Studies in Surface Science and Catalysis. Editors X. Bao, and Y. Xu (Elsevier), 147, 50–55. doi:10.1016/s0167-2991(04)80027-2
Chen, T., Wang, W. G., Wang, H., Li, T., and Xu, C. (2011). Evaluation of Carbon Deposition Behavior on the Nickel/yttrium-Stabilized Zirconia Anode-Supported Fuel Cell Fueled with Simulated Syngas. J. Power Sources 196 (5), 2461–2468. doi:10.1016/j.jpowsour.2010.11.095
Cohce, M. K., Dincer, I., and Rosen, M. A. (2011). Energy and Exergy Analyses of a Biomass-Based Hydrogen Production System. Bioresour. Technol. 102, 8466–8474. doi:10.1016/j.biortech.2011.06.020
Colpan, C. O., Hamdullahpur, F., Dincer, I., and Yoo, Y. (2010). Effect of Gasification Agent on the Performance of Solid Oxide Fuel Cell and Biomass Gasification Systems. Int. J. Hydrogen Energy 35, 5001–5009. doi:10.1016/j.ijhydene.2009.08.083
Cormos, C.-C. (2012). Integrated Assessment of IGCC Power Generation Technology with Carbon Capture and Storage (CCS). Energy 42 (1), 434–445. doi:10.1016/j.energy.2012.03.025
Dincer, I. (2000). Renewable Energy and Sustainable Development: a Crucial Review. Renew. Sustain. Energy Rev. 4, 157–175. doi:10.1016/s1364-0321(99)00011-8
Dyer, P., Richards, R. E., Russek, S. L., and Taylor, D. M. (2000). Ion Transport Membrane Technology for Oxygen Separation and Syngas Production. Solid State Ionics 134, 21–33. doi:10.1016/s0167-2738(00)00710-4
EBC (2012). European Biochar Certificate -Guidelines for a Sustainable Production of Biochar. Arbaz, Switzerland: European Biochar Foundation (accessed on October 24, 2015). doi:10.13140/RG.2.1.4658.7043
FrydaL, V. R. (2018). Biochar for Soil Improvement: Evaluation of Biochar from Gasification and Slow Pyrolysis. Agriculture 5 (4), 1076–1115.
Gray, D. (2016). “Major Gasifiers for IGCC Systems,” in Integrated Gasification Combined Cycle (IGCC) Technologies. Editors T. Wang, and G. Stiegel (Elsevier), 340.
Hansen, V., Müller-Stöver, D., Ahrenfeldt, J., Holm, J. K., Henriksen, U. B., and Hauggaard-Nielsen, H. (2015). Gasification Biochar as a Valuable By-Product for Carbon Sequestration and Soil Amendment. Biomass Bioenergy 72, 300–308. doi:10.1016/j.biombioe.2014.10.013
Hilaire, J., Minx, J. C., Callaghan, M. W., Edmonds, J., Luderer, G., Nemet, G. F., et al. (2019). Negative Emissions and International Climate Goals-Learning from and about Mitigation Scenarios. Clim. Change 157, 189–219. doi:10.1007/s10584-019-02516-4
Iea Greenhouse Gas R&D Programme, (2005/0920). Oxy Combustion Processes for CO2 Capture from Power Plants. Rep. No.
Initiative, I. B. (2012). Standardized Product Definition and Product Testing Guidelines for Biochar that Is Used in Soil. IBI biochar Stand. Available online: http://www.biocharinternational.org/sites/default/files/IBI_Biochar_Standards_V2%200_final_2014.pdf (accessed on August 24, 2015).
Jaeger, H. (2008). ITM Oxygen Offers 15% More Power and over 10% Better Plant Efficiency. Gas. Turbine World 38, 34–38.
Jin, H., Larson, E. D., and Celik, F. E. (2009). Performance and Cost Analysis of Future, Commercially Mature Gasification-Based Electric Power Generation from Switchgrass. Biofuels, Bioprod. Bioref. 3 (2), 142–173. doi:10.1002/bbb.138
Kanniche, M., Gros-Bonnivard, R., Jaud, P., Valle-Marcos, J., Amann, J.-M., and Bouallou, C. (2010). Pre-combustion, Post-combustion and Oxy-Combustion in Thermal Power Plant for CO2 Capture. Appl. Therm. Eng. Pap. 11th Conf. Process Integration, Model. Optimisation Energy Sav. Pollut. Reduct. 30 (1), 53–62. doi:10.1016/j.applthermaleng.2009.05.005
Khaleel, M. A., and Selman, J. R. (2003). “Cell, Stack and System Modelling,” in High Temperature and Solid Oxide Fuel Cells. Editors S. C. Singhal, and K. K. Kendal (Elsevier), 291–331. doi:10.1016/b978-185617387-2/50028-3
Klein, D., Bauer, N., Bodirsky, B., Dietrich, J. P., and Popp, A. (2011). Bio-igcc with CCS as a Long-Term Mitigation Option in a Coupled Energy-System and Land-Use Model. Energy Procedia 4, 2933–2940. doi:10.1016/j.egypro.2011.02.201
Kuhn, J., and Kesler, O. (2015). Carbon Deposition Thresholds on Nickel-Based Solid Oxide Fuel Cell Anodes II. Steam:carbon Ratio and Current Density. J. Power Sources 277, 455–463. doi:10.1016/j.jpowsour.2014.07.084
Kuhn, J., and Kesler, O. (2014). Method for In Situ Carbon Deposition Measurement for Solid Oxide Fuel Cells. J. Power Sources 246, 430–437. doi:10.1016/j.jpowsour.2013.07.106
Kunze, C., and Spliethoff, H. (2012). Assessment of Oxy-Fuel, Pre- and Post-combustion-based Carbon Capture for Future IGCC Plants. Appl. Energy 94, 109–116. doi:10.1016/j.apenergy.2012.01.013
Laird, D. A. (2008). The Charcoal Vision: A Win-Win-Win Scenario for Simultaneously Producing Bioenergy, Permanently Sequestering Carbon, while Improving Soil and Water Quality. Agronomy 100, 178–181. doi:10.2134/agrojnl2007.0161
Li, H., and Yan, J. (2007). “Preliminary Study on CO2 Processing in CO2 Capture from Oxy-Fuel Combustion,” in Proceedings of GT2007, ASME Turbo Expo 2007: Power for Land (Montreal: Canada), 14–17. Sea and Air May.
Liu, M., Aravind, P. V., Woudstra, T., Cobas, V. R. M., and Verkooijen, A. H. M. (2011). Development of an Integrated Gasifier-Solid Oxide Fuel Cell Test System: A Detailed System Study. J. Power Sources 196, 7277–7289. doi:10.1016/j.jpowsour.2011.02.065
Meyer, S., Glaser, B., and Quicker, P. (2011). Technical, Economical, and Climate-Related Aspects of Biochar Production Technologies: A Literature Review. Environ. Sci. Technol. 45, 9473–9483. doi:10.1021/es201792c
Moran, M. J., and Shapiro, H. N. (2006). Fundamentals of Engineering Thermodynamics. fifth edition. Chichester West sussex: John Wiley & Sons.
Ohijeagbon, I. O., Waheed, M. A., and Jekayinfa, S. O. (2013). Methodology for the Physical and Chemical Exergetic Analysis of Steam Boilers. Energy 53, 153–164. doi:10.1016/j.energy.2013.02.039
Park, S. K., Ahn, J.-H., and Kim, T. S. (2011). Performance Evaluation of Integrated Gasification Solid Oxide Fuel Cell/gas Turbine Systems Including Carbon Dioxide Capture. Appl. Energy 88 (9), 2976–2987. doi:10.1016/j.apenergy.2011.03.031
Park, S. K., Kim, T. S., Sohn, J. L., and Lee, Y. D. (2011). An Integrated Power Generation System Combining Solid Oxide Fuel Cell and Oxy-Fuel Combustion for High Performance and CO2 Capture. Appl. Energy 88 (4), 1187–1196. doi:10.1016/j.apenergy.2010.10.037
Prabowo, B., Aziz, M., Umeki, K., Susanto, H., Yan, M., and Yoshikawa, K. (2015). CO2-recycling Biomass Gasification System for Highly Efficient and Carbon-Negative Power Generation. Appl. Energy 158, 97–106. doi:10.1016/j.apenergy.2015.08.060
Prins, M. J., and Ptasinski, K. J. (2005). Energy and Exergy Analyses of the Oxidation and Gasification of Carbon. Energy 30, 982–1002. doi:10.1016/j.energy.2004.08.010
Pröll, T., and Zerobin, F. (2019). Biomass-based Negative Emission Technology Options with Combined Heat and Power Generation. Mitig. Adapt Strateg. Glob. Change 24, 1307–1324. doi:10.1007/s11027-019-9841-4
Promes, E. J. O., Woudstra, T., Schoenmakers, L., Oldenbroek, V., Thallam Thattai, A., and Aravind, P. V. (2015). Thermodynamic Evaluation and Experimental Validation of 253 MW Integrated Coal Gasification Combined Cycle Power Plant in Buggenum, Netherlands. Appl. Energy 155, 181–194. doi:10.1016/j.apenergy.2015.05.006
Rhodes, J. S., and Keith, D. W. (2005). Engineering Economic Analysis of Biomass IGCC with Carbon Capture and Storage. Biomass Bioenergy 29 (6), 440–450. doi:10.1016/j.biombioe.2005.06.007
Sanchez, D. L., and Kammen, D. M. (2016). A Commercialization Strategy for Carbon-Negative Energy. Nat. Energy 1, 15002. doi:10.1038/nenergy.2015.2
Santhanam, S., Schilt, C., Turker, B., Woudstra, T., and Aravind, P. V. (2016). Thermodynamic Modeling and Evaluation of High Efficiency Heat Pipe Integrated Biomass Gasifier-Solid Oxide Fuel Cells-Gas Turbine Systems. Energy 109, 751–764. doi:10.1016/j.energy.2016.04.117
Shackley, S., Carter, S., Knowles, T., Middelink, E., Haefele, S., and Haszeldine, S. (2012). Sustainable Gasification-Biochar Systems? A Case-Study of Rice-Husk Gasification in Cambodia, Part II: Field Trial Results, Carbon Abatement, Economic Assessment and Conclusions. Energy Policy 41, 618–623. doi:10.1016/j.enpol.2011.11.023
Shackley, S., Carter, S., Knowles, T., Middelink, E., Haefele, S., Sohi, S., et al. (2012). Sustainable Gasification-Biochar Systems? A Case-Study of Rice-Husk Gasification in Cambodia, Part I: Context, Chemical Properties, Environmental and Health and Safety Issues. Energy Policy 42, 49–58. doi:10.1016/j.enpol.2011.11.026
Siefert, N. S., and Litster, S. (2013). Exergy and Economic Analyses of Advanced IGCC-CCS and IGFC-CCS Power Plants. Appl. Energy 107, 315–328. doi:10.1016/j.apenergy.2013.02.006
Smith, P., Davis, S. J., Creutzig, F., Fuss, S., Minx, J., Gabrielle, B., et al. (2016). Biophysical and Economic Limits to Negative CO2 Emissions. Nat. Clim. Change 6 (1), 42–50. doi:10.1038/nclimate2870
Smith, P. (2016). Soil Carbon Sequestration and Biochar as Negative Emission Technologies. Glob. Change Biol. 22, 1315–1324. doi:10.1111/gcb.13178
Stanger, R., Wall, T., Spörl, R., Paneru, M., Grathwohl, S., Weidmann, M., et al. (2015). Oxyfuel Combustion for CO2 Capture in Power Plants. Int. J. Greenh. Gas Control 40, 55–125. doi:10.1016/j.ijggc.2015.06.010
Thallam Thattai, A., Oldenbroek, V., Schoenmakers, L., Woudstra, T., and Aravind, P. V. (2017). Towards Retrofitting Integrated Gasification Combined Cycle (IGCC) Power Plants with Solid Oxide Fuel Cells (SOFC) and CO2 Capture - A Thermodynamic Case Study. Appl. Therm. Eng. 114, 170–185. doi:10.1016/j.applthermaleng.2016.11.167
ThallamThattai, A., Oldenbroek, V., Schoenmakers, L., Woudstra, T., and AravindPV, (2016). Experimental Model Validation and Thermodynamic Assessment on High Percentage (Up to 70% Biomass Co-gasification at the 253 MWe Integrated Gasification Combined Cycle Power Plant in Buggenum, The Netherlands. Appl. Energy 168, 381–393.
Tsatsaronis, G. (2007). Definitions and Nomenclature in Exergy Analysis and Exergoeconomics. EnergyECOS 05. 18th Int. Conf. Effic. Cost, Optim. Simul. Environ. Impact Energy Syst. ECOS 05 32 (4), 249–253. doi:10.1016/j.energy.2006.07.002
United Nations Framework Convention on Climate Change, (2016). Report of the Conference of the Parties on its Twenty-First Session, Held in Paris from 30 November to 13 December 2015. http://unfccc.int/resource/docs/2015/cop21/eng/10.pdf>.
van der SteltT Woudstra, N., and Colonna, P. (2018). Cycle-tempo: A Program for Thermodynamic Model and Optimization of Energy Conversion Systems. Netherlands: Delft university of Technology. http://www.asimptote.com.
Woolf, D., Lehmann, J., and Lee, D. R. (2016). Optimal Bioenergy Power Generation for Climate Change Mitigation with or without Carbon Sequestration. Nat. Commun. 7, 13160. doi:10.1038/ncomms13160
Woudstra, N. (2012). Sustainable Energy Systems: Limitations and Challenges Based on Exergy Analysis. Netherlands: Delft University of Technology Ph.D. thesis.
Woudstra, N., van der Stelt, T. P., and Hemmes, K. (2006). The Thermodynamic Evaluation and Optimization of Fuel Cell Systems. J. Fuel Cell. Sci. Technol. 3 (2), 155–164. doi:10.1115/1.2174064
Yao, Z., You, S., Ge, T., and Wang, C.-H. (2018). Biomass Gasification for Syngas and Biochar Co-production: Energy Application and Economic Evaluation. Appl. Energy 209, 43–55. doi:10.1016/j.apenergy.2017.10.077
Nomenclature
AE air expander
ASU air separation unit
BECCS bio energy with carbon capture and storage
BIGFC Biomass based integrated gasification fuel cell cycle
CHP combined heat and power
GCU gas cleaning unit
CCS carbon dioxide capture and storage
EOR enhanced oil recovery
EU European Union
F Faraday constant (96,486 J/V mol)
GHG greenhouse gas
GT gas turbine
h specific enthalpy (kJ/kg)
IGCC integrated gasification combined cycle
IGFC integrated gasification fuel cell
ITM ion transport membrane
LHV lower heating value (MJ/kg)
NET negative emission technology
NGCC Natural Gas Combined Cycle
Oxy Oxy-fuel combustion cycle
P pressure (kPa) power (MW)
PC pulverised coal
R gas constant (kJ/kmol K)
Req equivalent resistance (Ω m2)
SOFC solid oxide fuel cell
T temperature (°C)
V voltage (V)
∆V voltage rise (V)
P pressure (kPa) power (MW)
y molar concentration of gas specie in bio syngas(kmol/kmol)
WAC Willem-Alexander Centrale.
φ equivalence ratio
Subscripts
a anode
ac alternating current
C compressor
c cathode
CC carbon capture
dc direct current
e electrical
HP high pressure
i component
in inlet
IP intermediate pressure
j compression stage
LP low pressure
m mechanical
misc miscellaneous
rev reversible
Keywords: IGFC/GT, biochar co-production, chemical exergy of biochar, allothermal gasification, SOFC operating temperature, negative CO2 emission
Citation: Jaiganesh N, Kuo P-C, Woudstra T, Ajith Kumar R and Aravind PV (2022) Negative Emission Power Plants: Thermodynamic Modeling and Evaluation of a Biomass-Based Integrated Gasification Solid Oxide Fuel Cell/Gas Turbine System for Power, Heat, and Biochar Co-Production—Part 1. Front. Energy Res. 10:803756. doi: 10.3389/fenrg.2022.803756
Received: 28 October 2021; Accepted: 26 April 2022;
Published: 27 June 2022.
Edited by:
Graeme Douglas Puxty, Commonwealth Scientific and Industrial Research Organisation (CSIRO), AustraliaReviewed by:
Bheru Lal Salvi, Maharana Pratap University of Agriculture and Technology, IndiaSaeid Soltani, University of Tabriz, Iran
Copyright © 2022 Jaiganesh, Kuo, Woudstra, Ajith Kumar and Aravind. This is an open-access article distributed under the terms of the Creative Commons Attribution License (CC BY). The use, distribution or reproduction in other forums is permitted, provided the original author(s) and the copyright owner(s) are credited and that the original publication in this journal is cited, in accordance with accepted academic practice. No use, distribution or reproduction is permitted which does not comply with these terms.
*Correspondence: P. V. Aravind, A.PurushothamanVellayani@tudelft.nl