Influence of the Assembly Method on the Cell Current Distribution of Series–Parallel Battery Packs Based on Connector Resistance
 Long Chang1,2
  Chen Ma1 Chunxiao Luan1
  Zhezhe Sun1 Cunyu Wang2 Hongyu Li1
  Yulong Zhang1* Xiangqi Liu3
- 1Shandong University of Science and Technology, Qingdao, China
- 2School of Control Science and Engineering, Shandong University, Jinan, China
- 3Dalian University of Technology, Panjin, China
In order to meet the energy and power requirements of large-scale battery applications, lithium-ion batteries have to be connected in series and parallel to form various battery packs. However, unavoidable connector resistances cause the inconsistency of the cell current and state of charge (SoC) within packs. Meanwhile, different assembly methods and module collector positions (MCPs) may result in different connector resistance arrangements, thereby leading to different cell current distributions. Therefore, the correlation of connector resistance to battery pack performance is worth investigating. Based on the simplified equivalent circuit model (ECM), the mathematical models of cell current distribution within packs under different assembly methods are obtained in this paper. Then, we use COMSOL Multiphysics simulation to analyze the guidelines of series assembly for parallel modules and then study the influences of connector resistance and MCP on series–parallel battery packs. The results show that the assembly method with an equal distance between each cell and the assembly contact surface for series assembly can effectively reduce the inhomogeneous current. However, the cell current and SoC distribution within the series–parallel battery pack is completely independent of the Z-configuration and ladder configuration. In addition, for series–parallel battery packs, the non-edge parallel module part of the series–parallel battery pack can be replaced with a series cell module (SCM) structure. Finally, the influences of the value of the connector resistance and current rate on the cell current distribution are discussed.
Introduction
To meet the growing demand for energy and power, lithium-ion battery packs are growing rapidly in size, especially for large-scale applications such as electric vehicles (EVs) and grid-connected energy storage systems (ESSs) (Saw et al., 2016; Rogers et al., 2020; Wang et al., 2021). However, the available energy of a single cell is far from adequate for these applications (Ebner et al., 2013). Therefore, thousands of cells are usually connected in series and parallel connection topologies to power various EVs (Mahmoudzadeh Andwari et al., 2017), like the Tesla Model S (96s74p), Tesla Model 3 (96s46p), VW eGolf (88s3p), Nissan Leaf (2p96s), BMW i3 (96s2p), BAIC EU260 (3p90s), Renault Zoe (2p96s), and Audi etron (108s4p) (Rothgang et al., 2015a; Brand et al., 2016; Bruen and Marco, 2016), and large ESSs, like the working 1 MW Li-ion project (384s7p) in 2012 on the island of Hawaii and the Energy Superhub Oxford project (50 MW, the world’s largest hybrid lithium-ion/vanadium) in 2019 by Pivot Power (Rothgang et al., 2015b; Dubarry et al., 2017; Pivot power EDF renewable UK, 2019). The unavoidable connector resistances affect the cell current consistency in the pack (Wu et al., 2013; Hu et al., 2015; Shang et al., 2019). Meanwhile, there are various options for the module collector position (MCP) of the battery pack. Most MCPs lead to different equivalent resistances of each parallel branch in the battery pack, thereby leading to an inhomogeneous cell current distribution (Wang et al., 2015; Baumann et al., 2018). As a consequence, the inhomogeneous cell current has an enormous influence on the life cycle and safety of the battery pack (Offer and Brandon, 2012). Therefore, reducing the influence of connector resistance is crucial to optimizing the performance of the battery pack.
The ratio of connector resistance to the internal resistance of a cell has an important influence on the inhomogeneous cell current within the parallel battery pack (Wang et al., 2015; Grün et al., 2018; Lv et al., 2019). Further, Hosseinzadeh et al. (Hosseinzadeh et al., 2021) found that compared to cell internal resistance, capacity, and temperature, the ratio of connector resistance to cell internal resistance had the biggest influence on the performance of the parallel battery module. Meanwhile, MCP determines the equivalent resistance of each parallel branch, which directly affects the cell current distribution within the pack (Baumann et al., 2018). The longer distance between the cell and MCP leads to a lower cell current (Zhang et al., 2018), and the cell directly connected to the MCP presents a high current, which results in deep discharge and accelerated aging of this cell (Wang et al., 2015; Wang and Cheng, 2015). Moreover, the Z-configuration and the ladder configuration are two typical MCPs, and the inhomogeneous cell current of a parallel battery pack with the Z-configuration is better than that with the ladder configuration (Hosseinzadeh et al., 2019a; Hosseinzadeh et al., 2019b; Hosseinzadeh et al., 2021). Similarly, the middle configuration is also a common MCP of a parallel battery pack, and Rumpf et al. (Rumpf et al., 2018) find it preferable to the ladder configuration. In addition, the closer the cell is to the edge of MCP, the larger the differences among the cells and the higher the self-equalization loss (Lv et al., 2019). In a word, the connector resistance and MCP have a huge influence on the cell current distribution, which further affects the performance, service life, and safety of the battery pack. At present, most studies focus on the influence of connector resistance and MCP on the performance of battery packs, while lacking the approach to reduce this influence. Meanwhile, most publications aim at parallel battery packs, while series–parallel packs are less studied. Therefore, the purpose of this paper is to study the influences of connector resistance and MCP on the performance of the series–parallel battery pack and provide the guidelines for manufacturers to reduce the influences.
In practice, considering the stability, self-balancing, and economic cost, the connection topology of the parallel cell module (PCM) is widely adapted (Plett and Klein, 2009; Brand et al., 2016; Luan et al., 2021). Then, the series–parallel battery pack can be formed by connecting parallel modules in series. Meanwhile, nickel plates are widely used in the assembly of series–parallel battery packs due to their corrosion resistance, high mechanical stability, and good weld ability (Brand et al., 2015; Grün et al., 2018; Chang et al., 2019). There are two typical series assembly methods for parallel modules connected by nickel plates, which are defined in this paper. Therefore, the advantages and disadvantages of the two typical assembly methods are analyzed based on the ECM and mathematical model in this paper. Then, by the assembly method with better performance, the 5s4p series–parallel battery pack is constructed, which is used to study the influences of connector resistance and MCP on the performance of the pack connected by nickel plates.
Simulation carried out by COMSOL Multiphysics was adopted for some previous studies (Hosseinzadeh et al., 2017; Hosseinzadeh et al., 2019a), which proves that it is a reliable way for research. COMSOL Multiphysics can set up multiple cells with consistent cell-to-cell parameters to exclude the interference of cell-to-cell parameter variations, which facilitates quantitative research methods. Meanwhile, different from studies with 2D models (Chang et al., 2020; Wu et al., 2021), COMSOL Multiphysics can accurately simulate the current distribution within a nickel plate. Through the combination of a 2D ECM and a 3D geometry model, we can perform a more realistic simulation of the charging and discharging of the battery pack, which contributes to the study of this paper. The contributions of this paper are summarized as follows:
(1) The mathematical models of cell current distribution within packs under different assembly methods are obtained.
(2) The guideline of series assembly for parallel modules is obtained to reduce the current inhomogeneity and improve the pack performance through COMSOL Multiphysics simulation.
(3) The correlation of the connector resistance and current rate on the pack’s performance is gained to improve the efficiency of the pack.
The paper is structured as follows: in Equivalent Circuit Model and Mathematical Model Based on 3D Geometry, we analyze the cell current distribution of the packs with two typical assembly methods based on the 3D geometry models and ECMs and construct the series–parallel battery pack by the assembly method with better performance. Then in Modeling, Verification, and Simulation, through COMSOL simulation, we verify mathematical models of the two assembly methods and investigate the influence of connector resistance and MCP on the performance of series–parallel battery packs. Thus, in Results and Discussions, we theoretically analyze the influences of assembly method difference, connector resistance, and MCP on the performance of a series–parallel battery pack and provide the guidelines to reduce these influences. Based on the current distribution characteristics of the series–parallel battery pack, we propose, model, analyze, and verify the PCM-SCM connection topology. In conclusion, we conclude this paper.
Equivalent Circuit Model and Mathematical Model Based on 3D Geometry
According to the case that nickel plates are widely used in the assembly of battery packs, the 3D geometry model of the parallel module is constructed. Figure 1A shows a common type of 4p parallel module connected by nickel plates. The parallel module is composed of positive and negative nickel plates and four cylindrical cells. The positive and negative collectors of the cell are connected to the positive and negative nickel plates, respectively, achieving a parallel configuration instead of connecting the positive collectors or negative collectors of adjacent cells sequentially through wires. As shown in Figure 1A, the positive and negative nickel plates of the parallel module are cuboids, and different surfaces of nickel plates can be selected as the contact surface for series assembly. Therefore, there are two typical series assembly methods for parallel modules: for simplicity, the series assembly method that parallel modules connected through the short surface is named S-Assembly (i.e., Figure 1B), and the series assembly method that parallel modules connected through the long surface is named L-Assembly (i.e., Figure 1C).
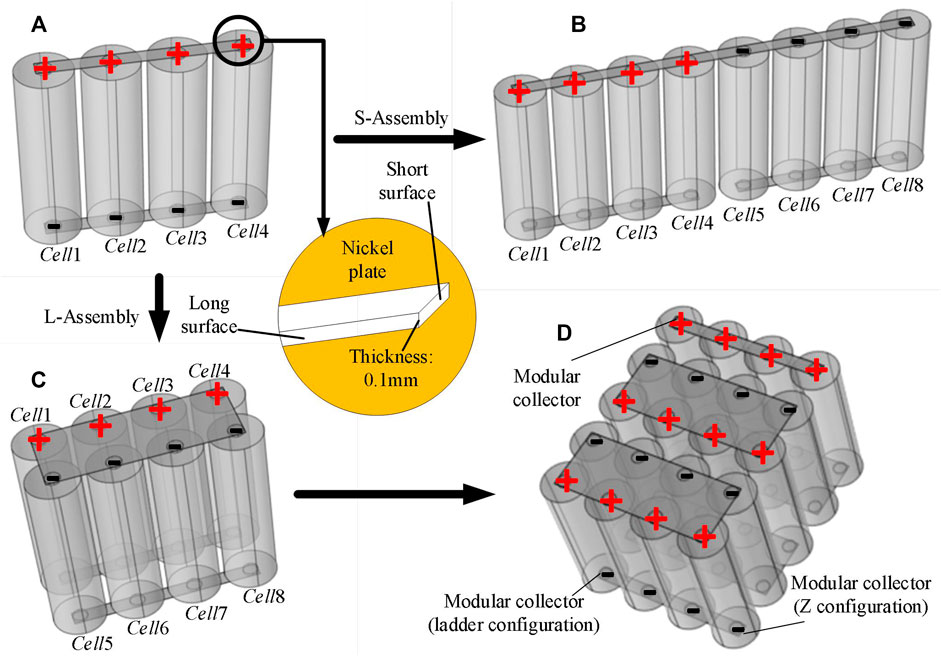
FIGURE 1. (A) 3D geometry model of the 4p parallel module. (B) 3D geometry model of S-Assembly. (C) 3D geometry model of L-Assembly. (D) 3D geometry model of the 5s4p battery pack.
First, the performance difference between S-Assembly and L-Assembly is analyzed based on the ECM. The Thevenin model (Saxena et al., 2019; Zhou et al., 2019; Feng et al., 2021), shown in Figure 2A, is selected as the ECM of the cell due to its relative simplicity, ease of parameterization, and real-time feasibility. The charging and discharging processes of a cell model can be expressed as
where U, OCV, R0, RP, CP, I, and τ are the terminal voltage, open-circuit voltage, Ohmic internal resistance, polarization resistance, polarization capacitance, charge and discharge current, and time constant of the cell, respectively. The series resistance R0 is used to represent the sum of the resistances of various battery components and model the ohm polarization process for fast dynamics (Zhu et al., 2019). The parallel resistor–capacitor network RPCP is used to describe the charge-transfer process and diffusion process during the charging/discharging duration. In the view of the electrochemical mechanism, the 1s impedance in the time domain is usually considered as the R0, which includes the pure Ohmic resistance and partial inductance resistance, partial film resistance, partial charge-transfer resistance, and partial diffusion resistance (Ruan et al., 2021). When the cell is charged or discharged at constant current, the internal resistance R can be expressed as
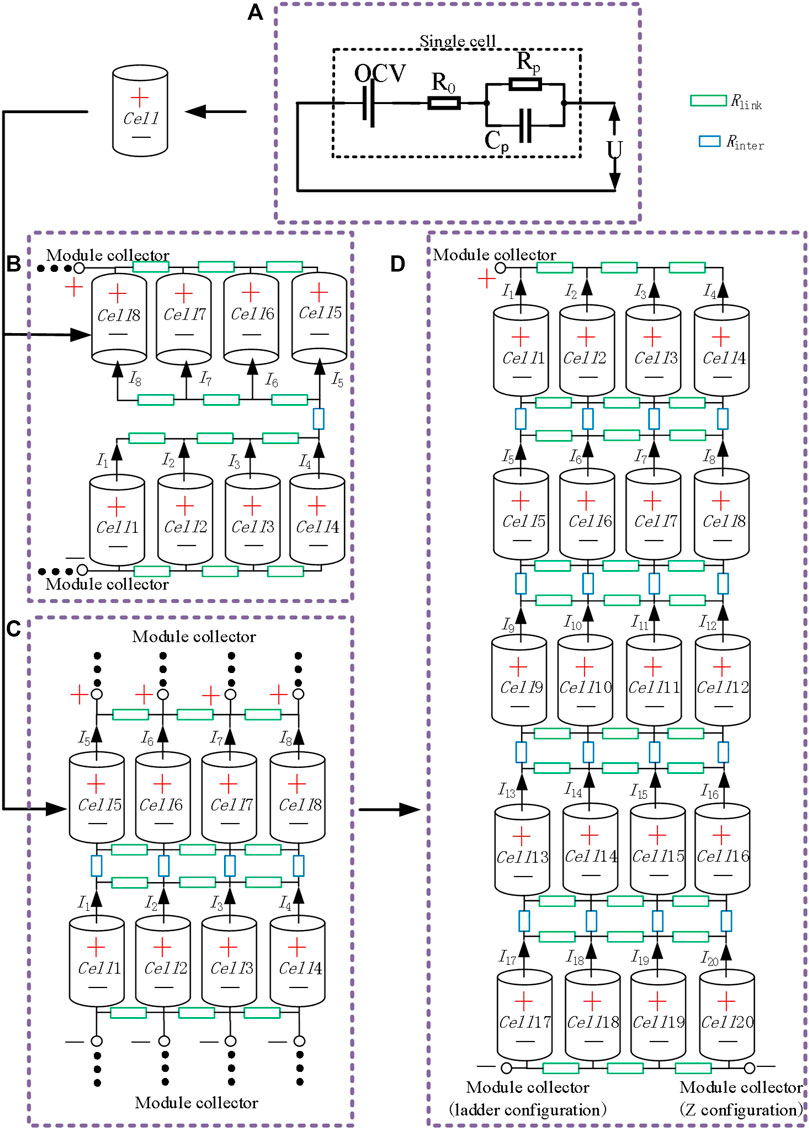
FIGURE 2. (A) Equivalent circuit model of the cell. (B) Equivalent circuit model of S-Assembly. (C) Equivalent circuit model of L-Assembly. (D) Equivalent circuit model of the 5s4p battery pack.
Then, the ECMs with S-Assembly and L-Assembly are established based on the ECM of the cell, as shown in Figure 2B and Figure 2C, respectively. Rlink is the connector resistance between adjacent cells in the parallel module, and Rinter is the connector resistance between adjacent parallel modules. The current path divides the nickel plate into several “small nickel plates”, which are the connector resistances. The current of each cell of the parallel module for S-Assembly can be expressed by the following equations:
where Upm is the terminal voltage of the parallel module; I is the discharge current of the battery pack; and Ui, OCVi, Ii, and Ri are the terminal voltage, open-circuit voltage, current, and internal resistance of the ith cell, respectively. The connector resistance can be obtained by the following equation:
where ρ, L, and S are the conductor material resistivity, conductor length, and conductor cross-sectional area, respectively. Since the Ohmic polarization occurs instantaneously, the cell current distribution at the beginning of discharge is affected by the terminal voltage of the battery pack, the connector resistance, and the Ohmic internal resistance of the cell. When the parameters between cells are consistent, the matrix equation of the initial cell current distribution of the parallel module for S-Assembly is obtained according to Eq. 3, that is,
where
The current of each cell of the parallel module for L-Assembly can be expressed by the following equations:
According to Eq. 7, the matrix equation of the initial cell current distribution of the parallel module for L-Assembly is obtained:
where
Obviously, the cell current consistency of L-Assembly is better than that of S-Assembly. Therefore, L-Assembly is more suitable for parallel modules to be assembled in series.
Finally, based on the above theoretical research, the 5s4p battery pack is formed by assembling the parallel modules in series through L-Assembly. The 3D geometry model and the ECM are shown in Figure 1D and Figure 2D. In the following, the 5s4p battery pack is used to study the influence of MCP, connector resistance, and current rate on the performance of the series–parallel battery pack assembled by nickel plates. Two typical MCPs are shown in Figure 1D and Figure 2D. The flow and distribution of current in the nickel plates are crucial to the study of the performance of a series–parallel battery pack. The ECM is suitable for the study of parallel battery packs with a simple assembly structure, such as S-Assembly. However, for the complex assembly, the connection impedance of nickel plates is hard to be replaced by a finite number of equivalent resistances, such as the L-Assembly in Figures 2C,D, where the interconnect network of Rlink and Rinter is just an approximation. Fortunately, COMSOL Multiphysics can simulate the flow and distribution of current in the nickel plates, which is helpful for the study of the performance of series–parallel battery packs. Thus, COMSOL Multiphysics is adopted for the following study.
Modeling, Verification, and Simulation
Based on the above mathematical model, the COMSOL simulation is carried out to discuss the cell current distribution of packs with S-Assembly and L-Assembly and further study the influence of connector resistance and MCP on the performance of series–parallel battery packs assembled by nickel plates.
Cell Modeling and Verification
The cell ECM built into COMSOL is consistent with that shown in Figure 2A. In this paper, the new lithium-ion 21700-format cell LGM505000mAh is ideally suited owing to their very-high-volume production recently. The detailed parameters are shown in Table 1. The nominal capacity of the cell is measured via a constant current discharge with a constant C/3 until the cut-off voltage (2.7 V).
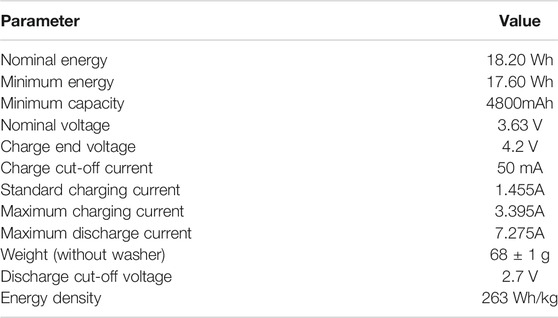
TABLE 1. Detailed parameters of LGM505000mAh.
The critical parameters (OCV, R0, RP, CP) are related to SOC. To obtain the parameters, pulse power tests are carried out with 21700-format battery cells on a test bench. In a pulse test, there are three pairs of 60 s charging and discharging pulses at increasing magnitudes and scaled relative to the different maximum cell current rates (0.2, 0.5, 1C), followed by a 30 min rest at the ambient temperature of 25°C. Then, according to Eq. 1, the parameters are adjusted with the pattern search optimization algorithm in the program Matlab, such as the Recursive Least Squares algorithm. Moreover, the identified model parameters at different SOCs are shown in Figure 3A. It is obvious that the R0, RP, and CP change little with SoC, except for extremely low SoC levels. Therefore, for the above theoretical calculation, the assumptions that the parameters can be seen as constant values are validated. The cell parameters are listed in Table 2. In addition, the OCV-SoC curve of the cell ECM is fitted by the dataset obtained from the discharging and charging at approximately C/25. The dataset contains 768 sets of data, as shown in Figure 3B.
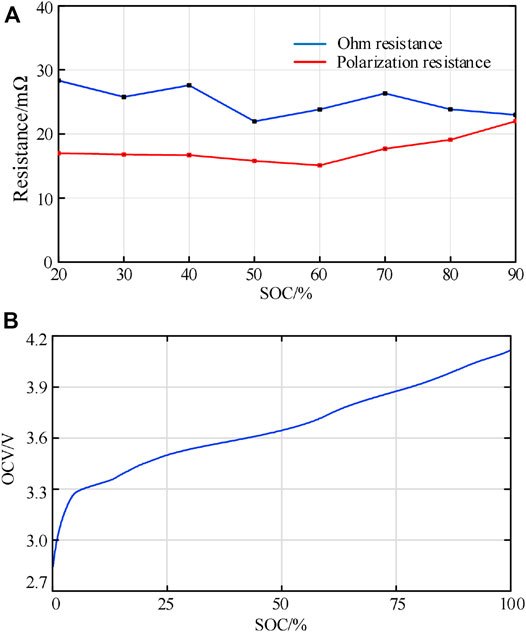
FIGURE 3. (A) Identified model parameters at different SOCs. (B) OCV-SoC curve measured by experiments.

TABLE 2. Parameters of the cell ECM.
The performance of the cell ECM is verified with a constant-current (CC) discharge. The CC discharge test is performed on the fully charged cell with 0.3 and 1C at an ambient temperature of 25°C, as shown in Figure 4. It can be seen that the simulated results are in good agreement with the experimental data. Finally, the ECM of the battery pack is built by setting the nodes to determine the connection relationship of the cells.
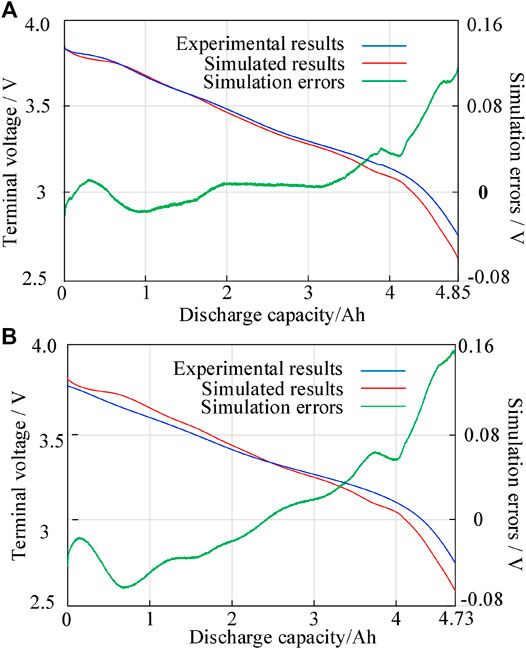
FIGURE 4. (A) Simulated and experimental results of cell terminal voltage and simulation errors at 0.3C. (B) Simulated and experimental results of cell terminal voltage and simulation errors at 1C.
COMSOL Model and Simulation Procedures
First, the 3D geometry models of the battery pack shown in Figure 1B, Figure 1C, and Figure 1D are established by using COMSOL Multiphysics, respectively. The geometry parameters of the cell, positive and negative collectors, adopt the geometry size of the 21700 lithium battery. The distance between adjacent cells in the battery pack is 0.1 d, where d is the diameter of a cylindrical cell. The thickness of a nickel plate is 0.1 mm. The specific parameters of the 3D geometry model are shown in Table 3. Meanwhile, the positive and negative collector materials of the cell are set to aluminum and copper, respectively.
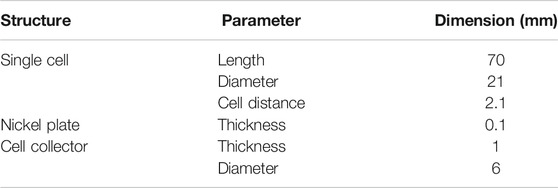
TABLE 3. Geometry parameters of the 3D model.
Second, based on the above cell ECM, some battery circuit modules of COMSOL are used to build the ECMs of the battery pack shown in Figure 1B, Figure 1C, and Figure 1D, such as the current source module and nickel plates. All nickel plates are set as domains for the current module, and they are used to simulate the current distribution and flow in the nickel plates. Meanwhile, all the circular contact surfaces of the nickel plate and cell electrode collector are set as circuit terminals to realize the electrical connection of the battery pack.
Finally, the combination of the 3D geometry model and the corresponding ECM is achieved by specifying the node positions of the ECM in the 3D geometry model. Compared with the study of the 2D ECM (i.e., Figures 2B–D), the biggest advantage of this method is that it can simulate the current distribution in the 3D space of the nickel plate, and the research results are more in line with the real situation.
CC discharge is adopted as the simulation condition for all battery packs. The initial SoC of each cell is equal with SoC = 100%. The battery pack stops discharging when any cell in the battery pack reaches the discharge cut-off voltage (2.9 V). The cycling test is performed on two fresh cells at 25°C. The Ohmic heat caused by the internal resistances of the cell and the interconnect resistance are not considered. Moreover, the influence of temperature on cell dynamics and connector resistance are all ignored, which has been adopted in other literature studies (Fill et al., 2018; Fill et al., 2019). The modeling and simulation process is shown in Figure 5.
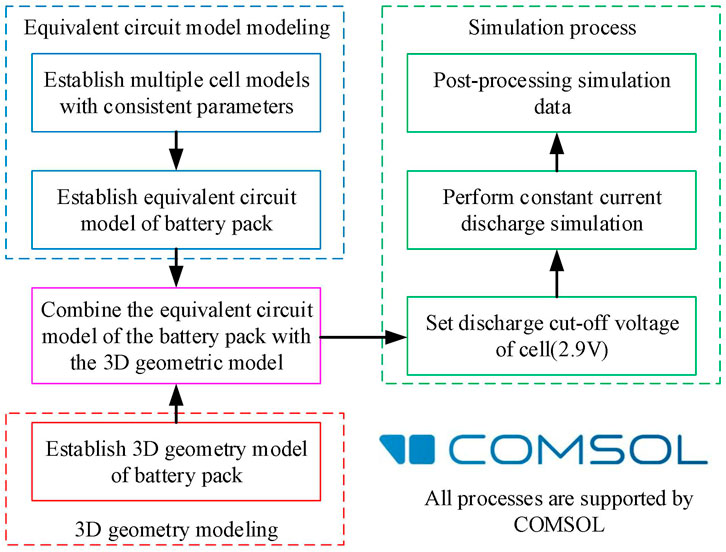
FIGURE 5. Modeling and simulation process.
Results and Discussion
Based on the above results, we analyze the causes of the performance differences between S-Assembly and L-Assembly and obtain the guidelines for the series assembly of parallel modules in this section. Then, we discuss the influences of MCP, connector resistance, and current rate on the performance of a series–parallel battery pack assembled by nickel plates.
The Influence of Two Typical Series Assembly Methods
The 1°C discharge simulation results of S-Assembly and L-Assembly are shown in Figure 6. There are differences in the cell current distribution between different assembly methods, and the cell current consistency of L-Assembly is obviously better than that of S-Assembly. The current of each cell in L-Assembly tends to be equal, which is the same as the mathematical model (Eq. 9) in the Equivalent Circuit Model and the Mathematical Model Based on 3D Geometry. It can be seen from the 3D geometry model of L-Assembly that the distance between each cell and the assembly contact surface is equal, which means that the equivalent resistance of each parallel branch is the same. However, there are differences in the current of cells in S-Assembly. The discharge currents of cells 1, 4, 5, and 8 are larger than those of other cells. The phenomenon is consistent with the conclusions of other publications; that is, the cell closer to the module collector has the higher current. According to the 3D geometry model of S-Assembly shown in Figure 1B, the positions of the assembly contact surfaces can be regarded as the Z-configuration. The cell closer to the assembly contact surface has the higher current, which is due to the equivalent resistance of the parallel branch the cell located in is smaller. In order to prove the validity of the mathematical model for S-Assembly, the calculation results obtained by Eq. 6 are compared with the simulation results. According to Eq. 4, the value of connector resistance is 2.63 mΩ; since the resistivity of nickel is
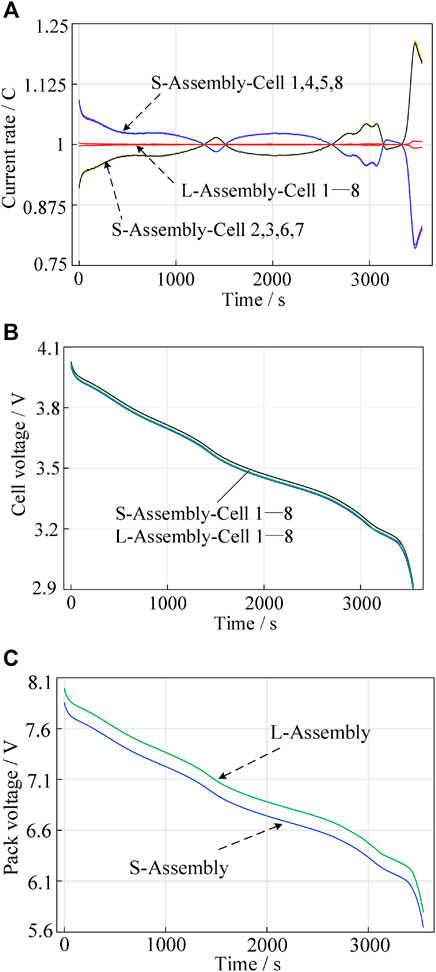
FIGURE 6. (A) Cell current distribution of two assembly methods. (B) Cell voltage distribution of two assembly methods. (C) Pack voltage distribution of two assembly methods.
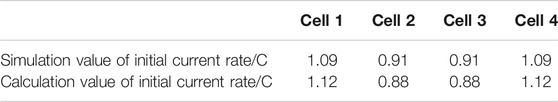
TABLE 4. Simulation and calculation values of initial cell current rate of the parallel module for S-Assembly.
As shown in Figure 6B, the cell current consistency does not cause a significant difference in the cell terminal voltage. This means that the uneven cell current distribution is difficult to be reflected by the cell terminal voltage in practical applications. However, differences in the assembly method can lead to the different terminal voltage of the battery pack, and the terminal voltage of the battery pack of L-Assembly is significantly higher than that of S-Assembly. It is related to the geometry of the nickel plate in the series–parallel battery pack and the current path in the nickel plate. Obviously, the slender nickel plate in S-Assembly has a longer distance for the current path and a smaller cross-sectional area perpendicular to the current direction, which means that the equivalent resistance of S-Assembly is larger than that of L-Assembly. Therefore, the increase of voltage loss results in a low terminal voltage.
Therefore, whether in terms of cell current consistency or pack terminal voltage, the series assembly method that parallel modules connected through the long surface (L-Assembly) performs better. In summary, the distance between each cell and the assembly contact surface should be equal when the parallel modules connected by nickel plates are assembled in series so that the equivalent resistance of each parallel branch is the same. Meanwhile, the equivalent resistance of parallel modules should be reduced as much as possible to reduce the voltage loss of the battery pack.
Influence of Module Collector Position
The 1°C discharge simulation results of the 5s4p battery pack are shown in Figure 7. The left part is the simulation result of the Z-configuration, and the right part is that of the ladder configuration. Obviously, the ladder and Z-configuration have the same effect on the distributions of cell current, voltage, and SoC and the terminal voltage of the battery pack. There is a new discovery in this paper that the cell currents of the non-edge parallel module of the series–parallel battery pack are consistent, which means that the non-edge parallel module part can be replaced with the SCM connection topology.
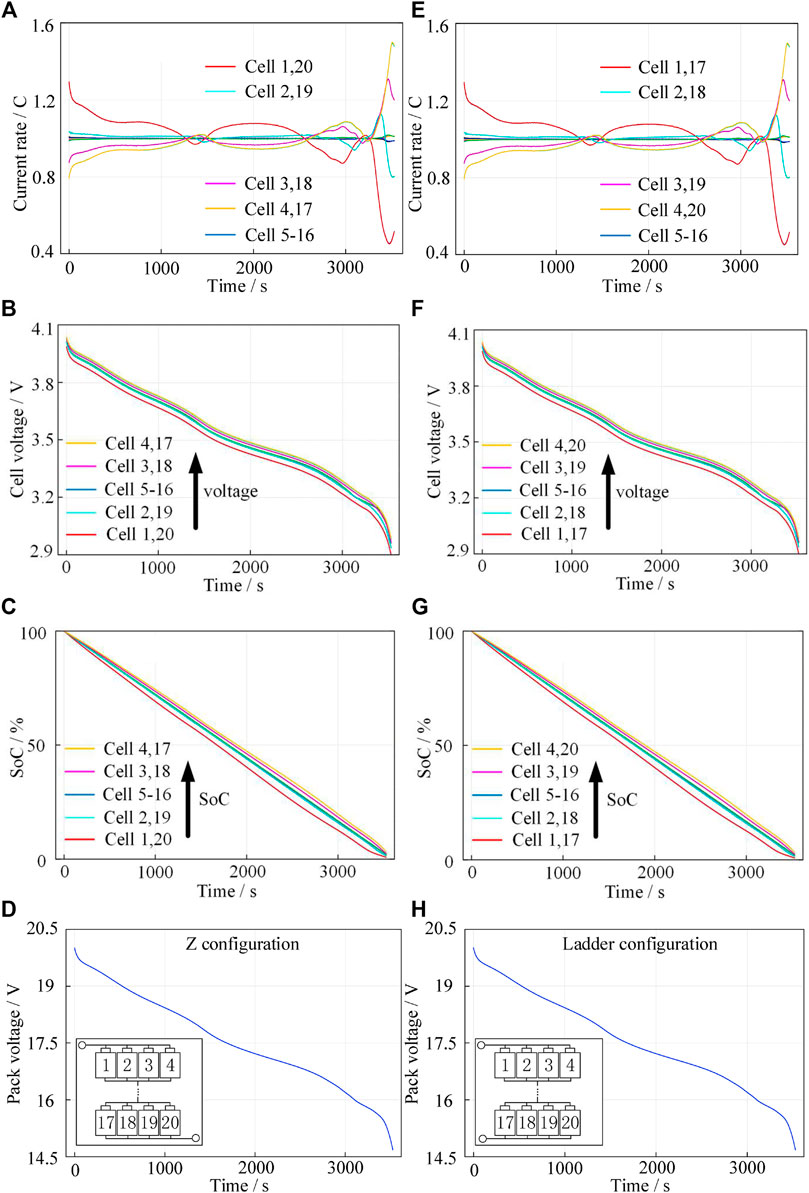
FIGURE 7. Simulation results of the 5s4p pack: (A–D) Cell current distribution, cell voltage distribution, cell SoC distribution, and battery pack voltage of the Z-configuration. (E–H) Cell current distribution, cell voltage distribution, cell SoC distribution, and battery pack voltage of the ladder configuration.
Influence of Value of Connector Resistance
According to the findings in the Influence of Module Collector Position, non-edge parallel modules have good cell current consistency with the same cell current rate, but the edge parallel modules of a series–parallel battery pack have inconsistency among the cell currents, and the shorter distance between the cell and the module collector leads to the higher current rate of the cell. The connector resistance affects the current distribution at the initial moment of discharge and directly determines the ratio of cell currents in edge parallel modules. Figure 8 shows the cell current rate of an edge parallel module at the beginning of the discharge process with different pack discharge currents (1, 1.5, 2, 2.5, 3C), where Cell 1 is the closest one to the module collector. For different pack discharge currents, the cell current ratio (Cell 1 to Cell 4) of the edge parallel module at the beginning of the discharge process is the same with 1:0.80:0.67:0.61.

FIGURE 8. Cell current rate of the edge parallel module.
Based on the characteristics of the cell current distribution of the series–parallel battery pack, the ECM of the edge parallel module of the 5s4p battery pack is provided, as shown in Figure 9. Therefore, the cell current distribution of the edge parallel module can be expressed by the following equations:
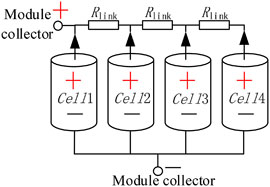
FIGURE 9. Equivalent circuit model of the edge parallel module of the 5s4p battery pack.
According to Eq. 10, the matrix equation of the initial cell current distribution of the edge parallel module is obtained, that is,
From Eq. 11, the ratio of the initial discharge current of Cell 1 to Cell 4 in the edge parallel module is
where I1 is the current of the cell closest to the module collector. Table 5 shows the simulation and calculation results of the initial cell current ratio of the edge parallel module. It can be seen that the calculated values are relatively consistent with the simulated values, which proves the validity of Eq. 11 and Eq. 12. Thus, the initial cell current distribution of the nP edge parallel module can be obtained as
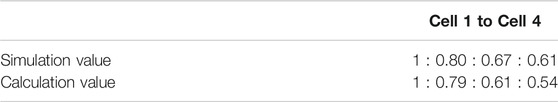
TABLE 5. Simulation and calculation values of initial cell current ratio of the edge parallel module.
From Eq. 13, the ratio of the initial discharge current of each cell in the edge parallel module is related to the ratio of the connector resistance and the cell Ohmic internal resistance θ, and the smaller θ contributes to the better cell current consistency. When the parallel number
where
Influence of Current Rate
The model validation results at high C-rates are shown in the supplementary material. Figure 10 shows the cell capacity utilization under different battery pack discharge current rates. The maximum, minimum, and average values of cell capacity utilization decrease with the increase of pack discharge current, which means that the cells are not completely discharged under high current rate conditions. The increase in battery discharge current leads to an increase in cell current. Due to the internal resistance of the battery, the larger cell current results in a larger Ohmic voltage. Therefore, the cell reaches the discharge cut-off voltage early, which in turn leads to capacity loss of the battery pack.
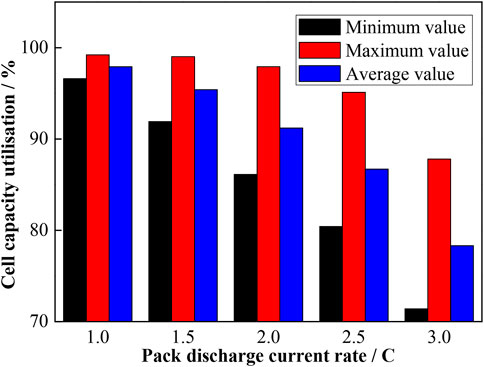
FIGURE 10. Cell capacity utilization under different battery pack discharge current rates.
It can also be seen from Figure 10 that the difference between the maximum and minimum values of cell capacity utilization increases with the increase of pack discharge current, which means that the increase of pack discharge current leads to an increase in the cell capacity inconsistency. According to the conclusions of the Influence of Value of Connector Resistance, the ratio of cell initial discharge current is the same when the connection resistance is constant. However, with the increase of pack discharge current, the difference of cell current also increases, which leads to an increase in SOC variation between cells.
Limitations and Future Work
The purpose of this paper is to study the influence of the assembly method and connector resistance, and a batch of cells with consistent parameters is needed to exclude the influence of single-cell inconsistencies. Therefore, the study requires a large number of cells with specific parameters, which causes the difficulty in statistical experiments. In this paper, the combination of the 3D geometry model and the corresponding ECM is achieved by COMSOL Multiphysics. Although the Thevenin model is not exactly the same as the actual battery, ignoring the effects of degradation and temperature, they are considered valid for the purposes of the paper.
Based on the results of the current study and the advantages of COMSOL Multiphysics in multiphysics field simulation, future work will focus on the influence of battery heating on the battery pack by adding heat-transfer fields to the existing pack model and exploring better methods to reduce the influence of temperature in terms of battery pack assembly.
Conclusion
In this paper, cells are connected in parallel by nickel plates to form a parallel module. Based on the parallel module, two series assembly methods for parallel modules are proposed. The performance differences between the two assembly methods are analyzed and verified based on the ECM and mathematical model. Then, the 5s4p PCM connection topology is constructed by the better assembly method. With COMSOL Multiphysics, the combination of a 3D geometry model and an ECM is achieved. Through 1C constant current discharge simulation, the advantages and disadvantages of the two assembly methods are verified, and the influences of MCP, connector resistance, and current rate on the performance of the series–parallel battery pack assembled by nickel plates are studied. The main conclusions of this paper are as follows:
1) The differences in series assembly methods of parallel modules lead to the different equivalent resistance distributions of the parallel branch, which leads to the different cell current distributions and the difference of battery pack voltage. The assembly method with an equal distance between each cell and the assembly contact surface is more suitable for series assembly of parallel modules.
2) The Z-configuration and the ladder configuration have the same effect on the distributions of cell performance parameters and the terminal voltage of a series–parallel battery pack. However, cell current consistency in a parallel battery pack or in the edge parallel module at the beginning of discharge is related to the ratio of connector resistance and cell Ohmic resistance. Meanwhile, the cell current inconsistency increases with the increase of the ratio and parallel number.
3) Large battery pack currents can lead to inadequate discharge of the battery pack and aggravate cell capacity inconsistency. In order to improve the efficiency and extend the life of the battery pack, large current discharges should be avoided.
Data Availability Statement
The raw data supporting the conclusions of this article will be made available by the authors, without undue reservation.
Authors Contributions
Conceptualization, LC and CL; Methodology, LC, CL, and CM; Software, LC and CL; Validation, CM and LC; Data curation, LC and CL; Writing—original draft preparation, CL and LC; Writing—review and editing, CL, LC, XL, and ZY; Supervision, HL.
Funding
This work was funded by the National Natural Science Foundation of China (grant number 62103242, 61633015, 51774193, U1764258, U1864205) and the Key Technology Research and Development Program of Shandong (grant number 2019GHY112072, 2019GHY112051).
Conflict of Interest
The authors declare that the research was conducted in the absence of any commercial or financial relationships that could be construed as a potential conflict of interest.
Publisher’s Note
All claims expressed in this article are solely those of the authors and do not necessarily represent those of their affiliated organizations or those of the publisher, the editors, and the reviewers. Any product that may be evaluated in this article or claim that may be made by its manufacturer is not guaranteed or endorsed by the publisher.
Supplementary Material
The Supplementary Material for this article can be found online at: https://www.frontiersin.org/articles/10.3389/fenrg.2022.804303/full#supplementary-material
Abbreviation
CC, Constant current; CP, Polarization capacitance of cell F; ECM, Equivalent circuit model; ESS, Energy storage system; EV, Electric vehicle; I, Discharge current A; L,Conductor length m; L-Assembly, Assembly method that parallel modules connected through the long surface; MCP, Module collector position; OCV, Open-circuit voltage V; PCM, Parallel cell module; R, Resistance of cell Ω; Rinter, Connector resistance between adjacent parallel modules Ω; Rlink, Connector resistance between adjacent cells in the same parallel module Ω; Rp, Polarization resistance of cell Ω; R0, Ohmic internal resistance of cell Ω; S, Conductor cross-sectional area m2; SCM, Series cell module; SoC, State of charge %; S-Assembly, Assembly method that parallel modules connected through the short surface; U, Terminal voltage of cell V; UP, Polarization voltage of cell V; τ, Time constant of cell s; ρ, Conductor material resistivity Ω•m;
References
Baumann, M., Wildfeuer, L., Rohr, S., and Lienkamp, M. (2018). Parameter Variations within Li-Ion Battery Packs - Theoretical Investigations and Experimental Quantification. J. Energ. Storage 18, 295–307. doi:10.1016/j.est.2018.04.031
Brand, M. J., Hofmann, M. H., Steinhardt, M., Schuster, S. F., and Jossen, A. (2016). Current Distribution within Parallel-Connected Battery Cells. J. Power Sourc. 334, 202–212. doi:10.1016/j.jpowsour.2016.10.010
Brand, M. J., Schmidt, P. A., Zaeh, M. F., and Jossen, A. (2015). Welding Techniques for Battery Cells and Resulting Electrical Contact Resistances. J. Energ. Storage 1, 7–14. doi:10.1016/j.est.2015.04.001
Bruen, T., and Marco, J. (2016). Modelling and Experimental Evaluation of Parallel Connected Lithium Ion Cells for an Electric Vehicle Battery System. J. Power Sourc. 310, 91–101. doi:10.1016/j.jpowsour.2016.01.001
Chang, Long., Duan, B., Li, P., Zhang, K., and Xiao, L. (2019). “Influence of Interconnect Resistances on Parallel-Connected LiFePO 4 Cells Performance,” in Paper read at 2019 3rd Conference on Vehicle Control and Intelligence (CVCI). doi:10.1109/cvci47823.2019.8951721
Chang, L., Wang, C., Zhang, C., Xiao, L., Cui, N., Li, H., et al. (2020). A Novel Fast Capacity Estimation Method Based on Current Curves of Parallel-Connected Cells for Retired Lithium-Ion Batteries in Second-Use Applications. J. Power Sourc. 459 (C), 227901. doi:10.1016/j.jpowsour.2020.227901
Dubarry, M., Devie, A., Stein, K., Tun, M., Matsuura, M., and Rocheleau, R. (2017). Battery Energy Storage System Battery Durability and Reliability under Electric Utility Grid Operations: Analysis of 3 Years of Real Usage. J. Power Sourc. 338, 65–73. doi:10.1016/j.jpowsour.2016.11.034
Ebner, M., Marone, F., Stampanoni, M., and Wood, V. (2013). Visualization and Quantification of Electrochemical and Mechanical Degradation in Li Ion Batteries. Science 342 (6159), 716–720. doi:10.1126/science.1241882
Feng, Hailong., Wang, Zhifu., and Zhang, Fujun. (2021). H∞–Adaptive H∞ Algorithm-Based State of Charge Estimation Considering the Hysteresis Effect for Lithium Polymer Battery. Front. Energ. Res.
Fill, A., Koch, S., and Birke, K. P. (2019). Analytical Model of the Current Distribution of Parallel-Connected Battery Cells and Strings. J. Energ. Storage 23, 37–43. doi:10.1016/j.est.2019.02.031
Fill, A., Koch, S., Pott, A., and Birke, K.-P. (2018). Current Distribution of Parallel-Connected Cells in Dependence of Cell Resistance, Capacity and Number of Parallel Cells. J. Power Sourc. 407, 147–152. doi:10.1016/j.jpowsour.2018.10.061
Grün, T., Stella, K., and Wollersheim, O. (2018). Influence of Circuit Design on Load Distribution and Performance of Parallel-Connected Lithium Ion Cells for Photovoltaic home Storage Systems. J. Energ. Storage 17, 367–382. doi:10.1016/j.est.2018.03.010
Hosseinzadeh, E., Arias, S., Krishna, M., Worwood, D., Barai, A., Widanalage, D., et al. (2021). Quantifying Cell-To-Cell Variations of a Parallel Battery Module for Different Pack Configurations. Appl. Energ. 282, 115859 (PA). doi:10.1016/j.apenergy.2020.115859
Hosseinzadeh, Elham., Ximena Odio, Maria., Marco, James., and Jennings, Paul. (2019a). “Unballanced Performance of Parallel Connected Large Format Lithium Ion Batteries for Electric Vehicle Application,” in Paper read at 2nd International Conference on Smart Energy Systems and Technologies (SEST), at Porto, PORTUGAL, Sep 09-11 (IEEE).
Hosseinzadeh, E., Marco, J., and Jennings, P. (2019b). Combined Electrical and Electrochemical-thermal Model of Parallel Connected Large Format Pouch Cells. J. Energ. Storage 22 (APR), 194–207. doi:10.1016/j.est.2019.02.004
Hosseinzadeh, E., Marco, J., Jennings, P., and Taniguchi, Izumi. (2017). Electrochemical-Thermal Modelling and Optimisation of Lithium-Ion Battery Design Parameters Using Analysis of Variance. Energies 10 (9), 1278. doi:10.3390/en10091278
Hu, Q., Li, W., and Peng, Y. (2015). Review on Safety Technologies for Li-Ion Battery Pack. Mar. Electric Electron. Eng. 35 (05), 35–39. doi:10.13632/j.meee.2015.05.010
Luan, C., Ma, C., Wang, C., Chang, L., Xiao, L., Yu, Z., et al. (2021). Influence of the Connection Topology on the Performance of Lithium-Ion Battery Pack under Cell-To-Cell Parameters Variations. J. Energ. Storage 41, 102896. doi:10.1016/J.EST.2021.102896
Lv, J., Lin, S., Song, W., Chen, M., Feng, Z., Li, Y., et al. (2019). Performance of LiFePO4 Batteries in Parallel Based on Connection Topology. Appl. Energ. 252, 113407. doi:10.1016/j.apenergy.2019.113407
Mahmoudzadeh Andwari, A., Pesiridis, A., Rajoo, S., Martinez-Botas, R., and Esfahanian, V. (2017). A Review of Battery Electric Vehicle Technology and Readiness Levels. Renew. Sust. Energ. Rev. 78, 414–430. doi:10.1016/j.rser.2017.03.138
Offer, G. J., Yufit, V., Howey, D. A., Wu, B., and Brandon, N. P. (2012). Module Design and Fault Diagnosis in Electric Vehicle Batteries. J. Power Sourc. 206, 383–392. doi:10.1016/j.jpowsour.2012.01.087
Pivot power EDF renewable UK [internet] (2019). Available from: https://www.pivot-power.co.uk/press-release/pivot-power-leads-one-of-the-largest-energy-innovation-projects-in-the-uk-with-the-energy-superhub-in-oxford/.
Plett, G. L., and Klein, M. J. (2009). Simulating Battery Packs Comprising Parallel Cell Modules and Series Cell Modules.
Rogers, D. J., Aslett, L. J. M., and Troffaes, M. C. (2021). Modelling of Modular Battery Systems under Cell Capacity Variation and Degradation. Appl. Energ. 283, 116360. doi:10.1016/J.APENERGY.2020.116360
Rothgang, S., Baumhöfer, T., and Sauer, D. U. (2015a). “Necessity and Methods to Improve Battery Lifetime on System Level,” in Paper read at International Electric Vehicle Symposium & Exhibition.
Rothgang, S., Baumhöfer, T., van Hoek, H., Lange, T., De Doncker, R. W., and Sauer, D. U. (2015b). Modular Battery Design for Reliable, Flexible and Multi-Technology Energy Storage Systems. Appl. Energ. 137, 931–937. doi:10.1016/j.apenergy.2014.06.069
Ruan, H., Sun, B., Jiang, J., Zhang, W., He, X., Su, X., et al. (2021). A Modified-Electrochemical Impedance Spectroscopy-Based Multi-Time-Scale Fractional-Order Model for Lithium-Ion Batteries. Electrochimica Acta 394, 139066. doi:10.1016/j.electacta.2021.139066
Rumpf, K., Rheinfeld, A., Schindler, M., Keil, J., Schua, T., and Jossen, A. (2018). Influence of Cell-To-Cell Variations on the Inhomogeneity of Lithium-Ion Battery Modules. J. Electrochem. Soc. 165 (11), A2587–A2607. doi:10.1149/2.0111811jes
Saw, L. H., Ye, Y., Tay, A. A. O., and Tay, O. (2016). Integration Issues of Lithium-Ion Battery into Electric Vehicles Battery Pack. J. Clean. Prod. 113, 1032–1045. doi:10.1016/j.jclepro.2015.11.011
Saxena, S., Xing, Y., Kwon, D., and Pecht, M. (2019). Accelerated Degradation Model for C-Rate Loading of Lithium-Ion Batteries. Int. J. Electr. Power Energ. Syst. 107, 438–445. doi:10.1016/j.ijepes.2018.12.016
Shang, Yunlong., Zhu, Chong., Fu, Yuhong., and Mi, Chunting. Chris. (2019). An Integrated Heater Equalizer for Lithium-Ion Batteries of Electric Vehicles. IEEE Trans. Ind. Elect. 66 (6). doi:10.1109/tie.2018.2863187
Wang, J., Zhang, S., and Hu, X. (2021). A Fault Diagnosis Method for Lithium-Ion Battery Packs Using Improved RBF Neural Network. Front. Energ. Res. 9. doi:10.3389/FENRG.2021.702139
Wang, L., Cheng, Y., and Zhao, X. (2015). Influence of Connecting Plate Resistance upon LiFePO4 Battery Performance. Appl. Energ. 147, 353–360. doi:10.1016/j.apenergy.2015.03.016
Wang, L., and Cheng, Y. (2015). The Effects of Connecting Plate Resistance on the Performance of Power Battery for Electric Vehicles. Autom Eng. 37 (01), 62–66. doi:10.19562/j.chinasae.qcgc.2015.01.011
Wu, B., Yufit, V., Marinescu, M., Offer, G. J., Martinez-Botas, R. F., and Brandon, N. P. (2013). Coupled thermal-electrochemical Modelling of Uneven Heat Generation in Lithium-Ion Battery Packs. J. Power Sourc. 243 (C), 544–554. doi:10.1016/j.jpowsour.2013.05.164
Wu, L., Liu, K., and Pang, H. (2021). Evaluation and Observability Analysis of an Improved Reduced-Order Electrochemical Model for Lithium-Ion Battery. Electrochimica Acta 368, 137604. doi:10.1016/j.electacta.2020.137604
Zhang, Yanhui., Zheng, Jiyong., Lin, Shili., Bai, Fanfei., Hassan Tanveer, Waqas., Cha, Sukwon., et al. (2018). Nonuniform Current Distribution within Parallel‐connected Batteries. Int. J. Energ. Res. 42 (8), 2835–2844. doi:10.1002/er.4039
Zhou, Z., Duan, B., Kang, Y., Cui, N., Shang, Y., and Zhang, C. (2019). A Low-Complexity State of Charge Estimation Method for Series-Connected Lithium-Ion Battery Pack Used in Electric Vehicles. J. Power Sourc. 441 (C), 226972. doi:10.1016/j.jpowsour.2019.226972
Keywords: lithium-ion battery, series–, parallel battery pack, assembly method, connector resistance, cell current distribution
Citation: Chang L, Ma C, Luan C, Sun Z, Wang C, Li H, Zhang Y and Liu X (2022) Influence of the Assembly Method on the Cell Current Distribution of Series–Parallel Battery Packs Based on Connector Resistance. Front. Energy Res. 10:804303. doi: 10.3389/fenrg.2022.804303
Received: 29 October 2021; Accepted: 10 January 2022;
Published: 04 February 2022.
Edited by:
Caiping Zhang, Beijing Jiaotong University, ChinaReviewed by:
Haijun Ruan, Imperial College London, United KingdomJichao Hong, University of Science and Technology Beijing, China
Copyright © 2022 Chang, Ma, Luan, Sun, Wang, Li, Zhang and Liu. This is an open-access article distributed under the terms of the Creative Commons Attribution License (CC BY). The use, distribution or reproduction in other forums is permitted, provided the original author(s) and the copyright owner(s) are credited and that the original publication in this journal is cited, in accordance with accepted academic practice. No use, distribution or reproduction is permitted which does not comply with these terms.
*Correspondence: Yulong Zhang, zhangyl@sdust.edu.cn