An Investigation of the Optimum Solar Flux Distribution on a Large-Scale Particle Heating Receiver
 Abdelrahman El-Leathy1,2
  Hany Al-Ansary1,3*
  Syed Noman Danish4
  Anas Alsuhaibani1
  Abdulelah Alswaiyd1
- 1Mechanical Engineering Department, King Saud University, Riyadh, Saudi Arabia
- 2Mechanical Power Engineering Department, Faculty of Engineering, Helwan University, Cairo, Egypt
- 3K.A.CARE Energy Research and Innovation Center at Riyadh, Riyadh, Saudi Arabia
- 4Sustainable Energy Technologies Center, King Saud University, Riyadh, Saudi Arabia
Solid particles have been shown to be an effective heat transmission as well as thermal storage medium for falling particle receiver based solar power systems at temperatures up to 1,000°C. The temperature distribution on the surface of the falling particle receiver is critical. High temperatures, thermal shocks, and temperature gradients produce substantial stresses on the receiver due to high, fluctuating, and non-homogeneous solar flux. To this effect, the optimum control of the heliostats’ aiming points is one of the obstacles that must be overcome. The flux distribution on the receiver surface must be carefully managed to avoid dangerous flux peaks or excessive temperature gradients which might result in local hot spots resulting in damage of the receiver’s internal components over time. To overcome this problem, specifying multiple aiming points on the receiver aperture may control the solar flux distribution. In this study both single and multi aiming points strategies are applied by assigning a group of heliostats to a specific aim point on the receiver, resulting in a uniform flux distribution over the receiver surface. Engineering software packages SolarPILOT, SOLTRACE and MATLAB are used in combination to get the optimal flux distribution. The results showed that the flux distribution is improved significantly after employing the multi aiming points strategy at the expense of greater spillage.
Introduction
By 2050, the global energy demand is projected to increase by more than 66% based on 2011 global energy demand (IEA, 2014). Several countries around the world have agreed to decrease carbon emissions to keep global average temperature rise well below 2°C, according to the Paris Agreement (United Nations, 2015). A reliable, sustainable, and cost-effective carbon-free energy production is required to meet tomorrow’s energy demands. In 2020, the share of renewable energy in global electricity generation reached 28.6% (IEA, 2021) and must reach 65% to meet the goal of reducing CO2 emissions to the limit as per ETP 2014 2°C Scenario (IEA, 2014). Under the Saudi Vision 2030, the goals for the Kingdom’s National Renewable Energy Program (NREP) were revised to generate 27.3 GW of renewable energy by 2024 and 58.7 GW by 2030 with a capacity of 2.7 GW from concentrated solar power (CSP) (Middle East Business Intelligence, MEED, 2019).
New technology in CSP is being developed in Saudi Arabia by the authors and in other countries (Abdelrahman et al., 2019; Al-Ansary et al., 2020; Alaqel et al., 2021; Xie et al., 2022) which is the solid particle heating receiver based CSP systems. A Particle Heating Receiver (PHR) is a direct absorption central receiver with a falling curtain of particles heated directly by a concentrated beam of sunlight from a heliostat field (Wang et al., 2021). The PHR was initially developed in the 1980s by Sandia National Laboratories as a way to increase the operating temperature of solar central receivers above the highest achieved temperature of 557 ̊C with molten salt as a heat transfer medium (Falcone et al., 1985).
A 1.3MWe CSP plant using the PHR technology is being designed by the authors and going to be built in the northern border province of Saudi Arabia. The plant will serve as a pre-commercial demonstration plant for larger plants that would use the same technology in the future. The PHR, shown in Figure 1, consists of five panels inside a cavity with a rectangular aperture of 2.3 m in height and 2.7 m in width, and each panel is tilted at 15° (Sarfraz et al., 2021). The cavity depth is 1.4 m at the center of the receiver. The solar field in the design of the plant consists of 9,907 Heliogen heliostats with a total reflective area of ∼15,000 m2. The Heliogen heliostat is an octagon like shape with a reflective area of 1.5 m2.
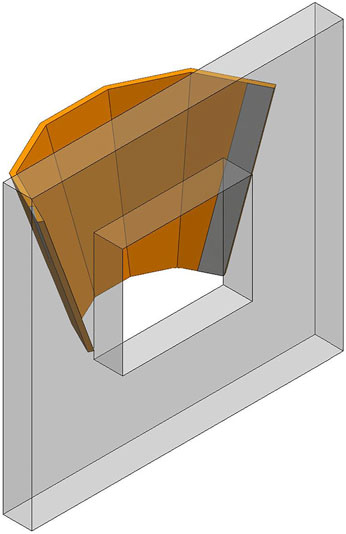
FIGURE 1. PHR design of the 1.3 MWe CSP plant.
Typically, the entire heliostats aim at a single point which is at the center of the cavity opening (aperture). The spillage, in this case, will be at the minimum, but the concentrated solar flux will be very high in the middle panel of the receiver. The solar flux distribution on the receiver panels is critical since flux peaks or excessive temperature gradients might result in local hot spots and, as a result, the receiver’s internal components will be damaged over time (Salomé et al., 2013). Additionally, the unbalanced flux distribution results in a large difference in the heat input between the panel, thus insufficient heating of the particles at the low solar flux areas.
Previous studies reveal that the whole heliostat field usually aims at a single targeting point which is usually at the receiver center, which results in maximum output power. However, this usually forms a Gaussian-like distribution shape with a high peak flux density in the middle (He et al., 2013; Farges et al., 2015). Numerous experimental and computational studies have been conducted to investigate the solar flux distribution. Reference (Röger et al., 2014) discussed most of the experimental techniques to measure solar flux density distribution on receivers. They applied various techniques to measure the flux distribution at the receiver of the solar tower at Plataforma Solar de Almeria. A novel experimental technique called the photographic flux mapping method was applied on the solar receiver operated by Sandia National Laboratories in New Mexico, USA (Ho et al., 2012). They found an excellent relative accuracy of 2% of peak flux when the other required parameters are precisely known. For computational studies, various software tools have been developed including HFLCAL (Schwarzbözl et al., 2009), MIRVAL (Leary and Hankins 1979), DELSOL (Kistler, 2009), SOLTRACE (Wendelin and Wagner, 2018), etc. Many investigators have used those software packages to estimate solar flux distribution (Mecit et al., 2014; He et al., 2019; Zhu et al., 2022).
For the optimization of the solar flux distribution, various investigations have been done and suggested either of the following three ways:
1. Optimum receiver and solar field system design (Li et al., 2020; Madadi Avargani et al., 2021)
2. Alternate methods of aiming (Garcí a et al., 2020; Acosta et al., 2021)
3. Modifying the heat transfer properties of the system by changing the operating conditions (Zhang et al., 2013; Rodríguez-Sánchez et al., 2018)
Single point aiming strategy, which was first suggested by reference (Vant-Hull, 2002), is investigated by various researchers (Sanchez-Gonzalez et al., 2017; Garcí a et al., 2020). However, the flux profile produced by this single-parameter aiming strategy is rather irregular, with different amplitudes along the receiver height. Reference (Belhomme et al., 2014) described an ant colony metaheuristic-based approach for optimizing the targeting multi points aim points, whose effectiveness was proved on a concentrated photovoltaic receiver test case. The flux-feedback closed-loop control law proposed by reference (Acosta et al., 2021) manipulates the swarm behavior of groups of multi aiming points for heliostats in the solar field. With a configuration of aiming points, the suggested controller can achieve a steady-state that is near to the best solution found using a hybrid optimization approach.
Literature review reveals that there is still a desire to improve solar tower aiming procedures, and this has yet to be applied to PHR systems. In this paper, the single aiming point strategy is examined and several multi aiming points strategies are proposed and assessed to have the receiver under the lowest possible maximum flux.
Methodology
Single Aiming Point Strategy
Single Aiming Point is a strategy where all the existing heliostats around the tower are aiming and reflecting the sunlight to the center of the aperture. There are 9,907 heliostats distributed in a radially staggered pattern around the tower with no blocking method for the radial spacing. Figure 2A shows the heliostat field layout generated by SolarPILOT (Wagner and Wendelin, 2018). The design point value of the Direct Normal Irradiance (DNI) for the plant is 733 W/m2 and the Sun position is at noon on the equinox. The design point parameters are used in all the simulations.
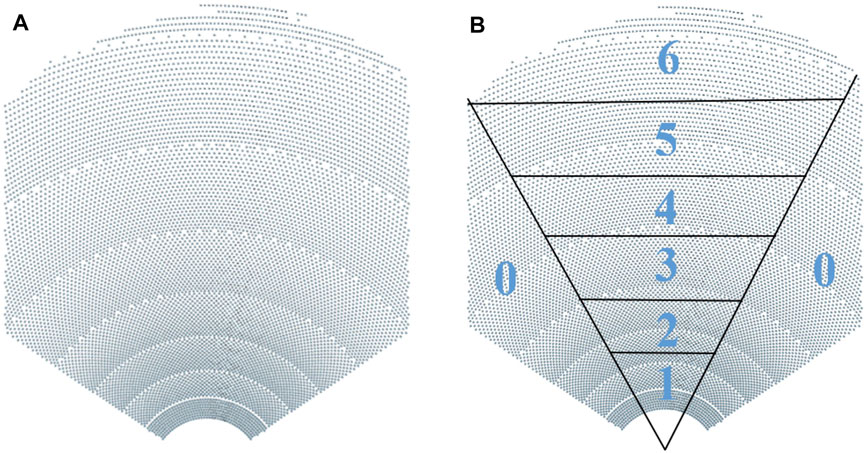
FIGURE 2. The heliostat field of the 1.3 MWe CSP plant generated by SolarPILOT.
The ray tracing is performed using the SOLTRACE to get the hit points on the aperture plane and the receiver’s panels. Those hit points are then uploaded in MATLAB to be organized in a format to plot the flux maps for the aperture and the receiver’s panels.
Multi Aiming Points Strategy
In this method, the heliostat field is divided into 7 clusters, from cluster 0 to cluster 6. Figure 2B shows the approximate zone location for each cluster. Since the reflected power of cluster 0 will always be delivered to the side panels and not to the central panel when it is aimed at the center of the aperture, the study will be limited to aiming the heliostats located in the middle group only which contributes to 78% (6,498 kW) of the total power delivered by the heliostat field. Hence, the heliostats in clusters one to six are grouped so that each cluster has equal power delivered to the receiver aperture (1,083 kW) with an acceptable margin of ±5%.
The aim points of clusters from one to six will be changed based on five equally spaced horizontal points along the width of the receiver aperture. Figure 3 illustrates those aim points on the aperture. To avoid any high flux intensity on one side of the receiver, balancing the clusters between the right and left sides was taken into consideration where clusters one and two have the same effect and should not be aimed at the same side. The same restriction is applied to clusters three and four.
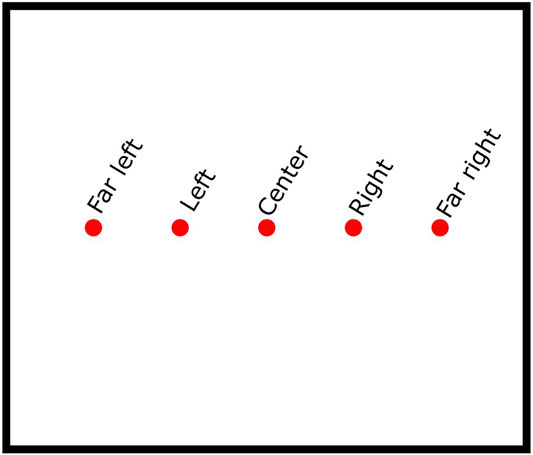
FIGURE 3. Aim points grid on the aperture.
Since the spillage is larger for the farther clusters, clusters one and two will have the lowest spillage compared to other clusters when they are aimed to the far left and far right. Hence, clusters other than one and two should not be aimed at the far left and far right as possible. Clusters five and six were set to be at the center or close to the center to prevent power slippage since they are the farthest clusters.
Table 1 shows the eight viable combinations of aiming options taking into consideration the previous constraints.
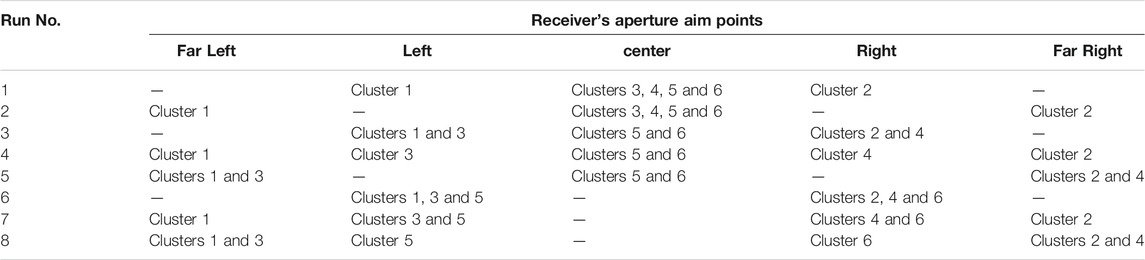
TABLE 1. Combinations of aiming options.
The solar time start from 06:00 a.m. till 06:00 p.m., and if the 12 h has been divided into four intervals, then the intervals are 06:00 a.m. till 09:00 a.m., 09:00 a.m. till 12:00 p.m., 12:00 p.m. till 03:00 p.m., and 03:00 p.m. till 06:00 p.m. The collected solar power during the first and fourth intervals will be excluded from this study as they are weak and can be neglected. However, the study will be limited to the second and third intervals as they have the highest collected power. Since these two intervals have the same collected power but in an opposite way, the second period will be considered only. To get better visualization, three different times from the second interval will be studied which are 09:00 a.m., 10:30 a.m., and 12:00 p.m.
Results and Discussion
Single Point Aiming Strategy
In single point aiming strategy, all the heliostats around the receiver tower are aiming/reflecting the sunlight to the center of the PHR panels.
Figure 4A,B show the flux maps on the aperture and the PHR panels at noon, respectively. It can be noticed from the flux maps that most of the concentrated solar energy is localized mainly at the center where there is relatively much less concentration at both sides (left and right). When all the heliostats are focused on the center of the aperture, the spillage will be minimum. The spillage was 5.7%.
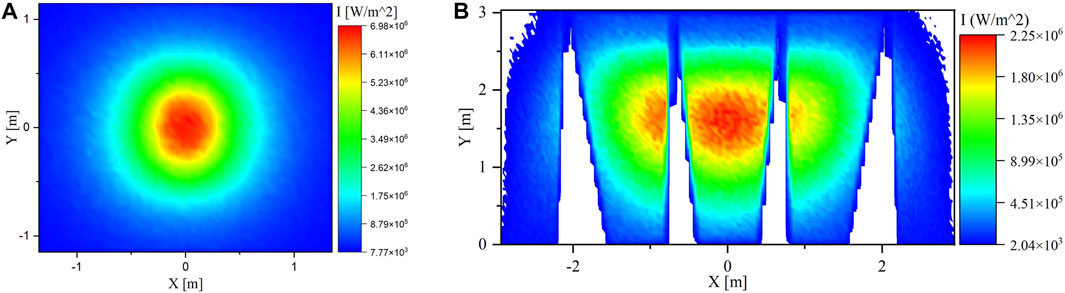
FIGURE 4. Flux Map on the Aperture and PHR panels at 12:00 p.m. where all clusters are aiming to the center (Single Aiming Point).
The main issue here is that the flux distribution in the case of a single point aiming strategy is not balanced throughout the PHR panels. As a result, there will be substantial high intensity solar flux at the center, causing the central PHR panel to overheat and melt in the long run. Furthermore, the particles in the center could be overheated and the particles in the sides could not be heated sufficiently.
Figure 5A,B show the flux maps at 9:00 a.m. and 10:30 a.m., respectively. The flux maps are slightly shifted toward the lift side, but there is no significant difference between noon and morning/evening times regarding the uniformity of the solar flux.
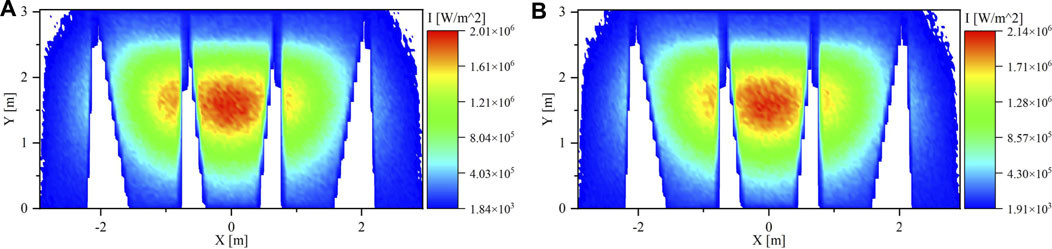
FIGURE 5. Flux Map on the PHR panels at (A) 9:00 a.m. and (B) 10:30 a.m. where all clusters are aiming to the center (Single Aiming Point).
Multi Aiming Points Strategy
In this strategy, there are eight combinations of aiming options for clusters 1 to 6. Figure 6A shows the result of the ray-tracing simulation for cluster 0 only aiming to the center of the aperture. The simulation was performed to validate that the reflected power will not negatively affect the uniformity of the flux distribution since it will be delivered to the side panels and not to the central panel.
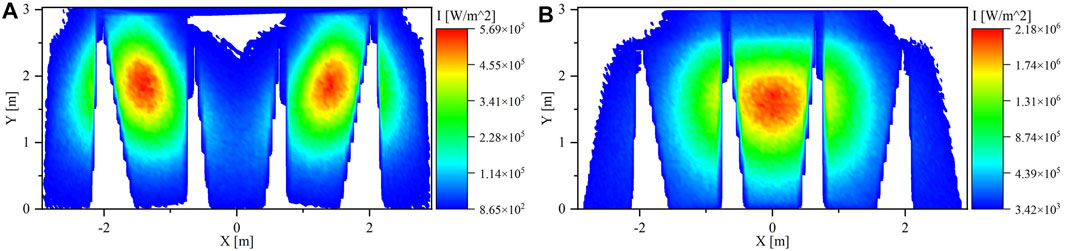
FIGURE 6. Flux Map on the PHR panels at 12:00 p.m. for (A) cluster 0 only and (B) all the clusters except cluster 0.
Figure 6B explains how the flux distribution will be if all the heliostats, except the heliostats in cluster 0, are aiming at the center of the aperture. The flux map shows that the flux distribution is concentrated mainly at the center panel where there is less power at both sides (left and right) compared to the center. Additionally, this is a validation that these clusters are controlling the flux distribution among the PHR panels. Hence, adjusting heliostat aiming points in those clusters will uniform the flux distribution.
For Run#1, the focus points of clusters one and two are moved to the left and the right points of the aperture, respectively. The flux uniformity on the PHR panels is improved as illustrated in Figure 7A. The maximum flux on the central panel was decreased from 2.25 to 2.18 MW/m2. The spillage didn’t increase and stayed at 5.7% since clusters one and two are the nearest clusters to the receiver, thus have a small Sun image.
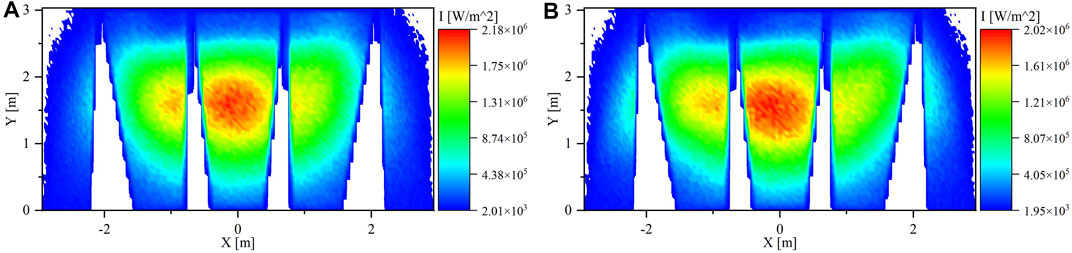
FIGURE 7. Flux Map on PHR panels at 12:00 p.m. for (A) Run#1 and (B) Run#2.
The clusters one and two were moved further away from the aperture center to the far left and far right in Run#2, respectively. Figure 7B displays the flux maps on the PHR panels. The maximum flux intensity was decreased even more to 2.02 MW/m2 at the central panel. However, the spillage increased to 6.4%. The increase in the spillage is due to that clusters one and two aim to points near the edge of the aperture. By comparing the flux maps of Run#1 and Run#2, the flux uniformity in the case of Run#2 is better. Moreover, the total power in the right and left panels increased by 1.6% compared with the total power in Run#1.
In Run#3, clusters three and four were moved with clusters one and two where clusters one and three aim to the left point and cluster two and four aim to the right point in the aperture. The flux maps on the PHR panels are shown in Figure 8A. The distribution of the solar flux on PHR panels was improved compared with the previous runs. the total power in the right and left panel slightly increased compared with the total power in Run#2. The spillage, in this case, is 6.0% less than Run#2 since there was no cluster in the far right and far left points of the aperture.
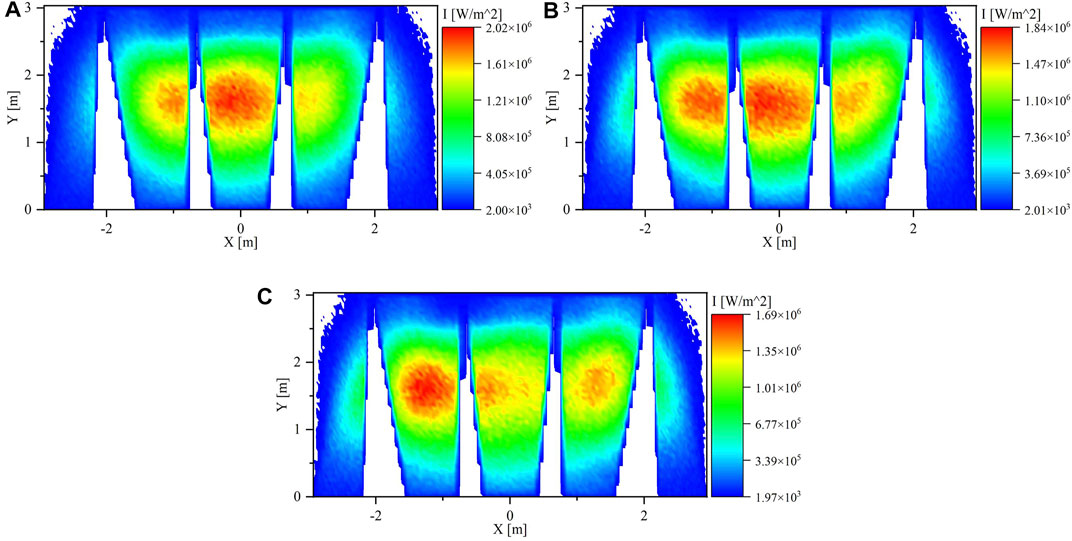
FIGURE 8. Flux Map on PHR panels at 12:00 p.m. for (A) Run#3, (B) Run#4 and (C) Run#5.
For Run#4, clusters one and two were moved to the far points in the aperture, and clusters three and four were kept in the same aim points as in Run#3. The solar flux was high along the horizontal axis in the PHR panels as shown in Figure 8B. Additionally, the total power in the right and left panel increased by 3.7% compared with the total power in Run#1 and 1.6% compared with Run#3. The spillage in this run is 6.8%. Since there are 4 clusters not aiming to the center of the aperture in this case, the spillage was expected to be more than the previous runs.
In the next run, which is Run#5, clusters three and four moved to the same aim points of clusters 1 and 2, respectively. Figure 8C shows the flux maps on the PHR panels. The solar flux is concentrated more to the left side due to the fact that the closer the cluster to the receiver the higher the flux concentration. Hence, clusters 1 and 3, which aim to the left side, are closer than clusters 2 and 4, which aim to the right side. The solar flux is distributed very well in this combination. However, the spillage is relatively high which is 10.1% because all clusters aim to the far side of the aperture except clusters five and 6.
The clusters five and six in all previous cases were aimed to the center of the aperture. The next three runs will be a replica of the previous three runs (Run#3 to Run#5) but with clusters five and six aiming to the left and right point of the aperture, respectively.
The flux map of Run#6 displayed in Figure 9A is comparable to the flux map of Run#3. The spillage increased to 7.8% compared with only 6.0% in the case of Run#3. the improvement of the flux uniformity, in this case, is very low whereas the spillage increased by about 30%.
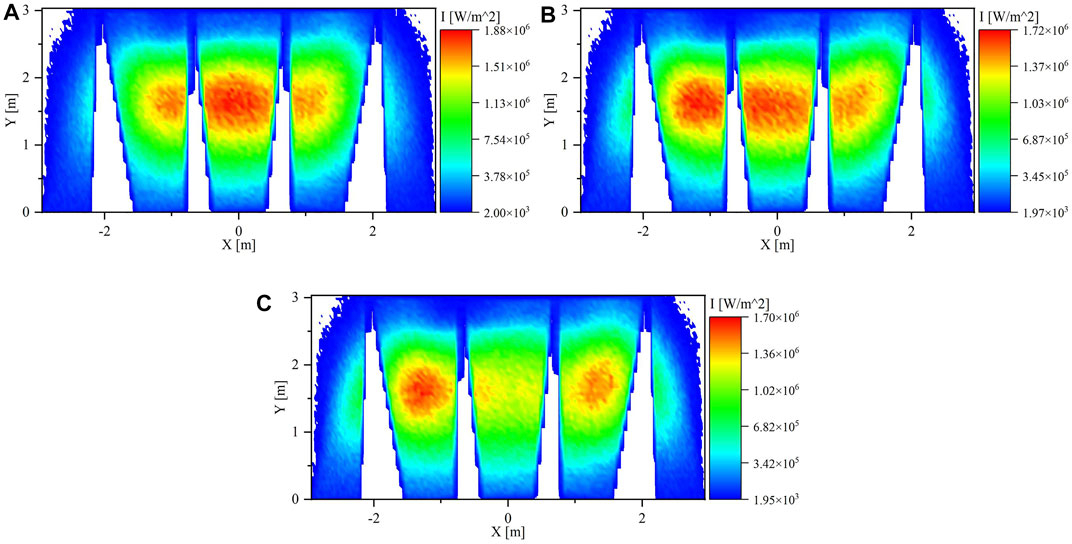
FIGURE 9. Flux Map on PHR panels at 12:00 p.m. for (A) Run#6, (B) Run#7 and (C) Run#8.
In Run#7, the aiming of clusters five and six to the left and right improve the flux uniformity in PHR panels compared with the results in Run#4. The flux map for this case is shown in Figure 9B. The spillage increased to 8.6% compared with 6.8% in Run#4.
In the last case, which is Run#8, there were 4 clusters aimed to the far sides of the aperture and 2 clusters to the left and right sides. The solar flux was more intense in the sides than in the center of the PHR as illustrated in Figure 9C. The spillage, in this case, is 10.4% which is the highest spillage value among all the cases.
To evaluate and select the optimum cluster aim points combination among the cases, there are two selection criteria to identify the best option. The First one is evaluating the cases based on the spillage. The second criterion is evaluating them based on the flux uniformity which is represented by the maximum and average flux. Some cases look similar to each other. So, to quantify this criterion, a statistical approach is used to determine how much the power and average flux of each PHR panel differ from the mean of them for the 5 PHR panels which is called the standard deviation (STD). When the solar flux is not uniformly distributed, the STD value will be large.Table 2 summarizes the spillage values, power, maximum and average flux received by each PHR panel. Run#8 has the maximum spillage value among the options which is considered a disadvantage, but it has the lowest STD values for the power, maximum and average flux. On the other hand, Run#1 has the lowest spillage value, but it has the highest STD values for the others.
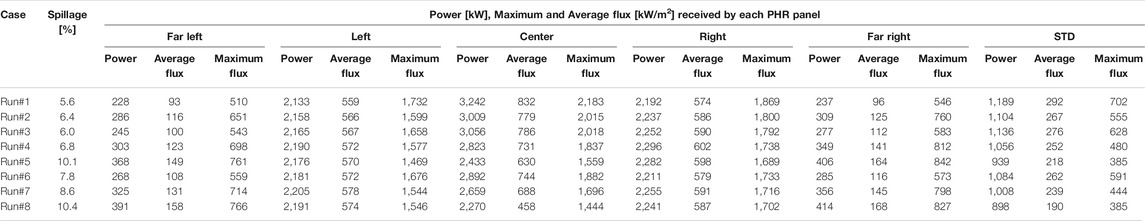
TABLE 2. Spillage values, power, maximum and average flux received by each PHR panel.
Based on what has been mentioned above, Run#4 and Run#2 have the optimum clusters aim points combinations. This selection was based on a 50/50 weight for each criterion. If the STD of the average flux received by PHR panels is emphasized, then the selection would be based on 40/60 weight for spillage and STD of the average flux, respectively. Based on that, Run#8 and Run#4 would be selected. If the spillage is emphasized, then Run#3 and Run#4 would be selected. Considering the maximum flux, Run#4 and Run#2 would be selected for all the scenarios.
The power values in Table 2 for the far right and far left panels are less than one-sixth of the least power value of the other panels. This large deviation means that a good level of uniformity is not achieved and the STD reflects that. The average flux in the far panels is suffering from the same issue. To improve the flux uniformity even more, the cluster 0 aim point will be adjusted so that the right part of the cluster will aim at the left side of the aperture, and the left side will aim at the right side of the aperture. This would reflect more power to the far right and far left panels as shown in Figure 10. The adjustment of cluster 0 aim point will be applied for Run#2, 3, and 4 as they were previously selected as optimum cases.
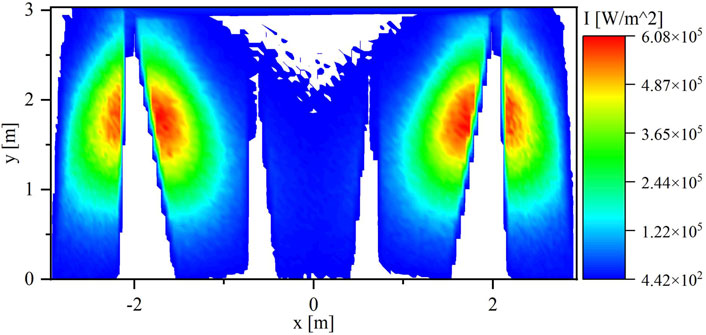
FIGURE 10. Flux Map on the PHR panels at 12:00 p.m. for cluster 0 only with aim points adjusted.
Figure 11 shows the flux maps of the three runs with cluster 0 aim points adjusted. Table 3 lists the power, maximum and average flux values for the original runs and the runs with the cluster 0 aim points adjusted and represented with an extra letter A. the power and average flux values increased by 62–94% and the maximum flux increased by 33–54% in the far panels compared with the original runs. In the center panels, the maximum flux decreased by 2–13%. The same technique is applied to evaluate the additional runs. Run#2A and Run#4A would be selected as the optimum clusters aim points combinations, but when the spillage is emphasized, Run#3A and Run#4A would be selected. Considering the maximum flux, Run#4 and Run#2 would be selected for all the scenarios.
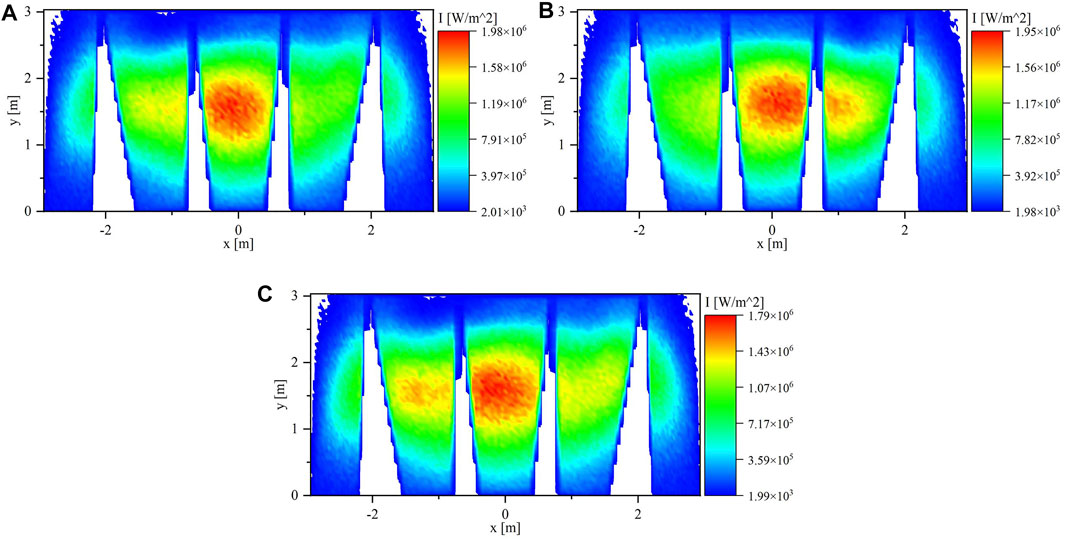
FIGURE 11. Flux Map on PHR panels at 12:00 p.m. for (A) Run#2, (B) Run#3, and (C) Run#4 with cluster 0 aim points adjusted.
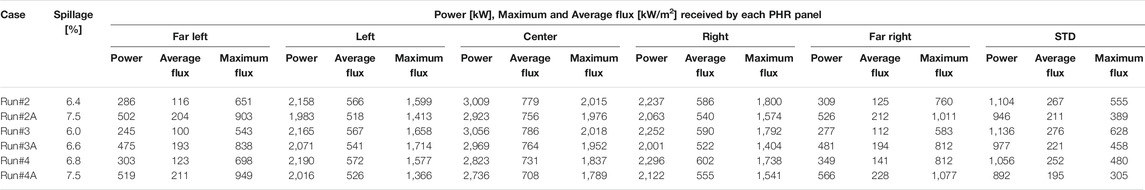
TABLE 3. Spillage values, power, maximum and average flux received by each PHR panel with the adjustment of cluster 0 aim points.
For the three scenarios, the case of Run#4A is the optimum case where it balances the flux distribution and spillage.
Discussion
The implementation of the single aiming point strategy in the large scale PHR increases the power concentration and maximum flux intensity on the central panel which may result in an overheating of the particles and damage to the receiver. Also, the side panels may not be able to heat the falling particles sufficiently due to the low flux intensity. In contrast, the multi aiming points strategy reduces the power concentration and maximum flux intensity on the central panel resulting in a reduction by 46% of the average flux in Run#8 and by 17% in the optimum clusters aiming combination (Run#4A).
Although aiming the heliostats to the side of the aperture increases the uniformity of the solar flux on the PHR panels, it increases the spillage which results in a reduction in the overall receiver efficiency. The grouping of the heliostats into multiple clusters to be controlled separately can determine the success of the implementation of the multi aiming points strategy. So, an efficient way to select the proper heliostat grouping and create a relation with the overall efficiency of the PHR would enhance the multi aiming points strategy.
In this study, only five aim points were considered in the horizontal direction of the receiver’s aperture only. Adoption of two-dimensional aim points in the aperture is needed for future work to improve the distribution of the solar flux in the horizontal as well as in the vertical axis of the PHR panels.
Conclusion
By allocating a set of heliostats to a specific aim point on the receiver, both single and multi aiming points techniques are used in this work, resulting in a uniform flux distribution over the receiver surface. Engineering software packages SolarPILOT, SOLTRACE, and MATLAB are used in combination to get the optimal flux distribution. The results showed that the flux distribution is improved significantly after employing the multi aiming points strategy. It was found that the case of Run#4A has the optimum clusters’ aim points combination as it will provide the user with a high level of flux uniformity and a reasonable power spillage in the PHR’s aperture. Since the PHR operates at higher temperatures than conventional molten salt receivers while they are limited to a temperature lower than 600 °C, it is recommended to validate the proposed combination experimentally.
Data Availability Statement
The raw data supporting the conclusions of this article will be made available by the authors, without undue reservation.
Author Contributions
AE-L distributed and oversaw the work HA-A reviewed and edited the manuscript SD contributed to writing the manuscript AA conducted the analysis AbA helped with the analysis and with writing the manuscript.
Funding
The authors extend their appreciation to the Deanship of Scientific Research at King Saud University for funding this work through research group no. RG-1440-087.
Conflict of Interest
The authors declare that the research was conducted in the absence of any commercial or financial relationships that could be construed as a potential conflict of interest.
Publisher’s Note
All claims expressed in this article are solely those of the authors and do not necessarily represent those of their affiliated organizations, or those of the publisher, the editors and the reviewers. Any product that may be evaluated in this article, or claim that may be made by its manufacturer, is not guaranteed or endorsed by the publisher.
References
Abdelrahman, E., Sheldon, J., Hany, A., Syed, N. D., Rageh, S., Said, A., et al. (2019). Thermal Performance Evaluation of Lining Materials Used in thermal Energy Storage for a Falling Particle Receiver Based CSP System. Solar Energy 178, 268–277. doi:10.1016/j.solener.2018.12.047
Acosta, D., Garcia, J., Sanjuan, M., Oberkirsch, L., and Schwarzbözl, P. (2021). Flux-feedback as a Fast Alternative to Control Groups of Aiming Points in Molten Salt Power Towers. Solar Energy 215, 12–25. doi:10.1016/j.solener.2020.12.028
Al-Ansary, H., El-Leathy, A., Alswaiyd, A., Alaqel, S., Saleh, N., Saeed, R., et al. (2020). Study of the Optimum Discrete Structure Configuration in Obstructed Flow Particle Heating Receivers. AIP Conf. Proc. 2303, 030001. doi:10.1063/5.0029145
Alaqel, S., Saleh, N. S., Djajadiwinata, E., Saeed, R., Alswaiyd, A., Al-Ansary, H., et al. (2021). A Novel Particle-To-Fluid Direct-Contact Counter-flow Heat Exchanger for CSP Power Generation Applications: Design Features and Experimental Testing. Renew. Energ. 170, 905–926. doi:10.1016/j.renene.2021.02.049
Belhomme, B., Pitz-Paal, R., and Schwarzbözl, P. (2014). Optimization of Heliostat Aim Point Selection for Central Receiver Systems Based on the Ant Colony Optimization Metaheuristic. ASME. J. Sol. Energ. Eng. February 136 (1), 011005. doi:10.1115/1.4024738
Falcone, P. K., Noring, J. E., and Hruby, J. M. (1985). Assessment of a Solid Particle Receiver for a High Temperature Solar Central Receiver System. Energ. Proced. 49, 20. doi:10.2172/6023191
Farges, O., Bézian, J. J., Bru, H., El Hafi, M., Fournier, R., and Spiesser, C. (2015). Life-time Integration Using Monte Carlo Methods when Optimizing the Design of Concentrated Solar Power Plants. Solar Energy 113, 57–62. doi:10.1016/j.solener.2014.12.027
García, J., Barraza, R., Soo Too, Y. C., Vásquez Padilla, R., Acosta, D., Estay, D., et al. (2020). Aiming Clusters of Heliostats over Solar Receivers for Distributing Heat Flux Using One Variable Per Group. Renew. Energ. 160, 584–596. doi:10.1016/j.renene.2020.06.096
He, C., Zhao, Y., and Feng, J. (2019). An Improved Flux Density Distribution Model for a Flat Heliostat (iHFLCAL) Compared with HFLCAL. Energy 189, 116239. doi:10.1016/j.energy.2019.116239
He, Y.-L., Cui, F.-Q., Cheng, Z.-D., Li, Z.-Y., and Tao, W.-Q. (2013). Numerical Simulation of Solar Radiation Transmission Process for the Solar tower Power Plant: From the Heliostat Field to the Pressurized Volumetric Receiver. Appl. Therm. Eng. 61 (Issue 2), 583–595. doi:10.1016/j.applthermaleng.2013.08.015
Ho, C. K., and Khalsa, S. S. (2012). A Photographic Flux Mapping Method for Concentrating Solar Collectors and Receivers. ASME. J. Sol. Energ. Eng. November 134 (4), 041004. doi:10.1115/1.4006892
IEA (2014). Technology Roadmap - Solar Thermal Electricity 2014. Paris: IEA. Available at: https://www.iea.org/reports/technology-roadmap-solar-thermal-electricity-2014.
IEA (2021). Renewable Power. Paris: IEA. Available at: https://www.iea.org/reports/renewable-power (Acessed date: November 2, 2021).
Kistler, B. (2009). DELSOL V. 3 (Version 00) [Computer Software]. Available at: https://www.osti.gov//servlets/purl/1231208 (November 1, 2021).
Leary, P. L., and Hankins, J. D. (1979). User's Guide for MIRVAL: A Computer Code for Comparing Designs of Heliostat-Receiver Optics for central Receiver Solar Power Plants. United States: N: Web. doi:10.2172/6371450
Li, L., Wang, B., Pye, J., and Lipiński, W. (2020). Temperature-based Optical Design, Optimization and Economics of Solar Polar-Field central Receiver Systems with an Optional Compound Parabolic Concentrator. Solar Energy 206, 1018–1032. doi:10.1016/j.solener.2020.05.088
Madadi Avargani, V., Norton, B., and Rahimi, A. (2021). An Open-Aperture Partially-Evacuated Receiver for More Uniform Reflected Solar Flux in Circular-Trough Reflectors: Comparative Performance in Air Heating Applications. Renew. Energ. 176, 11–24. doi:10.1016/j.renene.2021.05.072
Mecit, A. M., Miller, F. J., and Whitmore, A. (2014). Optical Analysis and Thermal Modeling of a Window for a Small Particle Solar Receiver. Energ. Proced. 49, 457–467. doi:10.1016/j.egypro.2014.03.049
Middle East Business Intelligence, MEED (2019). Saudi Arabia Sets New 58.7GW Renewable Energy Target for 2030. Available at: https://www.meed.com/saudi-arabia-renewable-energy-target (November 1, 2021).
Rodríguez-Sánchez, M. R., Sánchez-González, A., and Santana, D. (2018). Feasibility Study of a New Concept of Solar External Receiver: Variable Velocity Receiver. Appl. Therm. Eng. 128, 335–344. doi:10.1016/j.applthermaleng.2017.08.173
Röger, M., Herrmann, P., Ulmer, S., Ebert, M., Prahl, C., Göhring, F., et al. (2014). Techniques to Measure Solar Flux Density Distribution on Large-Scale Receivers. ASME. J. Sol. Energ. Eng. August 136 (3), 031013. doi:10.1115/1.4027261
Salomé, A., Chhel, F., Flamant, G., Ferrière, A., and Thiery, F. (2013). Control of the Flux Distribution on a Solar Tower Receiver Using an Optimized Aiming Point Strategy: Application to THEMIS Solar Tower. Solar Energy 94 (August), 352–366. doi:10.1016/j.solener.2013.02.025
Sánchez-González, A., Rodríguez-Sánchez, M. R., and Santana, D. (2017). Aiming Strategy Model Based on Allowable Flux Densities for Molten Salt central Receivers. Solar Energy 157, 1130–1144. doi:10.1016/j.solener.2015.12.055
Sarfraz, M., Yeung, R., Repole, K., Golob, M., Jeter, S., Al-Ansary, H., et al. (2021). “Proposed Design and Integration of 1.3 MWe Pre-commercial Demonstration Particle Heating Receiver Based Concentrating Solar Power Plant,” in ASME 2021 15th International Conference on Energy Sustainability, Virtual, Online, June 16–18, 2021 (American Society of Mechanical Engineers). doi:10.1115/ES2021-62529
Schwarzbözl, P., Pitz-Paal, R., and Schmitz, M. (2009). “Visual HFLCAL - A Software Tool for Layout and Optimisation of Heliostat Fields,” in Proceedings of the SolarPACES 2009, Berlin, Germany, September 15–18, 2009, September 2009, 15–18.
United Nations (2015). “Adoption of the Paris Agreement,” in Conference of the Parties on Its Twenty-First Session 21932, Paris, France, November 30–December 11, 2015. Available at: http://unfccc.int/resource/docs/2015/cop21/eng/l09r01.pdf.
Vant-Hull, L. L. (2002). The Role of "Allowable Flux Density" in the Design and Operation of Molten-Salt Solar Central ReceiversThe Role of “Allowable Flux Density” in the Design and Operation of Molten-Salt Solar Central Receivers. ASME. J. Sol. Energ. Eng. May 124 (2), 165–169. doi:10.1115/1.1464124
Wagner, M. J., and Wendelin, T. (2018). SolarPILOT: A Power tower Solar Field Layout and Characterization Tool. Solar Energy 171, 185–196. doi:10.1016/j.solener.2018.06.063
Wang, W., Shuai, Y., Guene Lougou, B., and Jiang, B. (2021). Thermal Performance Analysis of Free-Falling Solar Particle Receiver and Heat Transfer Modelling of Multiple Particles. Appl. Therm. Eng. 187, 116567. doi:10.1016/j.applthermaleng.2021.116567
Wendelin, T., and Wagner, M. J. (2018). SolTrace Open-Source Software Project: github.com/NREL/SolTrace. Golden, Colorado: National Renewable Energy Laboratory.
Xie, X., Xu, H., Gan, D., Ni, M., Yan, J., Cen, K., et al. (2022). A Sliding-Bed Particle Solar Receiver with Controlling Particle Flow Velocity for High-Temperature thermal Power Generation. Renew. Energ. 183, 41–50. doi:10.1016/j.renene.2021.10.083
Zhang, Q., Li, X., Chang, C., Wang, Z., and Liu, H. (2013). An Experimental Study: Thermal Performance of Molten Salt Cavity Receivers. Appl. Therm. Eng. 50 (Issue 1), 334–341. doi:10.1016/j.applthermaleng.2012.07.028
Keywords: concentrating solar power, particle heating receiver, heliostat, solar flux distribution, multi-aiming strategy
Citation: El-Leathy A, Al-Ansary H, Danish SN, Alsuhaibani A and Alswaiyd A (2022) An Investigation of the Optimum Solar Flux Distribution on a Large-Scale Particle Heating Receiver. Front. Energy Res. 10:823448. doi: 10.3389/fenrg.2022.823448
Received: 27 November 2021; Accepted: 19 January 2022;
Published: 18 February 2022.
Edited by:
Loreto Valenzuela, Medioambientales y Tecnológicas, SpainReviewed by:
Dawei Liang, Universidade NOVA de Lisboa, PortugalAurelio González-Pardo, Medioambientales y Tecnológicas, Spain
Copyright © 2022 El-Leathy, Al-Ansary, Danish, Alsuhaibani and Alswaiyd. This is an open-access article distributed under the terms of the Creative Commons Attribution License (CC BY). The use, distribution or reproduction in other forums is permitted, provided the original author(s) and the copyright owner(s) are credited and that the original publication in this journal is cited, in accordance with accepted academic practice. No use, distribution or reproduction is permitted which does not comply with these terms.
*Correspondence: Hany Al-Ansary, mailto:hansary@ksu.edu.sa